WATCAT: a tale of wide-angle tailed radio galaxies
We present a catalog of 47 wide-angle tailed radio galaxies (WATs), the WATCAT; these galaxies were selected by combining observations from the National Radio Astronomy Observatory/Very Large Array Sky Survey (NVSS), the Faint Images of the Radio Sky at Twenty-Centimeters (FIRST), and the Sloan Digital Sky Survey (SDSS), and mainly built including a radio morphological classification. We included in the catalog only radio sources showing two-sided jets with two clear “warmspots” (i.e., jet knots as bright as 20% of the nucleus) lying on the opposite side of the radio core, and having classical extended emission resembling a plume beyond them. The catalog is limited to redshifts , and lists only sources with radio emission extended beyond 30 kpc from the host galaxy. We found that host galaxies of WATCAT sources are all luminous (), red early-type galaxies with black hole masses in the range M M⊙. The spectroscopic classification indicates that they are all low-excitation galaxies (LEGs). Comparing WAT multifrequency properties with those of FR I and FR II radio galaxies at the same redshifts, we conclude that WATs show multifrequency properties remarkably similar to FR I radio galaxies, having radio power of typical FR IIs.
Key Words.:
galaxies: active – galaxies: jets – radio continuum: galaxies1 Introduction
We are now living in the golden age of wide and deep multifrequency surveys. This is extremely useful for investigating the properties (see, e.g., Kauffmann et al., 2003), nature, cosmological evolution (see, e.g., Brandt and LSST AGN Science Collaboration, 2006; Best et al., 2014; Kaiser and Best, 2007), and environments (see, e.g., Morganti et al., 1988; Croston et al., 2018; Hardcastle et al., 2018) of several classes of extragalactic sources, such as radio-loud active galaxies, having a low sky density (i.e., a small number of sources per square degree). Thus, we recently embarked on a project whose goal is to create homogeneous and complete catalogs of different classes of radio galaxies, uniformly selected on the basis of their radio morphological properties (Fanaroff & Riley, 1974). The first three catalogs, restricted to the local Universe (at ) and covering the major classes of radio galaxies (namely FR I, FR II, and FR 0) have been recently published (Capetti et al., 2017a, b; Baldi et al., 2018), while the present work focuses again on a class of radio galaxies with extended radio emission beyond the host galaxy.
Both FR I and FR II radio galaxy catalogs were created on the basis of the radio morphological classification scheme of extragalactic radio sources with large-scale structures introduced by Fanaroff & Riley (1974). Thus, radio galaxies can be broadly divided in two main classes, on the basis of the ratio of distance between the regions of highest radio surface brightness on opposite sides of the central nucleus (associated with the host galaxy) to the total extent of the source, up to the lowest brightness contour in the radio images at 1.4 GHz. Edge-darkened radio sources are classified as FR Is, while edge-brightened sources as FR IIs. Then, in the FR0CAT, we presented a sample of 108 “compact” radio sources, called FR 0s (Baldi et al., 2015), with 0.05 and having a radio size 5 kpc, which mostly appear unresolved up to 0.2” and occasionally show resolved jets (Baldi et al., 2019). These also show the typical optical spectrum of low-excitation radio galaxies.
Here we present the fourth catalog in the series, which focuses on an intermediate class of radio galaxies between FR Is and FR IIs, having extended radio emission well beyond the optical profiles of their host galaxies: the Wide-Angle Tailed radio galaxies catalog.

Observed for the first time with the National Radio Astronomy Observatory (NRAO) interferometer at 2.7 GHz during a survey of sources in the Abell clusters (Owen & Rudnick, 1976), wide-angle tailed radio galaxies (hereafter WATs) were given this name because their radio morphology presents bright hotspots (called “warmspots”) closer to their radio core with respect to FR IIs and with extended radio plumes beyond them (O’Donoghue et al., 1990). Leahy (1993) defines WATs as a class of sources that initially have well-collimated jets on a kiloparsec scale and that suddenly flare into diffuse plumes, which may be significantly bent.
Owen & Rudnick (1976), noting that this source class has higher radio luminosity than the radio sources with narrower tails (also known as head-tailed radio galaxies), proposed that their curved radio structure could be due to the motion of the host galaxy through the intergalactic medium (IGM), moving more slowly than the head-tailed sources. This scenario is supported by the fact that WATs are generally associated with more dominant cluster galaxies (Bird, 1994; Pinkney, 1995).
Sakelliou & Merrifield (2000) investigated the WAT radio structure using a sample selected from those lying in Abell galaxy clusters. These authors suggested that because the Universe evolves hierarchically with galaxy clusters forming through mergers of groups, WAT bent or curved tails are due to the ram pressure that originated in the merging processes.
In FR I showing twin-jet tails (i.e., double sided), their well-collimated jet flow undergoes significant bulk deceleration on scales of a few kpc (Feretti et al., 1999; Mukherjee et al., 2013a, b; Bodo et al., 2013; Laing and Bridle, 2014; Massaglia et al., 2016, 2018), slowing down from relativistic speeds to transonic or subsonic regime with respect to the external medium (Laing and Bridle, 2002; Bicknell, 1994). This forms a jet that may in some cases make a smooth transition into a plume similar to those observed in WATs (Leahy, 1993). The inner jets of FR Is are often also strong sources of X-ray emission (Hardcastle et al., 2001, 2003). WAT jets should be similar, and so we could expect to detect synchrotron X-ray emission arising from knots and warmspots (see also Massaro et al., 2011). It is worth noting that for all WATs being observed in the X-rays, as for FR I jets, the regions where their jets decelerate are coupled with high-energy particle acceleration that yield to X-ray synchrotron emission (e.g., Hardcastle et al. 2001; Worrall et al. 2001; Hardcastle et al. 2002). On the other hand, WAT plumes should not be similar to regions at the edges of FR I radio structures since according to the model outlined by Hardcastle and Sakelliou (2004) in WATs the jet deceleration in the plumes takes place at a single discrete location, which relates the termination length (defined as the mean of the two linear distances between the core and what we have called warmspots located at the base of the plume) to cluster richness. The authors, assuming intrinsic symmetry of the jets and jet/counterjet luminosity ratios related to relativistic beaming effects, obtained a constraint on the beaming speed found to be weakly relativistic (=0.3). Earlier, for a sample of 11 WATs, O’Donoghue et al. (1993) used their radio surface brightness and their spectral energy distributions to model the flow fields and the bending dynamics of the sources, and with the sidedness of the jets (side-to-side ratio of their luminosity) constrained the flow velocity. According to their results, the initial jet velocity in these galaxies is unlikely to be greater than 0.2. The measured surface brightness ratios have been interpreted in the light of Monte Carlo simulations by O’Dea (1984) that set an upper limit of 0.2 to the bulk velocity of the beams in narrow-angle tailed (NAT) radio galaxies. Jetha et al. (2005) assume that the WATs analysed in their work lie on the plane of the sky, and find that the speed of fluid flow through the jets is again mildly relativistic, having approximately values of 0.3. (estimated from jet/counterjet ratios by Hardcastle and Sakelliou 2004). Jets in WATs do not appear significantly brighter than the counterjet, as one would expect from relativistic Doppler boosting. In a following work, Jetha et al. (2006) measuring the distribution of the jet-sidedness ratios for the same WAT sample and assuming jets are beamed, obtained jet speeds in the range (0.3–0.7), in agreement with previous results. Giovannini (2004) showed that multi-epoch studies of radio-loud AGNs allow us to measure directly the apparent jet pattern velocity, which can be used to derive constraints on the intrinsic velocity of the pattern flow and the jet orientation with respect to the line of sight. Then assuming that jets are intrinsically symmetric, the jet/counterjet brightness ratio and the core dominance (comparison between the expected intrinsic core radio power, derived from the unboosted total radio power, and the observed core radio power) can also be used to constrain the jet bulk velocity and orientation with respect to the line of sight. As pointed out by Hardcastle et al. (2005), similarly to FR IIs, WAT jets remain weakly or mildly relativistic and well collimated until they undergo rapid deceleration at a distance of few tens of kpc from the nucleus, creating the so-called warmspots, the main feature of their radio morphology.
Best et al. (2005), Baldi & Capetti (2010), and Best & Heckman (2012), to name recent examples, have analyzed properties of low redshift radio emitting AGNs using multifrequency information available thanks to the National Radio Astronomy Observatory/Very Large Array Sky Survey (NVSS), the Faint Images of the Radio Sky at Twenty-Centimeters (FIRST), and the Sloan Digital Sky Survey (SDSS). Here we just include radio morphological information to create the first catalog of WATs in the local Universe (hereafter the WATCAT). The catalog we have built is the first to have such a high level of completeness, and there are no other WATs catalogs with this population selected with such strict criteria. WATs present a number of interesting problems and open questions, and tackling them can help us achieve a better understanding of the dynamics of extragalactic radio sources and their interaction with the intergalactic medium (IGM).
This paper is organized as follows. In Sect. 2 we describe the selection criteria of sources included in the WATCAT; the radio and optical properties of the selected sources are then presented in Sect. 3. A comparison with FR I and FR II radio galaxies is discussed in Sect. 5. Section 6 is dedicated to our summary and conclusions.
A flat cosmology with , , and (Planck Collaboration et al., 2016) has been adopted throughout the paper. For our numerical results, we use c.g.s. units unless stated otherwise. Spectral indices are defined by the usual convention on the flux density, . SDSS magnitudes are in the AB system and are corrected for Galactic extinction. WISE magnitudes are instead in the Vega system and are not corrected for extinction since (as shown by, e.g., D’Abrusco et al. 2014) such correction affects mainly the magnitude at 3.4 m of sources lying at low Galactic latitudes (and by less than 3%). Not all WATs are detected in all three WISE bands centered at 3.4, 4.6, and 12 m. The detection rate is 78% at 12m, while it is 100% at 3.4 and 4.6 m.
2 Sample selection
We searched for WATs in the sample of 18,286 radio sources built by Best & Heckman, 2012 (hereafter BH12) by limiting our search to sources classified as active nuclei (AGN) on the basis of their radio emission. The BH12 catalog was created on the basis of observations available in the archive of the SDSS (DR7; Abazajian et al. 2009),111http://www.mpa-garching.mpg.de/SDSS/. and combined with those of NVSS (Condon et al. 1998) and FIRST (Becker et al. 1995), having the same footprint of the SDSS. For the radio data sets a radio flux density threshold of 5 mJy in the NVSS was adopted and the BH12 sample was also cross-matched with optical spectroscopic catalogs built by groups at the Max Planck Institute for Astrophysics and Johns Hopkins University (Brinchmann et al., 2004; Tremonti et al., 2004).
As was done in previous catalogs of FR Is and FR IIs, we selected 3,357 sources with redshift . Then we visually inspected all FIRST images of each of these sources and selected only those whose radio emission extended beyond 30 kpc from the center of the optical host galaxy, at the sensitivity of the FIRST. This cut led to a selected sample of 741 sources. We adopted a threshold of 30 kpc, mainly due to the limited resolution of the FIRST survey, as an estimate of the maximum size of the host galaxies. At redshift this distance corresponds to 114, thus ensuring that all 741 selected sources are well resolved with the 5 resolution of the FIRST images. This allowed us to properly explore their morphology.
We chose a reference surface brightness level of 0.45 mJy/beam, corresponding to about three times the typical rms of FIRST images, at . As performed in previous radio galaxy catalogs, we also corrected the radio surface brightness for the cosmological dimming and we applied a correction by assuming a spectral index of 0.7, typical of lobes and plumes of radio galaxies.
Then we selected WAT sources out of 741 objects on the basis of their radio morphology in FIRST images, considering strict criteria. Thus we included in the final sample only those radio sources showing two-sided jets with two clear warmspots (i.e., jet knots as bright as 20% of the nucleus) lying on the opposite side of the radio core and having classical extended emission resembling a plume beyond. Four authors performed this analysis independently and only the sources for which there was agreement by at least three of us were included in the final sample. The final catalog of WATs lists 47 sources, the first of this kind, homogenous at low redshifts.
In Fig. 1 we present the radio image with surface brightness contours from FIRST, NVSS, and TIFR Giant Metrewave Radio Telescope (GMRT) Sky Survey (TGSS) radio maps of a typical WATCAT source. Images of all sources belonging to the WATCAT are available in the Appendix, while their main properties (SDSS name, redshift, radio luminosity at 1.4 GHz and optical parameters) are listed in Table 2. For each WAT, we provide both radio and [OIII] luminosities.
Then given the measurements of the velocity dispersions, available in the SDSS database, we also computed their black hole masses MBH adopting the relation MBH of Tremaine et al. (2002). The masses range between MM⊙, and their distribution peaks at M⊙. The uncertainty on the MBH, on the order of a factor of 2, is mainly dominated by the dispersion of the correlation rather than by the uncertainty on measurements.
According to Montero-Dorta & Prada (2009) and the redshift completeness of the SDSS, the WATCAT, like the FRICAT and FRIICAT, is statistically complete at a level of 90% in the optical band, whereas this extremely low level of incompleteness is only due to a random loss of 10% of the potential spectroscopic targets (see, e.g., Zehavi et al., 2002). Therefore, there is the possibility that radio sources featuring extended radio emission below the 3 threshold in the FIRST images were missed.
On the other hand, to estimate the completeness of our catalog at radio frequencies, we re-scaled the luminosities of all sources in the range between 0.05 and 0.09 computing their flux densities at 1.4 GHz and randomly assigning redshifts of sources in the last bin (see Fig. 2). Re-scaled flux densities all lie above the NVSS threshold. We also verified that the number of sources in the last bin is consistent with the expected number extrapolated from the scenario normalized to the first four bins. We found a good agreement, as shown in Fig. 2. Consequently, we can assert that our sample is statistically complete in the radio band within the range considered in our selection. We measured the jet sidedness values for our sample, finding a value that is generally close to unity (as remarked in O’Donoghue et al. 1993) consistent with previous literature results.

Finally, we note that the BH12 catalog includes sources whose NVSS flux density at 1.4 GHz is higher than 5 mJy, while our selection is mainly based on the surface brightness distribution of FIRST images.
3 Multifrequency properties of WATs and their host galaxies
3.1 WAT hosts: infrared and optical properties
All optical spectra obtained from the SDSS database were inspected. We discovered that all sources minus one listed in the WATCAT are classified as low-excitation galaxies (LEGs), in agreement with the classification reported by Best & Heckman (2012) based on the ratios of the optical emission lines in their SDSS spectra. The only exception is SDSS J155343.59+234825.4, being a high excitation galaxy (HEG). Given the high level of completeness of the WATCAT this is the first time that is proven on a statistical basis for this source population that the majority of WATs is LEG. The logarithm of [OIII] line luminosities spans a range between 38.9 and 40.4 erg/s, with a mean value of 39.72 erg/s in log scale. However, it is worth noting that for four sources (SDSS J144904.27+025802.7, SDSS J141927.23+233810.2, SDSS J222455.24-002302.3, SDSS J155343.59+234825.4) we were not able to retrieve information regarding the [OIII] line luminosity because this measurement was not present in the SDSS database. Thanks to the multifrequency observations available, as done in previous radio galaxy catalogs, we used various diagnostics to provide a complete overview on the morphological and spectroscopic classification of the WAT host galaxies. The distribution of absolute magnitude of the WATCAT host galaxies spans the range with a distribution peaking at (see Fig. 3).

The distribution of the concentration index , defined as the ratio between the radii including 90% and 50% of the light in the -band was obtained for each source directly from the SDSS database. The distribution is consistent with WATs being hosted in early-type galaxies (ETGs). In general ETGs show higher values of than late-type galaxies (LTGs). The thresholds adopted to distinguish between ETGs and LTGs are the same used for the FRICAT and FRIICAT catalogs (see Strateva et al., 2001; Nakamura et al., 2003; Shen et al., 2003; Kauffmann et al., 2003; Bell et al., 2003; Bernardi et al., 2010, for more details).
We compared values with those of the Dn(4000) spectroscopic index, defined as the ratio of the flux density measured on the red side of the Ca II break (4000–4100 Å) to that on the blue side (3850–3950 Å) (Balogh et al., 1999). Low redshift () red galaxies show Dn(4000), which is a value that decreases to for galaxies (Capetti & Raiteri, 2015). The presence of young stars or of nonstellar emission reduces the Dn(4000) index (Hamilton, 1985).


In Fig. 4 we show the concentration index versus the Dn(4000) index (left panel) and versus MBH (right panel) for the WATCAT, FRICAT, and FRIICAT sources. The vast majority of the WAT host galaxies lies in the region of high and Dn(4000) values, indicating that they are all typical red ETGs. We performed a two-dimensional Kolmogorov-Smirnov (KS) test (Peacock 1983; Fasano and Franceschini 1987) and we found that compairing WATs with FR Is and FR IIs we obtain (1-p-value) 10-16, which implies that the two samples (WATs vs. FR Is and WATs vs. FR IIs) are not significantly different. There are only two exceptions, namely SDSS J095716.41+190651.2 and SDSS J135315.36+550648.2, both of which have low values of . The distribution of black-hole masses (see Fig. 5) shows that WATs, FR Is, and FR II peak at the same value, but the FR IIs extend to lower mass values.

We also considered their color while studying the properties of the WATCAT host galaxies. This allowed us to avoid uncertainties in the estimate of the Dn(4000) due to SDSS spectroscopic aperture, being on the order of 3 in diameter. In Fig. 6 we show the color versus the absolute -band magnitude of the hosts. WATs are all located above the line separating red and blue ETGs (consistently with their distribution), thus following the same FR I trend (Schawinski et al., 2009). The fraction of blue ETGs decreases with increasing luminosity and these ETGs disappear for . The lack of blue ETGs among the WATCAT host galaxies is relevant.
The distributions of WATs and FR IIs appear to be marginally different at a confidence level of 93% (p-value of 0.072). The same test performed for the Dn(4000) index gave us a p-value of 0.58 for WATs and FR Is and 0.010 for WATs and FR II s. For the sake of clarity, in all our plots the uncertainties on optical parameters are not shown; however, the average uncertainties are 0.08, 0.03, and 0.004 on , Dn(4000), and , respectively, and 9 on .

As the last step, we cross-matched our WATCAT with the latest release of the Wide-field Infrared Survey Explorer (WISE) source catalog (AllWISE) retrieving mid-IR magnitudes. The associations between the WATCAT and the WISE catalog were computed adopting a 33 angular separation, which corresponds to the combination of the typical positional uncertainty of the WISE all sky survey (Wright et al., 2010) and that of the FIRST (D’Abrusco et al., 2014). In Fig. 7 we show a comparison of the mid-IR colors of WATCAT , FRICAT, and FRIICAT sources.
WATCAT sources appear to have WISE colors mostly dominated by their host galaxies (they fall in the same region as elliptical galaxies; Wright et al. 2010) and not contaminated by the nonthermal emission of their jets, as for example occurs in blazars (D’Abrusco et al., 2012; Massaro et al., 2011; Massaro & D’Abrusco, 2016). Only one source (SDSS J155343.59+234825.4), classified as a HEG, has and it is located at the onset of the sequence defined by the more luminous objects such as blazars and flat spectrum radio quasars (Massaro et al., 2012). Thus, the WISE infrared colors further support the idea that WATs are hosted in “passive” ETGs.

3.2 Radio properties
In Fig. 8, we show the distribution of the NVSS radio luminosity at 1.4 GHz (Lν) for all the sources belonging to the WATCAT in comparison with FR I and FR II listed in Capetti et al. (2017a, b). The distribution of radio luminosity at 1.4 GHz of the WATCAT covers the range L1.4 = Lr = . The Fanaroff & Riley (1974) separation between FR Is and FR IIs translates, with our adopted cosmology and by assuming a spectral index of 0.7 between 178 MHz and 1.4 GHz, into L .

The distribution of the NVSS radio luminosity at 1.4 GHz clearly shows that WATs are on average more powerful than FR Is and have radio luminosity similar to classical FR II radio galaxies. According to a simple KS test we found WATs and FR IIs are indistinguishable, while for the comparison between WATs and FR Is these two populations differ within a confidence level of 10-15.
We measured the angular separation between the peaks of surface brightness of two warmspots for each WAT on the FIRST radio maps at 1.4 GHz. Then we converted the angular separation into physical distance in kpc, thus defining their linear size: dw. In Fig. 9 we show the relation between the dw and the WAT radio power. The low number of WATs, coupled with functional biases in the relations used to compute dw and the radio power, prevents us from evaluating a correlation between these two parameters; however, there is a hint that high radio power WATs do not produce warmspots closer to the radio core with respect to low power ones.

4 Discussion
Here we discuss the multifrequency properties of the WATCAT in comparison with both the FR Is and FR IIs listed in the FRICAT and FRIICAT.
The host galaxies of WATCAT sources are remarkably uniform, being all luminous red ETGs and spectroscopically classified as LEGs, as occurs for the FR Is. On the other hand, their radio luminosity at 1.4 GHz is generally higher than that of FR Is, regardless of the value of L[OIII].
A KS test to compare the -band absolute magnitude distributions of WATs, FR Is, and FR IIs was performed. According to our analysis, comparing WATs with both FR Is and FR IIs we found that they do not belong to the same parent population within a confidence level of 99%. Our result, and its possible interpretation, will be investigated in future works on the large-scale environment of the whole sample.
In 1974 Fanaroff & Riley observed that all sources in their original sample with luminosity measured at 178 MHz lower than 21025 W/Hz/sr (assuming a Hubble constant of 50 Mpc-1) were classified as FR Is, while more powerful radio objects all presented the FR II morphology (Fanaroff & Riley, 1974). When sources belonging to the two FR classes are plotted in a radio luminosity versus optical magnitude plane where the radio power is estimated at low radio frequencies (i.e., at hundreds of MHz), this dichotomy between the two FR classes is fairly sharp (see, e.g, Ledlow & Owen 1996); however, Capetti et al. (2017a, b), showed that when classifying radio galaxies homogeneously on the basis of their morphology at 1.4 GHz and including low power FR IIs, this neat separation appears to be only a selection effect.
As previously carried out for the FRICAT and FRIICAT samples, we built a re-scaled diagram plotting the radio power versus the optical magnitudes for our WATs. The bulk of WATCAT sources lie below the boundary between FR I and FR II radio galaxies as shown in Fig.10, mostly lying in the region populated by FR I sources. We note that the dividing line between the two main classes of radio galaxies highlighted by Ledlow and Owen (1976) was appropriately shifted, including a correction of 0.12 mag to the magnitude of the host galaxies and a correction of 0.22 mag to convert the Cousin magnitude system into the SDSS system (Fukugita et al., 1996). The location of WATs in this radio power versus optical magnitude confirms that the more powerful WATs tend to be associated with more massive galaxies.


As previously shown, classical FR Is belonging to the 3C sample show a positive trend between the [OIII] emission line and radio luminosity with a slope consistent with unity (e.g., Buttiglione et al. 2010). This indicates that a constant fraction of the AGN power, as measured from the L[OIII], is then converted into radio power. Buttiglione et al. (2010) show that the same result, although with a different normalization, is found when considering the FR II radio galaxies again, selected from the 3C sample.
No neat trend or correlation between L1.4 and L[OIII] can be seen for WATs, as occurs for FR Is (see Figure 11), where at a given emission line luminosity radio power spans two orders of magnitude. Similarly to 3C radio galaxies, it appears that no source has a L1.4/L[OIII] ratio exceeding 100, producing the scarcely populated region in the bottom right portion of this plot. On the other hand, several WATs show values of L1.4/L[OIII] below the 0.5 threshold. The broad distribution of the L1.4/L[OIII] ratio suggests that a broad range AGN bolometric power is then converted into radio emission. Furthermore, radio luminosity increases, not surprisingly, when the size of the radio source increases. Finally, as occurred for FR Is, we note that the spectroscopic and host properties of the WAT host galaxies rule out the possibility of having the [OIII] emission line contaminated by star formation, otherwise we would have been able to observe a trend, if present, between radio power and emission line luminosity of the [OIII].
5 Summary and conclusions
We built a low redshift () catalog of 47 WATs called the WATCAT. This sample was selected out of the Best & Heckman (2012) catalog, built combining observations available in the SDSS, NVSS, and FIRST surveys, but including a radio morphological classification. WATs are radio sources showing two-sided jets with two clear warmspots (i.e., jet knots as bright as 20% of the nucleus) lying on the opposite side of the radio core, and having classical extended emission resembling a plume beyond them. The WAT classification is purely morphological and is based on the visual inspection of FIRST radio images at 1.4 GHz. We included sources in which the radio emission extends beyond 30 kpc from the position of their optical host galaxy. Our final catalog is also restricted to redshift .
Our main results are listed below:
-
•
Using NVSS radio observations at 1.4 GHz, we find that WATs tend to be more radio luminous than FR Is, and more similar to FR IIs;
-
•
WATCAT host galaxies are remarkably homogeneous. They do not show significant differences in their optical and infrared colors with respect to the general population of massive ETGs, and the presence of an active nucleus (and its level of activity) does not appear to affect their host galaxies;
-
•
SDSS optical spectra of WATCAT sources proved that these sources are all classified as low-excitation radio galaxies (LEGs). FR Is are all classified as LEGs, while FR IIs can be LEGs or high excitation radio galaxies (HEGs). This again shows the similar behavior between WATs and FR Is;
-
•
versus Lν measured at 1.4 GHz showed that WATs follow the same behavior of FR II HEGs;
-
•
using infrared data collected by WISE, WAT host galaxies appear to be similar to normal elliptical galaxies, with IR colors similar to those of FR Is, lacking significant contribution from active star formation;
-
•
values of the absolute magnitude in the -band () are also in agreement that WATs, as reported in literature, could be the brightest cluster galaxy when they reside therein;
-
•
comparing the distribution of the concentration index () and the dispersion index Dn(4000), we discovered that WATs, like FR Is, tend not to be extremely blue and lack signatures of active star formation, which are sometimes found in FR IIs;
-
•
from the comparison between the radio luminosity at 1.4 GHz obtained from NVSS and from the luminosity of the [OIII] emission line present in WAT optical spectra, we found that our selected WATs do not follow any trend between L1.4 and L[OIII], whose [OIII] emission line luminosity is even lower than expected for a given value of the radio power at 1.4 GHz.
In summary, we conclude that WATs show multifrequency properties remarkably similar to FR I radio galaxies, being more powerful at radio frequencies and similar to typical FR IIs.
References
- Abazajian et al. (2009) Abazajian, K. N., Adelman-McCarthy, J. K., Agüeros, M. A., et al. 2009, ApJS, 182, 543
- Baldi & Capetti (2010) Baldi, R. D. & Capetti, A. 2010, A&A, 519, A48+
- Baldi et al. (2015) Baldi, R. D., Capetti, A., Giovannini, G. 2015, A&A, 576, A38.
- Baldi et al. (2018) Baldi, R. D., Capetti, A., Massaro, F. 2018, A& A 609, A1.
- Baldi et al. (2019) Baldi, R. D., Capetti, A., Giovannini, G. 2019. High-resolution VLA observations of FR0 radio galaxies: the properties and nature of compact radio sources. Monthly Notices of the Royal Astronomical Society 482, 2294.
- Balogh et al. (1999) Balogh, M. L., Morris, S. L., Yee, H. K. C., Carlberg, R. G., & Ellingson, E. 1999, ApJ, 527, 54
- Becker et al. (1995) Becker, R. H., White, R. L., & Helfand, D. J. 1995, ApJ, 450, 559
- Bell et al. (2003) Bell, E. F., McIntosh, D. H., Katz, N., & Weinberg, M. D. 2003, ApJS, 149, 289
- Bernardi et al. (2010) Bernardi, M., Shankar, F., Hyde, J. B., et al. 2010, MNRAS, 404, 2087
- Best & Heckman (2012) Best, P. N. & Heckman, T. M. 2012, MNRAS, 421, 1569
- Best et al. (2005) Best, P. N., Kauffmann, G., Heckman, T. M., et al. 2005, MNRAS, 362, 25
- Best et al. (2014) Best, P. N., Ker, L. M., Simpson, C., Rigby, E. E., Sabater, J. 2014, MNRAS, 445, 955.
- Bicknell (1994) Bicknell, G. V. 1994, Australian Journal of Physics, 47, 669.
- Brandt and LSST AGN Science Collaboration (2006) Brandt, N., LSST AGN Science Collaboration 2006. AGN Science with the LSST. American Astronomical Society Meeting Abstracts 209, 86.14
- Bird (1994) Bird, C. M. 1994, AJ, 107, 1637.
- Brinchmann et al. (2004) Brinchmann, J., Charlot, S., White, S. D. M., et al. 2004, MNRAS, 351, 1151
- Bodo et al. (2013) Bodo G., Mamatsashvili G., Rossi P., Mignone A., 2013, MNRAS, 434, 3030
- Burns (1981) Burns, J. O. 1981, MNRAS, 195, 523.
- Buttiglione et al. (2010) Buttiglione, S., Capetti, A., Celotti, A., et al. 2010, A&A, 509, A6
- Capetti & Raiteri (2015) Capetti, A. & Raiteri, C. M. 2015, A&A, 580, A73
- Capetti et al. (2017a) Capetti, A., Massaro, F., Baldi, R. D. 2017, A&A 598, A49.
- Capetti et al. (2017b) Capetti, A., Massaro, F., Baldi, R. D. 2017, A&A, 601, A81.
- Condon et al. (1998) Condon, J. J., Cotton, W. D., Greisen, E. W., et al. 1998, AJ, 115, 1693
- Croston et al. (2018) Croston, J. H., and 15 colleagues 2018, ArXiv e-prints arXiv:1811.07949.
- D’Abrusco et al. (2012) D’Abrusco, R., Massaro, F., Ajello, M., et al. 2012, ApJ, 748, 68
- D’Abrusco et al. (2014) D’Abrusco, R., Massaro, F., Paggi, A., et al. 2014, ApJS, 215, 14
- Edge et al. (1959) Edge, D. O., Shakeshaft, J. R., McAdam, W. B., Baldwin, J. E., Archer, S. 1959. A survey of radio sources at a frequency of 159 Mc/s.. Memoirs of the Royal Astronomical Society 68, 37.
- Eilek & Henriksen (1984) Eilek, J. A., Henriksen, R. N. 1984, AJ, 277, 820.
- Fanaroff & Riley (1974) Fanaroff, B. L. & Riley, J. M. 1974, MNRAS, 167, 31P
- Fasano and Franceschini (1987) Fasano, G., Franceschini, A. 1987, MNRAS, 225, 155.
- Feretti et al. (1999) Feretti, L., Perley, R., Giovannini, G., Andernach, H. 1999., Memorie della Societa Astronomica Italiana 70, 129.
- Fukugita et al. (1996) Fukugita, M., Ichikawa, T., Gunn, J. E., et al. 1996, AJ, 111, 1748
- Giovannini et al. (2001) Giovannini, G., Cotton, W. D., Feretti, L., Lara, L., Venturi, T. 2001. ApJ 552, 508.
- Giovannini (2004) Giovannini, G. 2004. Astrophysics and Space Science 293, 1.
- Hamilton (1985) Hamilton, D. 1985, AJ, 297, 371.
- Hardcastle et al. (1998) Hardcastle, M. J., Alexander, P., Pooley, G. G., Riley, J. M. 1998, MNRAS, 296, 445
- Hardcastle et al. (2001) Hardcastle, M. J., Birkinshaw, M., Worrall, D. M. 2001, MNRAS, 323, L17.
- Hardcastle et al. (2002) Hardcastle, M. J., Worrall, D. M., Birkinshaw, M., Laing, R. A., Bridle, A. H. 2002, MNRAS, 334, 182.
- Hardcastle et al. (2003) Hardcastle, M. J., Worrall, D. M., Kraft, R. P., Forman, W. R., Jones, C., Murray, S. S. 2003, ApJ, 593, 169.
- Hardcastle and Sakelliou (2004) Hardcastle, M. J., Sakelliou, I. 2004, MNRAS, 349, 560.
- Hardcastle et al. (2005) Hardcastle, M. J., Sakelliou, I., Worrall, D. M. 2005, MNRAS, 359, 1007.
- Hardcastle et al. (2018) Hardcastle, M. J., and 22 colleagues 2018, arXiv e-prints arXiv:1811.07943.
- Jetha et al. (2005) Jetha, N. N., Sakelliou, I., Hardcastle, M. J., Ponman, T. J., Stevens, I. R. 2005. MNRAS 358, 1394.
- Jetha et al. (2006) Jetha, N. N., Hardcastle, M. J., Sakelliou, I. 2006. MNRAS 368, 609.
- Kaiser and Best (2007) Kaiser, C. R., Best, P. N. 2007, MNRAS, 381, 1548.
- Kauffmann et al. (2003) Kauffmann, G., Heckman, T. M., White, S. D. M., et al. 2003, MNRAS, 341, 33
- Laing and Bridle (2002) Laing, R. A., Bridle, A. H. 2002, MNRAS, 336, 1161.
- Laing and Bridle (2014) Laing, R. A., Bridle, A. H. 2014, MNRAS, 437, 3405.
- Leahy (1993) Leahy, J. P. 1993. DRAGNs. Jets in Extragalactic Radio Sources 1.
- Ledlow & Owen (1996) Ledlow, M. J. & Owen, F. N. 1996, AJ, 112, 9
- Massaglia et al. (2016) Massaglia, S., Bodo, G., Rossi, P., Capetti, S., Mignone, A. 2016, A&A, 596, A12.
- Massaglia et al. (2018) Massaglia, S., Bodo, G., Rossi, P., Capetti, S., Mignone, A. 2018, ArXiv e-prints arXiv:1812.00657.
- Massaro et al. (2011) Massaro, F., D’Abrusco, R., Ajello, M., Grindlay, J. E., & Smith, H. A. 2011, ApJ, 740, L48
- Massaro & D’Abrusco (2016) Massaro, F., D’Abrusco, R. 2016, ApJ, 827, 67.
- Massaro et al. (2011) Massaro, F., Harris, D. E., Cheung, C. C. 2011, ApJSS, 197, 24.
- Massaro et al. (2012) Massaro, F., D’Abrusco, R., Tosti, G., et al. 2012, ApJ, 750, 138
- Montero-Dorta & Prada (2009) Montero-Dorta, A. D. & Prada, F. 2009, MNRAS, 399, 1106
- Morganti et al. (1988) Morganti, R., Fanti, R., Gioia, I. M., Harris, D. E., Parma, P., de Ruiter, H. 1988, A&A, 189, 11.
- Mukherjee et al. (2013a) Mukherjee, D., Bhattacharya, D., Mignone, A. 2013, MNRAS, 430, 1976.
- Mukherjee et al. (2013b) Mukherjee, D., Bhattacharya, D., Mignone, A. 2013, MNRAS, 435, 718
- Nakamura et al. (2003) Nakamura, O., Fukugita, M., Yasuda, N., et al. 2003, AJ, 125, 1682
- O’Dea (1984) O’Dea, Christopher P., ”Morphology and energetics of narrow angle tail radio sources.” (1984). Doctoral Dissertations 1896 - February 2014.
- O’Donoghue et al. (1990) O’Donoghue, A. A., Owen, F. N., Eilek, J. A. 1990, ApJS, 72, 75.
- O’Donoghue et al. (1993) O’Donoghue, A. A., Eilek, J. A., Owen, F. N. 1993, ApJ 408, 428.
- Owen & Rudnick (1976) Owen, F. N. & Rudnick, L. 1976, ApJ, 205, L1
- Peacock (1983) Peacock, J. A. 1983, MNRAS, 202, 615.
- Pinkney (1995) Pinkney, J. 1995. The Dynamics of Galaxy Clusters Containing Wide - Tailed Radio Sources.. Ph.D. Thesis.
- Planck Collaboration et al. (2016) Planck Collaboration, Ade, P. A. R., Aghanim, N., et al. 2016, A&A, 594, A13
- Rudnick & Owen (1977) Rudnick, L. & Owen, F. N. 1977, AJ, 82, 1
- Sakelliou & Merrifield (2000) Sakelliou, I., Merrifield, M. R. 2000, MNRAS, 311, 649.
- Schawinski et al. (2009) Schawinski, K., Lintott, C., Thomas, D., et al. 2009, MNRAS, 396, 818
- Shen et al. (2003) Shen, S., Mo, H. J., White, S. D. M., et al. 2003, MNRAS, 343, 978
- Strateva et al. (2001) Strateva, I., Ivezić, Ž., Knapp, G. R., et al. 2001, AJ, 122, 1861
- Tremaine et al. (2002) Tremaine, S., Gebhardt, K., Bender, R., et al. 2002, ApJ, 574, 740
- Tremonti et al. (2004) Tremonti, C. A., Heckman, T. M., Kauffmann, G., et al. 2004, ApJ, 613, 898
- Worrall et al. (2001) Worrall, D. M., Birkinshaw, M., Hardcastle, M. J. 2001, MNRAS, 326, L7.
- Wright et al. (2010) Wright, E. L., Eisenhardt, P. R. M., Mainzer, A. K., et al. 2010, AJ, 140, 1868
- Zehavi et al. (2002) Zehavi, I., Blanton, M. R., Frieman, J. A., et al. 2002, ApJ, 571, 172
- Zirbel & Baum (1995) Zirbel, E. L. & Baum, S. A. 1995, ApJ, 448, 521
Acknowledgements.
We thank the referee, Prof. S. Massaglia, for a careful reading of our manuscript and many helpful comments that led to improvements in the paper. This work is supported by the “Departments of Excellence 2018 - 2022” Grant awarded by the Italian Ministry of Education, University and Research (MIUR) (L. 232/2016). This research has made use of resources provided by the Compagnia di San Paolo for the grant awarded on the BLENV project (S1618Ł1_MASF_01) and by the Ministry of Education, Universities and Research for the grant MASF_FFABR_17_01. This investigation is supported by the National Aeronautics and Space Administration (NASA) grants GO4-15096X, AR6-17012X, and GO6-17081X. F.M. acknowledges financial contribution from the agreement ASI-INAF n.2017-14-H.0 A.P. acknowledges financial support from the Consorzio Interuniversitario per la fisica Spaziale (CFIS) under the agreement related to the grant MASF_CONTR_FIN_18_02. Part of this work is based on the NVSS (NRAO VLA Sky Survey): The National Radio Astronomy Observatory is operated by Associated Universities, Inc., under contract with the National Science Foundation. This publication makes use of data products from the Wide-field Infrared Survey Explorer, which is a joint project of the University of California, Los Angeles, and the Jet Propulsion Laboratory/California Institute of Technology, funded by the National Aeronautics and Space Administration. This research made use of the NASA/ IPAC Infrared Science Archive and Extragalactic Database (NED), which are operated by the Jet Propulsion Laboratory, California Institute of Technology, under contract with the National Aeronautics and Space Administration. Funding for SDSS-III has been provided by the Alfred P. Sloan Foundation, the Participating Institutions, the National Science Foundation, and the U.S. Department of Energy Office of Science. The SDSS-III web site is http://www.sdss3.org/. SDSS-III is managed by the Astrophysical Research Consortium for the Participating Institutions of the SDSS-III Collaboration, including the University of Arizona, the Brazilian Participation Group, Brookhaven National Laboratory, University of Cambridge, Carnegie Mellon University, University of Florida, the French Participation Group, the German Participation Group, Harvard University, the Instituto de Astrofisica de Canarias, the Michigan State/Notre Dame/JINA Participation Group, Johns Hopkins University, Lawrence Berkeley National Laboratory, the Max Planck Institute for Astrophysics, the Max Planck Institute for Extraterrestrial Physics, New Mexico State University, New York University, The Ohio State University, Pennsylvania State University, University of Portsmouth, Princeton University, the Spanish Participation Group, University of Tokyo, University of Utah, Vanderbilt University, University of Virginia, University of Washington, and Yale University.| Source name | Low contour level FIRST | Contour increase factor | Low contour level NVSS | Contour increase factor | Low contour level TGSS | Contour increase factor |
|---|---|---|---|---|---|---|
| J004312.85-103956.1 | 0.001 | x2 | 0.001 | x4 | 0.01 | x2 |
| J080101.35+134952.1 | 0.001 | +2 | 0.002 | x2 | 0.04 | +2 |
| J080337.67+105042.4 | 0.001 | +2 | 0.01 | x2 | 0.02 | +2 |
| J081803.86+543708.4 | 0.001 | x2 | 0.001 | +2 | 0.01 | x2 |
| J082718.31+463510.9 | 0.001 | +2 | 0.001 | x4 | 0.01 | x2 |
| J085116.23+082723.1 | 0.001 | +2 | 0.001 | x2 | 0.01 | x2 |
| J091337.21+031720.5 | 0.001 | x2 | 0.001 | x4 | 0.002 | x2 |
| J092428.89+141409.3 | 0.002 | x2 | 0.002 | x2 | 0.02 | x4 |
| J092539.05+362705.5 | 0.001 | +2 | 0.001 | x2 | 0.02 | x2 |
| J092612.34+324721.2 | 6.0E-4 | +2 | 0.002 | +2 | 0.01 | x2 |
| J093349.82+451957.8 | 4.0E-4 | x2 | 0.001 | x2 | 0.008 | +4 |
| J095716.40+190651.2 | 0.001 | +2 | 0.001 | x2 | 0.01 | x2 |
| J101932.33+140301.8 | 0.001 | x2 | 0.001 | x2 | 0.01 | x2 |
| J103502.61+425548.3 | 0.001 | x2 | 0.001 | x2 | 0.008 | x2 |
| J103605.76+000606.8 | 0.001 | x2 | 0.001 | x4 | 0.02 | x2 |
| J103636.24+383508.1 | 0.001 | +2 | 0.001 | +2 | 0.01 | +2 |
| J103856.37+575247.5 | 0.001 | +2 | 0.001 | x2 | 0.02 | x2 |
| J104645.86+314426.8 | 0.001 | +2 | 0.001 | x2 | 0.01 | +2 |
| J104914.08+005945.2 | 0.001 | +2 | 0.002 | x2 | 0.01 | +2 |
| J114020.22+535029.1 | 0.001 | +2 | 0.001 | +2 | 0.006 | x2 |
| J114111.81+054404.9 | 0.001 | x2 | 0.002 | x2 | 0.01 | x2 |
| J115424.56+020653.0 | 0.001 | +2 | 0.001 | +2 | 0.01 | +2 |
| J115513.65-003133.9 | 0.001 | x2 | 0.002 | +2 | 0.01 | +2 |
| J120118.19+061859.3 | 0.001 | x2 | 0.001 | x2 | 0.01 | x2 |
| J120455.01+483256.9 | 0.001 | x2 | 0.002 | x2 | 0.01 | x2 |
| J121439.53+052803.9 | 0.001 | x2 | 0.001 | x4 | 0.01 | x2 |
| J130904.46+102935.3 | 0.001 | x2 | 0.002 | x2 | 0.01 | x4 |
| J133038.38+381609.7 | 0.001 | x2 | 0.001 | x4 | 0.01 | x4 |
| J135315.36+550648.3 | 0.001 | +2 | 0.001 | x2 | 0.01 | x4 |
| J141456.58+001223.0 | 0.001 | x2 | 0.002 | x2 | 0.01 | x2 |
| J141513.98-013703.7 | 0.001 | x2 | 0.001 | x2 | 0.01 | x2 |
| J141718.94+060812.3 | 0.001 | x2 | 0.002 | x2 | 0.08 | x2 |
| J141731.27+081230.1 | 0.001 | x2 | 0.001 | x4 | 0.04 | x2 |
| J141927.23+233810.2 | 4.0E-4 | x2 | 0.001 | x2 | 0.01 | x2 |
| J143304.34+033037.6 | 0.001 | x2 | 0.001 | x2 | 0.01 | x2 |
| J143409.03+013700.9 | 0.001 | x2 | 0.001 | x4 | 0.01 | x2 |
| J144700.45+460243.5 | 0.001 | x2 | 0.001 | x2 | 0.01 | x2 |
| J144904.27+025802.7 | 0.001 | +1 | 0.001 | x2 | 0.02 | x2 |
| J150229.04+524402.1 | 0.001 | x2 | 0.001 | x2 | 0.02 | x2 |
| J151108.78+180153.2 | 0.001 | x2 | 0.002 | x4 | 0.02 | x2 |
| J154346.14+341521.6 | 4.0E-4 | x2 | 0.002 | x2 | 0.01 | x2 |
| J154729.58+145656.9 | 0.001 | x2 | 0.002 | x2 | 0.02 | x2 |
| J155343.59+234825.4 | 0.001 | x4 | 0.002 | x2 | 0.01 | x2 |
| J161828.98+295859.5 | 0.001 | x2 | 0.001 | x2 | 0.01 | x2 |
| J164527.68+272005.8 | 0.001 | x2 | 0.001 | x2 | 0.01 | x2 |
| J212546.35+005551.9 | 0.001 | x2 | 0.001 | x4 | 0.01 | x2 |
| J222455.24-002302.3 | 0.001 | x2 | 0.002 | x2 | 0.01 | x2 |
| Source name | log | Mr | logL[OIII] | Dn | Cr | ||
|---|---|---|---|---|---|---|---|
| J004312.85-103956.0 | 0.13 | 40.93 | -23.50 | 19.85 | 1.93 | 3.18 | 290.93 |
| J080101.35+134952.2 | 0.11 | 41.21 | -23.32 | 22.18 | 1.95 | 3.15 | 221.46 |
| J080337.67+105042.4 | 0.14 | 40.98 | -22.18 | 3.06 | 2.00 | 3.49 | 246.58 |
| J081803.86+543708.4 | 0.12 | 41.43 | -23.67 | 22.72 | 1.96 | 3.09 | 263.64 |
| J082718.31+463510.8 | 0.12 | 40.74 | -22.60 | 13.73 | 2.01 | 3.34 | 277.60 |
| J085116.24+082723.1 | 0.06 | 40.36 | -22.40 | 51.05 | 1.97 | 3.22 | 258.04 |
| J091337.21+031720.5 | 0.14 | 40.94 | -22.50 | 6.98 | 1.78 | 2.57 | 236.35 |
| J092428.89+141409.3 | 0.14 | 40.44 | -22.71 | 11.58 | 1.98 | 3.29 | 242.06 |
| J092539.06+362705.6 | 0.11 | 41.49 | -23.48 | 26.98 | 1.97 | 3.28 | 276.34 |
| J092612.34+324721.2 | 0.14 | 41.38 | -21.97 | 14.35 | 1.82 | 2.88 | 179.16 |
| J093349.82+451957.8 | 0.13 | 41.33 | -23.05 | 20.75 | 1.90 | 2.94 | 218.17 |
| J095716.41+190651.2 | 0.09 | 40.88 | -22.17 | 35.13 | 1.91 | 1.42 | 210.85 |
| J101932.33+140301.8 | 0.15 | 41.33 | -23.21 | 15.80 | 1.97 | 2.92 | 264.37 |
| J103502.62+425548.3 | 0.14 | 40.86 | -22.88 | 17.15 | 2.22 | 3.19 | 251.18 |
| J103605.76+000606.8 | 0.10 | 41.25 | -23.32 | 39.53 | 1.88 | 3.03 | 311.06 |
| J103636.24+383508.1 | 0.14 | 41.14 | -22.84 | 18.27 | 2.03 | 3.20 | 280.19 |
| J103856.37+575247.5 | 0.10 | 40.95 | -21.43 | 20.40 | 1.92 | 2.93 | 210.19 |
| J104645.86+314426.8 | 0.11 | 40.81 | -23.02 | 19.30 | 2.01 | 3.22 | 278.41 |
| J104914.08+005945.2 | 0.11 | 40.63 | -22.78 | 12.53 | 1.91 | 3.19 | 266.85 |
| J114020.23+535029.1 | 0.15 | 41.04 | -23.17 | 11.86 | 2.09 | 3.05 | 332.40 |
| J114111.81+054405.0 | 0.10 | 41.24 | -23.47 | 1.06 | 1.93 | 2.94 | 272.32 |
| J115424.56+020653.0 | 0.13 | 40.64 | -22.90 | 5.80 | 1.97 | 3.52 | 276.32 |
| J115513.65-003133.9 | 0.13 | 41.02 | -22.76 | 17.40 | 1.92 | 2.85 | 221.82 |
| J120118.19+061859.3 | 0.14 | 40.54 | -22.81 | 8.39 | 1.99 | 3.32 | 319.14 |
| J120455.02+483256.9 | 0.07 | 40.62 | -21.81 | 26.41 | 1.90 | 3.23 | 233.62 |
| J121439.53+052803.9 | 0.08 | 40.13 | -23.44 | 5.01 | 1.95 | 3.28 | 230.03 |
| J130904.46+102935.3 | 0.09 | 41.17 | -22.87 | 4.74 | 2.02 | 3.44 | 348.60 |
| J133038.38+381609.7 | 0.11 | 40.86 | -23.24 | 24.97 | 1.94 | 3.17 | 260.61 |
| J135315.36+550648.2 | 0.14 | 40.66 | -20.49 | 6.37 | 1.96 | 2.01 | 255.58 |
| J141456.58+001223.0 | 0.13 | 40.82 | -22.87 | 15.15 | 2.01 | 3.28 | 331.01 |
| J141513.98-013703.7 | 0.15 | 41.24 | -23.33 | 37.24 | 2.00 | 3.05 | 305.79 |
| J141718.94+060812.3 | 0.11 | 40.91 | -22.79 | 2.55 | 2.00 | 3.31 | 278.47 |
| J141731.27+081230.1 | 0.06 | 40.58 | -22.52 | 49.76 | 2.04 | 3.33 | 237.39 |
| J141927.23+233810.2 | 0.14 | 40.12 | -22.16 | -1.67 | 1.88 | 2.94 | 185.40 |
| J143304.34+033037.6 | 0.15 | 40.88 | -23.44 | 17.21 | 1.98 | 2.65 | 230.86 |
| J143409.03+013700.9 | 0.14 | 41.61 | -23.43 | 18.35 | 2.01 | 3.35 | 331.87 |
| J144700.45+460243.5 | 0.13 | 41.04 | -22.34 | 18.54 | 1.92 | 3.36 | 288.44 |
| J144904.27+025802.7 | 0.12 | 40.36 | -21.81 | -3.85 | 1.87 | 3.32 | 194.29 |
| J150229.04+524402.0 | 0.13 | 41.10 | -23.50 | 24.43 | 1.98 | 3.28 | 292.56 |
| J151108.77+180153.3 | 0.12 | 41.28 | -23.08 | 21.10 | 2.04 | 3.11 | 274.49 |
| J154346.14+341521.6 | 0.12 | 40.20 | -22.30 | 3.30 | 1.93 | 3.29 | 232.29 |
| J154729.59+145657.0 | 0.09 | 40.69 | -22.42 | 37.78 | 1.85 | 3.02 | 203.33 |
| J155343.59+234825.4 | 0.12 | 41.28 | -23.43 | 307.83 | 1.64 | 3.18 | 323.50 |
| J161828.98+295859.6 | 0.13 | 40.96 | -23.21 | 5.99 | 2.04 | 3.15 | 315.10 |
| J164527.68+272005.8 | 0.10 | 40.65 | -23.16 | 14.75 | 1.96 | 3.05 | 270.40 |
| J212546.35+005551.8 | 0.14 | 41.62 | -23.02 | 25.49 | 1.96 | 2.98 | 223.22 |
| J222455.24-002302.3 | 0.14 | 40.74 | -22.63 | 2.7 | 274.29 |
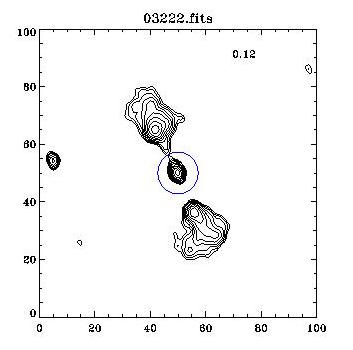
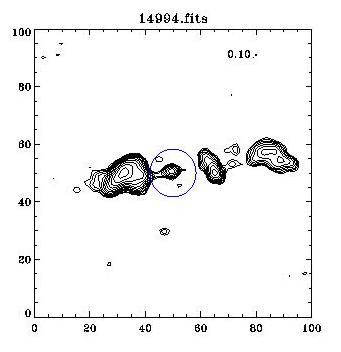
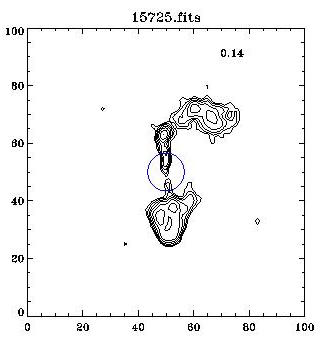
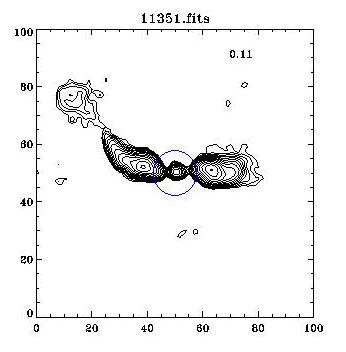
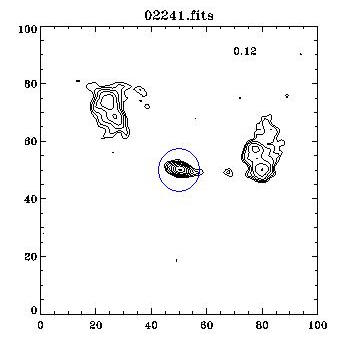
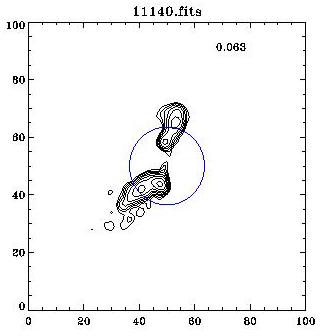
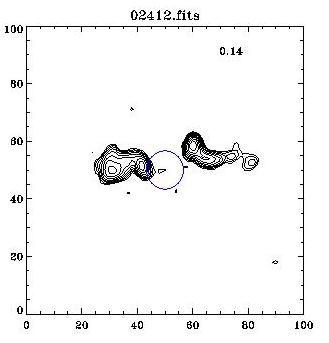
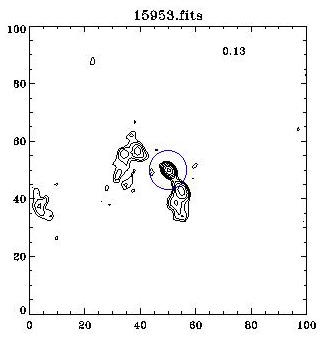
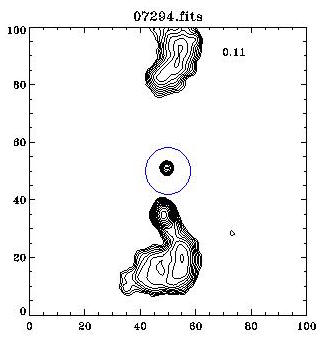
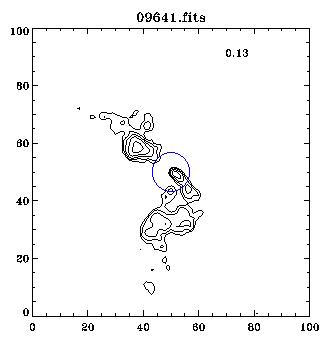
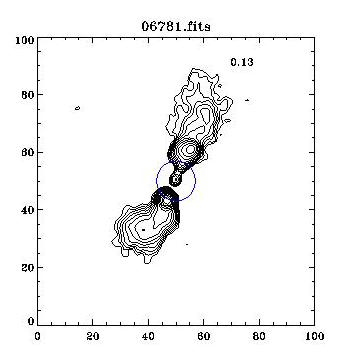
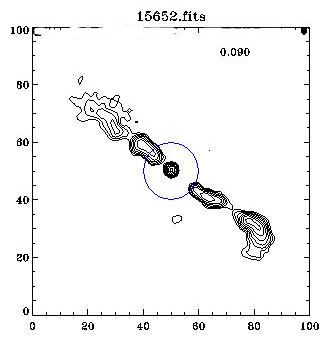
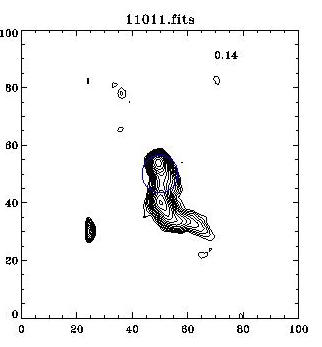
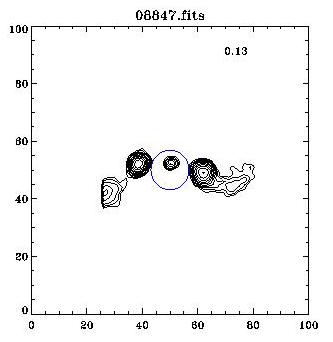
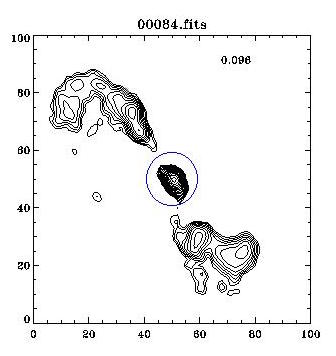
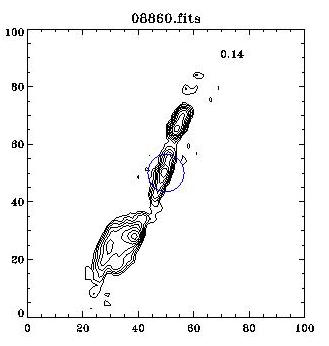
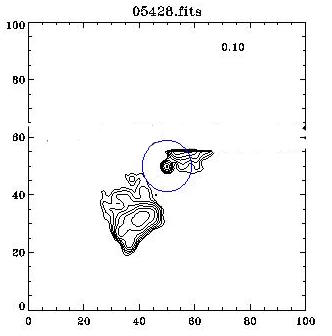
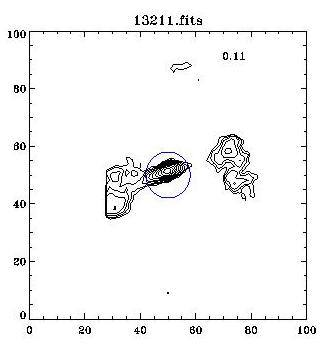
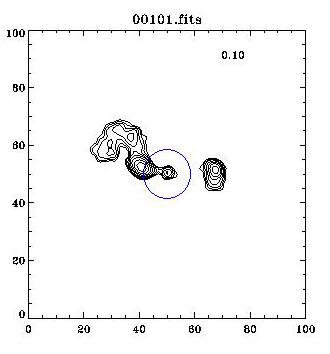
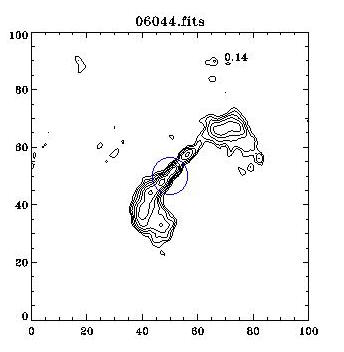
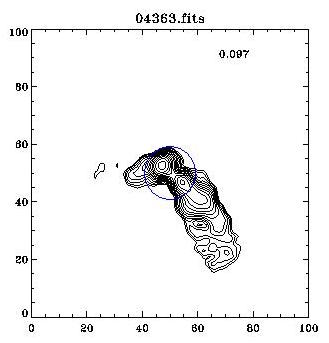
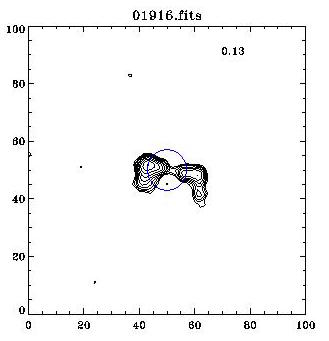
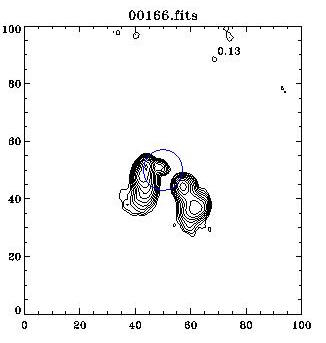
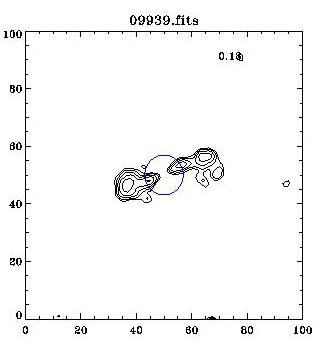
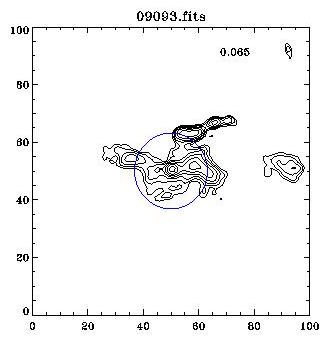
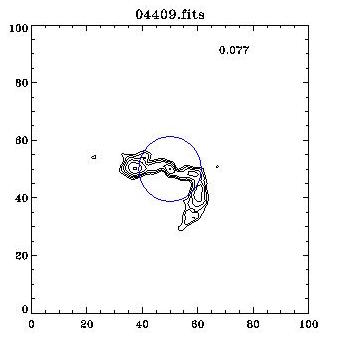
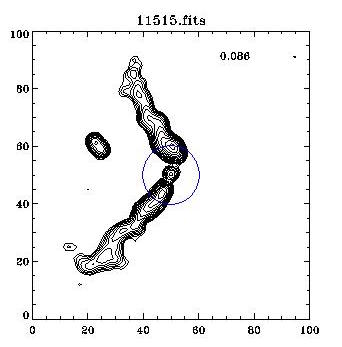
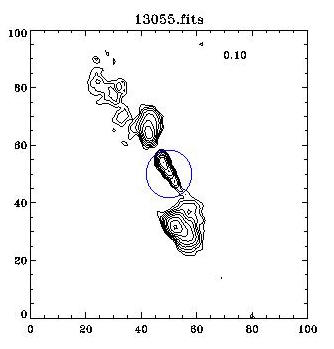
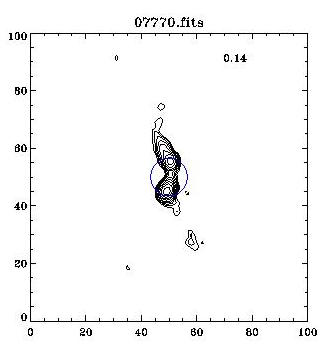
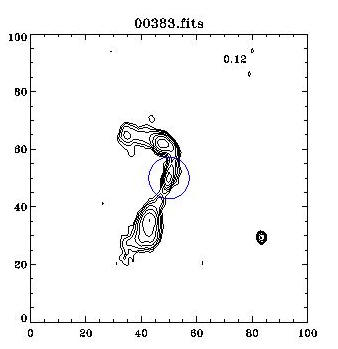
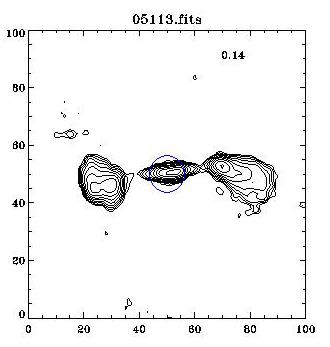
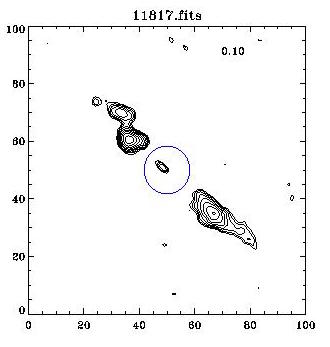
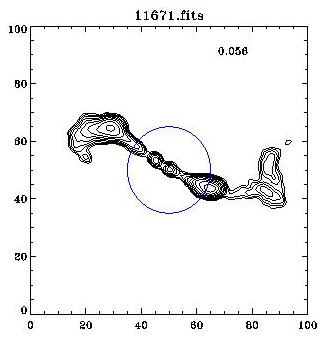
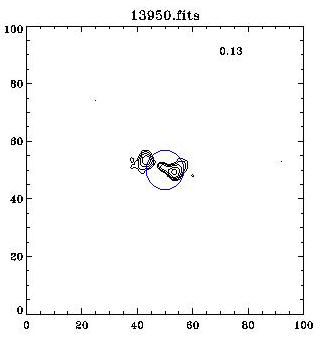
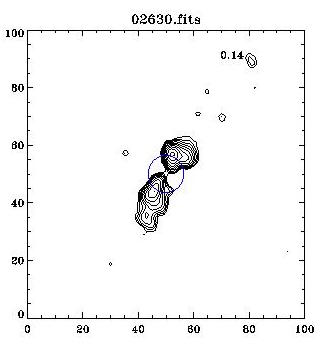
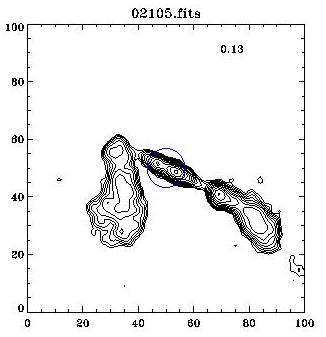
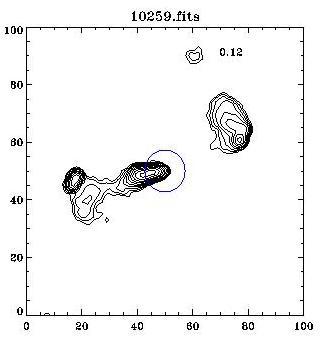
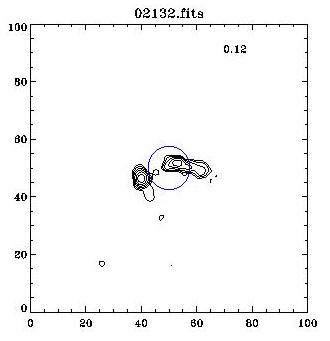
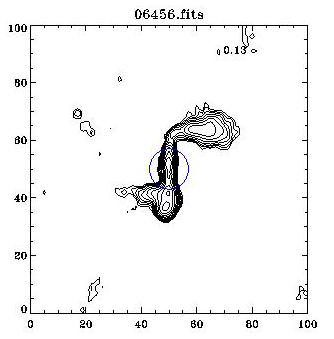
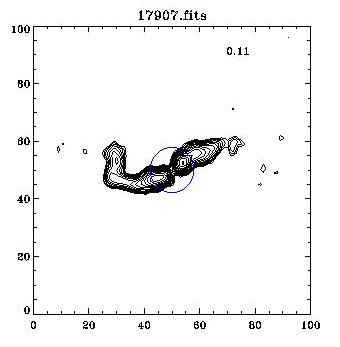
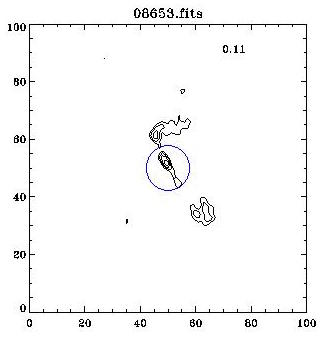
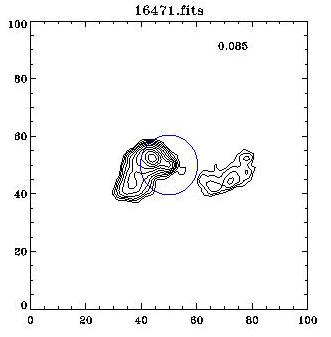
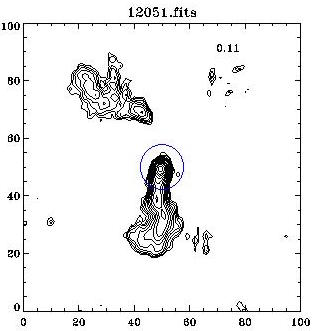
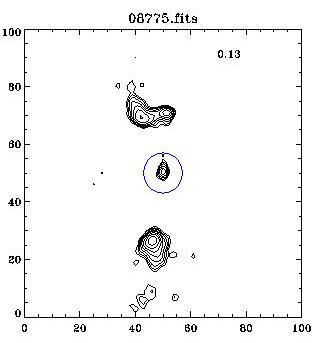
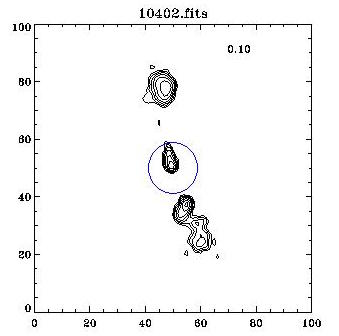
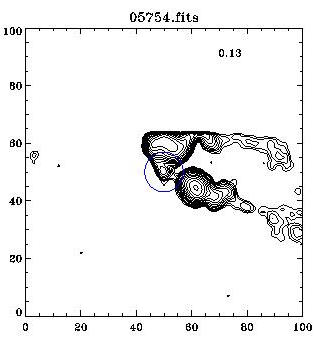
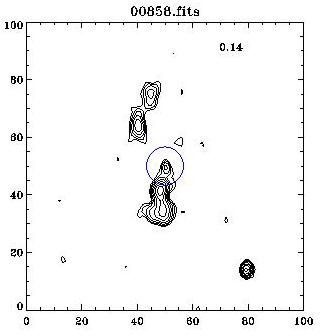
Appendix A FIRST radio contours of the 47 WATCAT sources.
In this appendix we show FIRST radio contours for the 47 sources in the WATCAT.
| Best ID | SDSS name |
|---|---|
| 84 | J103605.76+000606.8 |
| 101 | J104914.08+005945.2 |
| 166 | J115513.65-003133.9 |
| 383 | J141456.58+001223.0 |
| 1916 | J115424.56+020653.0 |
| 2105 | J143409.03+013700.9 |
| 2132 | J144904.27+025802.7 |
| 2241 | J082718.31+463510.8 |
| 2412 | J091337.21+031720.5 |
| 2630 | J143304.34+033037.6 |
| 3222 | J004312.85-103956.0 |
| 4363 | J114111.81+054405.0 |
| 4409 | J121439.53+052803.9 |
| 5113 | J141513.98-013703.7 |
| 5428 | J103856.37+575247.5 |
| 5754 | J212546.35+005551.8 |
| 6044 | J114020.23+535029.1 |
| 6456 | J150229.04+524402.0 |
| 6781 | J093349.82+451957.8 |
| 7294 | J092539.06+362705.6 |
| 7770 | J135315.36+550648.2 |
| 8653 | J154346.14+341521.6 |
| 8775 | J161828.98+295859.6 |
| 8847 | J103502.62+425548.3 |
| 8860 | J103636.24+383508.1 |
| 9093 | J120455.02+483256.9 |
| 9641 | J092612.34+324721.2 |
| 9939 | J120118.19+061859.3 |
| 10259 | J144700.45+460243.5 |
| 10402 | J164527.68+272005.8 |
| 11011 | J101932.33+140301.8 |
| 11140 | J085116.24+082723.1 |
| 11351 | J081803.86+543708.4 |
| 11515 | J130904.46+102935.3 |
| 11671 | J141731.27+081230.1 |
| 11817 | J141718.94+060812.3 |
| 13055 | J133038.38+381609.7 |
| 13211 | J104645.86+314426.8 |
| 13950 | J141927.23+233810.2 |
| 14994 | J080101.35+134952.2 |
| 15652 | J095716.41+190651.2 |
| 15725 | J080337.67+105042.4 |
| 15953 | J092428.89+141409.3 |
| 16471 | J154729.59+145657.0 |
| 858 | J222455.24-002302.3 |
| 12051 | J155343.59+234825.4 |
| 17907 | J151108.77+180153.3 |
Appendix B FIRST, NVSS, and TGSS radio contours of the 47 WATCAT sources.
In this appendix we show FIRST, NVSS and TGSS radio contours for the 47 sources in the WATCAT.


