Designing Flat Band by Strain
Abstract
We study the effects of heterostrain on moiré bands in twisted bilayer graphene and bilayer transition metal dichalcogenide (TMD) systems. For bilayer graphene with twist angle near , we show that heterostrain significantly increases the energy separation between conduction and valence bands as well as the Dirac velocity at charge neutrality, which resolves several puzzles in scanning tunneling spectroscopy and quantum oscillation experiments at once. For bilayer TMD, we show that applying small heterostrain generally leads to flat moiré bands that are highly tunable.
I Introduction
Recent experimental discoveries of correlated insulator and superconducting states in two-dimensional moiré materials including twisted bilayer graphene (TBG)Cao et al. (2018a, b); Yankowitz et al. (2019) and graphene-boron nitride heterostructures Chen et al. (2018) have stimulated tremendous interest in engineering flat or narrow bands to realize correlated electron phenomena. For this purpose, moiré superlattices provide a unique and highly tunable material platform. With a vast variety of materials and heterostructures available Novoselov et al. (2016), moiré superlattice systems may offer unprecedented advantages for studying many-body physics and realizing exotic states of matter.
Moiré patterns appear ubiquitously in layered materials with a slight mismatch in the lattice orientation and/or lattice constant of the layers. Aside from twist angles between layers, heterostrain—which refers to relative strains between layers—provides an alternative way to create and modify moiré patternsHuder et al. (2018a). Using strain to tune moiré bands may have practical advantages than using twist angle. Strain can be controlled in situ via piezoelectric substrate. The possibility of tuning band structure and achieving partially flat band with strain has recently been studied in graphene (see for example Guinea (2012); Frisenda et al. (2017)) and surface states of topological crystalline insulator Tang and Fu (2014).
In this work, we systematically study the effect of heterostrain on moiré band structures for homobilayer systems including bilayer graphene and transition metal dichalcogenides (TMD). Our motivation is twofold. First, (unintentional) heterostrain is ubiquitous in TBG samples Kerelsky et al. (2018), likely due to the interaction with the substrate. However, the effect of heterostrain on the flat bands in magic-angle TBG is not well understood. We find a small amount of strain dramatically changes the low-energy band structure, which resolves several puzzles in transport and spectroscopy experiments all at once. Second, engineering a tunable flat band system by strain provides unprecedented opportunities for future studies. To that end, we focus on bilayer TMDs and show the conditions for flat moiré bands induced by heterostrain without any twist.
This work consists of two parts. In the first part, we show that heterostrain in TBG significantly increases the energy separation between moiré conduction and valence bands, for instance, to meV with uniaxial heterostrain as commonly observed in STM experiments Kerelsky et al. (2018). The energy separation of the van Hove singularities saturates over a range of twist angles around , rather than being extremely sensitive to small deviation from the magic angle in the unstrained case. These findings explain the unexpectedly large separation of van Hove singularities observed in the recent STM experiments on TBG with Kerelsky et al. (2018).
Moreover, in the presence of heterostrain, the conduction and valence bands of the same valley remain connected by two Dirac points near charge neutrality. However, due to the lowered symmetry, these two Dirac points are away from mini-Brillouin zone corners and are no longer degenerate in energy. This effect may explain the 4 (instead of 8) fold Landau level degeneracy111The possibility of the lifted degeneracy by heterostrain is brought to our attention by Matthew Yankowitz and Cory Dean. observed in the transport experimentsCao et al. (2018a, b); Yankowitz et al. (2019). We also show that heterostrain sets a lower bound for the Dirac velocity, preventing it from vanishing at the magic angle. The Dirac velocity is anisotropic and on the order of for a small heterostrain of - ( being the bare Dirac velocity of monolayer graphene). This value is comparable to the one inferred from quantum oscillation and capacitance measurementsCao et al. (2018a).
In the second part, we study bilayer TMDs with volume preserving heterostrain. In contrast to the twisted bilayer graphene, we find that nearly flat moiré bands are generically present near the top of valence band in heterostrained bilayer TMD without fine tuning and without the need of twist. In addition, the moiré band gap and band structure are highly tunable by strain, pressure and displacement field, thus providing an ideal platform for correlation-driven phenomena.
II 2-dimensional strain and general continuum models
In this section, we consider the general geometrical description of -dimensional strain. Mathematically, the coordinate transformation in can be written as
| (1) |
where is a -dimensional vector that parametrizes the displacement and is an arbitrary -dimensional matrix that contains the strain and rotation. In the small deformation limit, can be written as
| (2) |
where the symmetric part, labeled by , represents the strain, and the anti-symmetric part, labeled by , represents the rotation. We emphasis that strain for materials, different from the rotation angle which is a single parameter, is characterized by a 2 by 2 symmetric matrix, which has 3 free parameters. Therefore, it provides more possibilities to engineer the superlattice structures for layered materials.
Let us review the effects of geometric deformation on the properties of monolayer graphene. For free monolayer graphene, we define and to be the primitive lattice vectors. Correspondingly, the reciprocal lattice vectors are and . are referred as two valley points. The low energy description of monolayer graphene contains two massless Dirac fermions at and points with spin degeneracy. Geometrically, a deformation changes the shape of the unit cell as well as the Brillouin zone. Mathematically the rescaled primitive and reciprocal lattice vectors are
| (3) |
A generic , including both nonzero strain and rotation , breaks almost all the point group symmetry of the lattice except the inversion . In addition to the geometric effect, the strain adjusts the distances between atoms, which leads to differences in hopping matrix elements for nearest carbon atoms along different directions. As a result, the locations of the low energy Dirac fermions are shifted away from the rescaled valley points . Within a simple two center approximation , the shift is proportional to the strain in the small strain limit and can be described by an effective gauge connection for the low energy Dirac fermionsNam and Koshino (2017):
| (4) |
The two Dirac fermions carry opposite charges under this fictitious gauge field. Therefore, the positions of the two Dirac fermions in momentum space are given by
| (5) |
where labels the two valleys. The hopping modulus factor is a dimensionless parameter determined by the intrinsic properties of the material. The approximate value of is estimated by first principle calculation for graphene, Nam and Koshino (2017).
The effects of geometric deformation for monolayer TMDs are similar as for monolayer graphene. For unstrained monolayer TMD, the low energy theory can be modeled by two massive Dirac fermionsLiu et al. (2013); Xiao et al. (2012) at points. As a result of the large spin-orbital coupling, the valence bands near two valleys carry opposite spins. Generic deformations reshape the unit cell and the Brillouin zone and break all the point group symmetries. It also shifts the Dirac fermions away from the rescaled valley points . The shift is again described by Eq. 4 and 5. First principle calculations suggest for WSe2, the hopping modulus factor is Fang et al. (2018a).
In the rest of the paper, we consider homobilayers systems starting with AA stacking and then apply small twist and heterostrain. The coordinate transformations of the two layers can be described by two deformation matrices and . The rescaled reciprocal lattice vectors for the two layers are
| (6) |
Such geometrical deformation generates a moiré superlattice whose reciprocal lattice vectors ’s and primitive lattice vectors ’s are given by
| (7) |
respectively, where is the relative deformation matrix. Physical properties only depend on the relative deformation in the small twist and strain limit. For all the calculations in this paper, we assume that , namely the two layers are rotated and strained oppositely with the same magnitude.
In the limit where the moiré superlattice constant is much larger than the atomic scale, the low energy electronic structure can be effectively captured by the continuum modelBistritzer and MacDonald (2011); Lopes dos Santos et al. (2012, 2007). The spirit of the continuum model is the same as the nearly free electron approximation for band structures in solid state physics. Essentially, one should take the low energy bare dispersions of the materials and perturb them by the periodic moiré superlattice. A general continuum model for bilayer systems can be schematically written asBistritzer and MacDonald (2011); Yuan and Fu (2018); Koshino et al. (2018)
| (8) |
where and are the bare dispersions of layer 1 and 2 respectively. The describes the spatial dependent interlayer tunneling and the and describe the intralayer potential induced by the moiré superlattice. The and vary between different materials and are also dependent on extrinsic conditions such as pressureYankowitz et al. (2019). In the following sections, we will focus our discussions on two cases twisted bilayer graphene with uniaxial heterostrain and bilayer WSe2 with volume preserving heterostrain.
III Twisted bilayer graphene with uniaxial heterostrain
III.1 The continuum model
In bilayer graphene, the bare low energy dispersion for each layer contains two massless Dirac fermions, namely
| (9) |
where labels the two layers, labels the two valleys. The matrices act on the pseudospin or sublattice degrees of freedom. Each valley also has two-fold spin degeneracy. denotes the location of the Dirac fermion as given in Eq. 5. The fermi velocity in monolayer graphene is estimated m/sCastro Neto et al. (2009), which gives the kinetic energy scale eV.
In this section, we restrict ourselves to twisted bilayer graphene with uniaxial heterostrain. The uniaxial heterostrain refers to a class of strain where the bilayer system is relatively stressed along one direction and unstressed on the perpendicular direction. Scanning tunneling microscope (STM) experiments have indicated such type of heterostrain in twisted bilayer graphene samplesKerelsky et al. (2018); Huder et al. (2018b); Qiao et al. (2018). We anticipate that many generic features of the uniaxial strain should also apply for more general form of strain. Geometrically, uniaxial strain can be described by two parameters, namely the strain magnitude and the strain direction . The strain tensor can be written as the followingKerelsky et al. (2018)
where is the Poisson ratio for graphene. The combination of twist and strain is described by the relative deformation matrics .
For graphene system, is parametrically smaller than the interlayer tunneling, therefore we set it to zero. The interlayer tunneling has the following form (following the convention in, for example, Koshino et al. (2018)),
| (11) | |||||
where . The effect of lattice corrugation in TBG on moiré band structure can be included in the continuum model by choosing renormalized tunneling amplitudes and Koshino et al. (2018), which depend on heterostrain and twist angle. For simplicity, in our calculation we assume the two graphene layers are unrelaxed and use the tunneling parameters meVBistritzer and MacDonald (2011). With this set of parameters, the first magic angle without strain locates around .
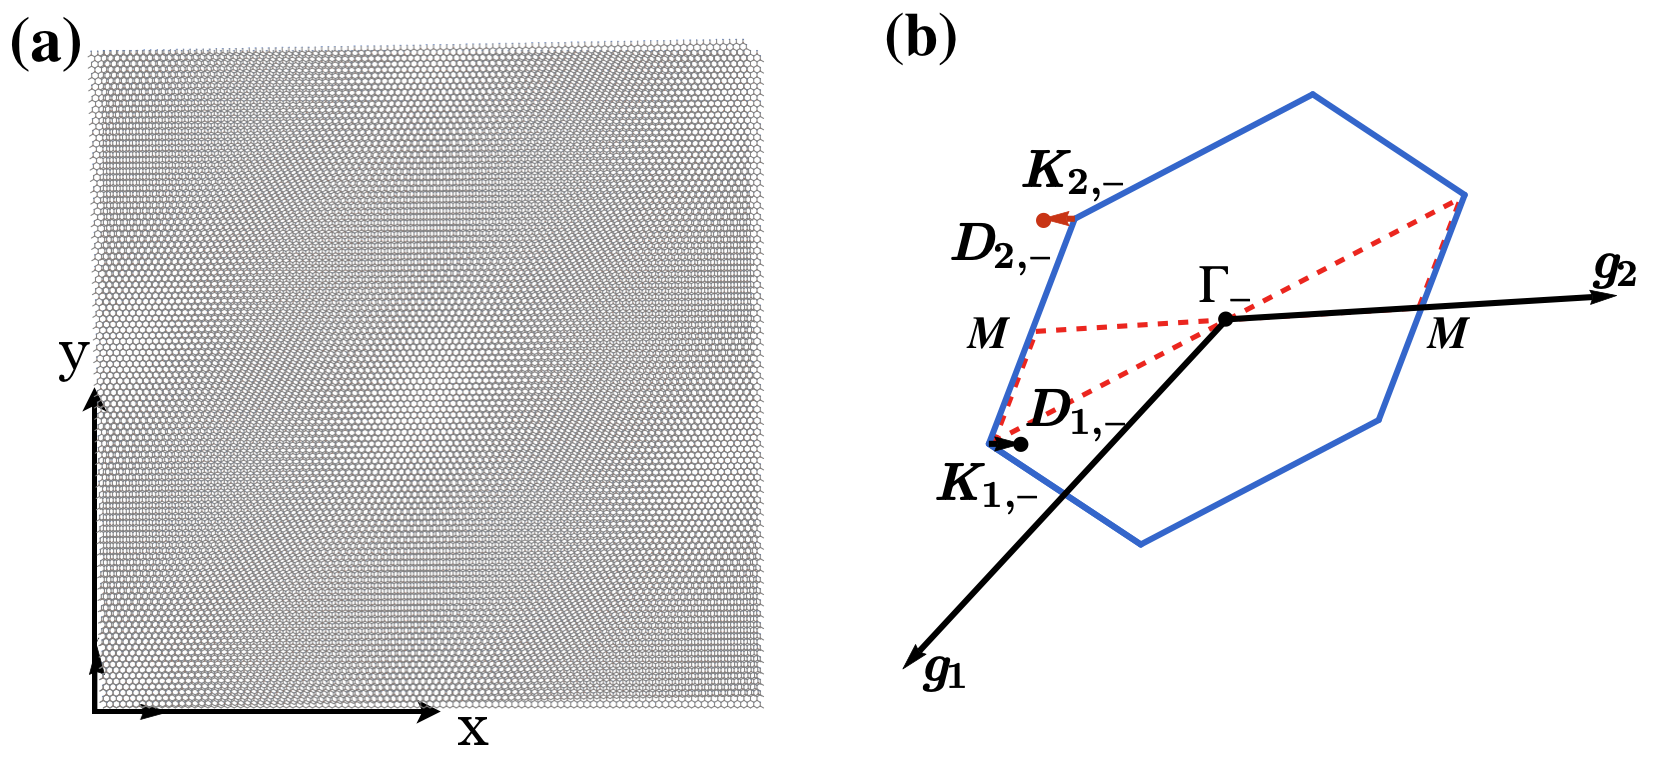
An apparent geometric effect of the combination of twist and heterostrain is that the moiré superlattice is no longer a regular triangular lattice . An example of moiré pattern generated with , and is shown in Fig. 1(a). The uniaxial strain makes the moiré dots elliptical, which is visible in local measurements such as STMKerelsky et al. (2018). As a consequence, the Brillouin zone of the moiré superlattice is a distorted hexagonal as shown in Fig. 1(b). In order to compare results for different twists and strains, we will always stretch the irregular hexagonal Brillouin zone to be regular.
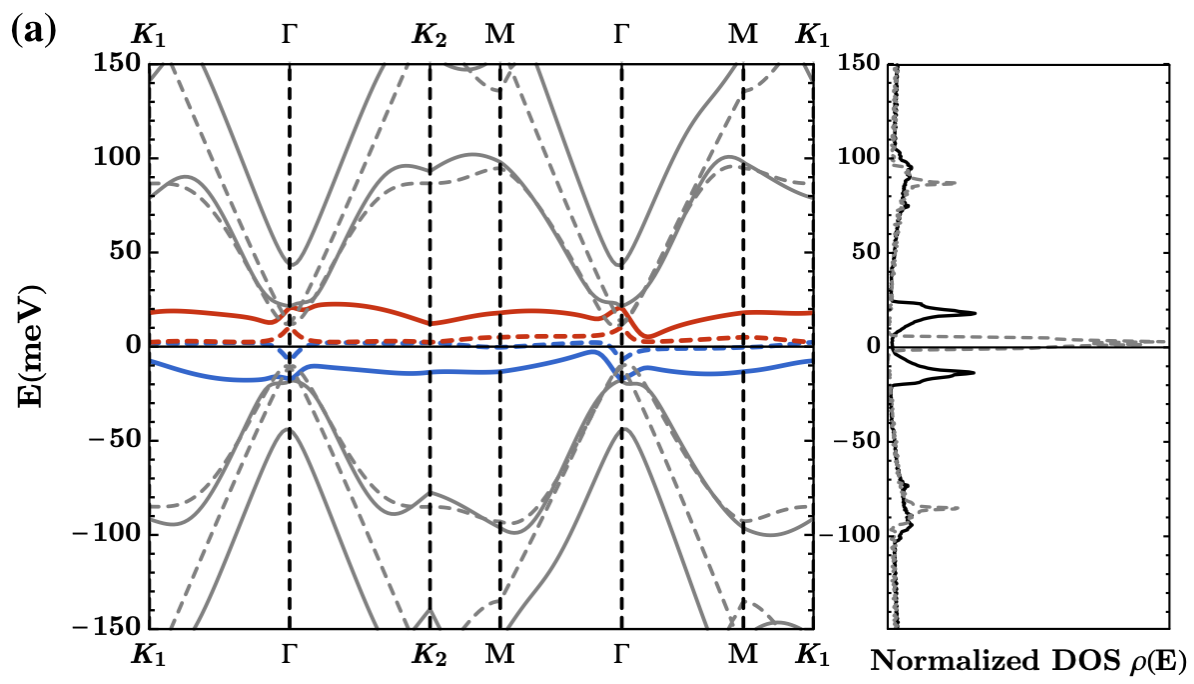
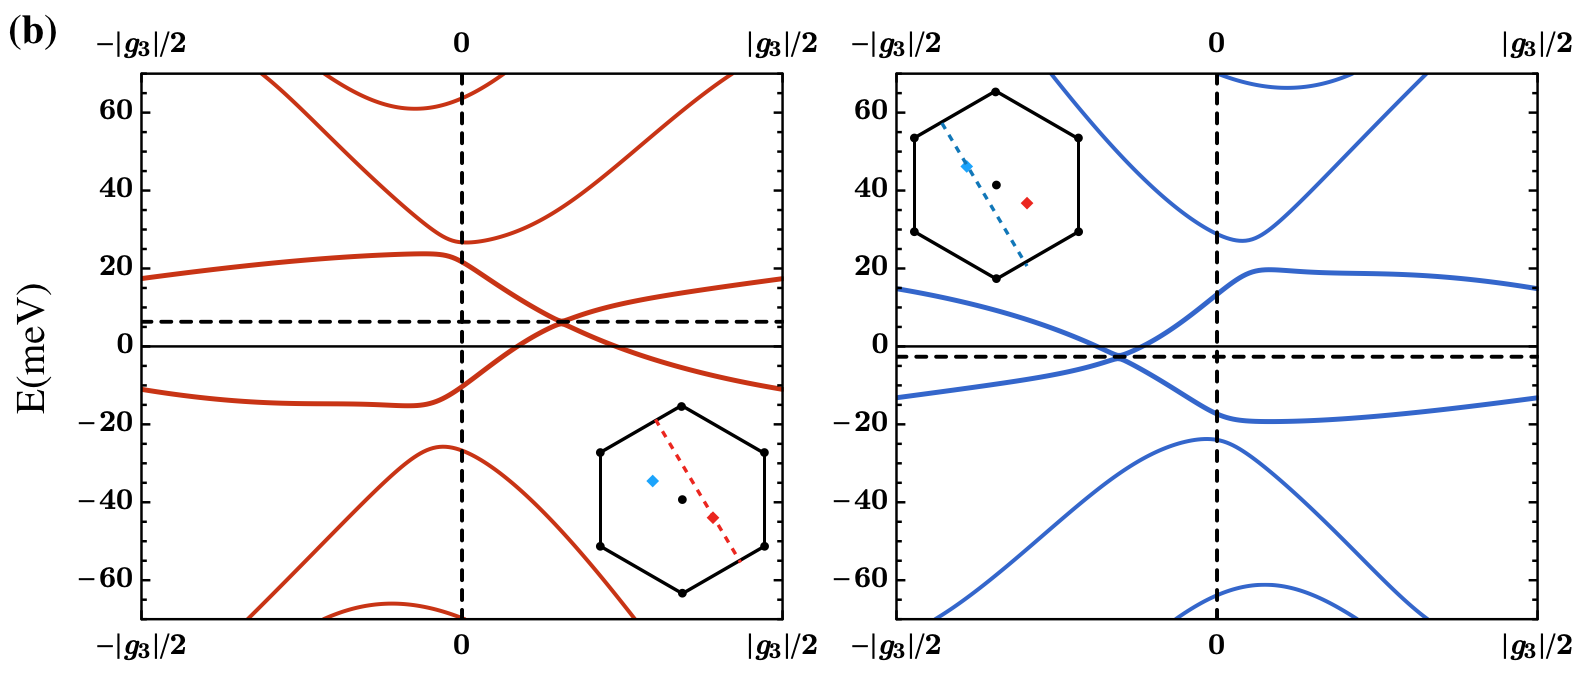
A typical band structure of twisted bilayer graphene near magic angle with small uniaxial heterostrain is shown in Fig. 2. Three generic features are worth noticing in these plots. First, the energy separation between conduction and valence bands, as seen from the separation of van Hove singularities, is significantly enlarged compared to the case with no strain. Interestingly, these two bands remain rather flat for most parts of the Brillouin zone. This finding agrees with the large splitting of van Hove singularities of the conduction and valence bands observed in the scanning tunneling spectroscopy (STS) Kerelsky et al. (2018). We will study in detail of the evolution of the bandwidth with respect to the geometrical parameters , and .
Second, the conduction and valence bands remain connected by two Dirac crossings in each valley, which is due to the symmetry. However, these two Dirac crossings are now located at generic points away from Brillouin zone corners because of the lack of three-fold rotational symmetries in the presence of strain. In addition, the energies of the two Dirac points within a valley are shifted by the heterostrain and are no longer degenerate. This may explain the observed 4-fold (instead of 8-fold) Landau level degeneracy in the experimentsCao et al. (2018a, b); Yankowitz et al. (2019) near charge neutrality. We note that the energy offset of the two Dirac points leads to a finite density of electrons and holes at charge neutrality. Nonetheless, the residual electron/hole density is found to be rather small: around cm-2 (including valley and spin degeneracy) for strain. We shall also investigate the dependence of the Dirac fermion energy splitting on the system parameters.
Finally, compared to the unstrained case, the Dirac velocity is found to be greatly enhanced—reaching for a small strain of , and is anistropic due to the lowered symmetry. Moreover, we find that heterostrain sets a lower bound for the Dirac velocity, preventing it from vanishing around magic angle. The enhanced Dirac velocity found here is comparable to the one inferred from quantum oscillation and capacitance experiments Cao et al. (2018a).
III.2 The bandwidth and the Dirac point shift
Now we study the total bandwidth of the conduction and valence bands and the energy shift of the two Dirac crossings within a valley as a function of the parameters , and . We are interested in the regime of twist angle around . Experimental data indicate that the uniaxial heterostrain in twisted bilayer graphene samples can vary from to Kerelsky et al. (2018). In addition, it is easy to convince ourselves that the system is periodic for because of the symmetry of the unstrained system. Therefore, we can restrict our studies to .
Firstly, let us fix and and plot the density of states the conduction and valence bands for several values of as shown in Fig. 3. We observe many subtle changes in the structure of van Hove singularities within each bands as the direction of the strain is varied. For instance, has three density of state peaks in each band. However, for , there is only one prominent peak in each band, which is consistent with the experimental resultsKerelsky et al. (2018). Nonetheless, the total bandwidth stays approximately constant.
Secondly, we study the total bandwidth measured by the separation of the van Hove singularities in the conduction and valence bands, labeled by . Fig. 4 shows the evolution of as a function of for several different ’s at fixed strain direction . An interesting feature is that the bandwidth is insensitive to the twist angle for angles near the magic angle. We also observe that the saturation value of the bandwidth is linearly proportional to the magnitude of the strain as shown in Fig. 5, which suggests the strain effect is dominant near the magic angle. In certain sense, the heterostrain provides an intrinsic kinetic energy cutoff, , for the system and stabilizes the bandwidth.


Finally, we study the energy shift, labeled by , of two Dirac points within a valley as a function of and at fixed twist angle. As shown in Fig. 6, the Dirac point shifts highly depend on the direction of the strain. We also find that the maximal value of the Dirac point shift is proportional to the magnitude of the strain. To our surprise, a quite small heterostrain such as can create a considerable splitting of the dirac fermions (on the order of meV).

Although a complete analytical understanding of heterostrain effects found in our calculation is currently lacking, we provide some intuition for the observed features in the band structures. In the unstrained twisted bilayer near the magic angle, the nearly flat energy dispersions arise from subtle interference effects between the mismatched energy dispersion within each layer and electron hopping between layers. For example, the state at from layer-1 would be coupled through the moiré interlayer tunneling to three states from layer-2 with the same energy. Similarly, the state at from layer-2 is also coupled to three equal energy states in layer-1. We can crudely think of the magic angle is tuning the bilayer system to a critical situation where the kinetic energy scale vanishes. However, such “interference condition” is explicitly violated by the heterostrain, which introduces a natural kinetic energy cutoff, , to the system. It is easy to see the energies of the three states from layer-2 that can couple to state in layer-1 are now shifted precisely by because of the heterostrain. This lifting of perfect interference is presumably the cause for the enlarged bandwidth and the Dirac fermion energy shift.
III.3 Higher order van Hove singularities
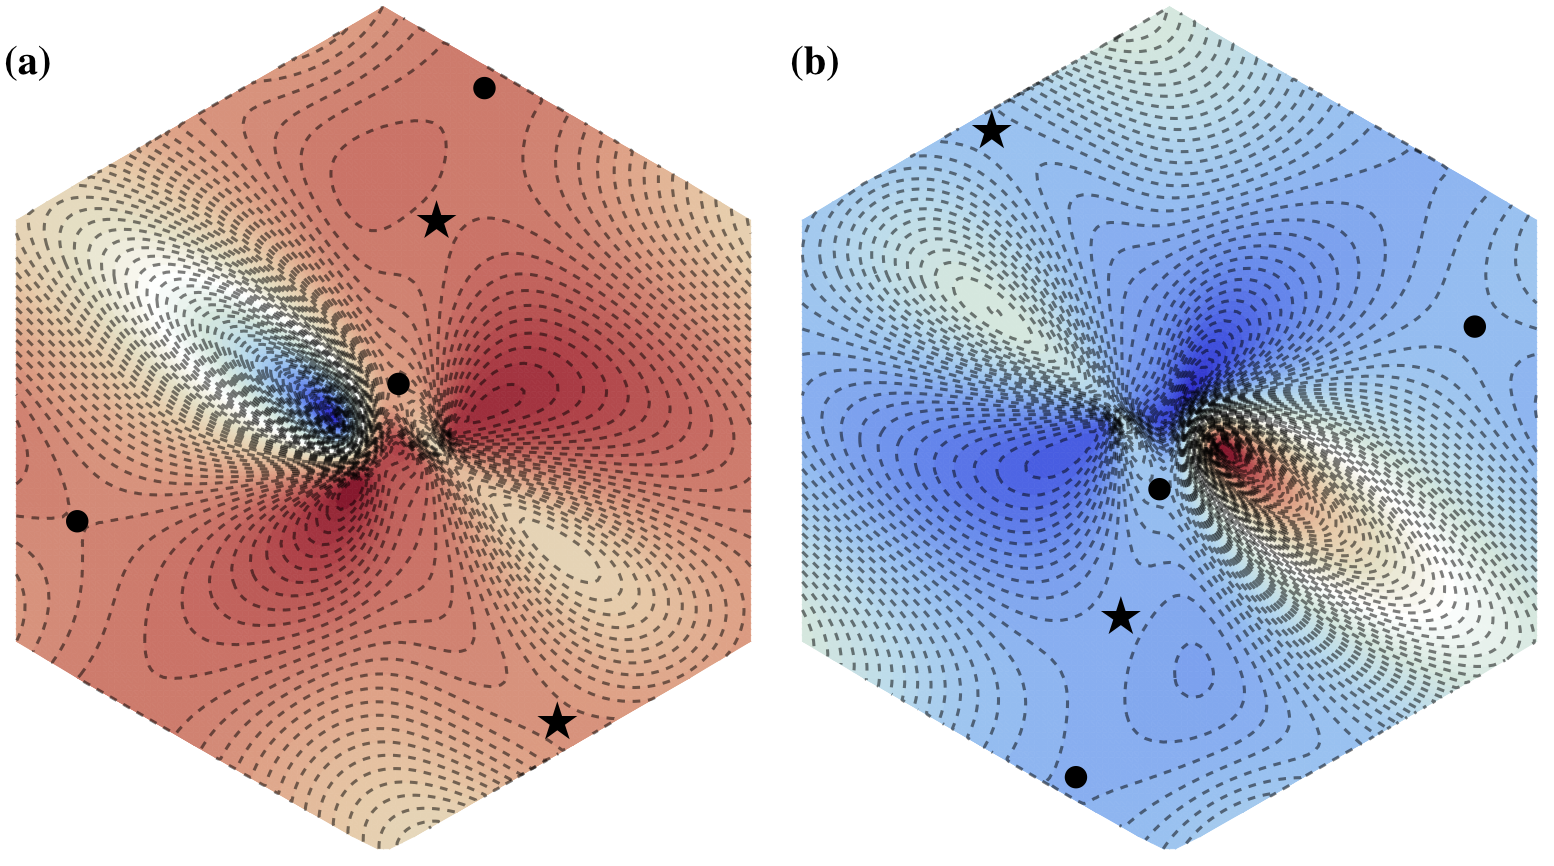
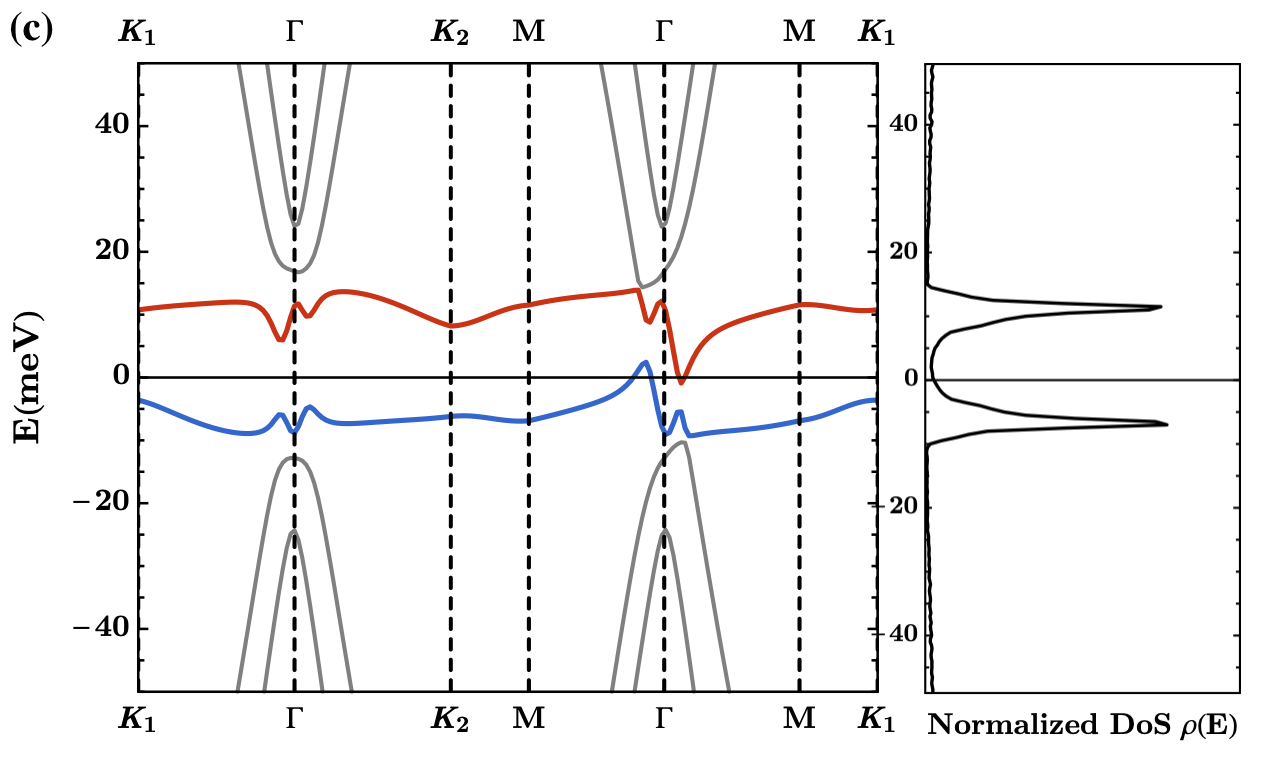
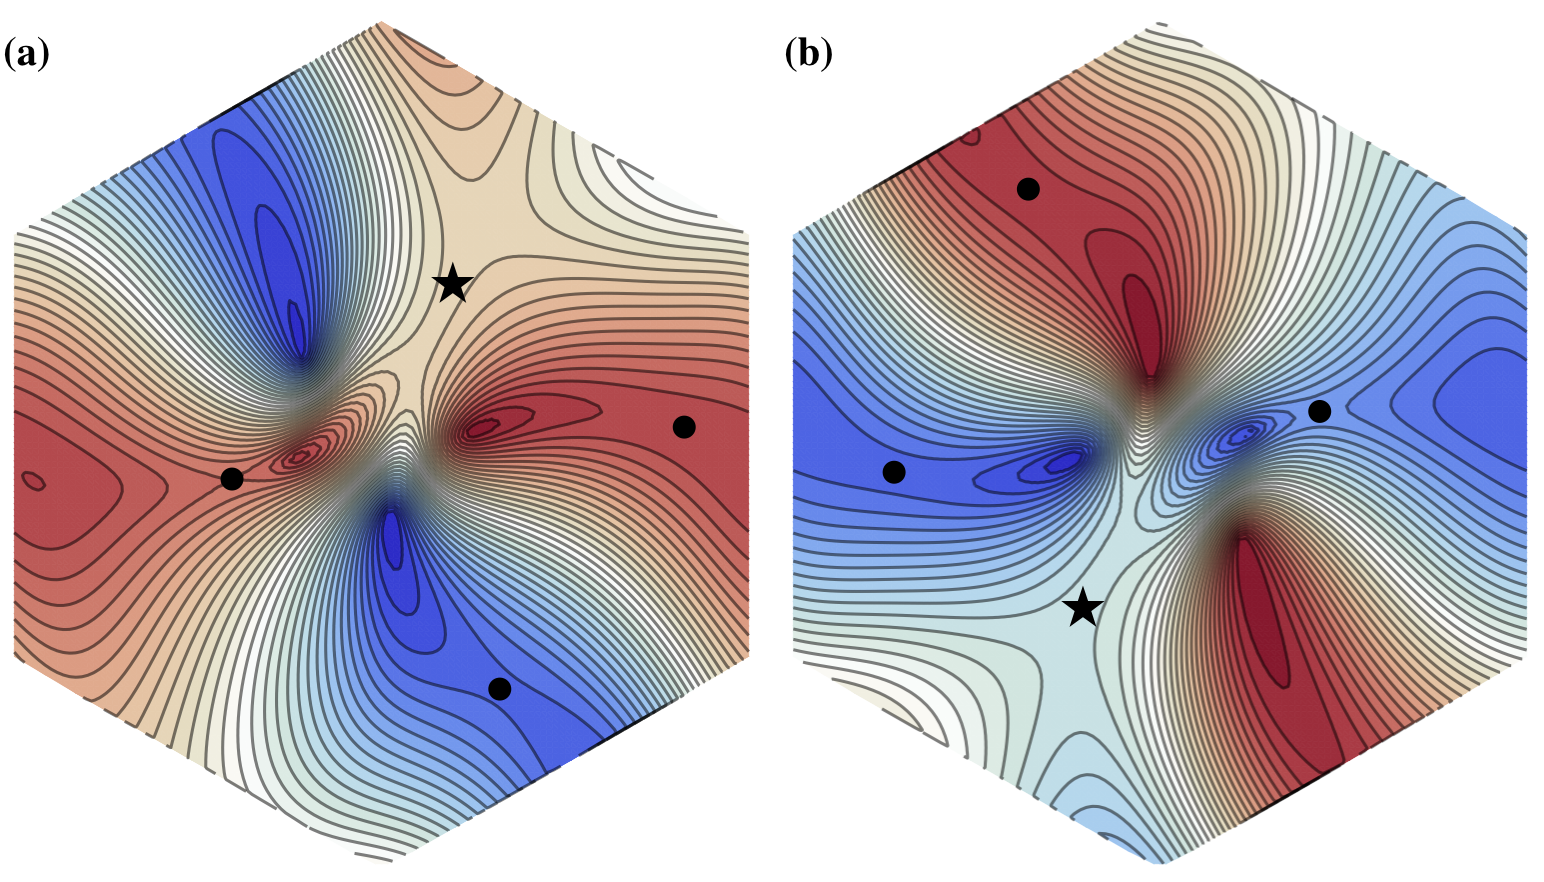
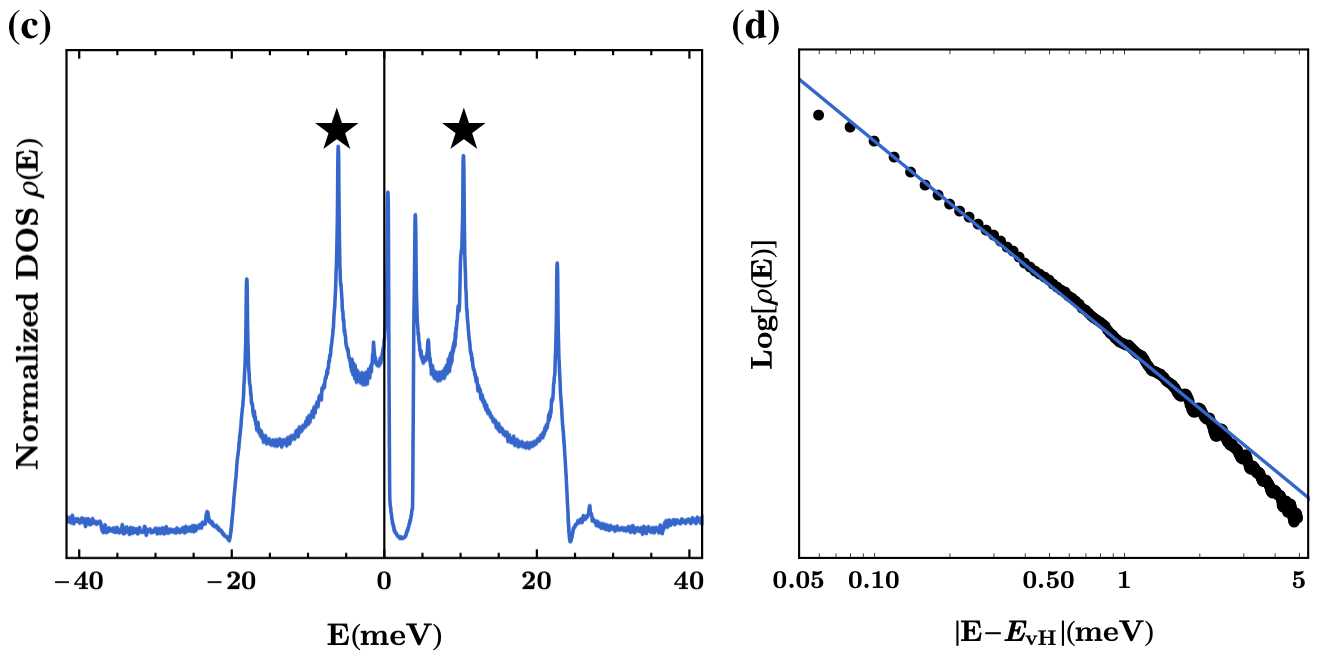
As shown in Ref. Yuan et al. (2019), with a single tuning parameter such as the twisted angle, one can achieve higher order van Hove singularities in bilayer graphene, which are perfect playgrounds for correlation-driven physics. Here we show that heterostrain is another effective way to generate higher order van Hove singularities. To demonstrate this, we show two examples in Fig. 7 and 8. We find multiple ordinary and higher order van Hove singularities in both conduction and valence bands in these examples. The energies of the van Hove singularities are not required to be the same in general because of the low symmetry of the heterostrained system. Therefore, we may observe multiple peaks in the density of states for certain conditions as shown in Fig. 8.
IV Heterostrain in bilayer transition metal dichalcogenide
IV.1 Heterostrain induced flat bands
For monolayer TMD, the model hamiltonian for one valley can be written as the followingLiu et al. (2013); Xiao et al. (2012); Fang et al. (2018a)
| (12) |
where matrices act on sublattice space and there is no spin degeneracy because of the large spin-orbital coupling. This hamiltonian generally applies for a large class of TMD materialsLiu et al. (2013); Xiao et al. (2012); Fang et al. (2018a). In this paper, we take WSe2 as a representative for TMD materials. For WSe2, it is estimated that eV and eV. Similar as the graphene case, with strains, the Dirac points are shifted and their locations in momentum space are again given by Eq. 5 and 4. It is found from first principle that the drift parameter is around for WSe2Rostami et al. (2015); Fang et al. (2018b). Of course, it is hard to pin down the exact value of the and it also varies for different TMD materials. Therefore, we treat as a potential tuning parameter to extract general features of the moiré band structure.
In this section, we consider bilayer transition metal dichalcogenide system with only heterostrains for simplicity. It turns out that the bilayer TMD system is a desirable platform for engineering flat bands with strains. We restrict ourselves to a class of heterostrain which is called volume preserving strain. The general form is given by,
| (13) |
Physically, describes that the material is strained by along direction and by along the normal direction. We consider the bilayer system starting from AA stacking configuration, where the inversion symmetry is not present. The AB stacking configuration is an interesting case which we will address in a separate paper. Applying a generic explicitly breaks all the point group symmetries of the system.
For bilayer WSe2 moiré superlattices starting from AA stacking configuration, we need to include both the interlayer tunneling and the intralayer potential in Eq. 8. The interlayer tunneling has the same form as Eq. 11. It is estimated in Ref.Wu et al. (2018) that, for bilayer WSe2, the tunneling parameters are meV, meV and approximately zero because of the large band gap. The intralayer potential has the following formWu et al. (2018)
| (14) |
where . For WSe2, the parameters are meV, meV, and . These data vary slightly for other TMD materials. Thus, we will focus on generic features of the electron band structure which do not rely much on the precise values of these parameters.
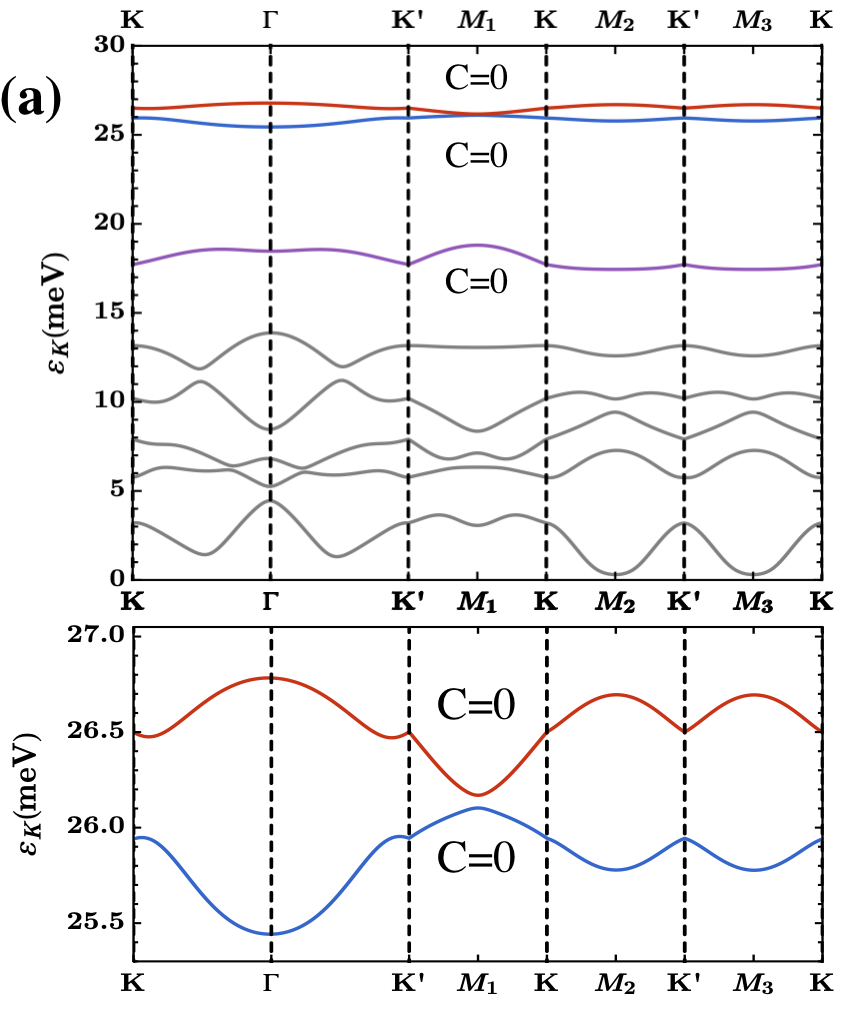
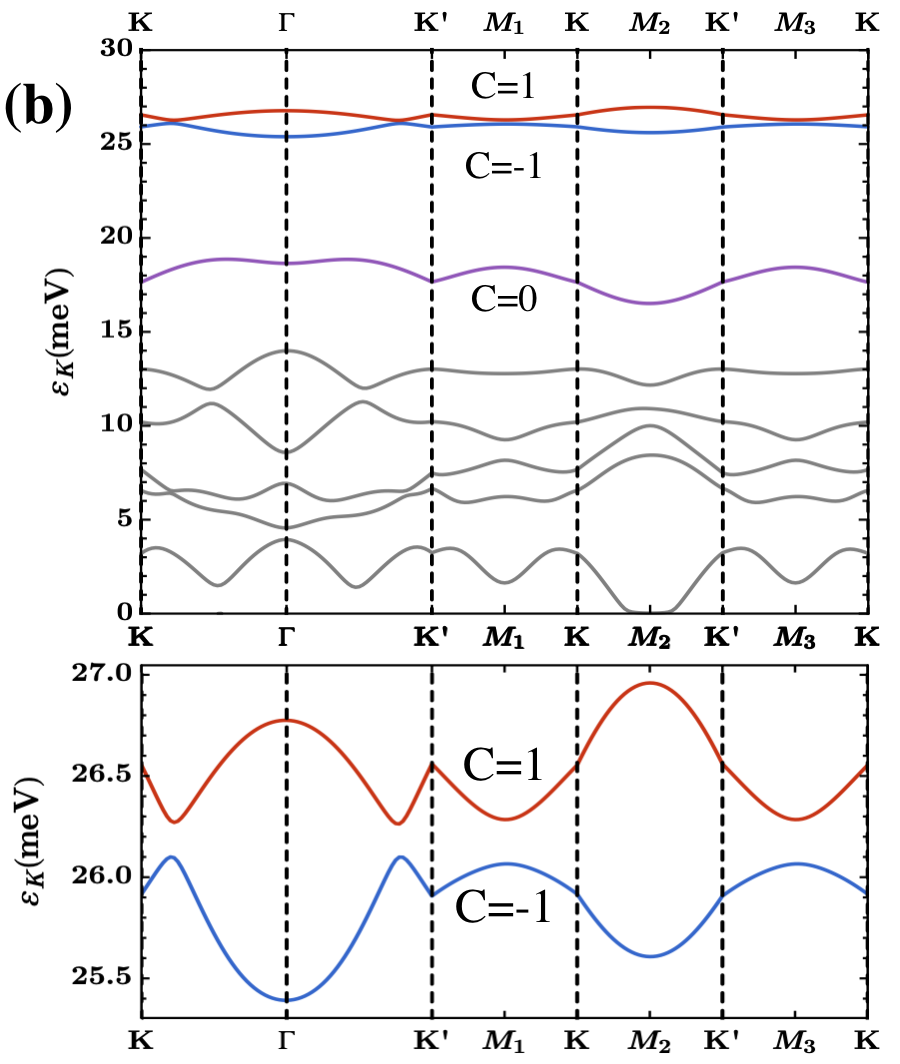
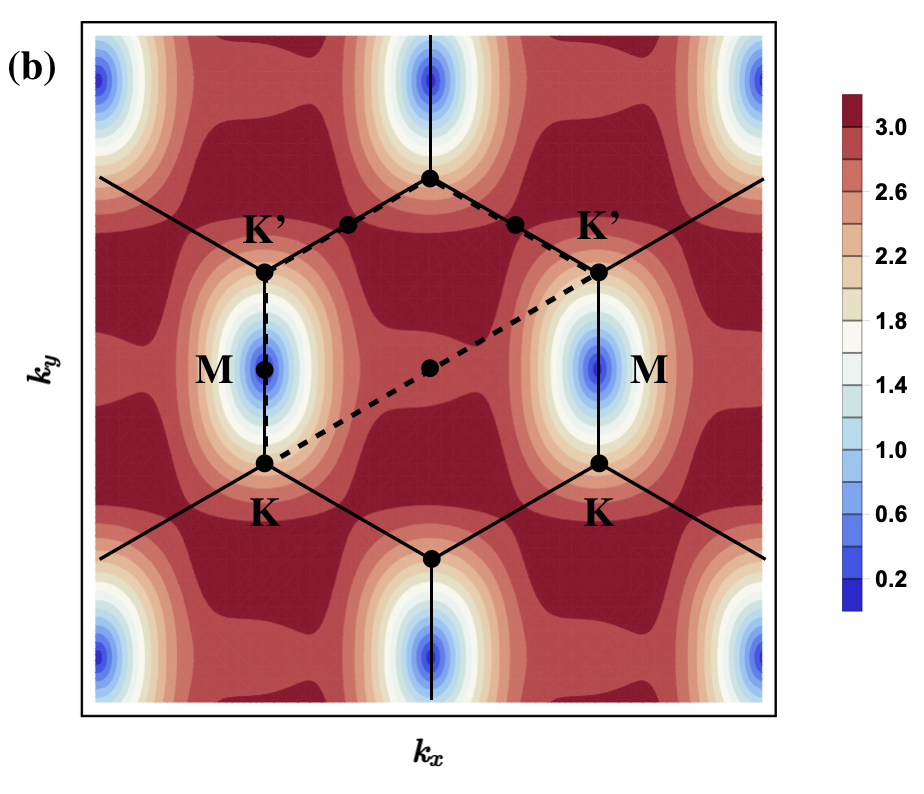
We show the band structure for bilayer WSe2 with heterostrain calculated from the continuum model in Fig. 9. We find generic flat bands near the top of the valance band for small strain magnitude. The top two valence bands are close in energy and have very small bandwidth compared to the large gap separating them to the rest of the spectrum. The third band is also quite flat and energetically separated from other bands. Increasing strain can enlarge the bandwidth and band gap.
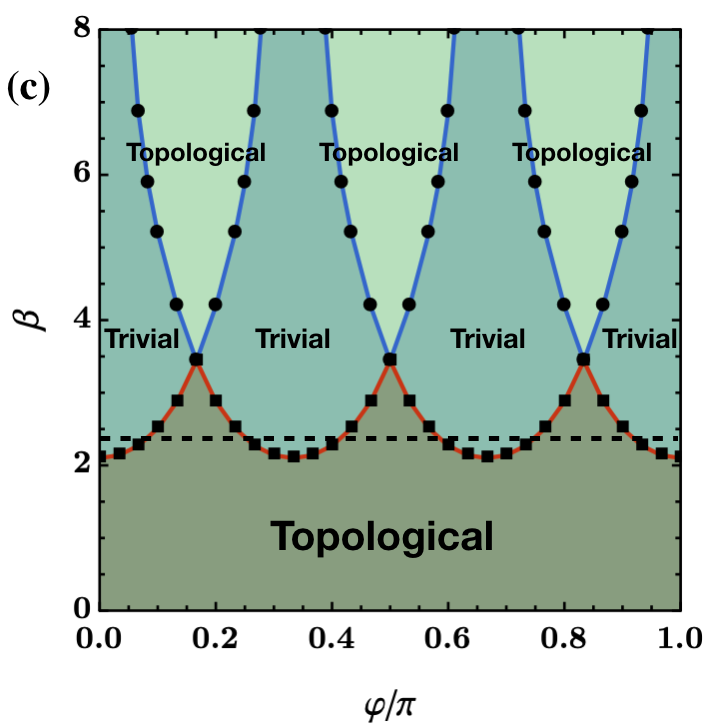
The strain angle provides an additional nob for engineering the band structure. Now we focus on the top two valence bands. In Fig. 10 (c), we show the phase digram as a function of and (the phase diagram is not sensitive to the magnitude of the strain for small ). Interestingly, we find an alternating pattern of topological and trivial bands as a function of . The threefold periodicity of the phase diagram in is due to the emergent threefold rotational symmetry of interlayer coupling (11) and intralayer potential (14). We show the band structure of a critical point at and . The topological phase transition closes the gap with a Dirac dispersion at one of the points in the Brillouin zone.
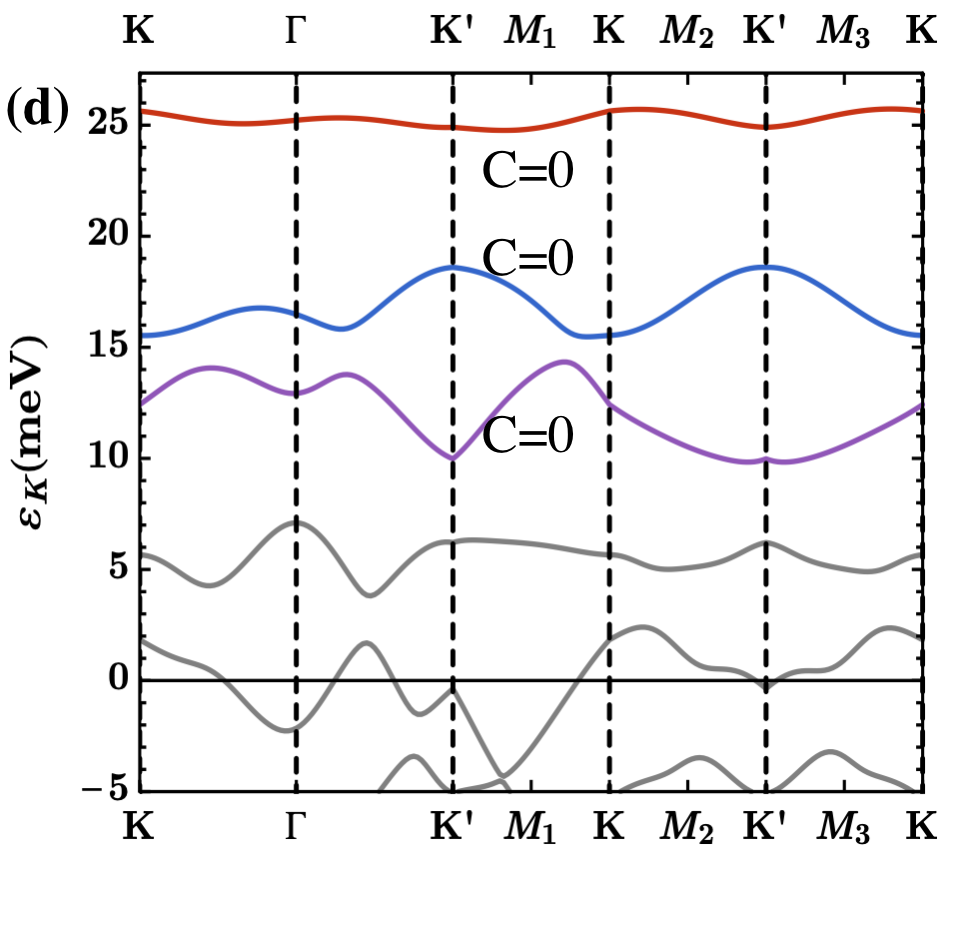
It is worth to mention the displacement field is a good way to control the relative position of the first three bands. With considerable interlayer bias, we can make one band well separated from other bands on the top of the spectrum. In addition, this band is topologically trivial. An example of such band structure is shown in Fig. 10 (d). As expected, the wavefunction of the top band is mostly polarized in one layer.

IV.2 Pressure tunned topological transition
Pressure on the bilayer systems changes the interlayer distance and in return adjusts the relative ratio between the strength of the interlayer tunneling and intralayer potential energy, which is another way to design the moiré band structure. To demonstrate this effect, we consider twisted or heterostrained bilayer TMD with pressure. Pressure can be modeled by introducing a phenomenological parameter in the model Eq. 8, , which represents the relative ratio of interlayer tunneling and intralayer potential. For twisted bilayer TMD at twist angle , we find multiple topological phase transitions between the top three moiré bands as we increase from to as shown in Fig. 11. At , there is a quadratic band touching at in moiré Brillouin zone between the second and third band which shifts the Chern numbers of the two bands by . At , the top two bands touch at with a Dirac dispersion. The top band becomes topologically trivial for . In this system, we can get topological flat bands with chern number . Similar effects also appear in heterostrained cases.


IV.3 Effective model for the flat bands
With small heterostrains, for instance in Fig. 9, for each valley the two top valence bands which are close in energy and very flat (total bandwidth meV), and they are well separated from the rest of the bands (gap meV). One can estimate the Coulomb interaction scale on the moiré superlattice meV, with static dielectric constant of WSe2 Laturia et al. (2018) and moiré superlattice constant nm for . The parameters of the system are in the limit . In addition, the total Chern number for the top two valence bands is trivial. Therefore, we can propose an effective model just for the top two bands. Taking into account of the valley/spin degeneracy, the simplest guess is a 2-band Hubbard model on a triangular lattice, which can be schematically written as the following
| (15) | |||||
where . The two valleys are found to be degenerate in energy, therefore, have an approximate symmetry in the small intervalley-scattering limit. The hopping terms are spatially anisotropic depending on the heterostrain. Half filling the two bands may lead to interesting correlated states, such as valley/spin polarized state, which spontaneously breaks time reversal symmetry.
Aside from the top two valence bands, we can also focus on the third band which is also quite flat and energetically separated from other bands. The Chern number is again trivial for this band with current parameters. The effective model for this band will be a single band triangular lattice Hubbard model with anisotropic hopping terms. Similar model could also describe the physics of the displacement field separated flat band in Fig. 10 (d). This model is previously suggested to be the effective model of the quasi-two-dimensional organic charge transfer salts, which potentially host exotic spin liquid statesKanoda and Kato (2011); Powell and McKenzie (2011).
Finally, we emphasis that the Coulomb interaction scales with the strain as while the bandwidth of the moiré bands scales with the strain as . Therefore, different strains can produce Hubbard models with different ratio.
V Discussion
In this paper, we explore the effects of uniaxial heterostrain in twisted bilayer graphene. It is clear that uniaxial heterostrain generically broadens the bandwidth of the nearly flat bands at magic angle, which could be the reason for the observed large energy separation of van Hove singularities in the STM experimentKerelsky et al. (2018). Large bandwidth may not be desirable for correlation physics. Therefore, future experiments should try to minimize the heterostrain between layers. On the other hand, heterostrain could be helpful to generate higher order van Hove singularities, which is a good platform to enhance correlation effects. A systematic study of the evolution of the van Hove singularities is an interesting but involved subject. Another natural question to ask is whether there are situations in which heterostrain helps to flatten the band dispersions rather than to broaden the bands. To answer these questions, we need more comprehensive studies where optimization methods such as machine learning could be helpful. On the other hand, a full analytical understanding of the strain effect is also demanded for future study.
The other effects of heterostrain are shifting the energies of the two Dirac crossings within one valley and greatly enhancing the Dirac velocity. This could potentially explain the observed 4-fold Landau level degeneracy in magneto transport experimentsCao et al. (2018a, b); Yankowitz et al. (2019). One natural consequence of such scenario is that there will be finite electron/hole fermi surfaces at the charge neutrality point. Nonetheless, due to the enhanced Dirac velocity, the fermi surfaces are estimated within our continuum model to be really small and could be difficult to resolve with current experimental precision. To get a more accurate estimation theoretically, one needs to include various subtle effects such as lattice relaxations, which is beyond the scope of the current paper but a good subject for future investigations.
We also show heterostrain is a good way of creating and tuning flat bands in bilayer TMD systems. There is no requirement of a “magic” strain here. The band structure is easily controlled by the strain direction, pressure and displacement field.
Acknowledgement
We thank Abhay Pasupathy, Cory Dean, Matt Yankowitz and Brian LeRoy for stimulating discussions and communications. ZB is supported through Pappalardo fellowship at MIT. NY and LF are supported by DOE Office of Basic Energy Sciences, Division of Materials Sciences and Engineering under Award DE-SC0018945. LF is partly supported by the David and Lucile Packard Foundation.
References
- Cao et al. (2018a) Y. Cao, V. Fatemi, A. Demir, S. Fang, S. L. Tomarken, J. Y. Luo, J. D. Sanchez-Yamagishi, K. Watanabe, T. Taniguchi, E. Kaxiras, et al., Nature 556, 80 EP (2018a), URL https://doi.org/10.1038/nature26154.
- Cao et al. (2018b) Y. Cao, V. Fatemi, S. Fang, K. Watanabe, T. Taniguchi, E. Kaxiras, and P. Jarillo-Herrero, Nature 556, 43 EP (2018b), URL https://doi.org/10.1038/nature26160.
- Yankowitz et al. (2019) M. Yankowitz, S. Chen, H. Polshyn, Y. Zhang, K. Watanabe, T. Taniguchi, D. Graf, A. F. Young, and C. R. Dean, Science (2019), URL http://science.sciencemag.org/content/early/2019/01/25/science.aav1910.
- Chen et al. (2018) G. Chen, L. Jiang, S. Wu, B. Lv, H. Li, K. Watanabe, T. Taniguchi, Z. Shi, Y. Zhang, and F. Wang, arXiv e-prints arXiv:1803.01985 (2018), eprint 1803.01985.
- Novoselov et al. (2016) K. S. Novoselov, A. Mishchenko, A. Carvalho, and A. H. Castro Neto, Science 353, aac9439 (2016), URL http://science.sciencemag.org/content/353/6298/aac9439.abstract.
- Huder et al. (2018a) L. Huder, A. Artaud, T. Le Quang, G. T. de Laissardière, A. G. M. Jansen, G. Lapertot, C. Chapelier, and V. T. Renard, Phys. Rev. Lett. 120, 156405 (2018a), URL https://link.aps.org/doi/10.1103/PhysRevLett.120.156405.
- Guinea (2012) F. Guinea, Solid State Communications 152, 1437 (2012), URL http://www.sciencedirect.com/science/article/pii/S0038109812002256.
- Frisenda et al. (2017) R. Frisenda, M. Drüppel, R. Schmidt, S. Michaelis de Vasconcellos, D. Perez de Lara, R. Bratschitsch, M. Rohlfing, and A. Castellanos-Gomez, npj 2D Materials and Applications 1, 10 (2017), URL https://doi.org/10.1038/s41699-017-0013-7.
- Tang and Fu (2014) E. Tang and L. Fu, Nature Physics 10, 964 EP (2014), URL https://doi.org/10.1038/nphys3109.
- Kerelsky et al. (2018) A. Kerelsky, L. McGilly, D. M. Kennes, L. Xian, M. Yankowitz, S. Chen, K. Watanabe, T. Taniguchi, J. Hone, C. Dean, et al., arXiv e-prints arXiv:1812.08776 (2018), eprint 1812.08776.
- Nam and Koshino (2017) N. N. T. Nam and M. Koshino, Phys. Rev. B 96, 075311 (2017), URL https://link.aps.org/doi/10.1103/PhysRevB.96.075311.
- Liu et al. (2013) G.-B. Liu, W.-Y. Shan, Y. Yao, W. Yao, and D. Xiao, Phys. Rev. B 88, 085433 (2013), URL https://link.aps.org/doi/10.1103/PhysRevB.88.085433.
- Xiao et al. (2012) D. Xiao, G.-B. Liu, W. Feng, X. Xu, and W. Yao, Phys. Rev. Lett. 108, 196802 (2012), URL https://link.aps.org/doi/10.1103/PhysRevLett.108.196802.
- Fang et al. (2018a) S. Fang, S. Carr, M. A. Cazalilla, and E. Kaxiras, Phys. Rev. B 98, 075106 (2018a), URL https://link.aps.org/doi/10.1103/PhysRevB.98.075106.
- Bistritzer and MacDonald (2011) R. Bistritzer and A. H. MacDonald, Proceedings of the National Academy of Sciences 108, 12233 (2011), ISSN 0027-8424, eprint https://www.pnas.org/content/108/30/12233.full.pdf, URL https://www.pnas.org/content/108/30/12233.
- Lopes dos Santos et al. (2012) J. M. B. Lopes dos Santos, N. M. R. Peres, and A. H. Castro Neto, Phys. Rev. B 86, 155449 (2012), URL https://link.aps.org/doi/10.1103/PhysRevB.86.155449.
- Lopes dos Santos et al. (2007) J. M. B. Lopes dos Santos, N. M. R. Peres, and A. H. Castro Neto, Phys. Rev. Lett. 99, 256802 (2007), URL https://link.aps.org/doi/10.1103/PhysRevLett.99.256802.
- Yuan and Fu (2018) N. F. Q. Yuan and L. Fu, Phys. Rev. B 98, 045103 (2018), URL https://link.aps.org/doi/10.1103/PhysRevB.98.045103.
- Koshino et al. (2018) M. Koshino, N. F. Q. Yuan, T. Koretsune, M. Ochi, K. Kuroki, and L. Fu, Phys. Rev. X 8, 031087 (2018), URL https://link.aps.org/doi/10.1103/PhysRevX.8.031087.
- Castro Neto et al. (2009) A. H. Castro Neto, F. Guinea, N. M. R. Peres, K. S. Novoselov, and A. K. Geim, Rev. Mod. Phys. 81, 109 (2009), URL https://link.aps.org/doi/10.1103/RevModPhys.81.109.
- Huder et al. (2018b) L. Huder, A. Artaud, T. Le Quang, G. T. de Laissardière, A. G. M. Jansen, G. Lapertot, C. Chapelier, and V. T. Renard, Phys. Rev. Lett. 120, 156405 (2018b), URL https://link.aps.org/doi/10.1103/PhysRevLett.120.156405.
- Qiao et al. (2018) J.-B. Qiao, L.-J. Yin, and L. He, Phys. Rev. B 98, 235402 (2018), URL https://link.aps.org/doi/10.1103/PhysRevB.98.235402.
- Yuan et al. (2019) N. F. Q. Yuan, H. Isobe, and L. Fu, arXiv e-prints arXiv:1901.05432 (2019), eprint 1901.05432.
- Rostami et al. (2015) H. Rostami, R. Roldán, E. Cappelluti, R. Asgari, and F. Guinea, Phys. Rev. B 92, 195402 (2015), URL https://link.aps.org/doi/10.1103/PhysRevB.92.195402.
- Fang et al. (2018b) S. Fang, S. Carr, M. A. Cazalilla, and E. Kaxiras, Phys. Rev. B 98, 075106 (2018b), URL https://link.aps.org/doi/10.1103/PhysRevB.98.075106.
- Wu et al. (2018) F. Wu, T. Lovorn, E. Tutuc, I. Martin, and A. H. MacDonald, arXiv e-prints arXiv:1807.03311 (2018), eprint 1807.03311.
- Laturia et al. (2018) A. Laturia, M. L. Van de Put, and W. G. Vandenberghe, npj 2D Materials and Applications 2, 6 (2018), URL https://doi.org/10.1038/s41699-018-0050-x.
- Kanoda and Kato (2011) K. Kanoda and R. Kato, Annual Review of Condensed Matter Physics 2, 167 (2011), eprint https://doi.org/10.1146/annurev-conmatphys-062910-140521, URL https://doi.org/10.1146/annurev-conmatphys-062910-140521.
- Powell and McKenzie (2011) B. J. Powell and R. H. McKenzie, Reports on Progress in Physics 74, 056501 (2011), URL http://stacks.iop.org/0034-4885/74/i=5/a=056501.