iint \restoresymbolTXFiint
On the iron ionization balance of cool stars
Abstract
High-resolution spectroscopic studies of solar-type stars have revealed higher iron abundances derived from singly ionized species compared to neutral, violating the ionization equilibrium under the assumption of local thermodynamic equilibrium. In this work, we investigate the overabundances of Fe ii lines reported in our previous work for a sample of 451 solar-type HARPS stars in the solar neighborhood. The spectroscopic surface gravities of this sample which emerge from the ionization balance, appear underestimated for the K-type stars. In order to understand this behavior, we search our Fe ii line list for unresolved blends and outliers. First, we use the VALD to identify possible unresolved blends around our lines and calculate which ones are strong enough to cause overestimations in the equivalent width measurements. Second, for our sample we use reference parameters (effective temperature and metallicity) and the Gaia DR2 parallaxes to derive surface gravities (trigonometric gravities) and calculate the Fe i and Fe ii abundances from different line lists. We exclude the Fe ii lines which produce overabundances above 0.10 dex. The derived surface gravities from the clean line list are now in agreement with the trigonometric. Moreover, the difference between Fe iand Fe ii abundance does not show now a correlation with the effective temperature. Finally, we show that the ionization balance of Ti can provide better estimates of surface gravities than iron. With this analysis, we provide a solution to the ionization balance problem observed in the atmospheres of cool dwarfs.
keywords:
techniques: spectroscopic, surveys, stars: fundamental parameters, abundances1 Introduction
A standard method to determine the atmospheric parameters via spectroscopy is to measure the equivalent widths (EW) of several spectral lines of a metallic species and calculate their abundances. Then, we derive the effective temperature () and surface gravity () of a star when excitation and ionization balances are satisfied simultaneously under the assumption of local thermodynamic equilibrium (LTE). In most cases, we use neutral and singly ionized iron lines because they are numerous and well studied in terms of their atomic data in the optical wavelength region. This method has been successfully applied to a plethora of studies for FGK-type stars from the characterization of Galactic stellar populations (e.g. Adibekyan et al., 2012) to the characterization of planet-host stars (e.g. Santos et al., 2013) mainly with high resolution spectroscopy. Even though the above methods provide high enough precision and accuracy for and metallicity111We note that in this study we use iron as a proxy for the overall metallicity which is defined as: – , where N is the number of atoms per unit volume. Iron abundance is defined as: + 12., the determination of surface gravity shows some caveats (see Morel & Miglio, 2012; Mortier et al., 2014, for surface gravity comparisons between different methods) and is difficult to constrain from the ionization balance of iron lines because the neutral-to-singly-ionized ratio is not very sensitive to gravity changes compared to other ionization levels (see Gray, 2005). Moreover, the number of ionized lines is very limited compared to neutral lines in the optical.
Several works in high resolution report discrepancies between neutral and singly ionized iron abundances for dwarf stars in several open clusters (Hyades, Pleiades, and M34) and the Ursa Major moving group without considering non-LTE effects (Yong et al., 2004; Schuler et al., 2006; Chen et al., 2008; Schuler et al., 2010; Aleo et al., 2017). The discrepancies are stronger for the cooler stars ( 5200 K) with systematic higher Fe ii abundance over Fe i. The enhanced Fe ii abundances over Fe i can be quite significant, for example in the high resolution study of Pleiades the difference reaches up to 0.8 dex (Schuler et al., 2010). The deviation from the ionization balance for the cooler dwarfs is also present in field stars in the solar neighborhood (Allende Prieto et al., 2004; Ramírez et al., 2007; Bensby et al., 2014). In this work, we refer as the ionization balance problem, the observed differences between Fe i and Fe ii abundances in LTE and not to the LTE departures when the mean intensity, Jν, is larger than the Planck function, Bν, for species in their minority ionization stage in the ultraviolet wavelengths (e.g. Asplund, 2005).
Departures from the LTE were suggested as responsible for the Fe i–Fe ii discrepancy affecting the correct determination for very metal-poor stars (Korn et al., 2003; Ruchti et al., 2013) but they are not expected to occur around solar metallicity K-type dwarfs (Lind et al., 2012). In addition, other model uncertainties related to granulation and activity of K-type stars have been proposed to explain these differences in the case of HIP 86400 (Ramirez, 2008) but to be fully understood 3D non-LTE investigations should be carried out (Amarsi et al., 2016).
Alternatively, if the adopted stellar parameters are not correct, the iron abundances will not be correct either. For example, if we increase the of a K-type star by 100 K which is a typical error, this leads to a reduction of the Fe ii abundance by 0.15 dex but leaves the Fe i abundance almost unchanged.
The ionization imbalance affects directly the determination of surface gravity when it is derived from the Fe i–Fe ii tuning. The comparison of surface gravity from spectroscopy and estimated from more direct methods such as using astrometry (trigonometric ), shows spurious correlations with with higher deviations for the cooler stars (Tsantaki et al., 2013; Tabernero et al., 2017; Delgado Mena et al., 2017). In the Gaia era, we have precise parallaxes for a huge number of stars, and therefore, trigonometric gravities can be used as reference, assuming well constrained , to test the accuracy of spectroscopic .
This spectroscopic method relies significantly on the quality of the iron line list and has to be carefully selected. In previous work, we showed that blended iron lines can produce overestimations in the spectroscopic effective temperature scale compared to the photometric one (Tsantaki et al., 2013, hereafter TS13). Also, Aleo et al. (2017) recently showed that a careful selection of their Fe ii lines can decrease the Fe i–Fe ii differences for K-type stars in the Hyades cluster but not eliminate them.
In this work, we use high resolution spectra of a well-studied sample of solar-type dwarfs to investigate if the observed overabundances of Fe ii in the literature arise from the quality of the iron line list. If this is the case for the Fe i–Fe ii discrepancy, other mechanisms are not necessary, at least in first order, to explain the ionization balance problem. Under this assumption, a selection of optimal iron lines to solve the ionization balance problem will also eliminate the differences between the spectroscopic and trigonometric gravities and their trends with .
2 The iron line list
The compilation of the iron line list is very important for the abundance analysis, especially for the cooler stars because their spectra are highly line crowded and the EW of these spectral lines cannot be measured accurately. Our line list is taken from TS13 which was visually checked to discard blended lines in the cooler stars. The effective temperature and metallicity derived with the TS13 line list have been compared with other literature sources and have been validated for their accuracy. For example, the comparison of the from TS13 with more model independent methods, such as the infrared flux method (IRFM) and interferometry showed very good agreement, and the metallicity is in agreement with Sousa et al. (2008). We note that the metallicity in TS13 is derived only from Fe i lines and the from the excitation balance of the Fe i lines. Therefore, the Fe i lines of this list are reliable enough to estimate effective temperatures and metallicities. However, the TS13 line list failed to provide accurate surface gravities in particular for the cooler stars (< 5200 K). As mentioned before, we obtain surface gravity with this method by forcing Fe i and Fe ii abundances to be equal. We suggest that the Fe ii lines must mostly contribute to the wrong surface gravity estimates we observe. Therefore, we search for unresolved blends around the Fe ii lines in the TS13 line list which contains 120 Fe i and 18 Fe ii lines. The Fe i lines are more numerous than Fe ii and the latter are more difficult to be found isolated. Also, because of their small number their dispersion in abundances is high and usually a 3 clipping of outliers which is a commonly used does not work.
In the following Sections, we perform two separate tests to select the optimal Fe ii lines for our abundance analysis.
2.1 Searching for blends in VALD
With this test we want to discover unresolved blends which cannot be detected neither by visual inspection nor by our automated tools. In this case, these lines will be fitted by a single Gaussian instead of two (or more), leading to an overestimation of their true EW. In our works, we use ARES222ARES 2.0: http://www.astro.up.pt/ sousasag/ares (Sousa et al., 2015) for the automatic EW measurements which has been extensively used in the literature for high resolution studies (e.g. for the Gaia-ESO survey, Smiljanic et al., 2014; Jofré et al., 2014). The suggested distance of two consecutive lines to be resolved as separate with ARES is more than 0.07 Å for high resolution spectra and specifically, this value has been set for the analysis of the HARPS GTO planet search sample (Sousa et al., 2008; Sousa et al., 2011). Ideally, this value should be set depending on spectral type, instrumental resolution, and signal-to-noise ratio but since it is difficult to evaluate this value per spectrum, we use the default value provided for ARES in this work. This test is based on the idea that since ARES cannot resolve two lines in shorter distance than 0.07 Å, the unresolved blends will be inside the intervals of 0.14 Å wide. To be conservative, we select wider intervals, 0.20 Å wide, and we query around our Fe ii lines within these intervals for all possible lines from the Vienna Atomic Line Database333VALD: http://vald.inasan.ru/ vald3/php/vald.php (VALD; Piskunov et al., 1995; Kupka et al., 1999; Ryabchikova et al., 2015).
VALD includes dozens of lines in our regions to be potential blends. However, not all lines that appear inside the intervals lead to overestimation of the iron EW because their strengths depend on the physical conditions in the atmospheres they are formed. For example, ionic metallic lines are stronger in the atmospheres of the hotter stars.
We calculate the theoretical EW for all the VALD lines to find which ones are strong enough relative to the EW of the Fe ii line in each interval. For this analysis, we use the
atomic data (oscillator strengths, ) from VALD, the spectral analysis code, MOOG444MOOG 2017: http://verdi.as.utexas.edu/moog.html
(ewfind driver, Sneden, 1973; Sneden et al., 2012), and a Kurucz (1993) Atlas 9 model atmosphere of a cool star (HD 21749: = 4562 K, = 4.58 dex, = 0.02 dex).
We define a quantity to show the isolation degree of each Fe ii line similarly to Boeche &
Grebel (2016). We define the Fe ii lines as blended if the EW of each potential blend
relative to the sum of the EW of the iron line plus the EW of the potential blend is higher than a threshold value.555The expression of the blend threshold we use is:
threshold = blend / (blend + iron line) The higher the threshold value, the less lines will be considered blended. We selected three indicative threshold values of 10%, 20%, and 50%.
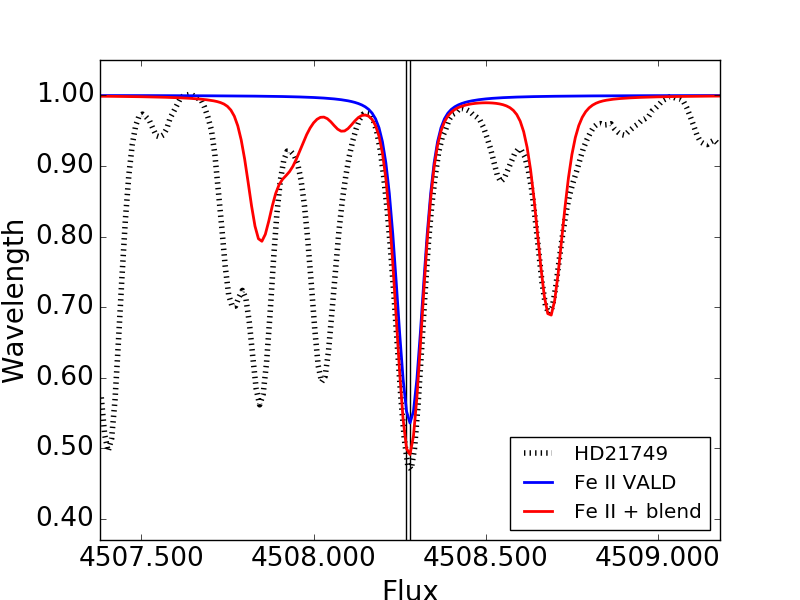
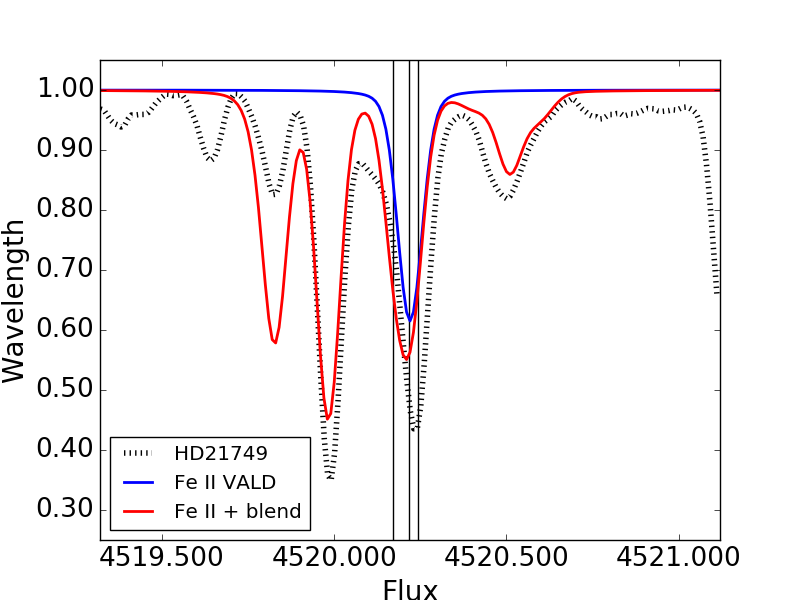
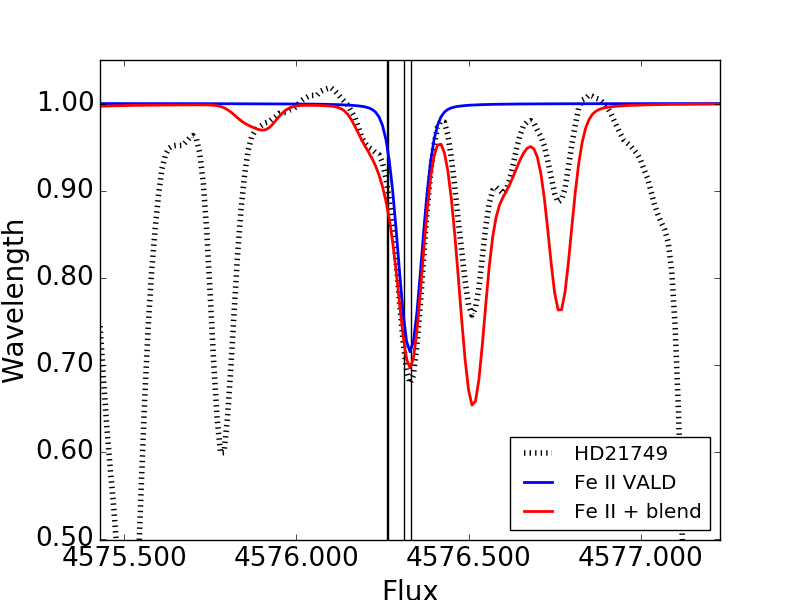
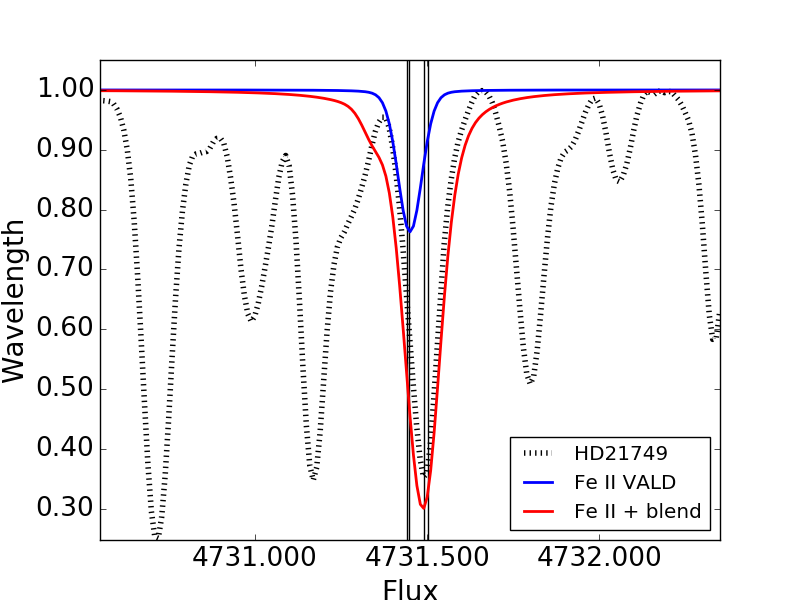
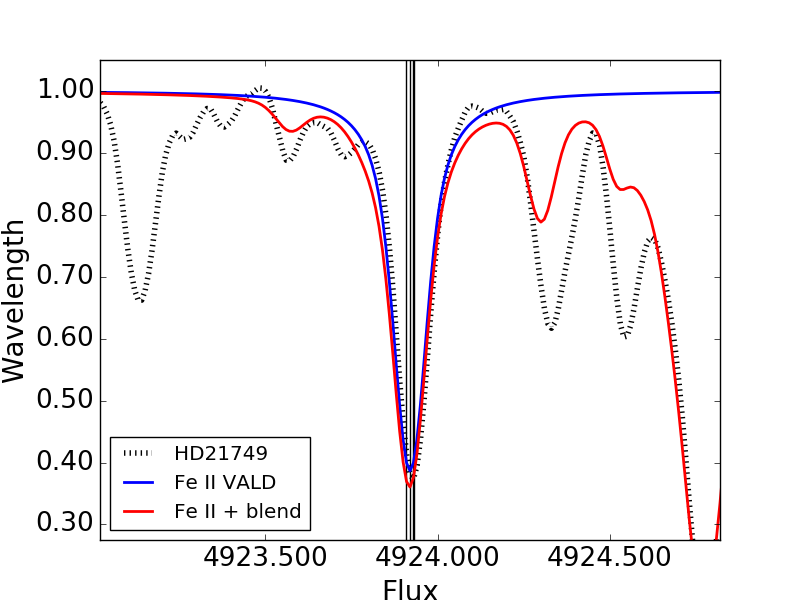
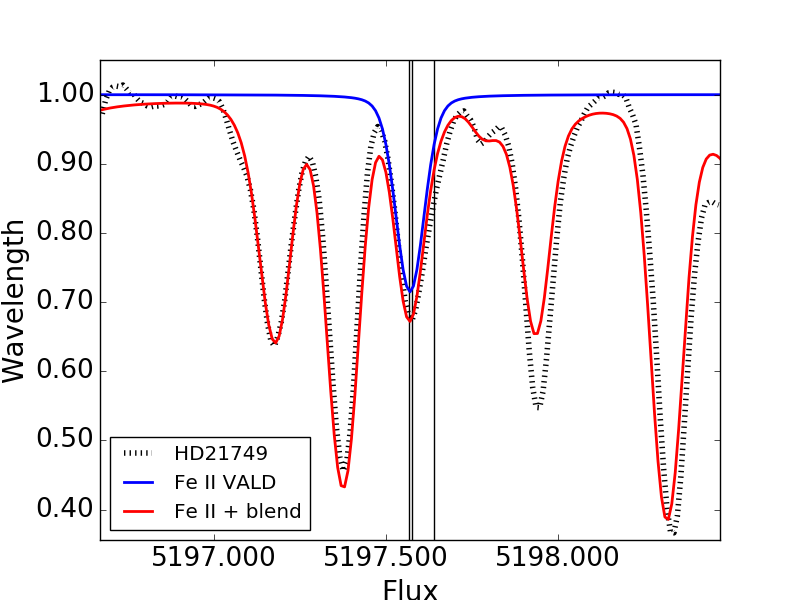
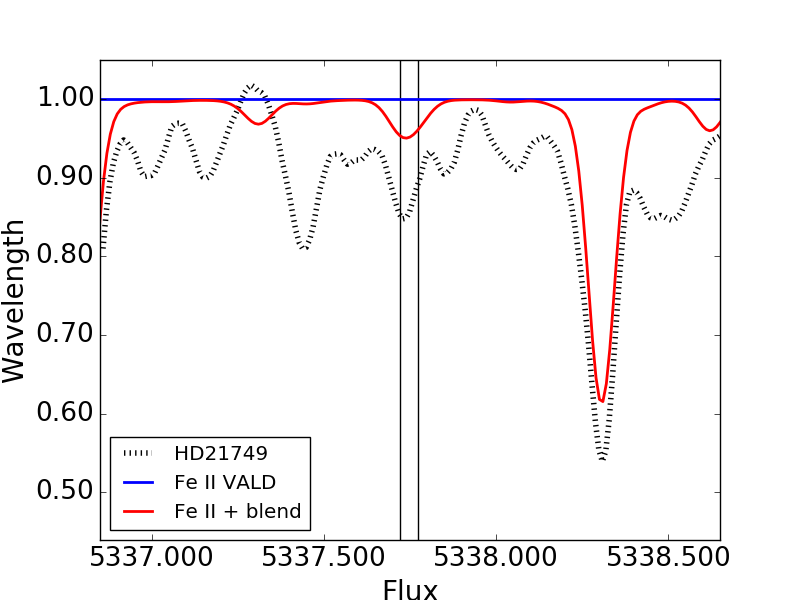
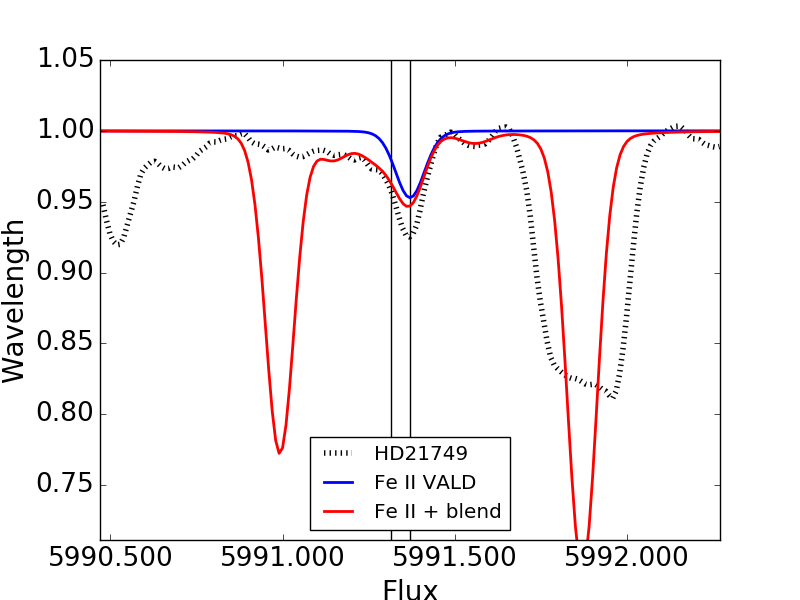
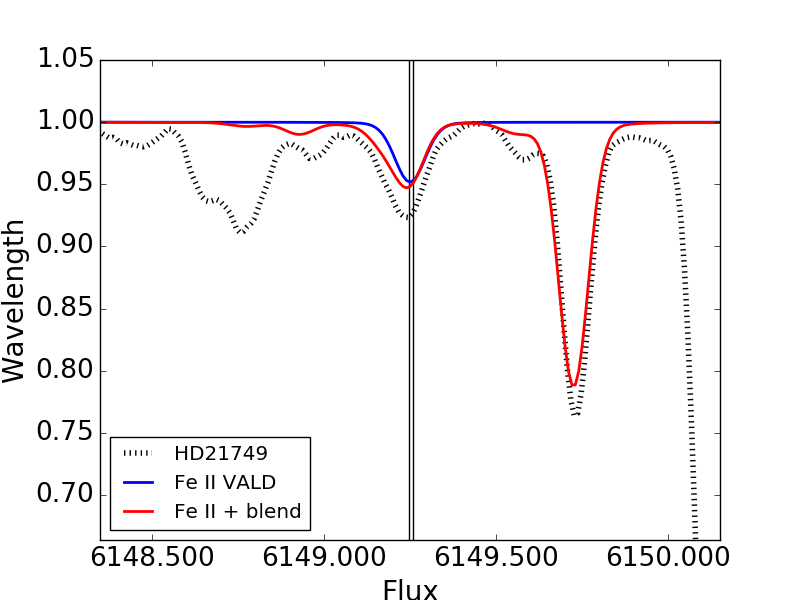
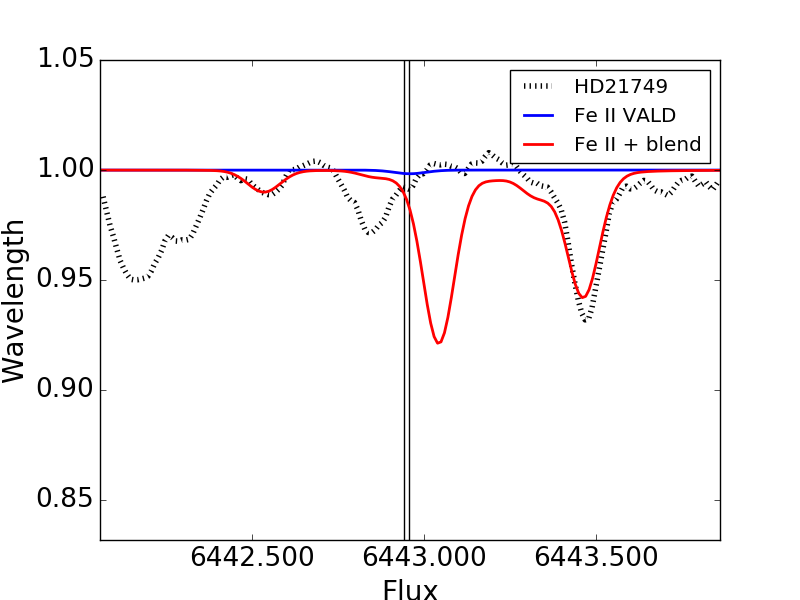
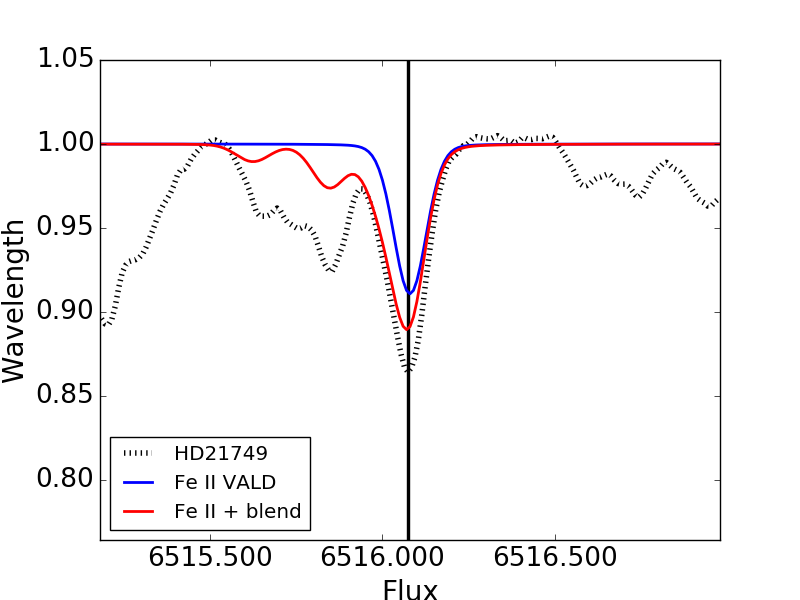
The results are shown in Table 1. With this analysis, we find that using a 10% threshold, 11 lines appear to be blended: 4508.28, 4520.22, 4576.33, 4731.45, 4923.93, 5197.57,
5337.72, 5991.37, 6149.25, 6442.97, and 6516.08 Å.
In Fig. 1, we use MOOG (synth driver) to synthesize the iron lines which appear blended, and their blends for the same model atmosphere. The lines which pass the 50% blending threshold are 4731.45, 5337.72, and 6442.97 Å. The first appears visually most blended in Fig. 1 and the latter two are too weak (EW 0 mÅ) for abundance analysis in this atmosphere.
|
||||||||||||||||||||||||||||||||||||||||||||||||||||||||||||||||||||||||||||||||||||||||||||||||||||||||||||||||||||||||||||||||||||||||||||||||||||||||||||||||||||||||||||||||||||||||
Before we exclude any of these lines, we have to consider that because of inaccurate atomic data from VALD, their theoretical EW could either be over- or under-predicted and mislead us whether an iron line is blended or not. Moreover, the TS13 line list uses calibrated atomic data with respect to the Sun which means in case of a blended iron line in the solar spectrum, the calibrated value is calculated from the EW of the total blend. If the blend has similar behavior as Fe ii, the calibrated can mitigate the effects of blending and probably will deliver a reliable abundance. Therefore, we need to combine other tests along with this analysis to confidently exclude the bad lines.
2.2 Searching for outliers using HARPS spectra
We use a sample of 451 FGK-type dwarfs to estimate empirically which iron lines give outlying abundances that are too high to reconcile with the majority for each spectrum. The sample is part of the HARPS GTO planet search program (Mayor et al., 2003) with very high spectral quality, resolution of 110 000, and 90% of their spectra have signal-to-noise ratio higher than 200. The stellar parameters of this sample were derived by imposing excitation and ionization equilibria on weak iron lines with MOOG, using the Kurucz (1993) Atlas 9, plane parallel, 1D static models in LTE. The same model atmospheres are used throughout this paper unless specified. These stars were firstly analyzed in terms of their parameters by Sousa et al. (2008) and secondly by Tsantaki et al. (2013) with the same method but a shorter line list to correct for overestimations in the effective temperature for the cooler stars. As mentioned before, their effective temperatures and metallicities are in very good agreement with various spectroscopic and photometric works and thus, we consider these parameters very reliable to be used as reference.
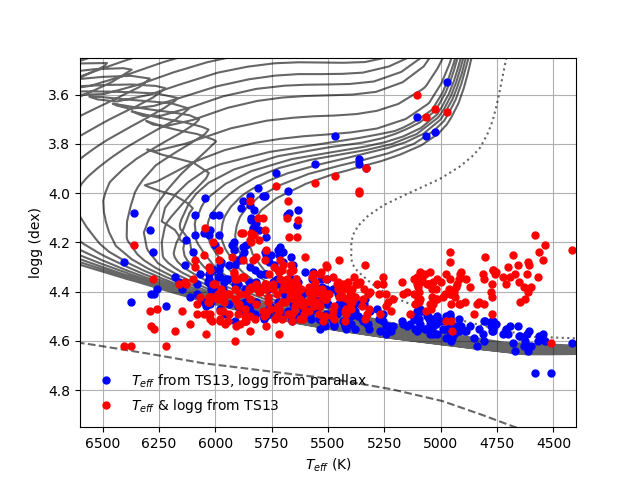
Even though the effective temperatures agree very well with more model-independent methods, such as the IRFM, surface gravities on the other hand, appear flat in the Hertzsprung-Russell (HR) diagram for the cooler stars (Fig. 2). More reliable surface gravities are obtained from methods with less model dependence, such as asteroseismology or from dynamic mass and radius measurements in eclipsing binary systems. However, these measurements for dwarf stars are limited to a relatively small number. With the Gaia mission (Gaia Collaboration et al., 2018), we have access to parallaxes with unprecedented precision for millions of stars. In lack of the other direct estimates, trigonometric gravities are very useful to test our spectroscopic determinations. Trigonometric gravities are derived from the following expression:
| (1) |
where M is the stellar mass, V the visual magnitude, BC the bolometric correction, and the parallax in mas. From the above expression, we derived the trigonometric for the 451 HARPS stars with the Gaia DR2 parallaxes (Luri et al., 2018), V magnitudes from the Hipparcos catalog (Perryman et al., 1997), bolometric correction based on Flower (1996) and Torres (2010), solar magnitudes from Bessell et al. (1998), and the of TS13. No correction for interstellar reddening is needed since all stars are less than 56 pc in distance. Because of systematics in the Gaia DR2 parallaxes, we add a conservative value of 0.03 mas proposed by the Gaia collaboration (Lindegren et al., 2018). Moreover, we increase the errors in parallaxes to consider the 30% underestimation in uncertainties for bright stars (Luri et al., 2018; Arenou et al., 2018). Stellar masses are derived from the PARAM 1.3 tool666PARAM 1.3 tool: http://stev.oapd.inaf.it/cgi-bin/param_1.3 using the PARSEC theoretical isochrones from Bressan et al. (2012) and a Bayesian estimation method (da Silva et al., 2006). The trigonometric are also depicted in Fig. 2 which follow the expected isochrones for the solar neighborhood.
First, we measure the EW of the complete TS13 line list for all spectra with ARES. Then, we use our reference spectroscopic , , and microturbulence from TS13, and the trigonometric gravities to derive the individual Fe i and Fe ii abundances for each star with MOOG (abfind driver) using a curve-of-growth approach. As mentioned before, the values of the line list are calibrated to match the solar abundances ( = 7.47 dex) while the collisional broadening parameters (van der Waals damping) are based on the Unsold (1955) approximation with an enhancement factor recommended by the Blackwell group777The enhancement factor, E, is given by the relation: E = 1 + 0.67EP, where EP is the excitation potential of the specific line. (damping option 2 within MOOG for the 2017 version).
Even though the strength of a weak line is dominated by the Doppler core rather than the Lorentzian wings, large uncertainties in the damping parameters affect the derived abundances even for weak lines (see e.g. Ryan, 1998). A different approach to determine damping parameters is described by the ABO theory (Anstee & O’Mara, 1991; Barklem et al., 1998, 2000) which uses cross sections to determine the individual damping values. The TS13 line list contains 115 out of 137 lines with damping based on the ABO theory from Barklem et al. (2000). All of the Fe ii lines have Barklem et al. (2000) damping data. We evaluate how the two different damping approaches affect the abundances of the Fe ii lines. Before we do that, we recalibrate the values for the damping of Barklem et al. (2000) using the Sun as reference with a solar spectrum from HARPS. The recalibration is essential because the initial TS13 line list was calibrated with the Blackwell damping.
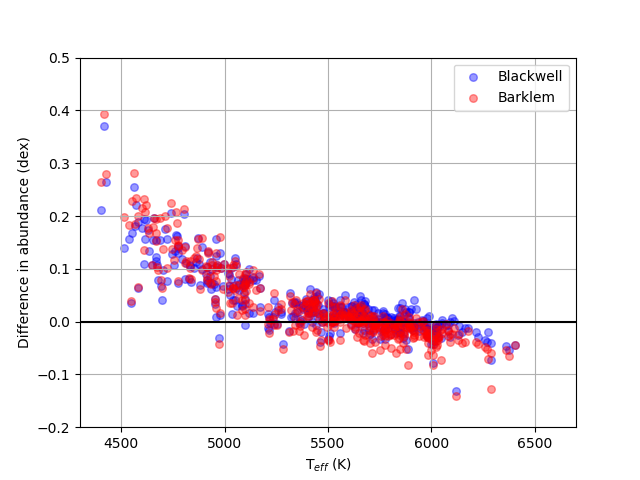
In Fig. 3, we plot the difference between Fe ii – Fe i for the 451 stars using the different damping parameters. In the traditional LTE approach, the differences should be zero but in our case they are enhanced for the cooler stars (0.3 dex) and this is the typical ionization balance problem that is reported in the literature. We notice that there is no distinction from this plot which damping approach performs better as in both cases the differences in the iron abundances are equally large.
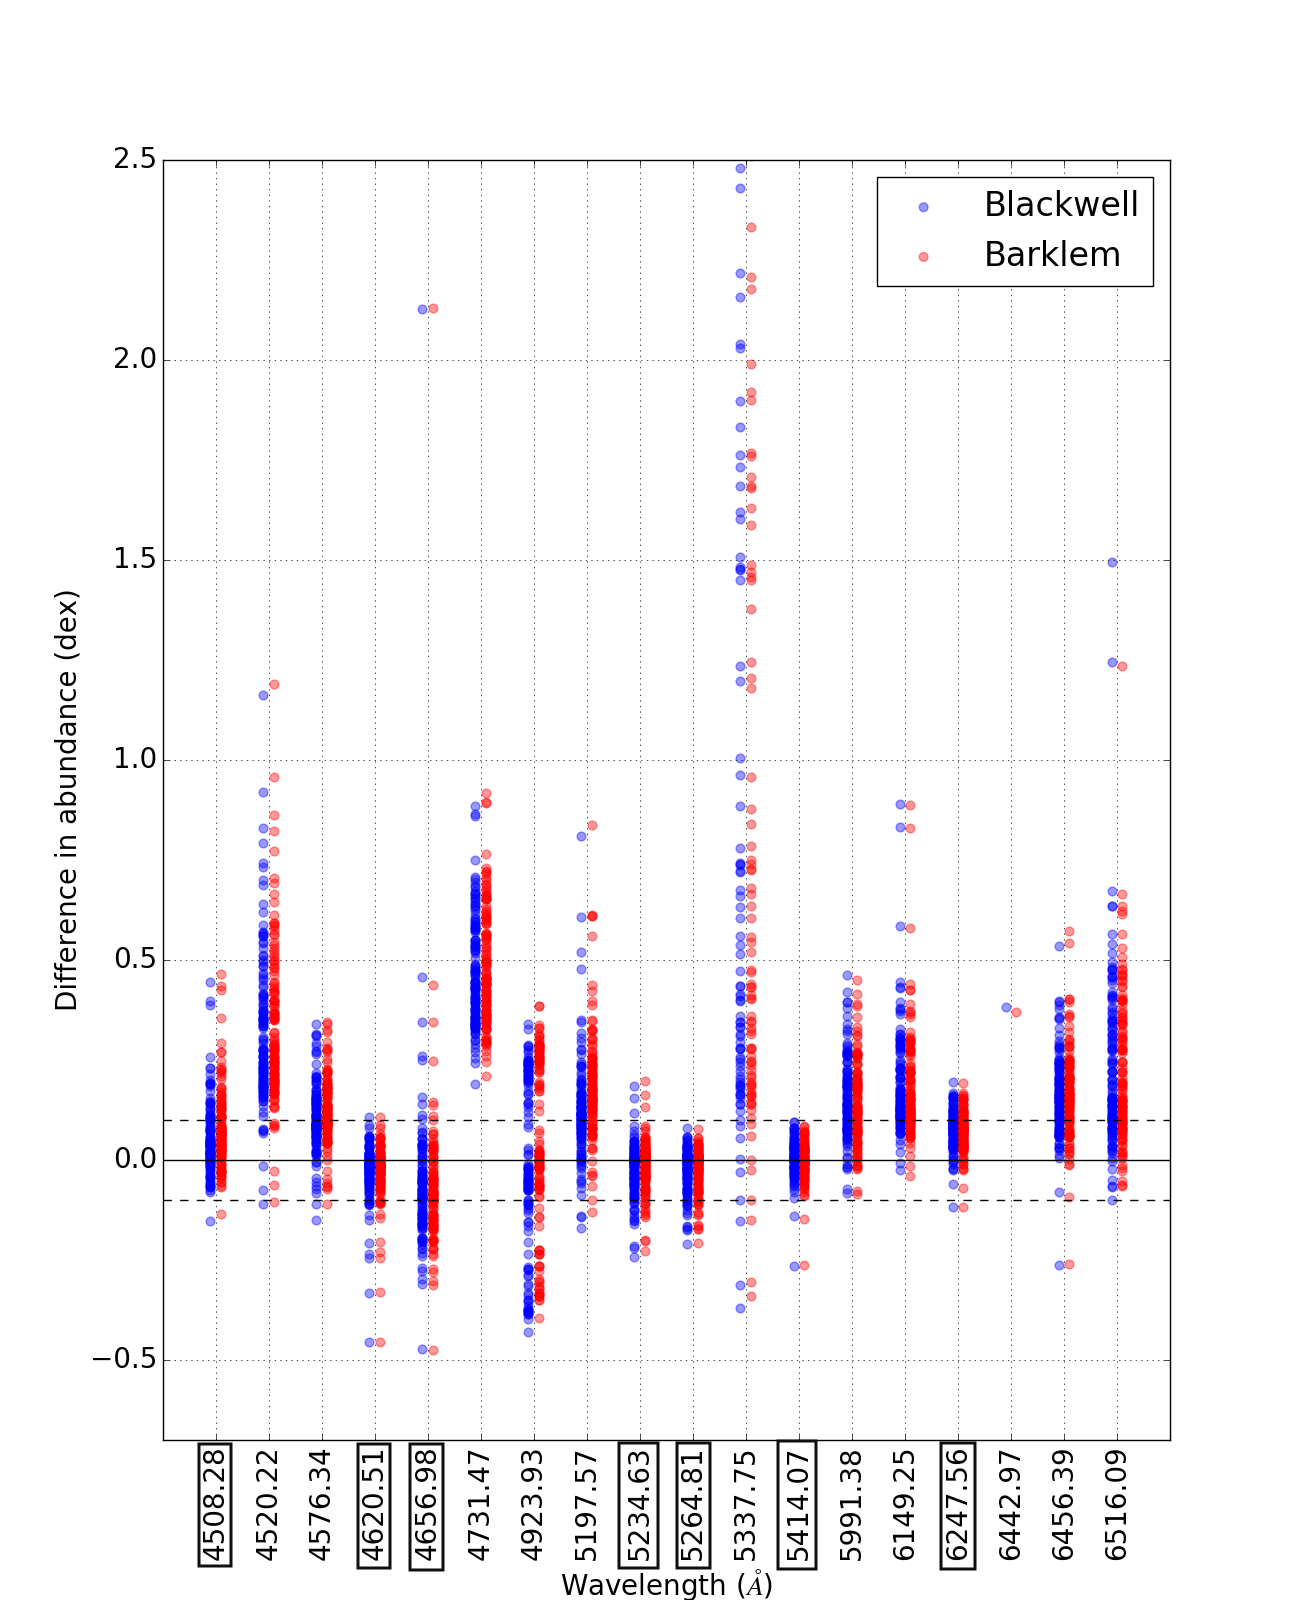
Our goal is to select the Fe ii lines which produce the same abundance as Fe i (which is equal to the total iron abundance since it is measured only from Fe i lines). In Fig. 4, we present the differences of the overall iron abundance minus the abundance of each Fe ii line for the cooler stars (134 stars) since the Fe ii overabundances are more evident for < 5200 K using the two different damping approaches. The results of all Fe ii lines are also presented in Table 1. We exclude lines with median difference higher than 0.10 dex and at the same time their mean absolute deviation is above 3 following a similar analysis as in Sousa et al. (2014). For a cool star, a difference of 0.10 dex in the Fe ii – Fe i abundance can be produced by an underestimation of 0.15 dex in which corresponds to the differences we roughly observe in Fig. 2 between the spectroscopic and trigonometric and therefore can be a valid limit to exclude Fe ii lines. Both damping approaches give similar differences, within 0.02 dex, but the highest reaches 0.06 dex for the 5197.57 Å. In both cases the same lines are excluded.
The remaining good lines are: 4508.28, 4620.51, 4656.98, 5234.63, 5264.81, 5414.07, 6247.56 Å. The line 6442.97 Å is too weak to appear in stars with < 5200 K but we include it because for the hotter stars gives differences smaller than 0.10 dex for the same analysis but for the rest of the sample). We note that for stars with > 5200 K, all lines give differences below 0.10 dex, except for 5337.72 Å. We confirm that 10 out of 11 lines from the previous analysis in Sect. 2.1 are also classified as bad in this test, suggesting they are in fact blended. The reasons for the rest of the lines which give overabundances in this test could be related to bad EW measurements either because they are in regions difficult to normalize correctly or their atomic data are not accurate. To include these reasons, we adopt this Fe ii line list as more robust compared to the one in Sect. 2.1.
We also performed the same analysis but this time we used the MARCS (Gustafsson et al., 2008) model atmospheres to check whether the iron abundances differ significantly depending on the choice of model atmospheres. To have meaningful results, we recalibrate the atomic data of our line list with a MARCS solar model atmosphere and derive the Fe ii – Fe i abundances. We discover that the differences are almost identical to the ones derived with Kurucz models and subsequently the same lines were excluded.
Summarizing, we exclude 55% of the lines (10 out of 18) showing the difficulty to find good Fe ii lines in the optical.
2.3 Comparison with other line lists
There are numerous iron line lists in the literature used for high resolution studies. In this Section, we check how two line lists perform in order to extend our number of good Fe ii lines or obtain improved atomic data by comparing lines in common. The two line lists are: 12 Fe ii lines from the Gaia-ESO ’golden’ list (Jofré et al., 2014), and 120 Fe ii lines from Meléndez & Barbuy (2009). We note that the line list of Aleo et al. (2017) which was used to reduce the Fe ii – Fe i differences for the Hyades cluster, contains 12 Fe ii lines which are all selected from Meléndez & Barbuy (2009). The lines from the Gaia-ESO ’golden’ list were obtained by calculating the mean and standard deviation of all abundances for a sample of 34 FGKM stars and selected those lines that agreed within 2 with the average abundance and had to be analyzed by at least three different research groups.
We performed the analysis of Sect. 2.2 for both line lists to show how many of these lines produce good abundance determinations. For this analysis, we used the two different damping options (when Barklem data were available), and we also did not find significant differences on the derived abundances. Therefore, for simplicity, we use only the Blackwell damping parameters for the rest of the paper since this option was used for the derivation of the initial parameters of the HARPS sample we compare in the following sections, and more importantly, since we showed that the damping does not affect significantly the results of this analysis. We select the lines which fulfill the criteria of Sect. 2.2 resulting in only two good lines from Jofré et al. (2014) and 15 from Meléndez & Barbuy (2009). The two lines from the Gaia-ESO line list (5264.81, 5414.07 Å) are in common with the good lines of Meléndez & Barbuy (2009) and show the same median abundances but with the atomic data of TS13, their median values are smaller, and therefore, we keep the latter atomic data. There are six lines from Meléndez & Barbuy (2009) which are not in the TS13 list and are now included as new good lines.
From the lines in common between TS13 and Meléndez & Barbuy (2009), we select the atomic data of those which present the lowest median and dispersion values. For example, the line 4576.34 Å with the solar calibrated from TS13 gives difference in the abundances of 0.13 dex, yet with the atomic data of Meléndez & Barbuy (2009) the difference is reduced to 0.07 dex. Inversely, the 4508.29 Å which was excluded by Aleo et al. (2017) as blended according to their criteria, does not give overabundances with the atomic data of TS13. This test demonstrates that the atomic data play an important role, as important as the correct EW measurement itself, on the abundance analysis. The final line list contains 14 lines from both Meléndez & Barbuy (2009) and TS13 and is described in Table 2. We remind the reader that the atomic data for the TS13 line list are derived after solar calibration with the damping Blackwell approximation.
| lines () | EP (ev) | Reference | |
|---|---|---|---|
| 4369.41 | 2.78 | –3.650 | Meléndez & Barbuy (2009) |
| 4508.28 | 2.86 | –2.405 | TS13 |
| 4522.63 | 2.84 | –2.250 | Meléndez & Barbuy (2009) |
| 4576.34 | 2.84 | –2.950 | Meléndez & Barbuy (2009) |
| 4582.84 | 2.84 | –3.180 | Meléndez & Barbuy (2009) |
| 4620.51 | 2.83 | –3.236 | TS13 |
| 4656.98 | 2.89 | –3.679 | TS13 |
| 4666.76 | 2.83 | –3.280 | Meléndez & Barbuy (2009) |
| 5234.63 | 3.22 | –2.237 | TS13 |
| 5264.81 | 3.23 | –3.093 | TS13 |
| 5414.07 | 3.22 | –3.571 | TS13 |
| 6239.95 | 3.89 | –3.410 | Meléndez & Barbuy (2009) |
| 6247.56 | 3.89 | –2.300 | Meléndez & Barbuy (2009) |
| 6442.97 | 5.55 | –2.400 | TS13 |
3 Ionization balance of iron for the 451 HARPS stars
Now, we perform the inverse exercise to show that in fact the clean Fe ii list we compiled previously provides more reliable surface gravities. We derive the atmospheric parameters for the sample using the spectral analysis tool FASMA888FASMA tool: http://www.iastro.pt/fasma (Andreasen et al., 2017). FASMA is wrapped around ARES and MOOG, and includes the model interpolation and minimization processes. The parameters are derived based on the same principles as in TS13, i.e. imposing excitation balance (the slope of iron abundance and excitation potential should be lower than 0.001) and ionization balance (the difference between the average abundances of Fe i and Fe ii should be less than 0.01 dex) in a fully automatic way. These convergence criteria are defined in Andreasen et al. (2017). We apply a 3 clipping to remove outliers.
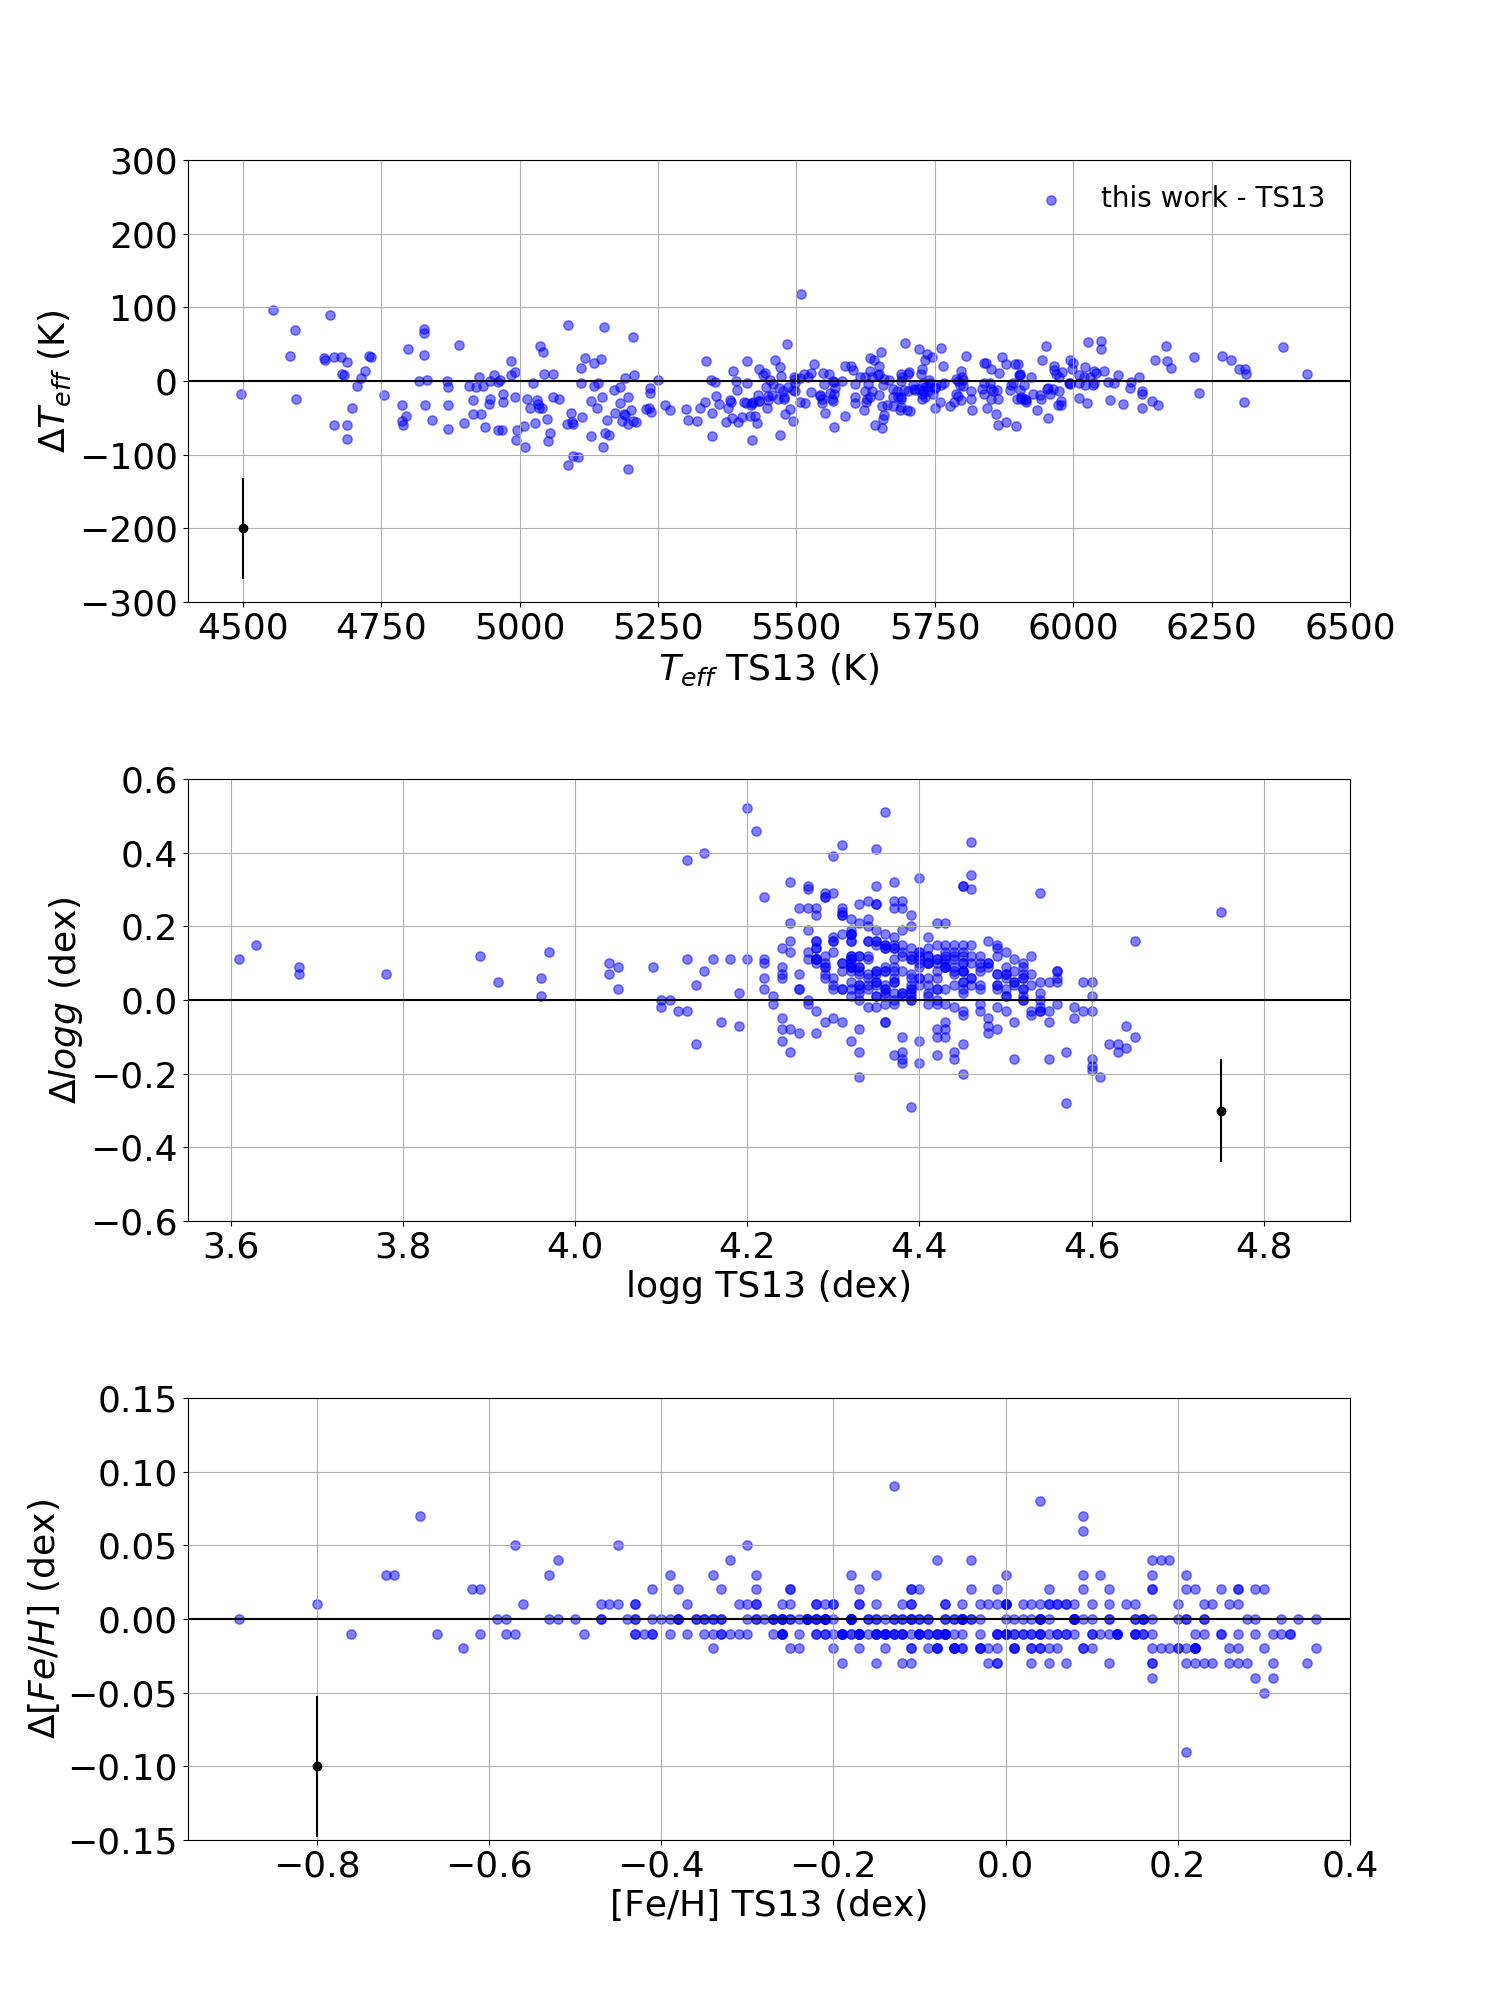
In Fig. 5, we show our derived parameters compared with TS13. The mean difference and standard deviation between FASMA and TS13 for is –11 and 34 K, for is 0.08 and 0.13 dex and for is 0.00 and 0.02 dex. We show that the scale of the effective temperature and metallicity of this work is in very good agreement with TS13 which we expect because the Fe i lines did not change.
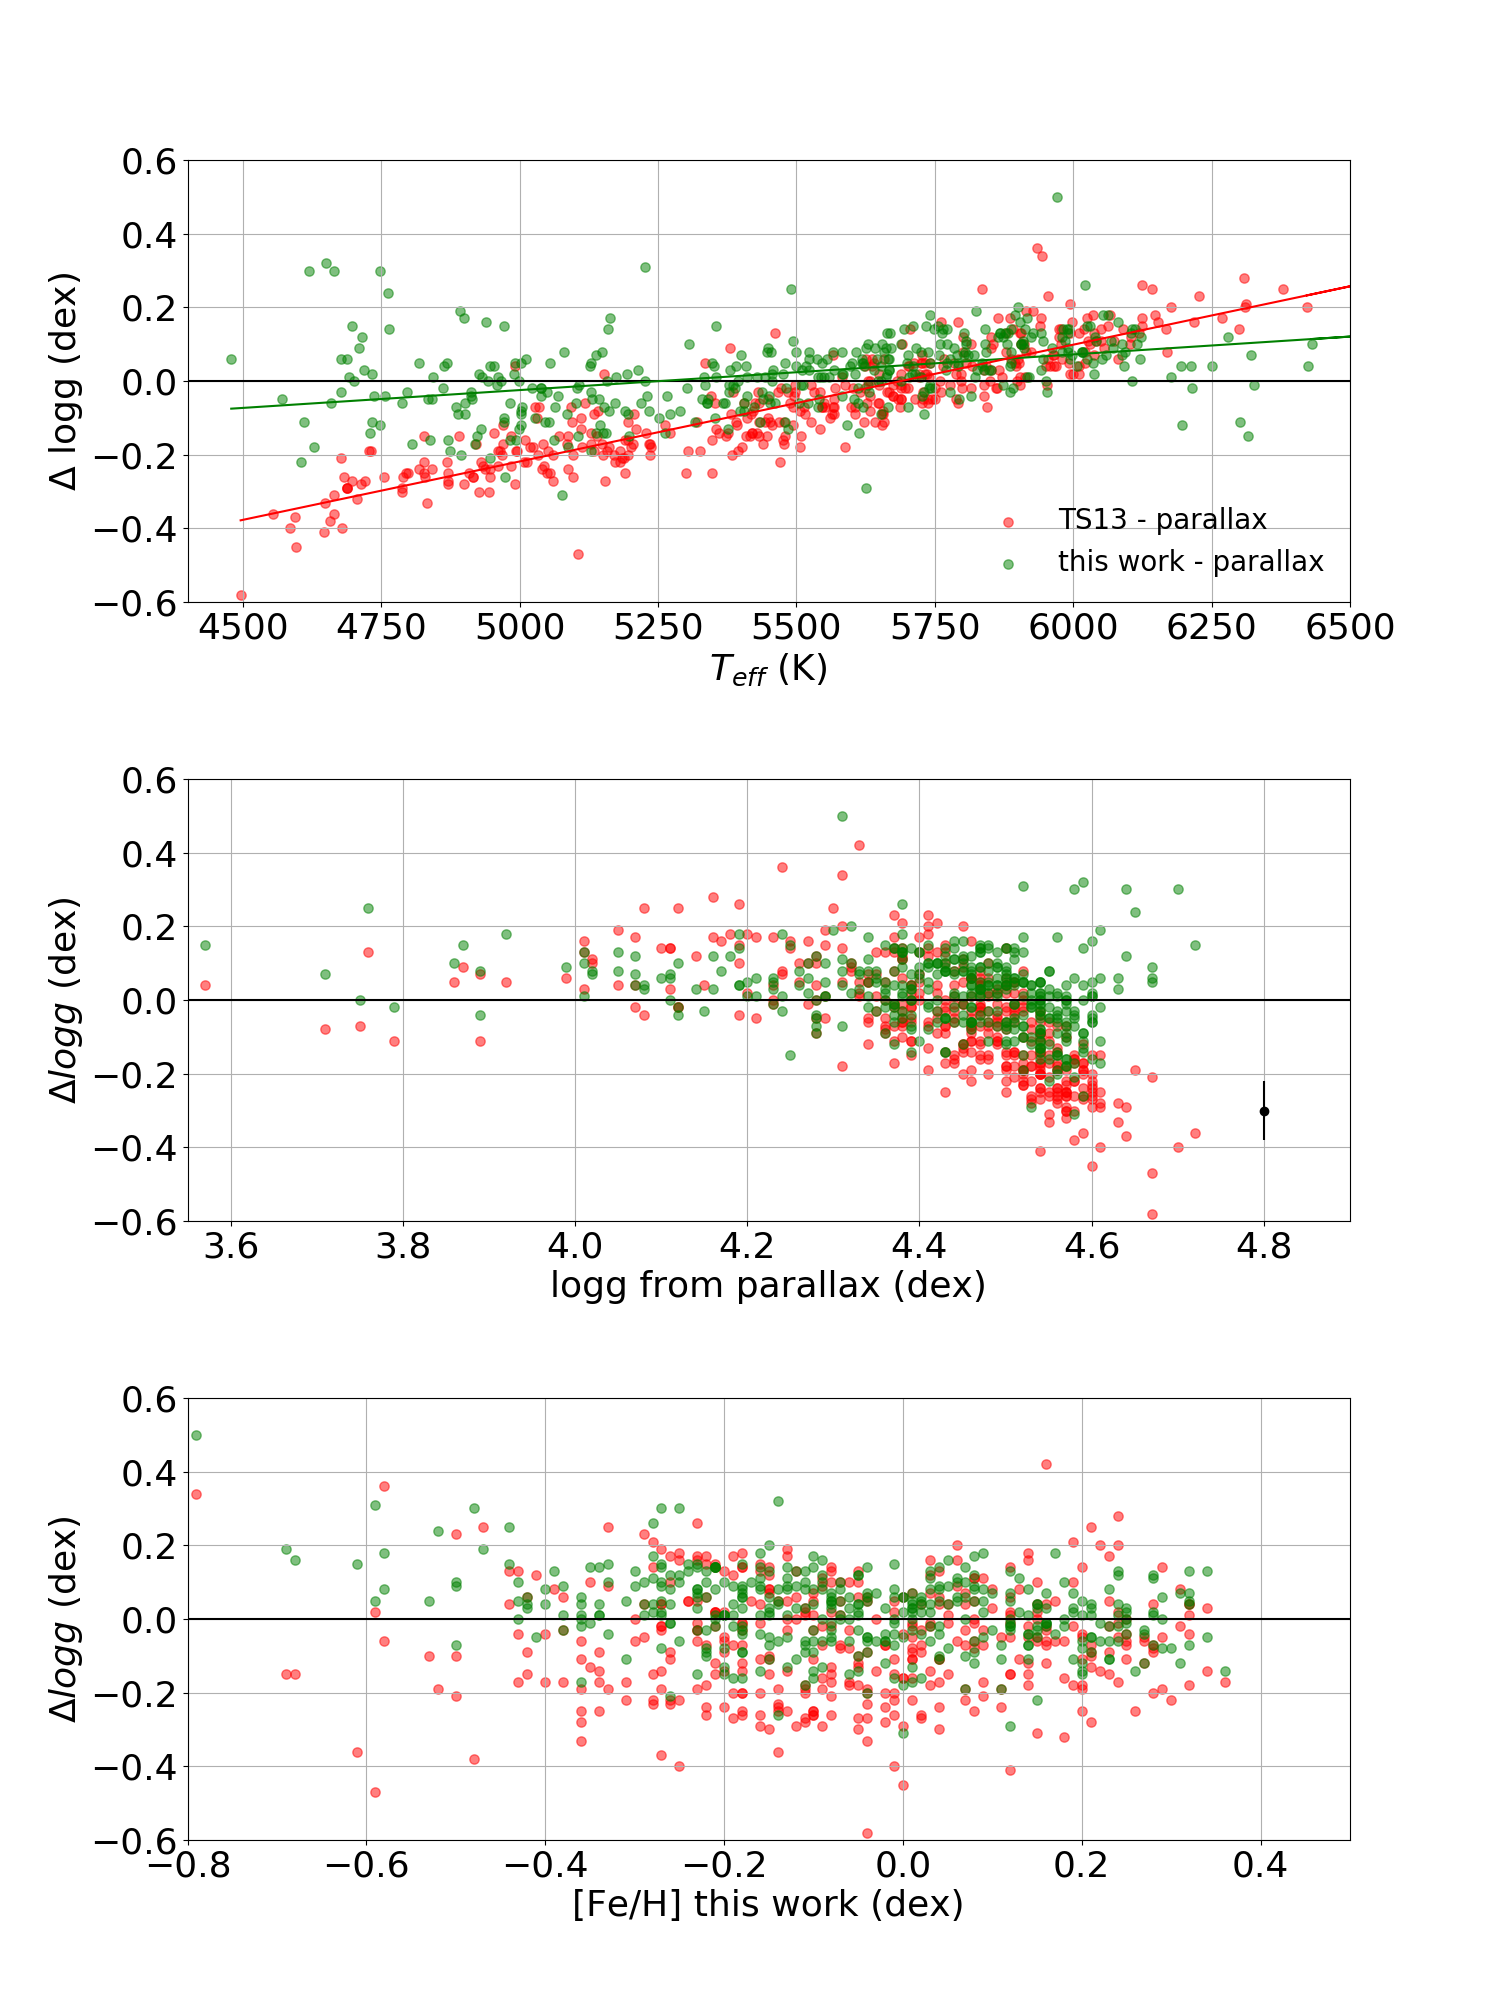
In Fig. 6 (middle plot), we plot the comparison between our spectroscopic surface gravities and the trigonometric. The mean differences and standard deviations between the of this work and the trigonometric is 0.02 and 0.10 dex, and between the of TS13 and trigonometric is –0.06 and 0.13 dex. Even though the agreement of our spectroscopic with the trigonometric is very good, we notice an overestimation of our for values higher than 4.60 dex. Nevertheless, we see a clear improvement in the – relation in this work (upper plot of Fig. 6) and our dispersion values are smaller. These results indicate that the criteria of the line selection were efficient enough because that linear dependence between and has diminished significantly with a slope of practically zero (9.710-5 dex K-1). Finally, there is no general correlation between and (bottom plot of Fig. 6) but there is an overestimation of spectroscopic for the most metal-poor stars of this sample ( –0.4 dex). These are the same stars which produce the overestimations in the middle plot with 4.60 dex. It is difficult to explain why metal-poor stars do not still have well constrained gravities. These differences cannot be attributed to non-LTE effects since these effects would cause an underestimation of and not an overestimation we observe here (see discussion below).
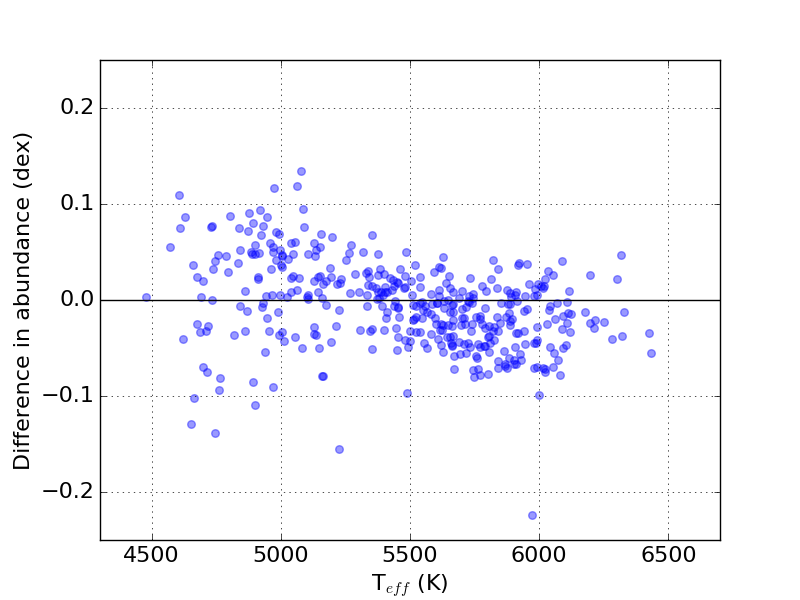
Using the spectroscopic and , and the trigonometric gravity, we calculate the new Fe ii and Fe i abundances for our sample similarly as in Sect. 2.2. In Fig. 7, we plot the difference in Fe ii – Fe i with for the whole sample of 451 stars.
This plot shows that ionization balance is on average fulfilled for the lines we consider clean after the blending analysis. The Fe ii – Fe i mean difference is –0.01 dex and the standard deviation is 0.04 dex, and thus, we can say that the ionization balance is much better satisfied. The highest dispersion appears for the cooler stars. The remaining differences can be attributed to the effects we did not consider in this work. For instance, Lind et al. (2012) show that the Fe i abundances are underestimated under the LTE assumption and the amount of non-LTE corrections depends on stellar parameters. The highest correction for non-LTE effects in Fe i abundance is expected for hot, metal-poor giants and for the parameters of our sample it should be less than 0.02–0.03 dex (for the case of a hot dwarf, e.g., = 6000 K, = 4.0 dex, [Fe/H] = 0.1 dex), estimated from their figure 4. There are no hot metal-poor stars in our sample. Bensby et al. (2014) faced the ionization balance problem in their study of a large sample of F and G dwarf stars in the solar neighborhood. The authors pointed out that stars with 4.20 dex and 5600 K showed higher Fe ii abundances over Fe i and non-LTE effects could not explain the large differences between spectroscopic and trigonometric gravities. However, they provide empirical calibrations for the coolest stars to correct for the discrepancies in the determinations.
Jofré et al. (2014) also find discrepancies between Fe ii and Fe i abundances for their sample which are higher for the K-dwarfs (their table 3). The authors also quantified the departures from LTE for their sample to be usually less than 0.03 dex for the FGK dwarfs and concluded that non-LTE effects are too small to justify the ionization balance problem.
The differences of Fig. 7 are small enough to be caused by other effects, such as activity, but also inaccuracies at this level of our reference stellar parameters should not be excluded.
4 Ionization balance of titanium for the 451 HARPS stars
In the previous Section, we showed that a careful selection Fe ii lines can improve the trends of iron abundances with effective temperature and provide in agreement with astrometry. However, other species could be more suitable for the surface gravity determinations. We search for species with enough neutral and ionized lines in the optical in two line lists: i) from Neves et al. (2009), and ii) from the joint list of Lawler et al. (2013) and Wood et al. (2013), hereafter LW13.
4.1 The Ti line list of Neves et al. (2009)
The element with most numerous ionized lines after iron is Ti in this line list (Sc and Cr follow after) and contains 30 Ti i and 8 Ti ii lines. Our goal is to check whether the surface gravities derived from the ionization equilibrium of Ti are more precise and accurate than from Fe.
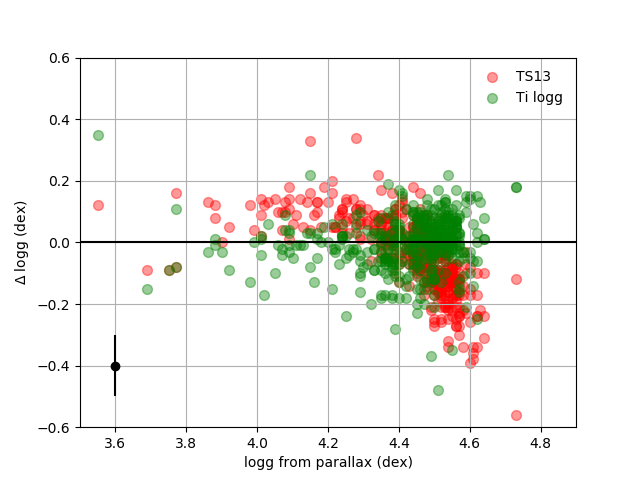
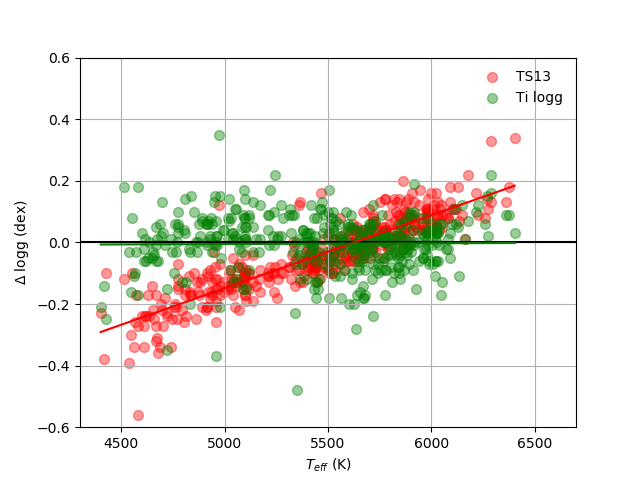
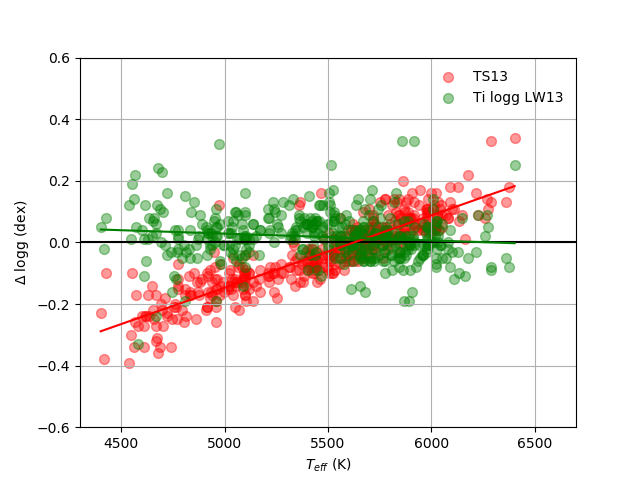
The atomic data of this list were also derived after solar calibration and the damping parameters used for their analysis is based on the Blackwell approximation which we also used in this Section. The EW of Ti i and Ti ii lines are measured with ARES for the whole sample of Sect. 2.2. We modify FASMA to obtain surface gravities from the ionization equilibrium of Ti having the other stellar parameters fixed to the values of TS13. The mean difference and standard deviation between derived from Ti and the trigonometric is 0.00 and 0.09 dex and are smaller than the derived from the Fe ionization equilibrium (upper plot of Fig. 8). Additionally, the slope of and is 0 (bottom plot of Fig. 8). We notice that there is an overestimation of the spectroscopic gravities for the hottest stars of the sample ( 6100 K).
4.2 The Ti line list of LW13
The line list of LW13 provides data from the measurements of the branching fractions in solar FTS and echelle spectra. From the 948 Ti i lines of Lawler et al. (2013) and the 364 Ti ii lines of Wood et al. (2013), the authors defined 128 and 31 lines respectively in the optical suitable for the solar abundance determination. However, it is not guaranteed this line list will work for cooler atmospheres because severe blending occurs in lower temperatures. In fact, we used the complete ’solar’ LW13 line list to derive surface gravities but with unrealistic results. A fast and efficient way to select the best lines is to perform a similar test as in Sect. 2.2 for the HARPS sample, by measuring the EW of Ti i and Ti ii lines with ARES and deriving their abundances. We select the lines with Ti ii – Ti i difference less than 0.10 dex and dispersion lower than 3 . The clean line list of LW13 now contains 59 Ti i and 11 Ti ii. The damping parameters for this line list are based on the Blackwell approximation.
| lines () | EP (eV) | Element | |
|---|---|---|---|
| 4512.73 | 0.84 | –0.40 | Ti i |
| 4518.69 | 1.43 | –1.04 | Ti i |
| 4623.10 | 1.74 | 0.16 | Ti i |
| 4639.36 | 1.74 | –0.05 | Ti i |
| 4645.19 | 1.73 | –0.51 | Ti i |
| 4650.01 | 1.74 | –0.64 | Ti i |
| 4656.04 | 1.75 | –0.99 | Ti i |
| 4731.16 | 2.17 | –0.43 | Ti i |
| 4733.42 | 2.16 | –0.66 | Ti i |
| 4742.11 | 2.15 | –0.94 | Ti i |
| 4747.67 | 2.25 | –0.83 | Ti i |
| 4778.26 | 2.24 | –0.35 | Ti i |
| 4820.41 | 1.50 | –0.38 | Ti i |
| 4926.15 | 0.82 | –2.09 | Ti i |
| 4997.10 | 0.00 | –2.07 | Ti i |
| 5020.03 | 0.84 | –0.33 | Ti i |
| 5022.87 | 0.83 | –0.33 | Ti i |
| 5024.84 | 0.82 | –0.53 | Ti i |
| 5064.65 | 0.05 | –0.94 | Ti i |
| 5109.43 | 1.44 | –1.54 | Ti i |
| 5145.46 | 1.46 | –0.54 | Ti i |
| 5147.48 | 0.00 | –1.94 | Ti i |
| 5152.18 | 0.02 | –1.95 | Ti i |
| 5210.38 | 0.05 | –0.82 | Ti i |
| 5212.99 | 2.23 | –1.16 | Ti i |
| 5230.97 | 2.24 | –1.19 | Ti i |
| 5295.78 | 1.07 | –1.59 | Ti i |
| 5366.64 | 0.82 | –2.46 | Ti i |
| 5384.63 | 0.83 | –2.77 | Ti i |
| 5389.99 | 1.87 | –1.10 | Ti i |
| 5448.91 | 2.33 | –1.25 | Ti i |
| 5449.15 | 1.44 | –1.87 | Ti i |
| 5453.64 | 1.44 | –1.60 | Ti i |
| 5471.19 | 1.44 | –1.42 | Ti i |
| 5474.22 | 1.46 | –1.23 | Ti i |
| 5474.45 | 2.34 | –0.95 | Ti i |
| 5490.15 | 1.46 | –0.84 | Ti i |
| 5503.90 | 2.58 | –0.05 | Ti i |
| 5512.52 | 1.46 | –0.40 | Ti i |
| 5514.34 | 1.43 | –0.66 | Ti i |
| 5514.53 | 1.44 | –0.50 | Ti i |
| 5739.47 | 2.25 | –0.61 | Ti i |
| 5823.69 | 2.27 | –1.01 | Ti i |
| 5880.27 | 1.05 | –2.00 | Ti i |
| 5899.29 | 1.05 | –1.10 | Ti i |
| 5999.66 | 2.24 | –0.72 | Ti i |
| 6017.55 | 2.33 | –1.69 | Ti i |
| 6091.17 | 2.27 | –0.32 | Ti i |
| 6092.79 | 1.89 | –1.38 | Ti i |
| 6121.00 | 1.88 | –1.42 | Ti i |
| 6146.21 | 1.87 | –1.48 | Ti i |
| 6149.73 | 2.16 | –1.44 | Ti i |
| 6258.10 | 1.44 | –0.39 | Ti i |
| 6258.71 | 1.46 | –0.28 | Ti i |
| 6266.01 | 1.75 | –1.95 | Ti i |
| 6268.53 | 1.43 | –2.26 | Ti i |
| 6336.10 | 1.44 | –1.69 | Ti i |
| 6419.09 | 2.17 | –1.53 | Ti i |
| 6745.54 | 2.24 | –1.23 | Ti i |
| lines () | EP (eV) | Element | |
|---|---|---|---|
| 4330.24 | 2.05 | –1.64 | Ti ii |
| 4421.94 | 2.06 | –1.64 | Ti ii |
| 4443.80 | 1.08 | –0.71 | Ti ii |
| 4450.48 | 1.08 | –1.52 | Ti ii |
| 4493.52 | 1.08 | –2.78 | Ti ii |
| 4518.33 | 1.08 | –2.56 | Ti ii |
| 4583.41 | 1.16 | –2.84 | Ti ii |
| 4657.20 | 1.24 | –2.29 | Ti ii |
| 4708.66 | 1.24 | –2.35 | Ti ii |
| 4719.51 | 1.24 | –3.32 | Ti ii |
| 4874.01 | 3.09 | –0.86 | Ti ii |
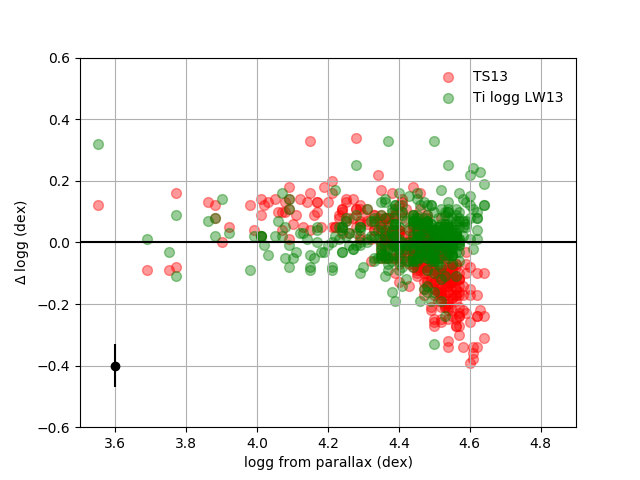
We obtain surface gravities from the ionization equilibrium of Ti with FASMA. The results are depicted in Fig. 9 where the mean difference and standard deviation between derived from Ti and the trigonometric is 0.02 and 0.08 dex respectively, and the slope of and is also 0. There is a small overestimation of spectroscopic in this case for the cooler stars and not for the hottest ones as in Fig. 8. The differences in these figures are on the opposite direction with and suggest that non-LTE effects should not be cause because they would affect the abundances the same way but probably we can attribute them on errors on the line selection. However, since these over-, under-estimations are small with both line lists, we consider already the results reliable enough.
Both Ti line lists in this Section give smaller standard deviations than Fe and flattest slopes with . Therefore, Ti is a better indicator to probe surface gravity than Fe, once the other stellar parameters are defined. Bergemann (2011) studied the non-LTE effects of Ti in the atmospheres of very metal-poor stars (–1.28 dex) and suggested that they should not be ignored in the case of giant stars at low metallicities. Even though these parameters are outside our parameter space, one should be careful when applying this method without the necessary corrections to these stars.
5 Conclusions
The ionization balance problem has troubled astronomers in several works in the literature. Several hypotheses have been proposed to explain the differences between Fe ii and Fe i abundances but with no fully satisfactory answer yet. In this work, we propose line blending as the main reason for the overabundances of Fe ii. We investigate the quality of our Fe ii line list for unresolved blends that were missed by visual inspection from previous work. We query the VALD for lines very close to our Fe ii lines and calculate how strong the blend is compared to our lines. We remove the ones that have significant EW contribution by setting different isolation thresholds.
We also perform an empirical test to remove Fe ii lines using high resolution spectra of 451 solar-type stars with reference stellar parameters (, , and microturbulence) from our previous work. Additionally, we combined two iron line lists from the literature to enhance the number of lines or improve the atomic data of the existing. More accurate gravities are derived based on the Gaia parallaxes in conjunction with precise spectroscopic effective temperatures. Using these parameters, we exclude the Fe ii lines which give abundances higher than 0.10 dex and dispersion lower than 3 . The clean Fe ii line list contains 14 lines and is a combination of the TS13 and Meléndez & Barbuy (2009) line list. The atmospheric parameters for our stellar sample with the new line list show significant improvement in the derivation of surface gravities, whereas the effective temperature and metallicity are in very good agreement with TS13. Moreover, the differences between Fe ii – Fe i abundances do not show trends with the effective temperature.
Finally, we show that the ionization equilibrium of Ti provides more accurate surface gravities than iron using for the Ti line lists of Neves et al. (2009) and LW13. Even though surface gravity still remains the parameter most difficult to constrain via spectroscopy, there are significant improvements presented in this work and in lack of parallax measurements, we can now provide more accurate surface gravities even for the lower main sequence stars. In this work, we propose for the optimal determination of stellar parameters, to use the TS13 line list to obtain and , and the Ti line lists for a better determinations of . This procedure will be implemented for public use in FASMA via the webpage.
The high quality spectra and reference atmospheric parameters of this sample can function very well to test the quality of a line list. With this data, we present an empirical solution to the ionization balance problem in cool stars. The bad lines excluded from this test can be attributed not only to blending effects but to other processes such as bad normalization, wrong atomic data, and we cannot easily distinguish which of them is responsible. We note that in this work we did not test the affects of other phenomena, such as the impact of 3D model atmospheres, non-LTE effects, and stellar activity to explain the differences between the Fe ii and Fe i abundances but from our analysis we expect them to have secondary effects on the results.
Acknowledgments
The authors thank the anonymous referee for the useful comments. M. T., E. D. M., V. Zh. A., N. C. S., and S. G. S. acknowledge the support from Fundação para a Ciência e a Tecnologia (FCT) through national funds and from FEDER through COMPETE2020 by the following grants UID/FIS/04434/2013 & POCI–01–0145-FEDER–007672, PTDC/FIS-AST/7073/2014 & POCI–01–0145-FEDER–016880, and PTDC/FIS-AST/1526/2014 & POCI–01–0145-FEDER–016886. E.D.M. acknowledges the support by the fellowship SFRH/BPD/76606/2011 funded by FCT (Portugal) and by the Investigador FCT contract IF/00849/2015/CP1273/CT0003 and in the form of an exploratory project with the same reference. V. Zh. A., N. C. S., and S. G. S. also acknowledge the support from FCT through Investigador FCT contracts IF/00650/2015/CP1273/CT0001, IF/00169/2012/CP0150/CT0002, and IF/00028/2014/CP1215/CT0002 funded by FCT (Portugal) and POPH/FSE (EC).
This research made use of the Vienna Atomic Line Database operated at Uppsala University, the Institute of Astronomy RAS in Moscow, and the University of Vienna. We thank the PyAstronomy and Astropy communities.
This work has made use of data from the European Space Agency (ESA) mission Gaia (https://www.cosmos.esa.int/gaia), processed by the Gaia Data Processing and Analysis Consortium (DPAC, https://www.cosmos.esa.int/web/gaia/dpac/consortium). Funding for the DPAC has been provided by national institutions, in particular the institutions participating in the Gaia Multilateral Agreement.
References
- Adibekyan et al. (2012) Adibekyan V. Z., Sousa S. G., Santos N. C., Delgado Mena E., González Hernández J. I., Israelian G., Mayor M., Khachatryan G., 2012, A&A, 545, A32
- Aleo et al. (2017) Aleo P. D., Sobotka A. C., Ramírez I., 2017, ApJ, 846, 24
- Allende Prieto et al. (2004) Allende Prieto C., Barklem P. S., Lambert D. L., Cunha K., 2004, A&A, 420, 183
- Amarsi et al. (2016) Amarsi A. M., Lind K., Asplund M., Barklem P. S., Collet R., 2016, MNRAS, 463, 1518
- Andreasen et al. (2017) Andreasen D. T., Sousa S. G., Tsantaki M., Teixeira G., Mortier A., Santos N. C., Suarez-Andres L., Delgado-Mena E., 2017, A&A
- Anstee & O’Mara (1991) Anstee S. D., O’Mara B. J., 1991, MNRAS, 253, 549
- Arenou et al. (2018) Arenou F., et al., 2018, preprint, (arXiv:1804.09375)
- Asplund (2005) Asplund M., 2005, ARA&A, 43, 481
- Barklem et al. (1998) Barklem P. S., Anstee S. D., O’Mara B. J., 1998, Publ. Astron. Soc. Australia, 15, 336
- Barklem et al. (2000) Barklem P. S., Piskunov N., O’Mara B. J., 2000, A&AS, 142, 467
- Bensby et al. (2014) Bensby T., Feltzing S., Oey M. S., 2014, A&A, 562, A71
- Bergemann (2011) Bergemann M., 2011, MNRAS, 413, 2184
- Bessell et al. (1998) Bessell M. S., Castelli F., Plez B., 1998, A&A, 333, 231
- Boeche & Grebel (2016) Boeche C., Grebel E. K., 2016, A&A, 587, A2
- Bressan et al. (2012) Bressan A., Marigo P., Girardi L., Salasnich B., Dal Cero C., Rubele S., Nanni A., 2012, MNRAS, 427, 127
- Chen et al. (2008) Chen Y. Q., Zhao G., Izumiura H., Zhao J. K., Liu Y. J., Honda S., Ohkubo M., 2008, AJ, 135, 618
- Delgado Mena et al. (2017) Delgado Mena E., Tsantaki M., Adibekyan V. Z., Sousa S. G., Santos N. C., González Hernández J. I., Israelian G., 2017, A&A, 606, A94
- Flower (1996) Flower P. J., 1996, ApJ, 469, 355
- Gaia Collaboration et al. (2018) Gaia Collaboration Brown A. G. A., Vallenari A., Prusti T., de Bruijne J. H. J., Babusiaux C., Bailer-Jones C. A. L., 2018, preprint, (arXiv:1804.09365)
- Gray (2005) Gray D. F., 2005, The Observation and Analysis of Stellar Photospheres
- Gustafsson et al. (2008) Gustafsson B., Edvardsson B., Eriksson K., Jørgensen U. G., Nordlund Å., Plez B., 2008, A&A, 486, 951
- Jofré et al. (2014) Jofré P., et al., 2014, A&A, 564, A133
- Korn et al. (2003) Korn A. J., Shi J., Gehren T., 2003, A&A, 407, 691
- Kupka et al. (1999) Kupka F., Piskunov N., Ryabchikova T. A., Stempels H. C., Weiss W. W., 1999, A&AS, 138, 119
- Kurucz (1993) Kurucz R., 1993, ATLAS9 Stellar Atmosphere Programs and 2 km/s grid. Kurucz CD-ROM No. 13. Cambridge, Mass.: Smithsonian Astrophysical Observatory, 1993., 13
- Lawler et al. (2013) Lawler J. E., Guzman A., Wood M. P., Sneden C., Cowan J. J., 2013, ApJS, 205, 11
- Lind et al. (2012) Lind K., Bergemann M., Asplund M., 2012, MNRAS, 427, 50
- Lindegren et al. (2018) Lindegren L., et al., 2018, preprint, (arXiv:1804.09366)
- Luri et al. (2018) Luri X., et al., 2018, preprint, (arXiv:1804.09376)
- Mayor et al. (2003) Mayor M., et al., 2003, The Messenger, 114, 20
- Meléndez & Barbuy (2009) Meléndez J., Barbuy B., 2009, A&A, 497, 611
- Morel & Miglio (2012) Morel T., Miglio A., 2012, MNRAS, 419, L34
- Mortier et al. (2014) Mortier A., Sousa S. G., Adibekyan V. Z., Brandão I. M., Santos N. C., 2014, A&A, 572, A95
- Neves et al. (2009) Neves V., Santos N. C., Sousa S. G., Correia A. C. M., Israelian G., 2009, A&A, 497, 563
- Perryman et al. (1997) Perryman M. A. C., et al., 1997, A&A, 323, L49
- Piskunov et al. (1995) Piskunov N. E., Kupka F., Ryabchikova T. A., Weiss W. W., Jeffery C. S., 1995, A&AS, 112, 525
- Ramirez (2008) Ramirez I., 2008, PhD thesis, The University of Texas at Austin
- Ramírez et al. (2007) Ramírez I., Allende Prieto C., Lambert D. L., 2007, A&A, 465, 271
- Ruchti et al. (2013) Ruchti G. R., Bergemann M., Serenelli A., Casagrande L., Lind K., 2013, MNRAS, 429, 126
- Ryabchikova et al. (2015) Ryabchikova T., Piskunov N., Kurucz R. L., Stempels H. C., Heiter U., Pakhomov Y., Barklem P. S., 2015, Phys. Scr., 90, 054005
- Ryan (1998) Ryan S. G., 1998, A&A, 331, 1051
- Santos et al. (2013) Santos N. C., et al., 2013, A&A, 556, A150
- Schuler et al. (2006) Schuler S. C., King J. R., Terndrup D. M., Pinsonneault M. H., Murray N., Hobbs L. M., 2006, ApJ, 636, 432
- Schuler et al. (2010) Schuler S. C., Plunkett A. L., King J. R., Pinsonneault M. H., 2010, PASP, 122, 766
- Smiljanic et al. (2014) Smiljanic R., et al., 2014, A&A, 570, A122
- Sneden (1973) Sneden C. A., 1973, PhD thesis, The University of Texas at Austin.
- Sneden et al. (2012) Sneden C., Bean J., Ivans I., Lucatello S., Sobeck J., 2012, MOOG: LTE line analysis and spectrum synthesis, Astrophysics Source Code Library (ascl:1202.009)
- Sousa et al. (2008) Sousa S. G., et al., 2008, A&A, 487, 373
- Sousa et al. (2011) Sousa S. G., Santos N. C., Israelian G., Mayor M., Udry S., 2011, A&A, 533, A141
- Sousa et al. (2014) Sousa S. G., et al., 2014, A&A, 561, A21
- Sousa et al. (2015) Sousa S. G., Santos N. C., Adibekyan V., Delgado-Mena E., Israelian G., 2015, A&A, 577, A67
- Tabernero et al. (2017) Tabernero H. M., Montes D., González Hernández J. I., Ammler-von Eiff M., 2017, A&A, 597, A33
- Torres (2010) Torres G., 2010, AJ, 140, 1158
- Tsantaki et al. (2013) Tsantaki M., Sousa S. G., Adibekyan V. Z., Santos N. C., Mortier A., Israelian G., 2013, A&A, 555, A150
- Unsold (1955) Unsold A., 1955, Physik der Sternatmospharen, MIT besonderer Berucksichtigung der Sonne.
- Wood et al. (2013) Wood M. P., Lawler J. E., Sneden C., Cowan J. J., 2013, ApJS, 208, 27
- Yong et al. (2004) Yong D., Lambert D. L., Allende Prieto C., Paulson D. B., 2004, ApJ, 603, 697
- da Silva et al. (2006) da Silva L., et al., 2006, A&A, 458, 609