Long Term Trends in Atmospheric Pressure and its Variance
Abstract
We use the Global Historical Climatology Network–daily database to calculate trends in sea-level atmospheric pressures, their variance and the variance of their day-to-day differences in nine regions of the world. Changes in pressure reflect the addition of water vapor to the warming atmosphere and changes in circulation patterns. Pressure gradients drive fronts and storm systems, and pressure differences, a meteorological parameter distinct from temperature and precipitation, are a proxy for storminess. In eight of nine regions the mean sea level pressure decreased at a rate significant at the (95% confidence) level if correlations between stations are small, but this nominal assumption is uncertain. We find lower bounds on the characteristic time scale of change of the sea level pressure variance and its differences between consecutive days. Depending on assumptions about the uncertainties of the mean values of trends averaged over many ( in some regions) stations, these lower bounds on the time scales of change of the variances range from to several thousand years. Trends in the variance of day-to-day pressure differences are negative and nominally significant in six of nine regions. Nominally significant trends in the pressure variances themselves are positive in three regions and negative in one.
1 Introduction
Climate change is most often described by trends in temperatures or precipitation. These are easily measured and data are available at a large number of sites, spread over the world. At many sites data series extend over a century. There is an extensive literature, reviewed and summarized by Intergovernmental Panel on Climate Change (2013–2014).
Atmospheric pressure is also readily measured, and data are available from lengthy time series at a large number of stations. Trends in atmospheric pressure and its fluctuations reflect the evolving climate (Gillett et al., 2003, 2005; Van Wijngaarden, 2005; Hegerl et al., 2006; Gillett & Stott, 2009; Wang et al., 2009; van den Besselaar et al., 2011; Gillett et al., 2013; Yu et al., 2014). Spatial gradients in pressure drive winds, and their magnitude is related to the strength of weather systems.
Compared to temperature and precipitation, sea-level adjusted pressure is insensitive to micrometeorology, making it a robust indicator. Changing the ground surface around a weather station on scales of even a few meters can change the temperature by several degrees (the urban heat island effect is an example of this on somewhat larger scales), and even in uniform flat terrain precipitation can be structured on scales of tens of meters or even less. Atmospheric pressure, averaged over gusts, is generally more uniform; exceptions occur in intense storms where the pressure gradient structure itself is of interest because it drives storm intensity. Temporal structure on a scale of days corresponds to spatial structure on a scale of 1000–2000 km, and drives cyclonic circulation.
2 Methods
The mean atmospheric sea level pressure is nearly constant because it is the weight of the atmosphere, per unit area, with corrections resulting from changes in the mean atmospheric circulation. Several small effects change the gravitational contribution to the mean as climate changes:
| (1) |
where is the atmospheric scale height, the radius of the Earth, the various the molecular weights of the corresponding species, the change in abundance of CO2 and the increase in partial pressure of H2O (Trenberth & Smith, 2005). The first term results from the increase in scale height as the atmosphere warms and the decrease of gravitational acceleration with altitude, the second term the replacement of O2 by heavier CO2, and the third term the increase in atmospheric mass as the quantity of water vapor in it increases. For a temperature increase of C, the addition of 125 ppm of CO2 to the atmosphere and an increase in water vapor content corresponding to that temperature increase, assuming 100% relative humidity (a crude assumption, but sufficient to estimate the size of the effect), the first term is about , the second term is about and the third term is about , each over the roughly 150 years since anthropogenic CO2 and warming have become significant. We might hope that the third, and dominant, term would give an integral measurement of the mass of water vapor in the atmosphere that is not easy to obtain in any other manner.
In addition to a steady increase of the mean produced by the increasing mass of the atmosphere (and very slightly offset by its thermal expansion), changes in circulation and weather lead to regional differences in any trend of and in its fluctuations. These fluctuations reflect weather patterns and their changes; storms are associated with large spatial and rapid temporal changes in pressure. Changes in climate, such as increased or decreased storminess, may be reflected in changes in the variance of and in its time dependence.
Most past studies of atmospheric pressure fluctuation (Rosenan & Striem, 1975; Canavero & Einaudi, 1987; Gong & Drange, 2005; Nawri & Stewart, 2009; Krueger & von Storch, 2011) have not searched for long term trends in their statistics that might be related to climate change. Trends in the statistics of pressure variations are diagnostic of climate change effects other than warming itself. Qualitatively, we may expect that greater pressure variability would be correlated with more intense storms, and vice versa.
We use the data in the Global Historical Climatology Network–Daily Database (Menne et al., 2012; GHCN, 2018) as the source of pressure data. In addition to trends in the pressure itself, we calculate the variance of daily atmospheric pressure measurements at station over a period denoted by
| (2) |
where is the pressure measured at station on day , the number of days in with pressure data for station and is the average over all such days at station .
We also define the variance of the day-to-day pressure differences
| (3) |
where the sum is restricted to values of for which there are data for both day and day . , although the difference is small because the data comprise uninterrupted runs of days in which there are valid pairs.
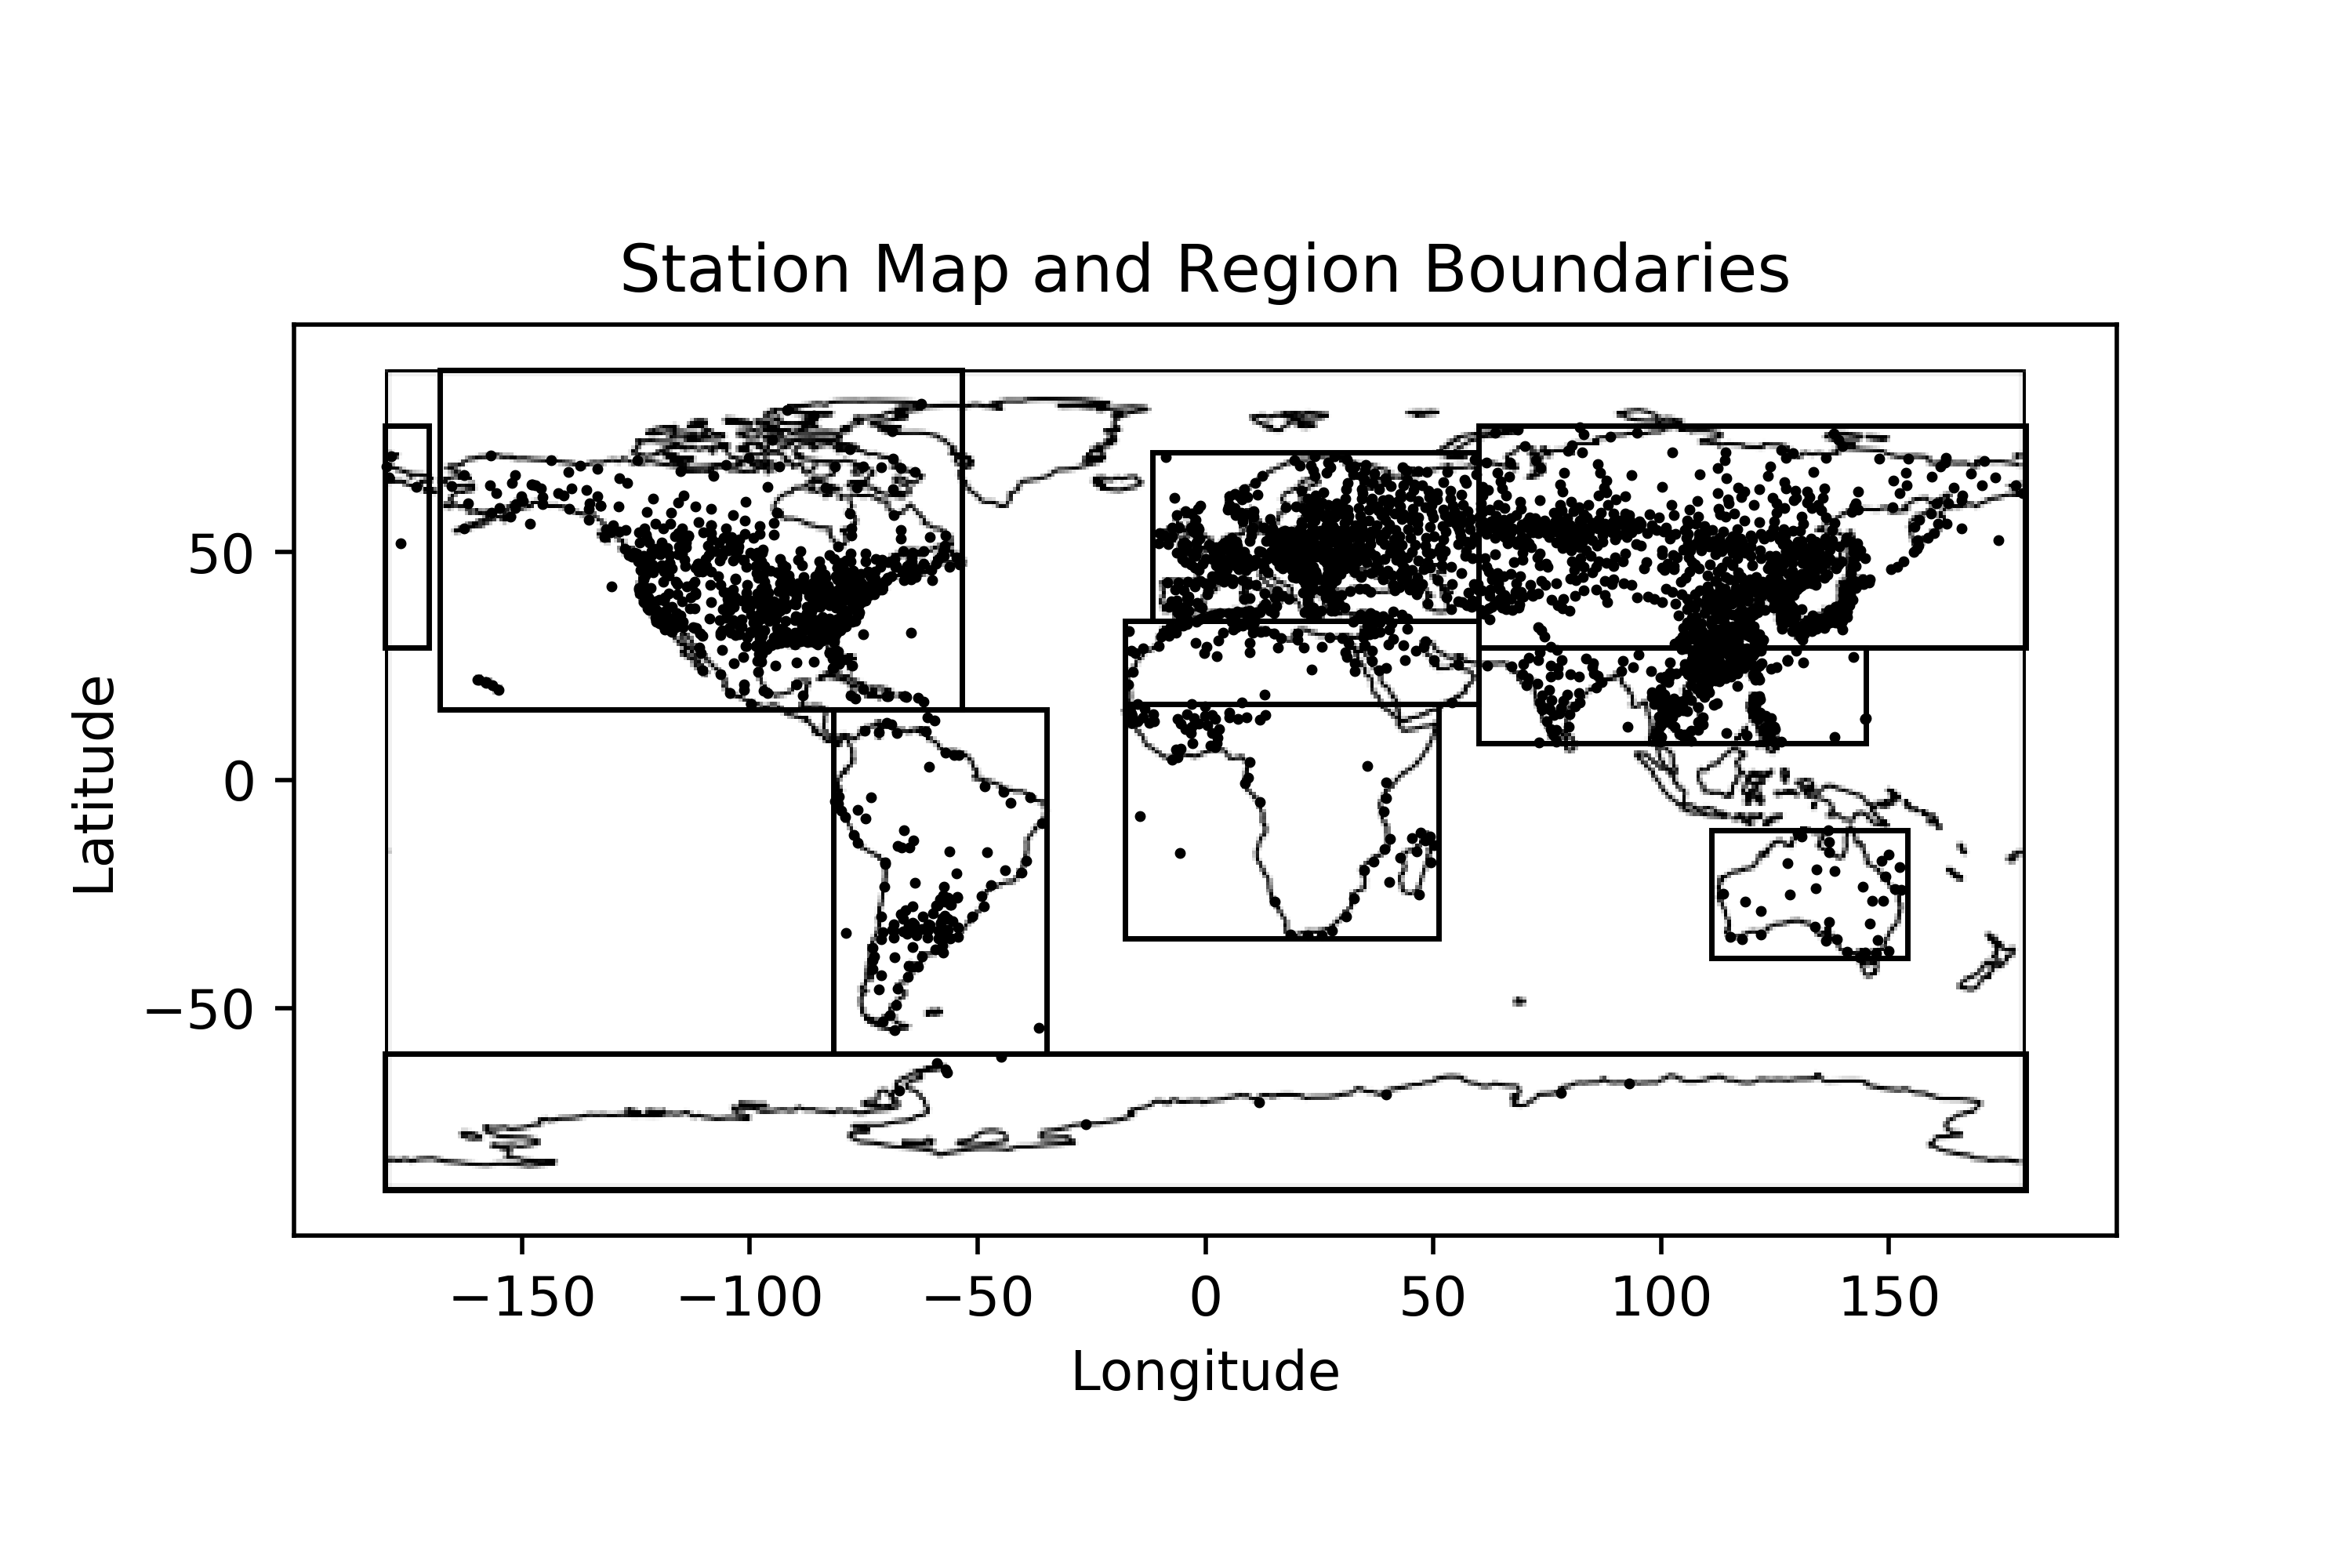
As in most historic meteorological databases, the time series in GHCN (2018) are incomplete. Different stations have data from different periods of time. We only consider a year of data from a site to be valid if it contains at least 150 days of data (or 150 pairs of consecutive days with data if we are considering day-to-day pressure differences). We divide the period 1930–2017 into eight 11-year “decades”, choosing 11 year intervals so that if the Solar cycle has a significant effect on meteorological variables each “decade” will sample one entire cycle; then any Solar effect will not be aliased into a spurious long-term trend. We consider a “decade” to have valid data if it contains six or more valid years and only consider a station if it has at least four valid “decades”. The stations passing this test are shown in Fig. 1. For these sites we calculate the mean , the mean and the mean for each “decade” and fit linear trends to these “decadal” means. After fitting , and at each station , we average these values over all stations in each of the nine geographic regions shown in Fig. 1 and defined in Table 1.

3 Results
The numbers of stations passing the tests for sufficient data and the their mean values of pressure, its variance and the variance of the day-to-day pressure differences are shown in Table 3.
3.1 Mean Pressures
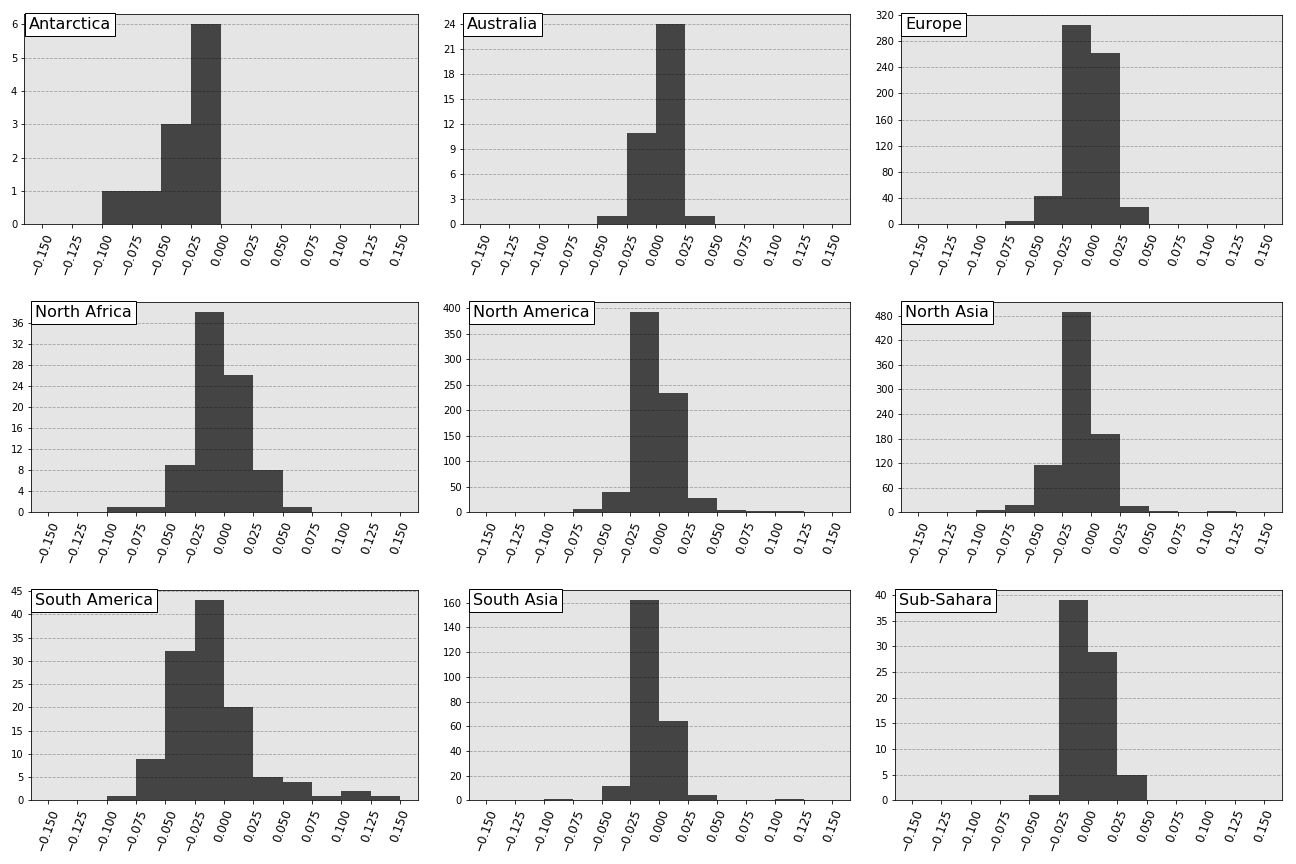
Fig. 2 shows the mean rates of change of pressure in each of the nine regions defined in Table 1. The boxes are the uncertainties where is the standard error of the means of each regions, and the error bars are the uncertainties where is the standard deviation of the individual station slopes; these differ by a factor of where (Table 2) is the number of stations in each region. The former, smaller, uncertainty would be applicable if pressure trends at each station were independent. In fact, they are correlated (to an unknown degree) and the uncertainty is larger, with the standard deviation of the individual slopes setting an upper limit. Fig. 3 shows the distributions of individual station slopes within each region.


Comparison of the trend in mean pressure indicated by Eq. 1 to the empirical values of Table 2 shows that the predicted trend of pressure increasing by roughly 0.5 mbar/Century is opposite in sign to the observed (not necessarily significantly different from zero) trends, and not insigificant in magnitude. If the observed trends are significant they must be attributed to changing circulation patterns and wind speeds. Evidence for a worldwide stilling of wind speeds was reviewed by McVicar et al. (2012).
3.2 Variances
We calculate the mean rates of change of the variance of the daily atmospheric pressure measurements and of the variance of the day-to-day differences of daily atmospheric pressure measurements in nine regions into which we divide the Earth’s land surface. These both measure the strength of the forces driving weather systems. describes the overall range of the pressure, whose gradient drives airflow, while provides a higher-pass filter by describing the variations on comparatively short (one day) time scales, and therefore on shorter spatial scales as meteorological structures advect.
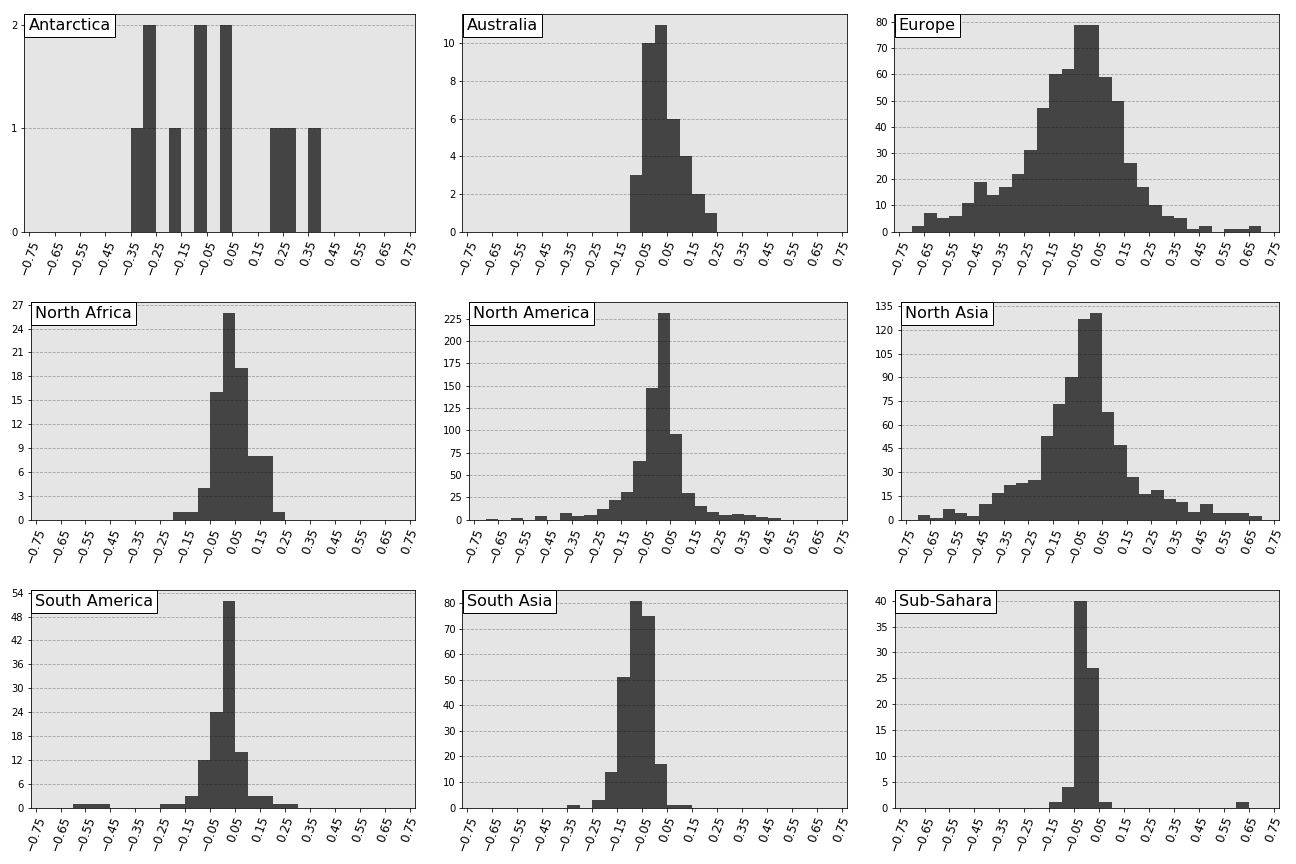
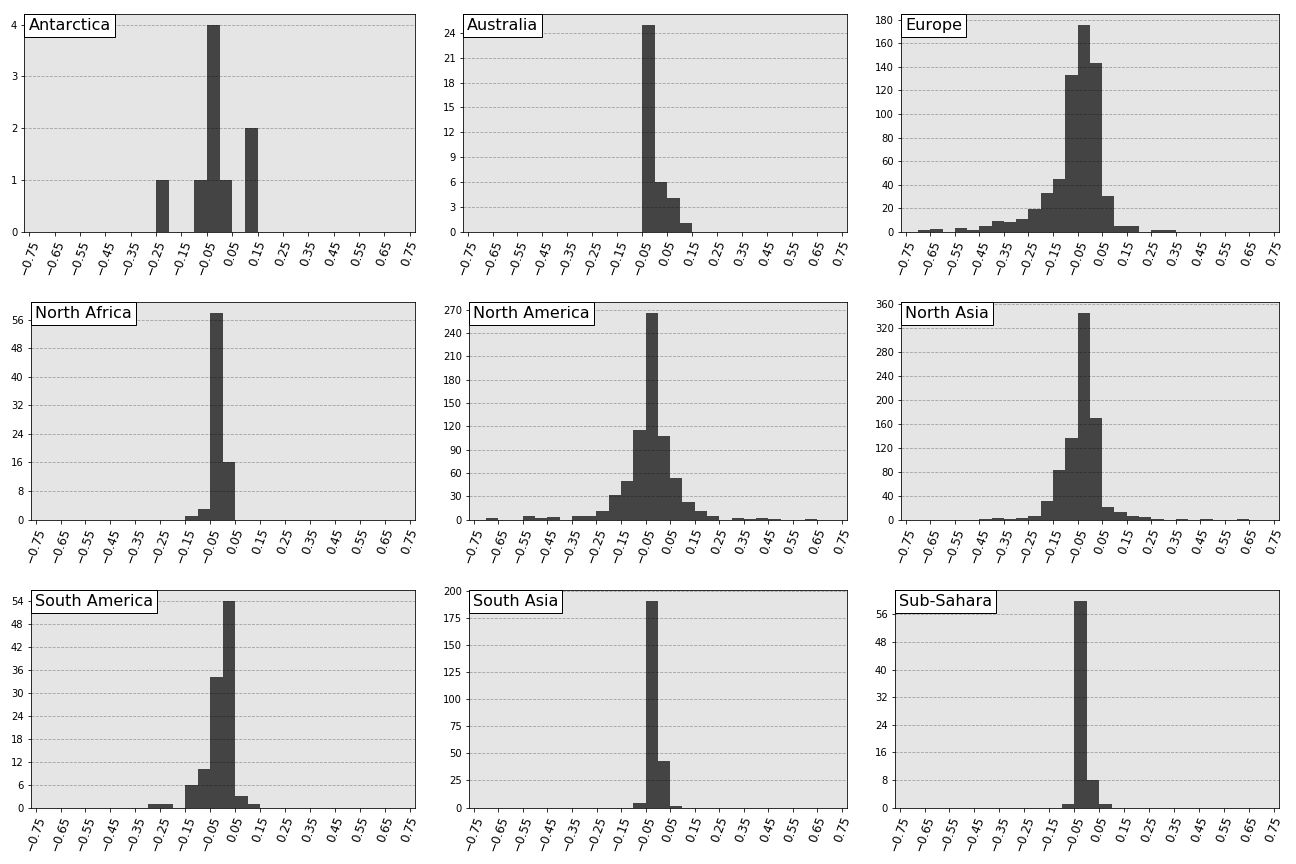
Table 1 defines the regions and also gives lower bounds on the characteristic times of pressure variance change (the variances divided by their time derivatives) for each region and for both variances. The numerical results are shown in Table 2 and are plotted in Fig. 4. The distributions of fitted slopes in each region are shown in Figs. 5 and 6.


4 Discussion
The decrease of mean pressure in most regions is opposite to the effect of adding additional H2O vapor to the atmosphere. The fact that it is observed in eight of the nine regions, and statistically significant at the level in seven of them if the smaller of the uncertainty estimates is valid, suggests that it may be real. It must be attributed to changes in the atmospheric flow.
If the smaller (standard error of the means) uncertainty estimates are adopted then in six regions a significant decrease in day-to-day pressure variance, at a rate /y, is found (Fig. 4). If the larger uncertainty estimates are adopted then no significant trend is found, but an upper limit to any rate of change of these variances /y can be set in most regions (Table 1). The values in this Table are all lower bounds on (upper bounds on rates of change), so outlying small values indicate only that data in those regions are scattered, not that the variances are changing rapidly.
These conclusions are similar to the earlier result (Canel & Katz, 2018) that storminess in the 48 contiguous United States, as measured by the normalized variance of hourly rainfall, has shown little or no trend in a period that substantially overlaps with that of this study. Increasing temperature has not been associated with rapid change in the other meteorological parameters studied.
References
- Canavero & Einaudi (1987) Canavero, F. G., & Einaudi, F. 1987, Time and Space Variability of Spectral Estimates of Atmospheric Pressure, J. Atm. Sci., 44, 1589
- Canel & Katz (2018) Canel, L. M., & Katz, J. I. 2018, Trends in U. S. Hourly Precipitation Variance 1949–2009, J. Hydromet., 19, 599
- Finkel & Katz (2018) Finkel, J. M., & Katz, J. I. 2018, Changing World Extreme Temperature Statistics, Int. J. Clim., 38, 2613
- GHCN (2018) GHCN. 2018, ftp://ftp.ncdc.noaa.gov/pub/data/ghcn/daily, accessed 7/9/2018
- Gillett et al. (2005) Gillett, N. P., Allan, R. J., & Ansell, T. J. 2005, Detection of external influence on sea level pressure with a multi-modal ensemble, Geophys. Res. Lett., 32, L19714
- Gillett et al. (2013) Gillett, N. P., Fyfe, J. C., & Parker, D. E. 2013, Attribution of observed sea level pressure trends to greenhouse gas, aerosol and ozone changes, Geophys. Res. Lett., 40, 2302
- Gillett & Stott (2009) Gillett, N. P., & Stott, P. A. 2009, Attribution of anthropogenic influence on seasonal sea level pressure, Geophys. Res. Lett., 36, L23709
- Gillett et al. (2003) Gillett, N. P., Zwiers, F. W., Weaver, A. J., & Stott, P. A. 2003, Detection of human influence on sea-level pressure, Nature, 422, 292
- Gong & Drange (2005) Gong, D., & Drange, H. 2005, A Preliminary Study on the Relationship Between Arctic Oscillation and Daily SLP Variance in teh Northern Hemisphere During Wintertime, Adv. Atm. Sci., 22, 313
- Hegerl et al. (2006) Hegerl, G. C., Karl, T. R., Allen, M., et al. 2006, Climate change detection and attribution: Beyond mean temperature signals, J. Clim., 19, 5058
- Intergovernmental Panel on Climate Change (2013–2014) Intergovernmental Panel on Climate Change. 2013–2014, IPCC Fifth Assessment Report (IPCC), www.ipcc.ch/report/ar5/index.shtml
- Krueger & von Storch (2011) Krueger, O., & von Storch, H. 2011, Evaluation of an Air Pressure Based Proxy for Storm Activity, J. Clim., 24, 2612
- Marshall (2003) Marshall, G. J. 2003, Trends in the Southern Annular Mode from Observations and Reanalyses, J. Clim., 16, 4134
- McVicar et al. (2012) McVicar, T. R., Roderick, M. L., Donohue, R. J., et al. 2012, Global review and synthesis of trends in observed terrestrial near-surface wind speeds: Implications for evaporation, J. Hydrology, 416–417, 182
- Menne et al. (2012) Menne, J. M., Durre, I., Vose, R. S., Gleason, B. E., & Houston, T. G. 2012, An overview of the global historical climatology network—daily database, J. Atmos. Ocean. Tech., 29, 897, doi:10.1175/JTECH-D-11-00103.1
- Nawri & Stewart (2009) Nawri, N., & Stewart, R. E. 2009, Short-term temporal variability of atmospheric surface pressure an dwind speed in the Canadian Arctic, Theor. Appl. Climatol., 98, 151
- Rosenan & Striem (1975) Rosenan, N., & Striem, H. L. 1975, The Mean Daily Variation of Barometric Pressure, Its Characteristics and its Its Contituents, in Israel and Neighbouring Countries, Arch. Met. Geoph. Biokl., Ser. A, 24, 329
- Trenberth & Smith (2005) Trenberth, K., & Smith, L. 2005, The mass of the atmosphere: A constraint on global analyses, J. Climate, 18, 864
- van den Besselaar et al. (2011) van den Besselaar, E. J. M., Haylock, M. R., van der Schrier, G., & Tank, A. M. G. K. 2011, A European daily high-resolution observational gridded data set of sea level pressure, J. Geophys. Res.–Atm., 116, D11110
- Van Wijngaarden (2005) Van Wijngaarden, W. A. 2005, Examination of trends in hourly surface pressure in Canada during 1953–2003, Int. J. Clim., 25, 2041
- Wang et al. (2009) Wang, X. L. L., Zwiers, F. W., Swail, V. R., & Feng, Y. 2009, Trends and variability of storminess in the Northeast Atlantic region, 1874–2007, Clim. Dyn., 33, 1179
- Yu et al. (2014) Yu, Y. Y., Ren, R. C., Hu, J. G., & Wu, G. X. 2014, A Mass Budget Analysis on the Interannual Variability of the Polar Surface Pressure in the Winter Season, J. Atm. Sci., 71, 3539
| # | Region | Latitudes | Longitudes | (y) | (y) | |||
|---|---|---|---|---|---|---|---|---|
| s.d. | s.e. | s.d. | s.e. | |||||
| 1 | Antarctica | 9 | 60–90 S | All | 299 | 834 | 265 | 827 |
| 2 | Australia | 36 | 10.93–39.1 S | 111–154 E | 151 | 660 | 187 | 562 |
| 3 | Europe | 984 | 35–72 N | 11.55 W–60 E | 131 | 617 | 203 | 4770 |
| 4 | N. Africa/ME | 106 | 16.7–35 N | 17.7 W–60 E | 113 | 396 | 174 | 565 |
| 5 | N. America | 1095 | 15.5–90 N | 53.5–168 W | 155 | 1190 | 188 | 2620 |
| 6 | N. Asia | 1438 | 29–77.7 N | 60 E–170.4 W | 173 | 818 | 170 | 3200 |
| 7 | S. America | 120 | 15.5 N–60 S | 34.9–81.7 W | 128 | 650 | 30 | 200 |
| 8 | S. Asia | 326 | 8.15–29 N | 60–145 E | 127 | 462 | 126 | 451 |
| 9 | Sub-Sahara | 78 | 34.8 S–16.7 N | 17.7 W–51.2 E | 86 | 298 | 60 | 391 |
| Region | (mb/C) | (mb2/C) | (mb2/C) |
|---|---|---|---|
| Antarctica | |||
| Australia | |||
| Europe | |||
| N. Africa/ME | |||
| N. America | |||
| N. Asia | |||
| S. America | |||
| S. Asia | |||
| Sub-Sahara |
| Region | (mb) | (mb2) | (mb2) |
|---|---|---|---|
| Antarctica | 987.9 | 62.5 | 119.1 |
| Australia | 1014.5 | 11.1 | 32.6 |
| Europe | 1015.6 | 32.1 | 90.1 |
| N. Africa/ME | 1014.0 | 6.6 | 32.2 |
| N. America | 1015.7 | 34.6 | 55. |
| N. Asia | 1016.4 | 31.1 | 112.1 |
| S. America | 1013.0 | 14.9 | 28.4 |
| S. Asia | 1011.1 | 4.4 | 36.5 |
| Sub-Sahara | 1012.2 | 3.0 | 9.1 |