The LOFAR Two-metre Sky Survey – First Data Release
The LOFAR Two-metre Sky Survey††thanks: LoTSS
The LOFAR Two-metre Sky Survey (LoTSS) is an ongoing sensitive, high-resolution 120-168 MHz survey of the entire northern sky for which observations are now 20% complete. We present our first full-quality public data release. For this data release 424 square degrees, or 2% of the eventual coverage, in the region of the HETDEX Spring Field (right ascension 10h45m00s to 15h30m00s and declination 45∘0000 to 57∘0000) were mapped using a fully automated direction-dependent calibration and imaging pipeline that we developed. A total of 325,694 sources are detected with a signal of at least five times the noise, and the source density is a factor of higher than the most sensitive existing very wide-area radio-continuum surveys. The median sensitivity is SJy beam-1 and the point-source completeness is 90% at an integrated flux density of 0.45 mJy. The resolution of the images is 6 and the positional accuracy is within 0.2 . This data release consists of a catalogue containing location, flux, and shape estimates together with 58 mosaic images that cover the catalogued area. In this paper we provide an overview of the data release with a focus on the processing of the LOFAR data and the characteristics of the resulting images. In two accompanying papers we provide the radio source associations and deblending and, where possible, the optical identifications of the radio sources together with the photometric redshifts and properties of the host galaxies. These data release papers are published together with a further 20 articles that highlight the scientific potential of LoTSS.
Key Words.:
surveys – catalogues – radio continuum: general – techniques: image processing1 Introduction
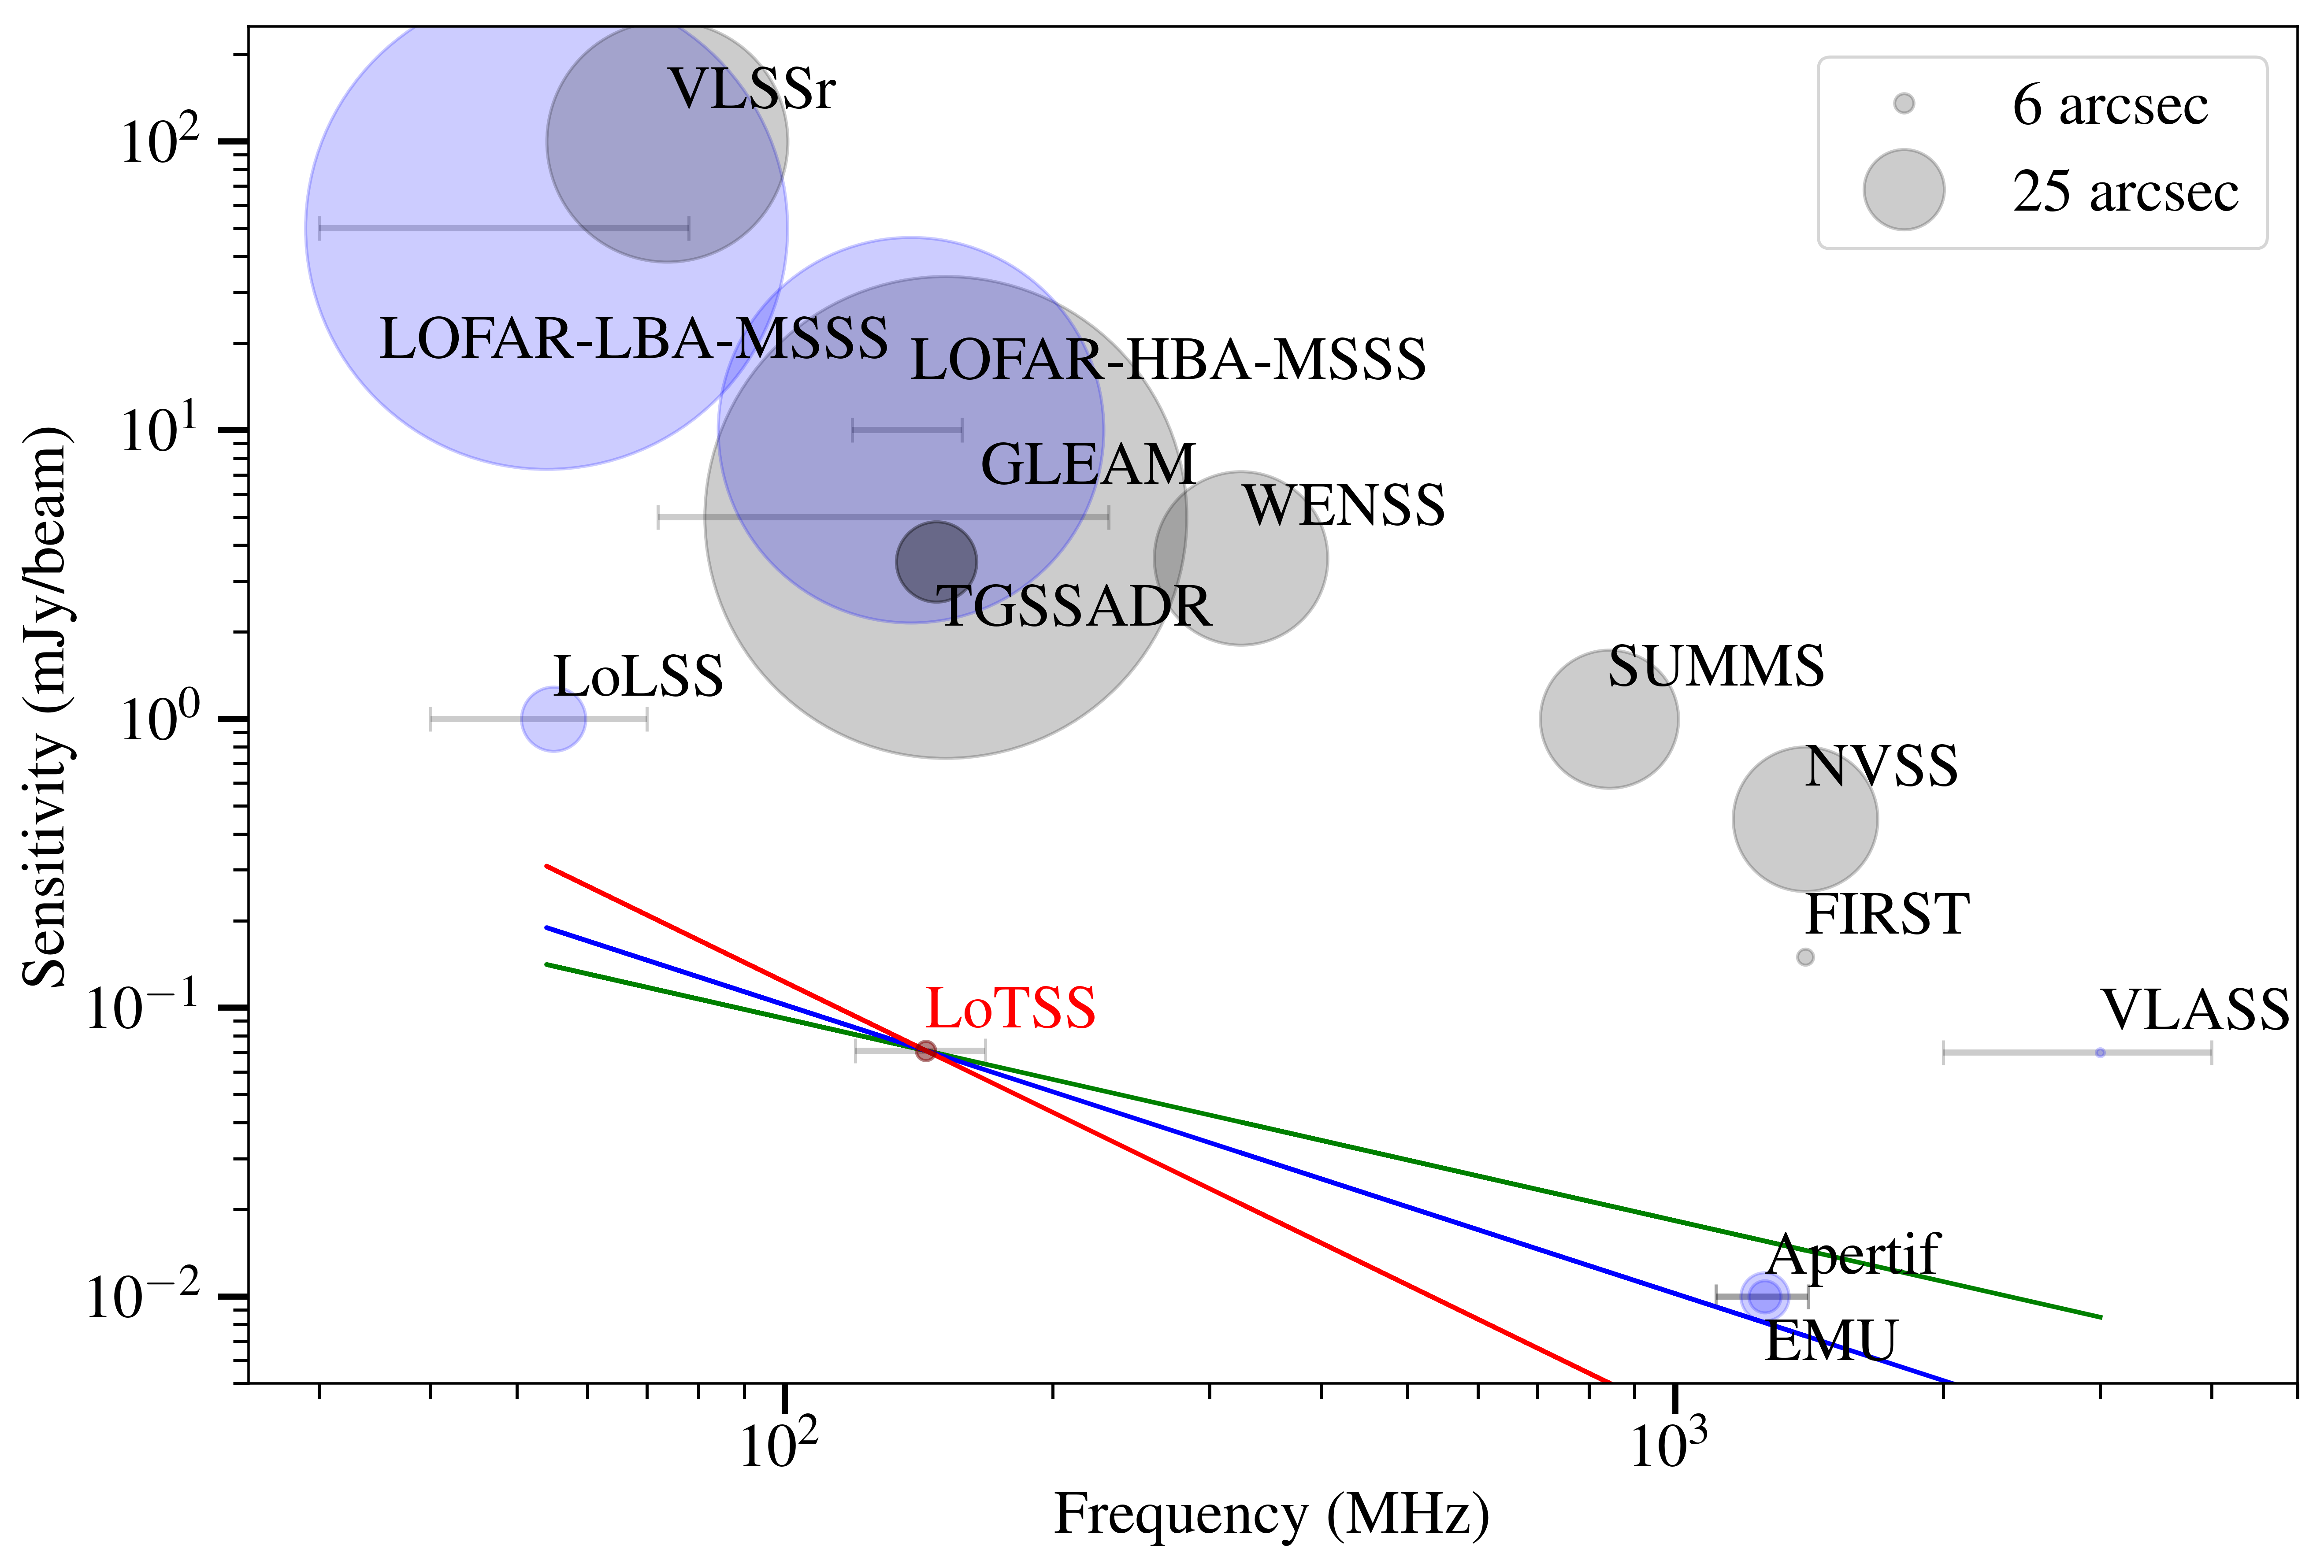
Surveys that probe deeply into new parameter space have enormous discovery potential. The LOFAR Two-metre Sky Survey (LoTSS; Shimwell et al. 2017) is one example: it is an ongoing survey that is exploiting the unique capabilities of the LOw Frequency ARray (LOFAR; van Haarlem et al. 2013) to produce a sensitive, high-resolution radio survey of the northern sky with a frequency coverage of 120-168 MHz (see Fig. 1). The survey was primarily motivated by the potential of low-frequency observations to facilitate breakthroughs in research areas such as the formation and evolution of massive black holes (e.g. Wilman et al. 2008 and Best et al. 2014) and clusters of galaxies (e.g. Cassano et al. 2010 and Brunetti & Jones 2014). However, there are many other important scientific drivers of the survey, and there is active research in areas such as high redshift radio sources (e.g. Saxena, Röttgering & Rigby 2017), galaxy clusters (e.g. Botteon et al. 2018, Hoang et al. 2017, de Gasperin et al. 2017, Savini et al. 2018 and Wilber et al. 2018a), active galactic nuclei (e.g. Brienza et al. 2017, Morabito et al. 2017 and Williams et al. 2018a), star forming galaxies (e.g. Calistro Rivera et al. 2017), gravitational lensing, galactic radio emission, cosmological studies (Raccanelli et al. 2012), magnetic fields (e.g. Van Eck et al. 2018), transients and recombination lines (e.g. Oonk et al. 2017).
The LoTSS survey is one of several ongoing or recently completed very wide-area low-frequency radio surveys that are providing important scientific and technical insights. Other such surveys include the Multifrequency Snapshot Sky Survey (MSSS; Heald et al. 2015), TIFR GMRT Sky Survey alternative data release (TGSS-ADR1; Intema et al. 2017), GaLactic and Extragalactic All-sky MWA (GLEAM; Wayth et al. 2015 and Hurley-Walker et al. 2017), LOFAR Low-band Sky Survey (LoLSS; de Gasperin et al. in prep), and the Very Large Array Low-frequency Sky Survey Redux (VLSSr; Lane et al. 2014). However, LoTSS is designed to push further into new territory. This survey aims to provide a low-frequency survey that will remain competitive even once the Square Kilometre Array (Dewdney et al. 2009) is fully operational, and will not be surpassed as a low-frequency wide-area northern sky survey for the foreseeable future. The LoTSS can provide the astrometric precision that is required for robust identification of optical counterparts (see e.g. McAlpine et al. 2012) and a sensitivity that, for typical radio sources, exceeds that achieved in existing very wide area higher frequency surveys such as the NRAO VLA Sky Survey (NVSS; Condon et al. 1998), Faint Images of the Radio Sky at Twenty-Centimeters (FIRST; Becker, White, & Helfand 1995), Sydney University Molonglo Sky Survey (SUMSS; Bock et al. 1999; Mauch et al. 2003), and WEsterbork Northern Sky Survey (WENSS; Rengelink et al. 1997) and rivals forthcoming higher frequency surveys such as the Evolutionary Map of the Universe (EMU; Norris et al. 2011), the APERture Tile In Focus survey (e.g. Röttgering et al. 2011) and the VLA Sky Survey (VLASS111https://science.nrao.edu/science/surveys/vlass). More specifically the primary observational objectives of LoTSS are to reach a sensitivity of less than 100 Jy beam-1 at an angular resolution, defined as the full width half maximum (FWHM) of the synthesised beam, of across the whole northern hemisphere, using the High Band Antenna (HBA) system of LOFAR (see Fig. 1).
In the first paper of this series (Paper I: Shimwell et al. 2017) we described LoTSS and presented a preliminary data release. In that release the desired imaging specifications were not reached, as no attempt was made to correct either for errors in the beam models or for direction-dependent ionospheric distortions, which are severe in these low-frequency data sets. However, there has since been substantial improvements in the quality, speed, and robustness of the calibration of direction-dependent effects (DDEs) and imaging with the derived solutions (see e.g. Tasse 2014b, Yatawatta 2015, van Weeren et al. 2016a and Tasse et al. 2017). Furthermore, LOFAR surveys of smaller areas of sky have demonstrated that the desired imaging specifications of LoTSS are feasible by making use of direction-dependent calibration (e.g. Williams et al. 2016 and Hardcastle et al. 2016). These new insights have facilitated the first full quality public data release (LoTSS-DR1), which we present here in Paper II of this series.
As part of this series we also attempt to enrich our radio catalogues by locating optical counterparts using a combination of likelihood ratio cross matching and visual inspection (discussed in Paper III of this series: Williams et al. 2018b). In addition, where counterparts are successfully located, we provide photometric redshift estimates and host galaxy properties (Paper IV: Duncan et al. 2018c). In the near future, to improve on the redshifts for many sources, the William Herschel Telescope Enhanced Area Velocity Explorer (WEAVE; Dalton et al. 2012, 2014) multi-object and integral field spectrograph will measure redshifts of over a million LoTSS sources as part of the WEAVE-LOFAR survey (Smith et al. 2016).
In Sec. 2 and 3 we describe the observations, the data processing procedure for the present data release, and the quality of the resulting images. In Sec. 4 we give a brief overview of the optical cross matching and the photometric redshift estimation. Finally, we outline some upcoming developments in Sec. 5 before concluding in Sec. 6.
2 Observations and data reduction
We describe the status of LoTSS observations in the first subsection. The second subsection outlines the direction-independent calibration of the data; at present, the main challenge is retrieving and processing the large volume of archived data. The third subsection describes the direction-dependent calibration and imaging, where the focus is on the development and execution of a robust and automated pipeline. The final subsection summarises the mosaicing and cataloguing of the DR1 images.
2.1 Observation status
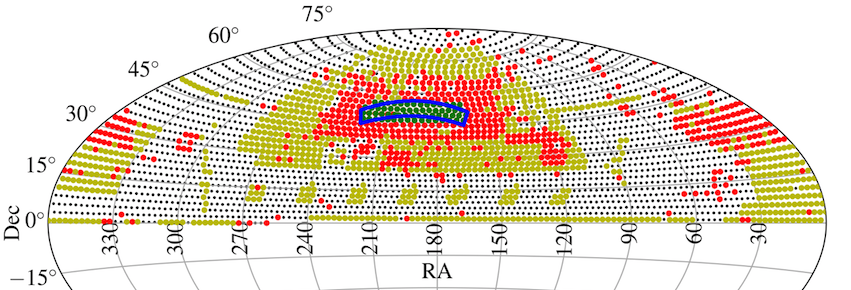
The ambitious observational objectives for LoTSS are outlined in Fig. 1. To achieve these objectives at optimal declinations, LoTSS observations are conducted in the hba_dual_inner configuration with 8 hr dwell times and a frequency coverage of 120-168 MHz. The entire northern sky is covered with 3168 pointings. By exploiting the multi-beam capability of LOFAR and observing in 8-bit mode two such pointings are observed simultaneously. As of May 2018, approximately 20% of the data have now been gathered and a further 30% are scheduled over the next two years (see Fig. 2); a total of approximately 13,000 hr observing time are required to complete the entire survey with the present capabilities of LOFAR.
As in Shimwell et al. (2017), in this paper we focus on 63 LoTSS data sets (2% of the total survey) in the region of the HETDEX Spring Field that were observed between 2014 May 23 and 2015 October 15. Each 8 hr observation was bookended by 10 min calibrator observations (primarily 3C 196 and 3C 295) and the data are archived with a time resolution of 1 s and a frequency resolution of 16 channels per 195.3 kHz sub-band (SB) by the observatory222 100 of the early LoTSS observations were averaged to 2 s and 24.4 kHz. This high time- and frequency-resolution data is kept to reduce time and bandwidth smearing to a level that is tolerable for future studies that will exploit the international baselines of LOFAR (only antennas within the Netherlands are used for the primary objectives of LoTSS). The high spectral resolution (R5000-7000 or 22-31 km/s velocity resolution) of the data is also facilitating spectral line (Emig et al. in prep) and spectro-polarimetric studies.
2.2 Direction-independent calibration
The publicly available LOFAR direction-independent calibration procedure was described in detail by van Weeren et al. (2016a) and Williams et al. (2016) and makes use of the LOFAR Default Preprocessing Pipeline (DPPP; van Diepen & Dijkema 2018) for averaging and calibration and BlackBoard Selfcal (BBS; Pandey et al. 2009) for calibration. In Paper I we used a pipeline implementation333https://github.com/lofar-astron/prefactor using commit dd68c57 of this procedure to process the 63 LoTSS data sets that are described in this publication and we discussed the quality of the images that were produced. This calibration method is not described again in detail in this work, but we developed new tools to maintain a high volume flow of data through this pipeline and we briefly describe these below.
The LoTSS data are stored in the LOFAR Long Term Archive (LTA444https://lta.lofar.eu/), which is distributed over three sites – SURFsara555https://www.surfsara.nl, Forschungszentrum Jülich666http://www.fz-juelich.de, and Poznań777http://www.man.poznan.pl/online/pl/. The archived data volume per 8 hr pointing is 16 TB, together with 350 GB for each 10 min calibrator observation, which implies an eventual data volume of 50 PB for the entire 3168 pointings of the survey (although this will be reduced by implementation of the DYSCO compression algorithm; Offringa, van de Gronde, & Roerdink 2012). Downloading these large data sets from the LTA sites to local facilities is either prohibitively time consuming or expensive. To mitigate this we migrated our direction-independent calibration processing to the SURFsara Grid facilities. At the time of writing this consists of several hundred nodes of various sizes with a total of 7500 compute cores that are linked with a high-speed connection of 200 Gbit/s peak network traffic to the Grid storage, where the SURFsara LTA data are housed. The implementation of the direction-independent calibration pipeline, and other LOFAR pipelines, on the SURFsara Grid is described in detail by Mechev et al. (2017) and Oonk et al. (in prep) and summarised briefly below.
The LoTSS data are archived as 244 single SB files and in our SURFsara implementation of the direction-independent calibration pipeline each SB of the calibrator is sent to an available compute node where it is flagged for interference with AOFLAGGER (Offringa, van de Gronde, & Roerdink 2012), averaged to two channels per 195 kHz SB and 8 s, and calibrated using a model of the appropriate calibrator source, which has a flux density scale consistent with that described in Scaife & Heald (2012). We note that the Scaife & Heald (2012) flux density scale is consistent with the Perley & Butler (2017) scale to within 5% but that there are larger discrepancies (5-10%) when comparing with the Baars et al. (1977) scale (see Scaife & Heald 2012 and Perley & Butler 2017 for details). Using a single compute node the resulting 244 calibration tables are combined and used to derive time-independent amplitude solutions, XX and YY phase offsets, and clock offsets for each station. Similarly, on separate compute nodes, the 244 single SB target files are each flagged, corrected for ionospheric Faraday rotation888https://github.com/lofar-astron/RMextract, calibrated using the calibrator solutions, and averaged to a resolution of two channels per 195 kHz SB and 8 s. In the final step of the direction-independent calibration pipeline, the data for each contiguous 10-SB block are sent to different compute nodes where they are each combined to a single file that is phase calibrated against a sky model for the target field, which is generated from the TGSS-ADR1 catalogue (Intema et al. 2017). This produces 25 10-SB measurement sets for the target field, but the six highest frequency SBs are empty because there are only 244 SBs in the highest frequency measurement set.
For the bulk processing of data on the SURFsara facilities we made use of PiCaS999http://doc.grid.surfsara.nl/en/latest/Pages/Practices/picas/picas_overview.html, a CouchDB based token pool server for heterogeneous compute environments. The PiCaS server allows millions of tasks to be scheduled on heterogeneous resources to monitor these tasks via a web interface and to provide easy access to logs and diagnostic plots, which helps ensure that our data quality is high. Examples of these diagnostic plots for the HETDEX Spring Field data are shown by Shimwell et al. (2017). We also make use of archiving and distribution facilities at SURFsara, allowing us to store the direction-independent calibrated data products (which are reduced from 16 TB to 500 GB per pointing) and freely distribute these amongst LoTSS team members for analysis and further processing.
The SURFsara Grid processing facilities enable high-throughput processing of large data sets stored on the local LTA site, however the LoTSS data sets are disseminated to all three LTA sites. Since the LTA sites are not linked to each other with a high bandwidth connection, the transfer speed to download data from the Forschungszentrum Jülich and Poznań LTA sites to SURFSara (200 MB/s) is currently a bottleneck in our processing. We are therefore working on implementing the direction-independent calibration pipeline on compute facilities local to each of the LTA sites.
2.3 Direction-dependent calibration and imaging
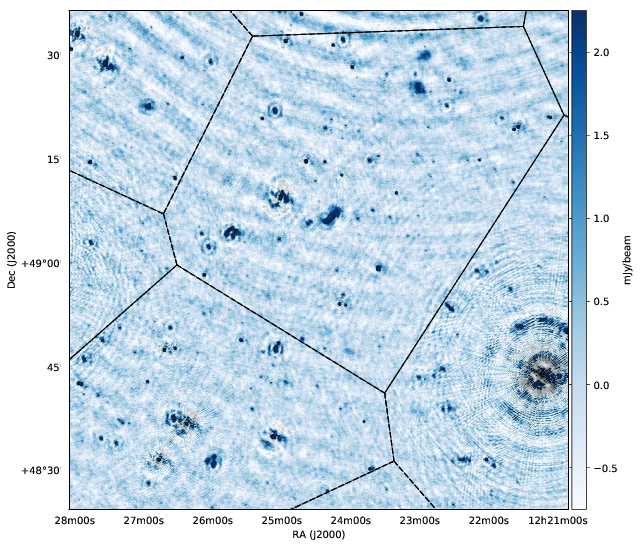
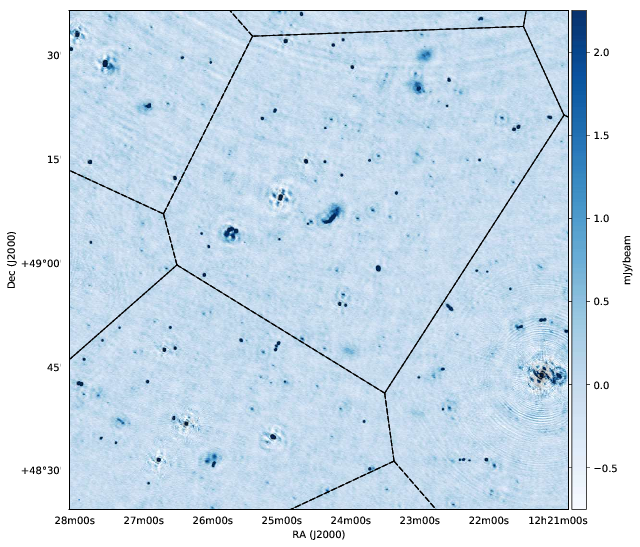
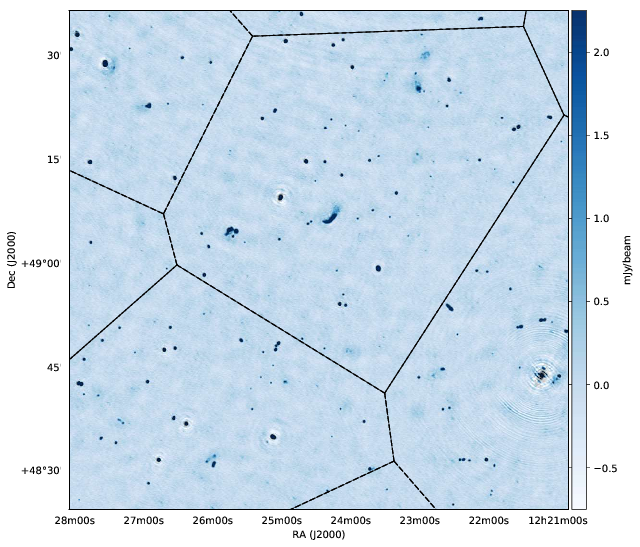
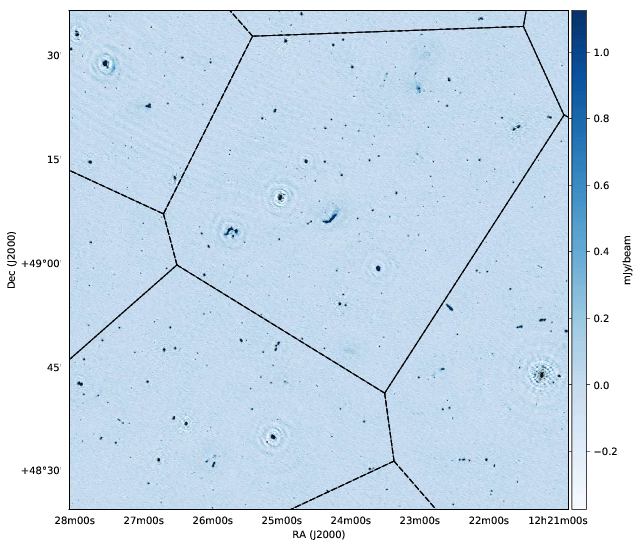
A robust, fast, and accurate calibration and imaging pipeline is essential to routinely create high-fidelity LoTSS images with a resolution of 6 and a sensitivity of 100Jy beam-1. However the necessity to correct DDEs, which are primarily ionospheric distortions and errors in the station beam model of the HBA phased array stations, adds significant complications to this procedure. These DDEs can be understood in terms of Jones matrices (Hamaker, Bregman, & Sault 1996) and to correct for these matrices, which not only depend on direction but also on time, frequency, and antenna, they must be derived from the visibilities and applied during imaging. Various approaches have been developed to estimate the DDE (e.g. Cotton et al. 2004, Intema et al. 2009, Kazemi et al. 2011, Noordam & Smirnov 2010, van Weeren et al. 2016a and Yatawatta 2015) but for this work we developed KillMS (kms; Tasse 2014b and Smirnov & Tasse 2015) to calculate the Jones matrices and ddfacet (Tasse et al. 2017) to apply these during the imaging. Our software packages and the pipeline are publicly available and documented101010see https://github.com/saopicc for kms and ddfacet, and https://github.com/mhardcastle/ddf-pipeline for the associated LoTSS-DR1 pipeline.. Below we briefly outline the calibration and deconvolution procedures before describing the pipeline in more detail.
2.3.1 Calibration of direction-dependent effects
One of the main difficulties in the calibration of DDE is the large number of free parameters that must be optimised for when solving for the complex-valued Jones matrices. The consequences of this are that finding the solutions can become prohibitively computationally expensive and that ill-conditioning can introduce systematics in the estimated quantities, which have a negative impact on the image fidelity.
To tackle the computational expense, Salvini & Wijnholds (2014), Tasse (2014b), and Smirnov & Tasse (2015) have shown that when inverting the Radio Interferometeric Measurement Equation (RIME; see e.g. Hamaker, Bregman, & Sault 1996, Smirnov 2011) the Jacobian can be written using Wirtinger derivatives. The resulting Jacobian is remarkably sparse, which allows for shortcuts to be used when implementing optimisation algorithms such as Levenberg-Marquardt (see for example Smirnov & Tasse 2015). In particular, the problem can become antenna separable, and to solve for the Jones matrices associated with a given antenna in kms, only the visibilities involving that antenna are required at each iterative step. The computational gain can be as high as (where is the number of elementary antennas).
To reduce ill conditioning, kms uses the Wirtinger Jacobian together with an Extended Kalman Filter (EKF) to solve for the Jones matrices (Tasse in prep.). Instead of optimising the least-squares residuals as a Levenberg-Marquardt (LM) procedure would, the EKF is a minimum mean-square error estimator and is recursive (as opposed to being iterative). In practice, the prior knowledge is used to constrain the expected solution at a given time. While an LM would produce independent “noisier” estimates, the EKF produces smooth solutions that are more physical and robust to ill-conditioning.
To further improve the calibration, kMS produces a set of weights according to a “lucky imaging” technique in which the weights of visibilities are based on the quality of their calibration solutions (Bonnassieux et al. 2017), so visibilities with the worst ionospheric conditions are weighted down in the final imaging.
2.3.2 Wide field spectral deconvolution
The ddfacet imager (Tasse et al. 2017) uses the kms-estimated direction-dependent Jones matrices and internally works on each of the directions for which there are solutions to synthesise a single image. To do this, several technical challenges had to be overcome. For example, the dependence of the Jones matrices on time, frequency, baseline, and direction, together with time- and frequency-dependent smearing, lead to a position dependent point spread function (psf). Therefore, although ddfacet synthesises a single image, each facet has its own psf that takes into account the DDE and time and bandwidth smearing whilst ensuring that the correct deconvolution problem is inverted in minor cycles.
Furthermore, to accurately deconvolve the LoTSS images, which have a large fractional bandwidth and a wide field of view, spectral deconvolution algorithms must be used to estimate the flux density and spectra of modelled sources whilst taking into account the variation of the LOFAR beam throughout the bandwidth of the data. The computational cost of this deconvolution can be high and therefore throughout our processing we make exclusive use of the subspace deconvolution (ssd) algorithm, an innovative feature of ddfacet (see Tasse et al. 2017 for a description). As opposed to clean and related algorithms, where a fraction of the flux density is iteratively removed at each major iteration, ssd aims at removing all the flux density at each major cycle. This is done in the abstracted notion of subspaces — in practice islands — each representing an independent deconvolution problem. Each one of these individual subspaces is jointly deconvolved (all pixels are simultaneously estimated) by using a genetic algorithm (the ssd-ga flavour of ssd), and parallelisation is done over hundreds to thousands of islands. A strength of ssd is that we can minimise the number of major cycles, by always recycling the sky model from the previous step. In practice the sky model generated in the preceding deconvolution step of the pipeline is then used to initialise the sky model in the next deconvolution. In other words, a proper dirty image is only formed at the very first imaging step and, thanks to ssd, the LoTSS-DR1 pipeline can work only on residual images and update the spectral sky model at each deconvolution step.
2.3.3 The LoTSS-DR1 pipeline
The LoTSS-DR1 pipeline has many configurable parameters including resumability, taking into account time and bandwidth smearing, bootstrapping the flux density scale off existing surveys, correction of facet-based astrometric errors, user specified deconvolution masks, and substantial flexibility in calibration and imaging parameters. The pipeline is suitable for the analysis of various LOFAR HBA continuum observations, including interleaved observations or those spanning multiple observing sessions. The entire pipeline takes less than five days to image one LoTSS pointing when executed on a compute node with 512 GB RAM (the minimum required for the pipeline is 192 GB) and four Intel Xeon E5-4620 v2 processors, which have eight cores each (16 threads) and run at 2.6 GHz.
The pipeline operates on the direction-independent calibration products which, for each pointing, are 25 10-SB (1.95 MHz) measurement sets with a time and frequency resolution of 8 s and two channels per 195 kHz SB. The pipeline first removes severely flagged measurement sets (those with of data flagged) and selects six 10-SB blocks of data that are evenly spaced across the total bandwidth for imaging. This quarter of the data is self-calibrated to gradually build up a model of the radio emission in the field, which is then used to calibrate the full data set. A brief outline of the steps of LoTSS-DR1, which are shown in Fig. 3, is as follows:
-
Step.1
Direction-independent spectral deconvolution and imaging ( SB)
-
Step.2
Sky model tesselation in 45 directions
-
Step.3
Direction-dependent calibration ( SB, kms with EKF);
-
Step.4
Bootstrapping the flux density scale
-
Step.5
Direction-dependent spectral deconvolution and imaging ( SB, phase-only solutions, three major cycles)
-
Step.6
Direction-dependent calibration ( SB, kms with EKF)
-
Step.7
Direction-dependent spectral deconvolution and imaging ( SB), one major cycle, amplitude, and phase solutions)
-
Step.8
Direction-dependent calibration ( SB, kms with EKF)
-
Step.9
direction-dependent spectral deconvolution and imaging ( SB, two major cycles, amplitude, and phase solutions)
-
Step.10
Facet-based astrometric correction.
The ddfacet is used in Step.1 to image the direction-independent calibrated data using the ssd algorithm, which allows us to rapidly deconvolve very large images. The present implementation of ssd requires a deconvolution mask and we use ddfacet to automatically generate one based on a threshold of 15 times the local noise, which is re-evaluated at every major cycle. The mask created during the deconvolution is supplemented with a mask generated from the TGSS-ADR1 catalogue to ensure that all bright sources in the field are deconvolved even when observing conditions are poor and automatically masking the sources is challenging. The image produced from the 60 SB data set consists of 20,00020,000 1.5 pixels, has a restoring beam of , and the noise varies between 0.25 mJy beam-1 and 2 mJy beam-1 depending on the observing conditions and source environment. From this image a refined deconvolution mask is created and used to reduce the number of spurious components in the ssd component model of the field by filtering out those that lie outside the region within the refined mask.
At Step.2 the resulting sky model is used to define 45 facets that cover the full region that has been imaged. The ssd component model is used for the first direction dependent calibration of the 60 SB data set (Step.3). This calibration is done using kms, which creates an amplitude and phase solution for each of the 45 facets every 60 s and 1.95 MHz of bandwidth, and the data are reimaged. Throughout the pipeline, in order not to absorb unmodelled sky emission into the kms calibration solutions (in particular faint extended emission seen by a small number of baselines), we always calibrate the visibilities using only baselines longer than km (corresponding to scales of ).
After this initial direction-dependent calibration we bootstrap the LoTSS-DR1 flux densities in Step.4 following the procedure described by Hardcastle et al. (2016). This not only improves the accuracy of our flux density estimates but also decreases amplitude errors that can occur owing to imperfections in the calibration across the bandwidth. In this step each of the six 10-SB blocks imaged in the previous step is imaged separately at lower resolution (20) using ddfacet which applies the direction dependent phase calibration solutions. A catalogue is made from the resulting image cube using the Python Blob Detector and Source Finder (PyBDSF; Mohan & Rafferty 2015) where sources are identified using a combined image created from all the planes in the cube and the source flux density measurements are extracted from each plane using the same aperture. Sources within 2.5∘ of the pointing centre that are at least 100 from any other detected source and have a integrated flux density exceeding 0.15 Jy are positionally cross matched with the VLSSr and WENSS catalogues using matching radii of 40 and 10, respectively. The WENSS catalogue used has all the flux densities scaled by a factor of 0.9 which, as described by Scaife & Heald (2012), brings it into overall agreement with the flux density scale we use. Correction factors are then derived for each of the six 10-SB blocks to best align the LoTSS-DR1 integrated flux density measurements with VLSSr and WENSS assuming the sources have power-law profiles across this frequency range (74 MHz to 325 MHz). During the fitting, sources that are poorly described by a power law are excluded to remove, for example incorrect matches or sources with spectral curvature. From the 7014 matched sources per field the correction factors derived for each of the six 10-SB blocks are typically 0.850.1 and these are extrapolated linearly to the entire 25 10-SB data set. The six 10-SB 20 resolution images are also stacked to provide a lower resolution (20) image that has a higher surface brightness sensitivity than the higher resolution images. This image is used to identify diffuse structures that are prevalent in LOFAR images, but may not be detected at sufficient significance in the higher resolution imaging. These extended sources are then added to the mask to ensure that they are deconvolved in later imaging steps. Sources are classified as extended sources if they encompass a contiguous region larger than 2000 pixels with all pixels having a signal above three times the local noise of the image.
After the bootstrap derived corrections factors are applied the 60 SBs of data are imaged with the direction-dependent phase solutions applied in ddfacet in Step.5. As explained above, for efficiency reasons ssd is initiated with the ssd components from the direction-independent imaging, which allows us to deconvolve deeply with three major ssd iterations. The image size and resolution are the same as in Step.3 but the input mask is improved because it is a combination of that obtained from the direction-independent imaging, the mask generated from the TGSS-ADR1 catalogue, and the low-resolution mask created from the bootstrapping; at this point the auto-masking threshold is also lowered to ten times the local noise. Again, once the imaging is complete the image is masked and the mask is used to reduce spurious entries in the ssd component model. The noise levels in this second imaging step range from 130Jy beam-1 to 600Jy beam-1. In Step.6 this new model is input into kms which calculates improved direction-dependent calibration solutions for each of the 45 facets every 60 s and 1.95 MHz of bandwidth.
A third imaging step is performed on the 60 SBs of data (Step.7), this time applying both the phase and amplitude direction-dependent calibration solutions but otherwise following the same procedure as before. This produces images with noise levels ranging from 100Jy beam-1 to 500Jy beam-1 and a final ssd component model that is used to calibrate the entire 240 SBs of the data set with kms (Step.8).
The full bandwidth is imaged at both low and high resolution in ddfacet with the newly derived phase and amplitude solutions applied (Step.9). The low-resolution image has a resolution of 20 and a significantly higher surface brightness sensitivity than when imaging at higher resolution. In this low-resolution image ssd is not initiated with a previously derived model because the -data used in the imaging are different as an outer -cut of 25.75 km is applied. To deconvolve deeply we perform three separate iterations of the low-resolution imaging, each time improving the input mask and lowering the automasking threshold. The noise level of the final 20 resolution images ranges from 100Jy beam-1 to 400Jy beam-1, which corresponds to a brightness temperature of 9 K to 35 K.
The full bandwidth high-resolution imaging is performed with a resolution of 6. The deconvolution mask that has been gradually built up through the self-calibration of the 60 SB data set, as well as that from the lower resolution imaging from the full bandwidth, and an auto masking threshold in ddfacet of five times the local noise allow for a very deep deconvolution. This is performed with two separate runs of ddfacet with a masking step in between to ensure that the local noise is well estimated and faint sources (signal to noise 5) are masked. The resulting high-resolution images have noise levels that vary from 60Jy beam-1 to 160Jy beam-1. Once the deconvolution is complete the images are corrected for astrometric errors in ddfacet which can apply astrometric corrections to each of the facets independently (Step.10). The astrometric corrections applied vary from 0.0 to 4.4 with a median of 0.8 and are derived from cross-matching the LOFAR detected sources in each facet with the Pan-STARRS catalogue (Flewelling et al. 2016). The errors on the derived offsets vary from 0.1 to 4.8 with a median 0.2.
During the cross-matching a histogram of the separations between all Pan-STARRS sources within 60 arcsec of compact LOFAR sources is made for each facet. This typically consists of 140 Pan-STARRS sources per LoTSS-DR1 source and an average of 190 radio sources per facet. If all sources in the facets are systematically offset, then this histogram should have a peak at the value of the offset between the LoTSS-DR1 and Pan-STARRS sources. To search for the location of this peak and estimate the RA and Dec offsets and their corresponding errors in each facet, we use a Markov Chain Monte Carlo (MCMC) method and uninformative priors. In this procedure the emcee package (Foreman-Mackey et al. 2013) is used to draw MCMC samples from a Gaussian function plus a background where the initial parameter estimates are derived from the observed LOFAR and Pan-STARRS position offsets. The likelihood function is calculated using a gamma distribution with a shape parameter defined by the observed LOFAR and Pan-STARRS position offsets. The posterior probability distribution is calculated taking into account the uninformative priors (background, offset, and Gaussian peak greater than zero and a Gaussian standard deviation less than 5) that are put on the offset Gaussian function and background level.
The pipeline is very robust and with no human interaction the processing failed for only 5 of the 63 fields in the HETDEX Spring Field region, thus providing 58 images in this region. One (P2) of these failures was due to exceptionally bad ionospheric conditions and the other four (P31, P210+52, P214+52, and P215+50) were due to the proximity of very bright sources (3C 280 and 3C 295).
2.4 Mosaicing and radio source cataloguing

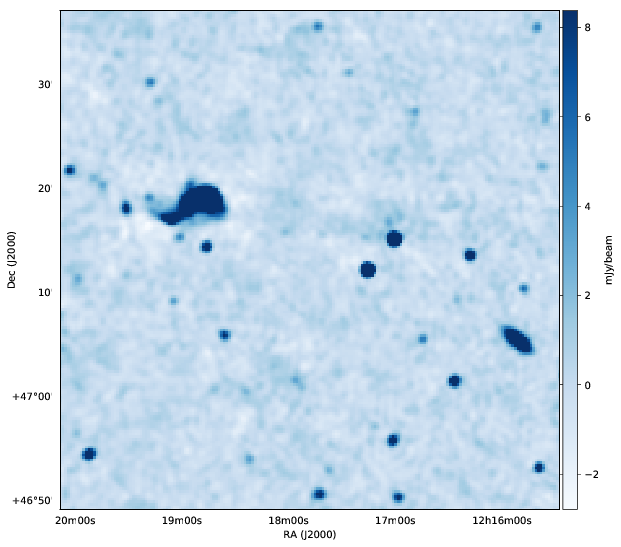


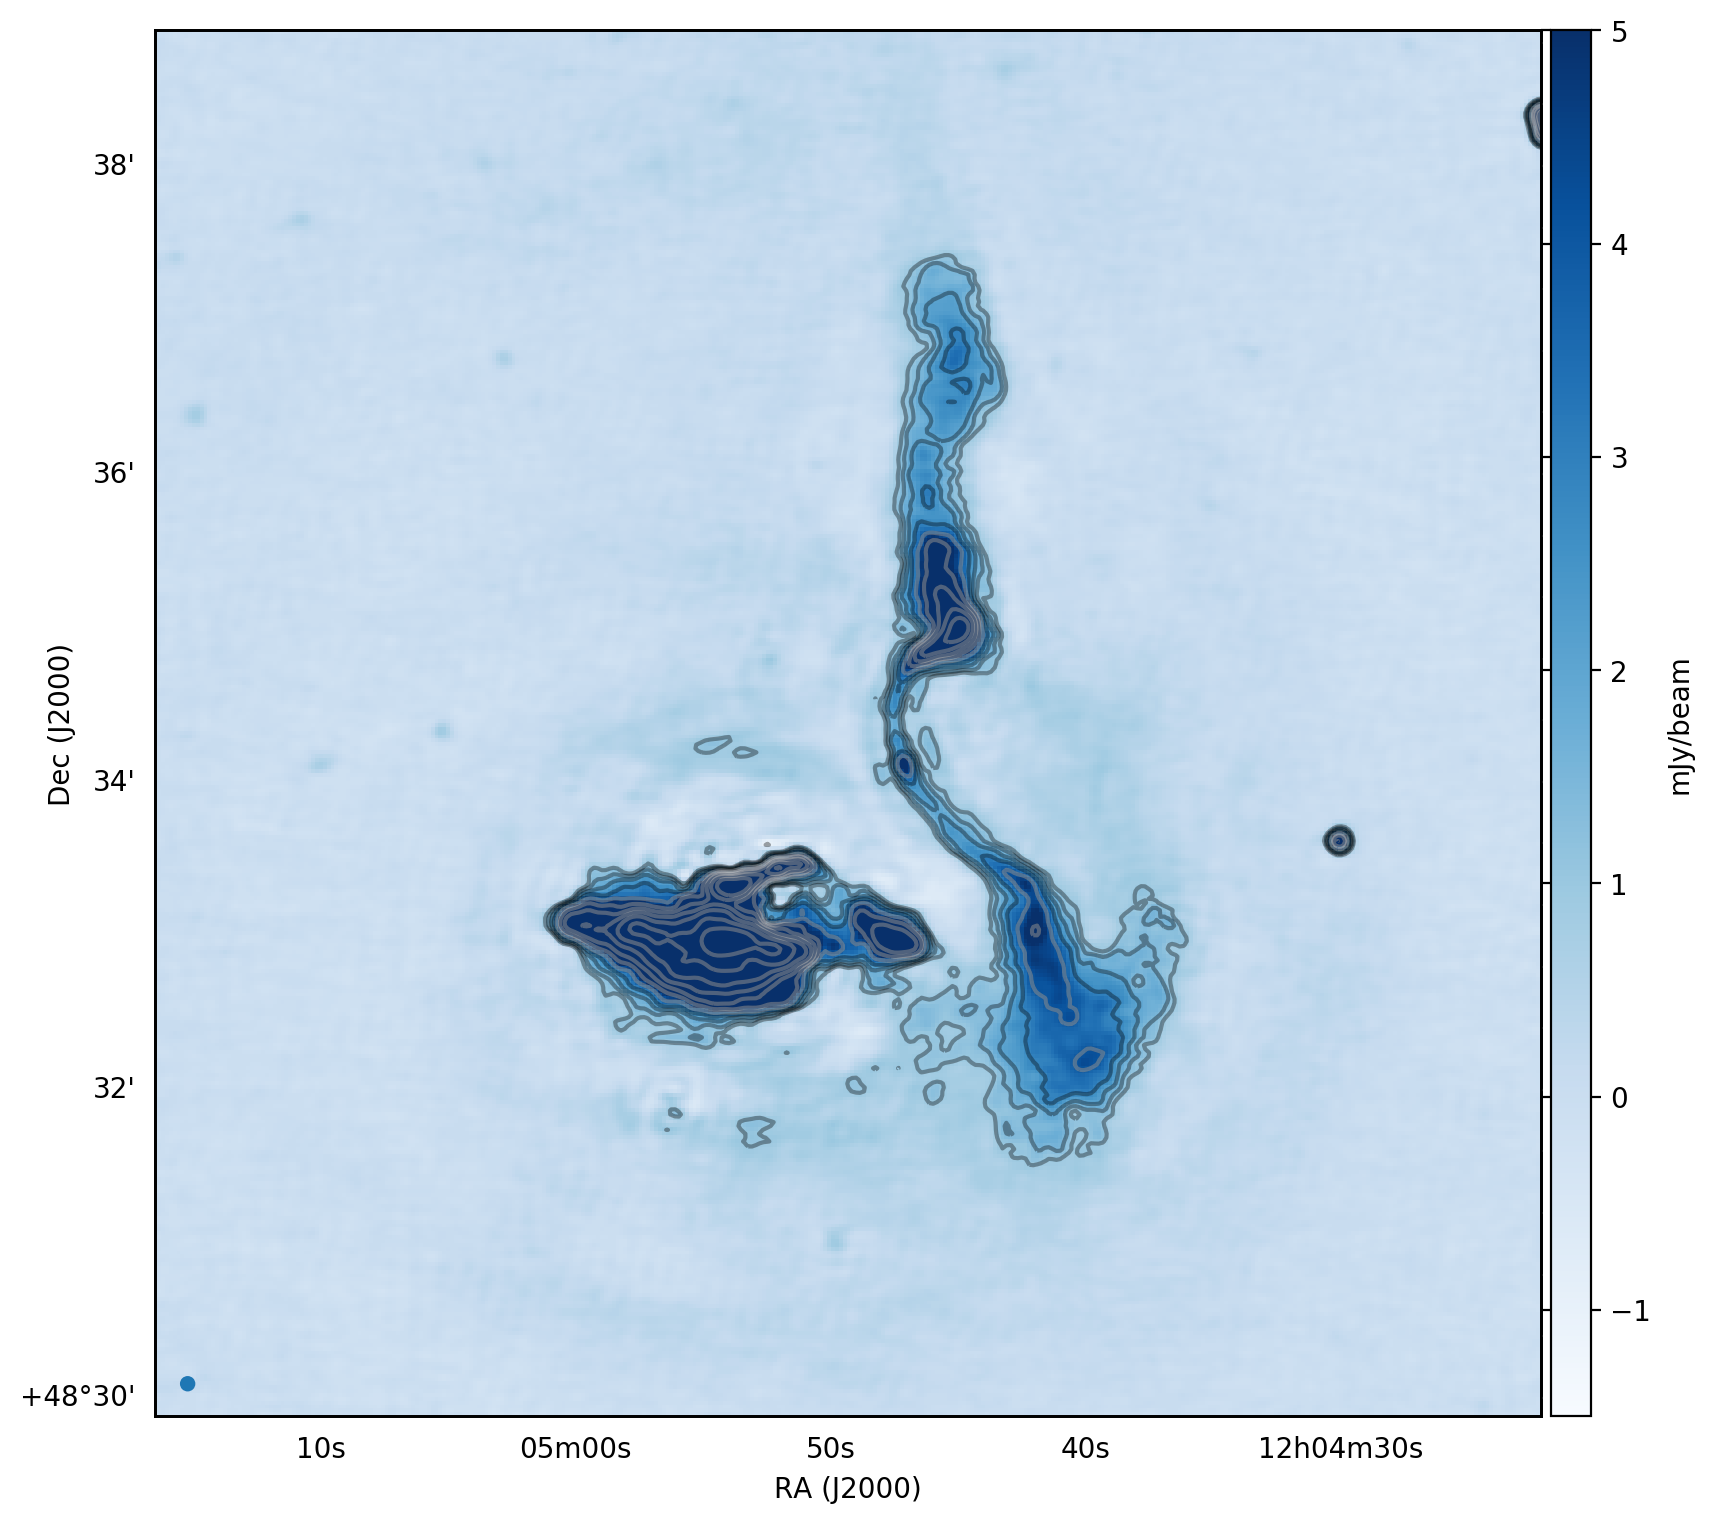
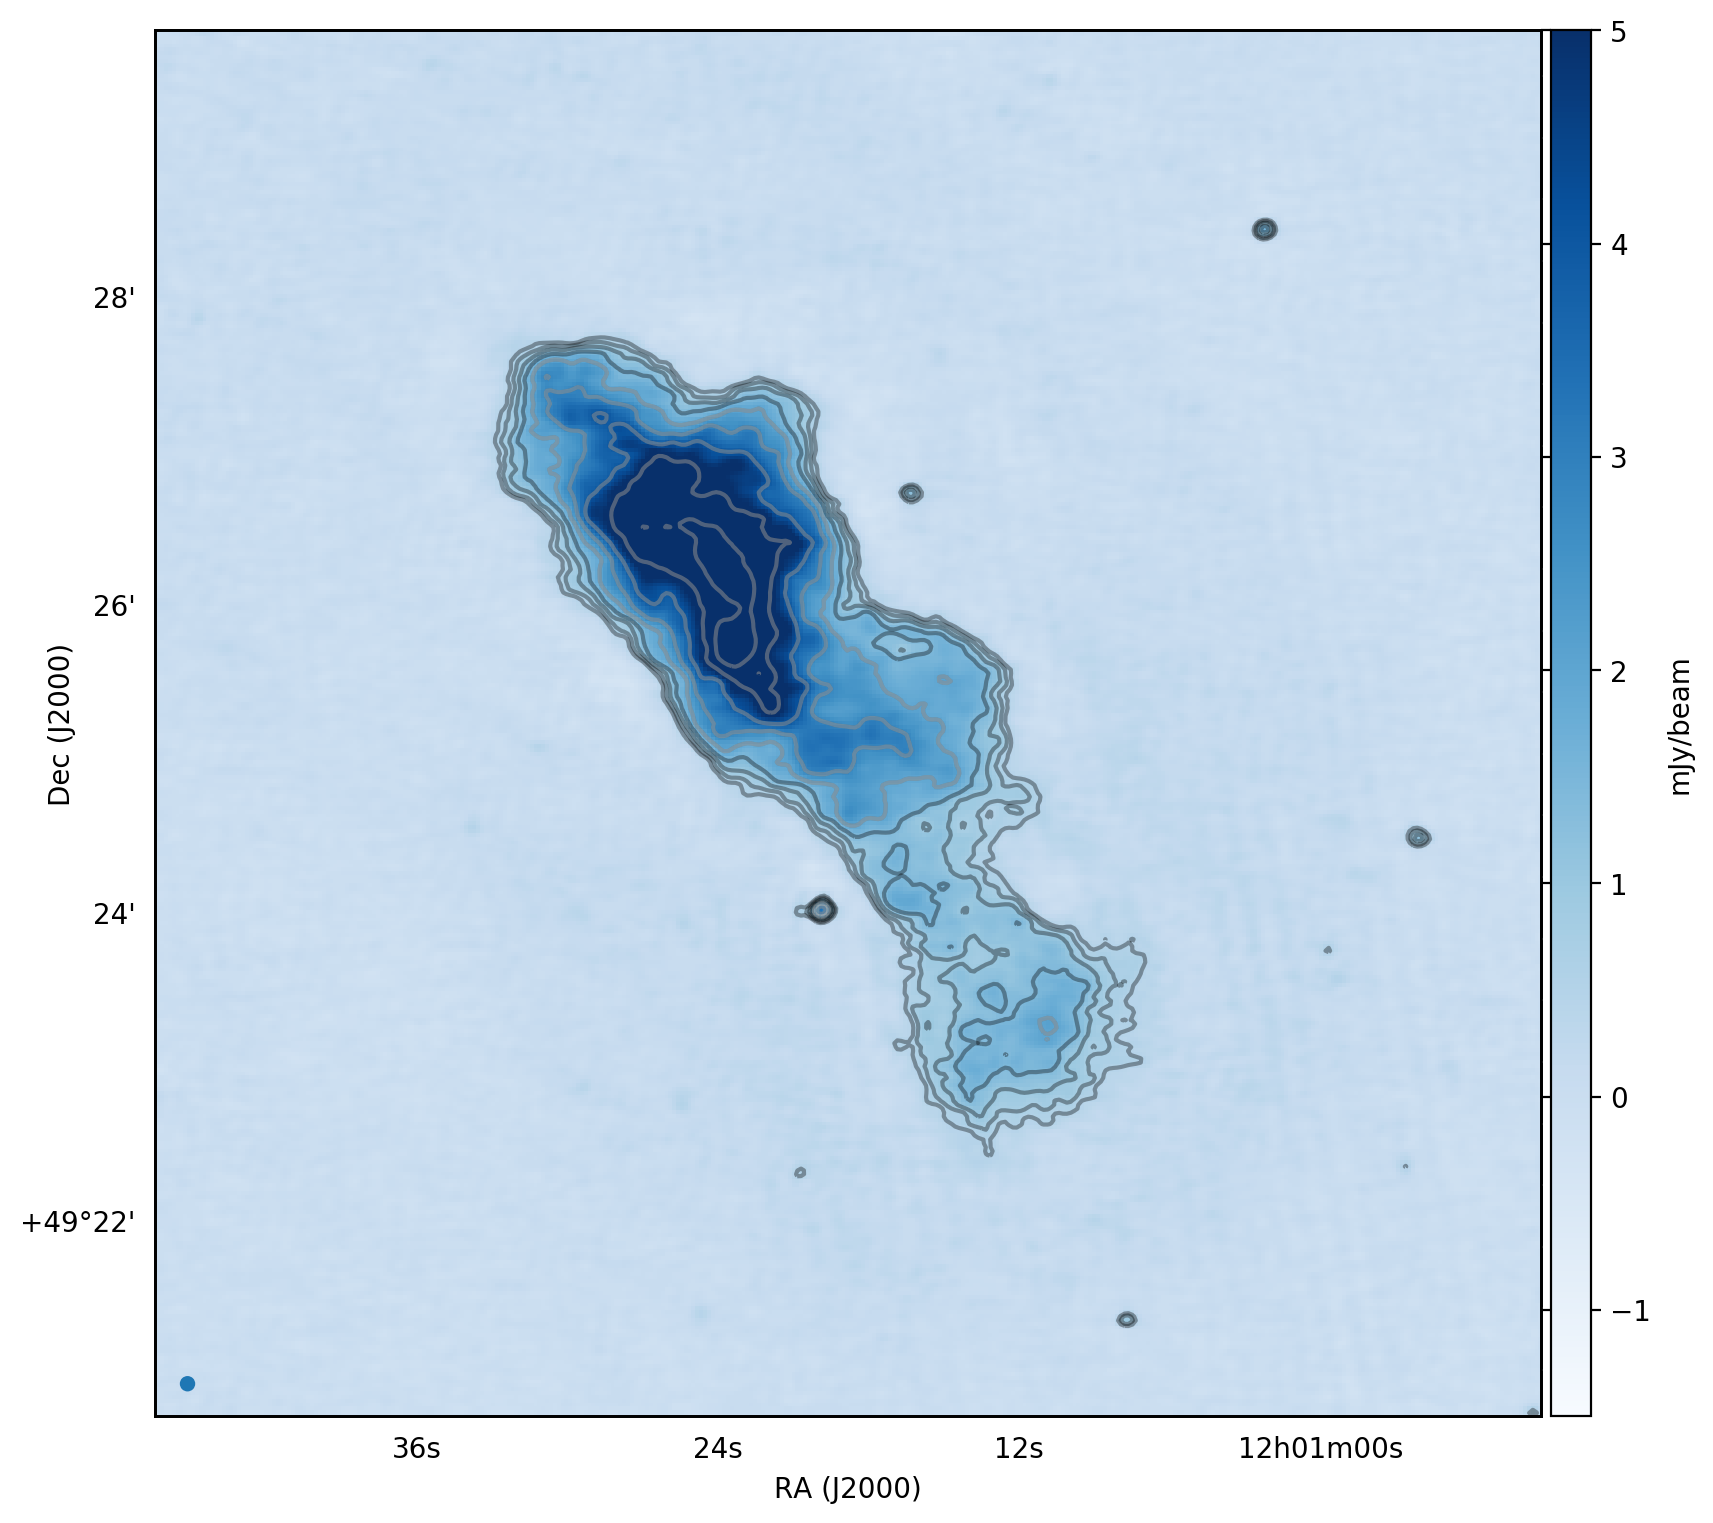
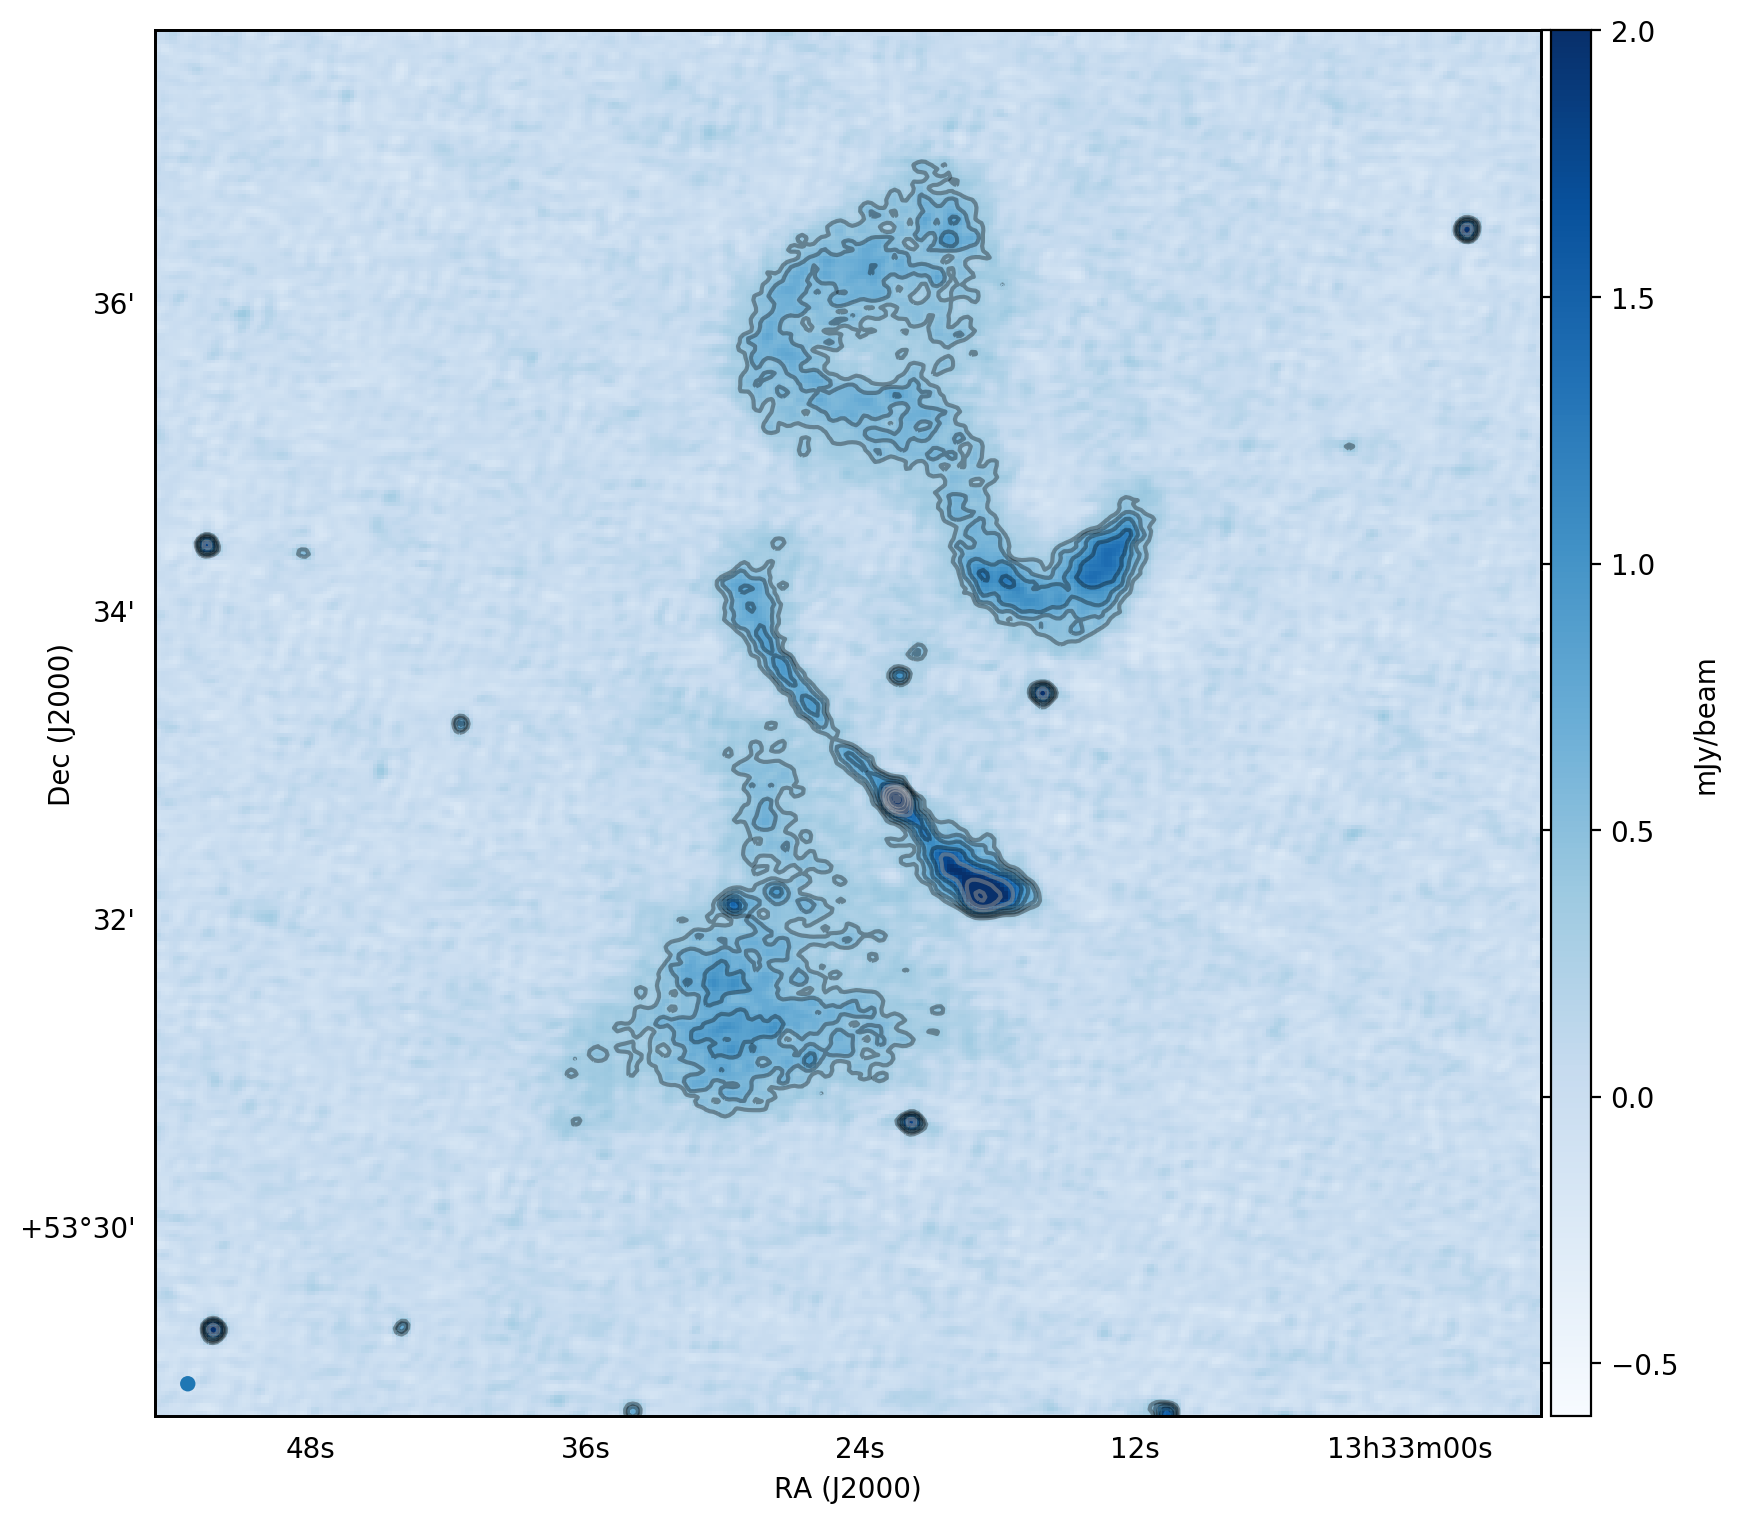
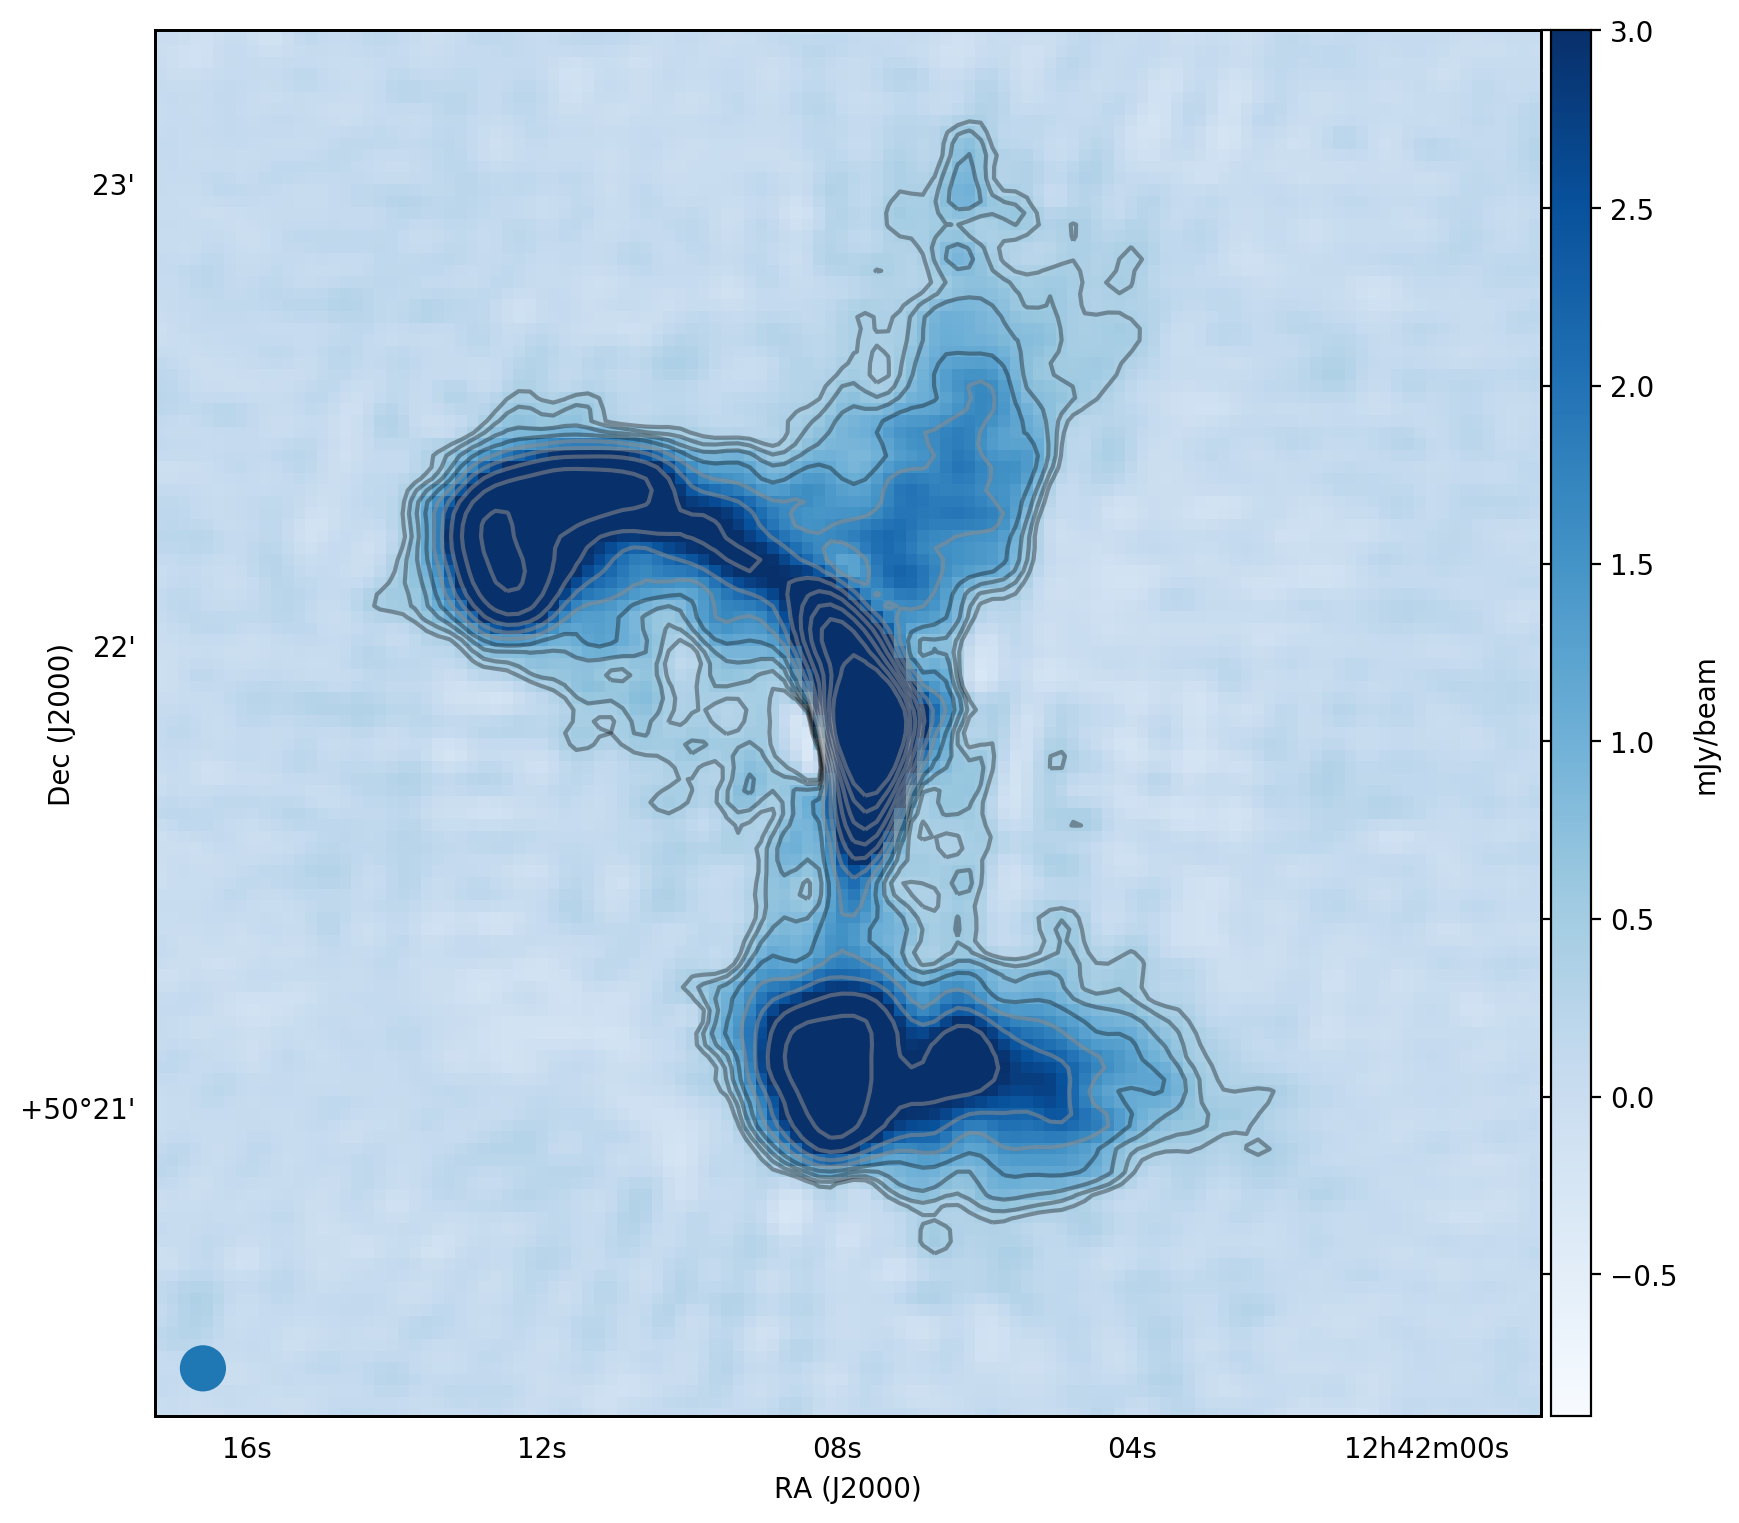
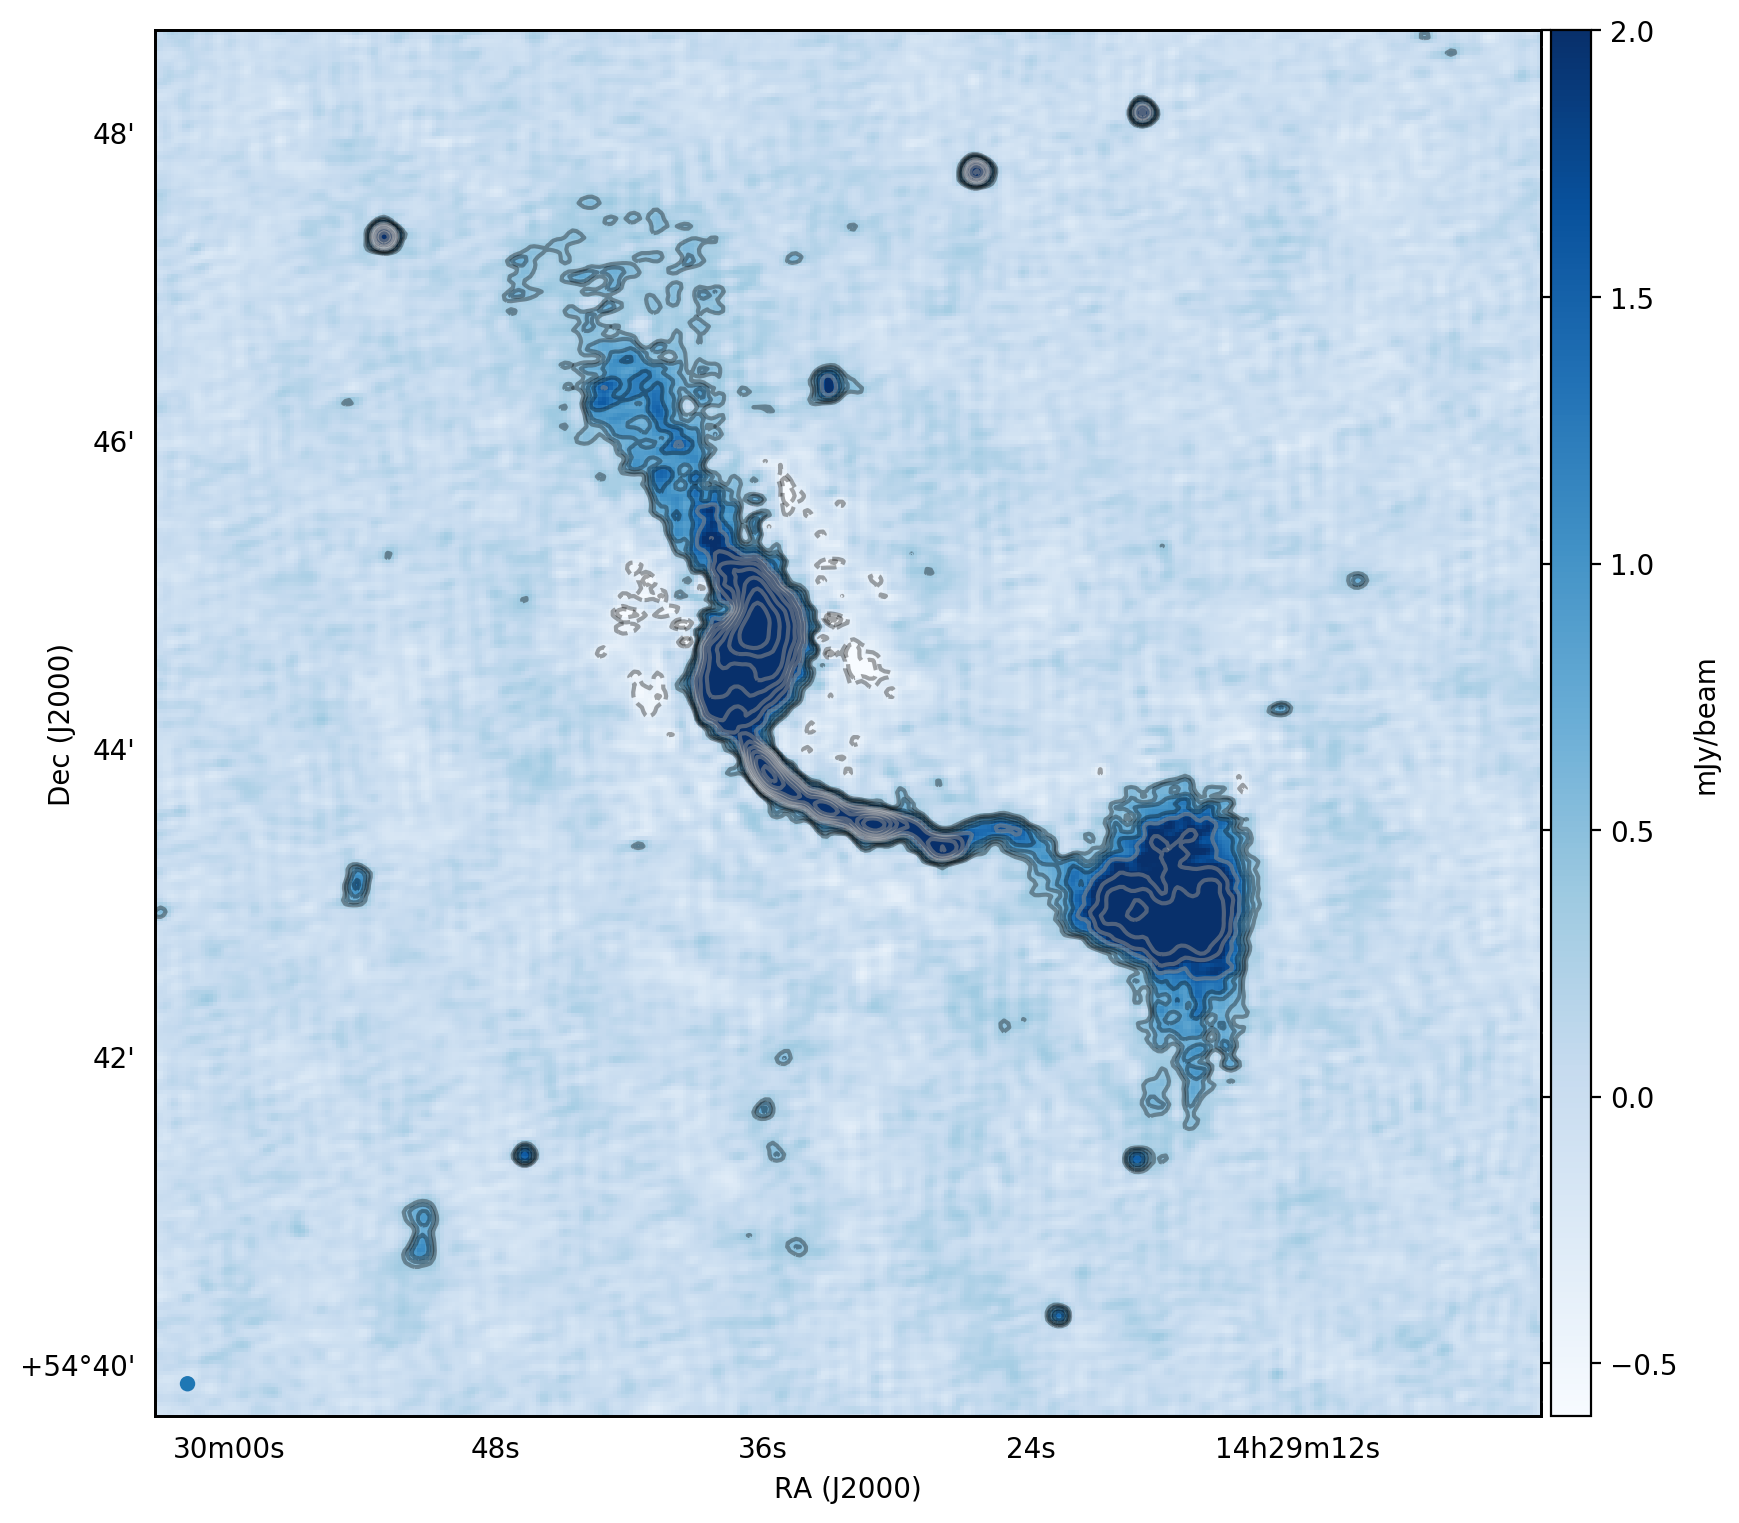
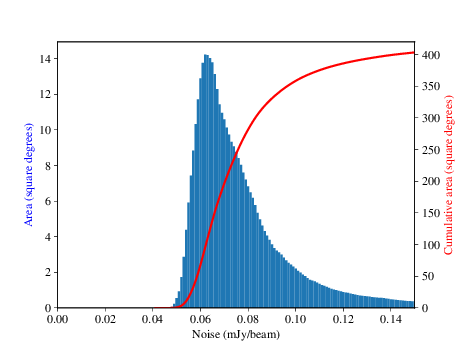
The LoTSS pointings tile the sky following a spherical spiral distribution (Saff & Kuijlaars 1997); they are typically separated by 2.58∘ and have six nearest neighbours within 2.8∘. With the FWHM of the hba_dual_inner station beam being 3.40∘ and 4.75∘ at the top (168 MHz) and bottom (120 MHz) of the LoTSS frequency coverage, respectively, there is significant overlap between the pointings. To produce the final data release images, a mosaic has been generated for each of the 58 pointings that was successfully processed. For each pointing the images of the (up to six) neighbouring pointings are reprojected to the frame of the central pointing using the astropy-based reproject code and then all seven (or fewer) pointings are averaged using the appropriate station beam and the central image noise as weights in the averaging. During the mosaicing of the high-resolution images, facets with uncertainties in the applied astrometric corrections (derived as described in Sec. 2.3.3) larger than 0.5 are excluded to ensure that the final maps have a high astrometric accuracy. This criterion is also a good proxy for image quality and allows us to identify and remove any facets that diverged during the processing due to poor calibration solutions. Once the images of the neighbouring pointings are combined the mosaiced map is blanked to leave just the pixels that lay within the 0.3 power point of the station beam of the central pointing. An example region from a mosaic is shown in Fig. 4 and the noise map of the entire mosaiced region is shown in Fig. 5.
To produce a catalogue of the radio sources we performed source detection on each mosaic using PyBDSF. The sources were detected with a 5 peak detection threshold and a 4 threshold to define the boundaries of the detected source islands that were used for fitting. The background noise variations were estimated across the images using a sliding box algorithm, where a box size of synthesised beams was used except in the regions of high signal-to-noise sources (150) where the box size was decreased to just 1212 synthesised beams; this box size was tuned to more accurately capture the increased noise level in these regions. The PyBDSF wavelet decomposition functionality was also utilised to better characterise the complex extended emission in the images. The resulting catalogues of the individual mosaics were combined and duplications were removed by only keeping sources that are detected in the mosaic to which they are closest to the centre.
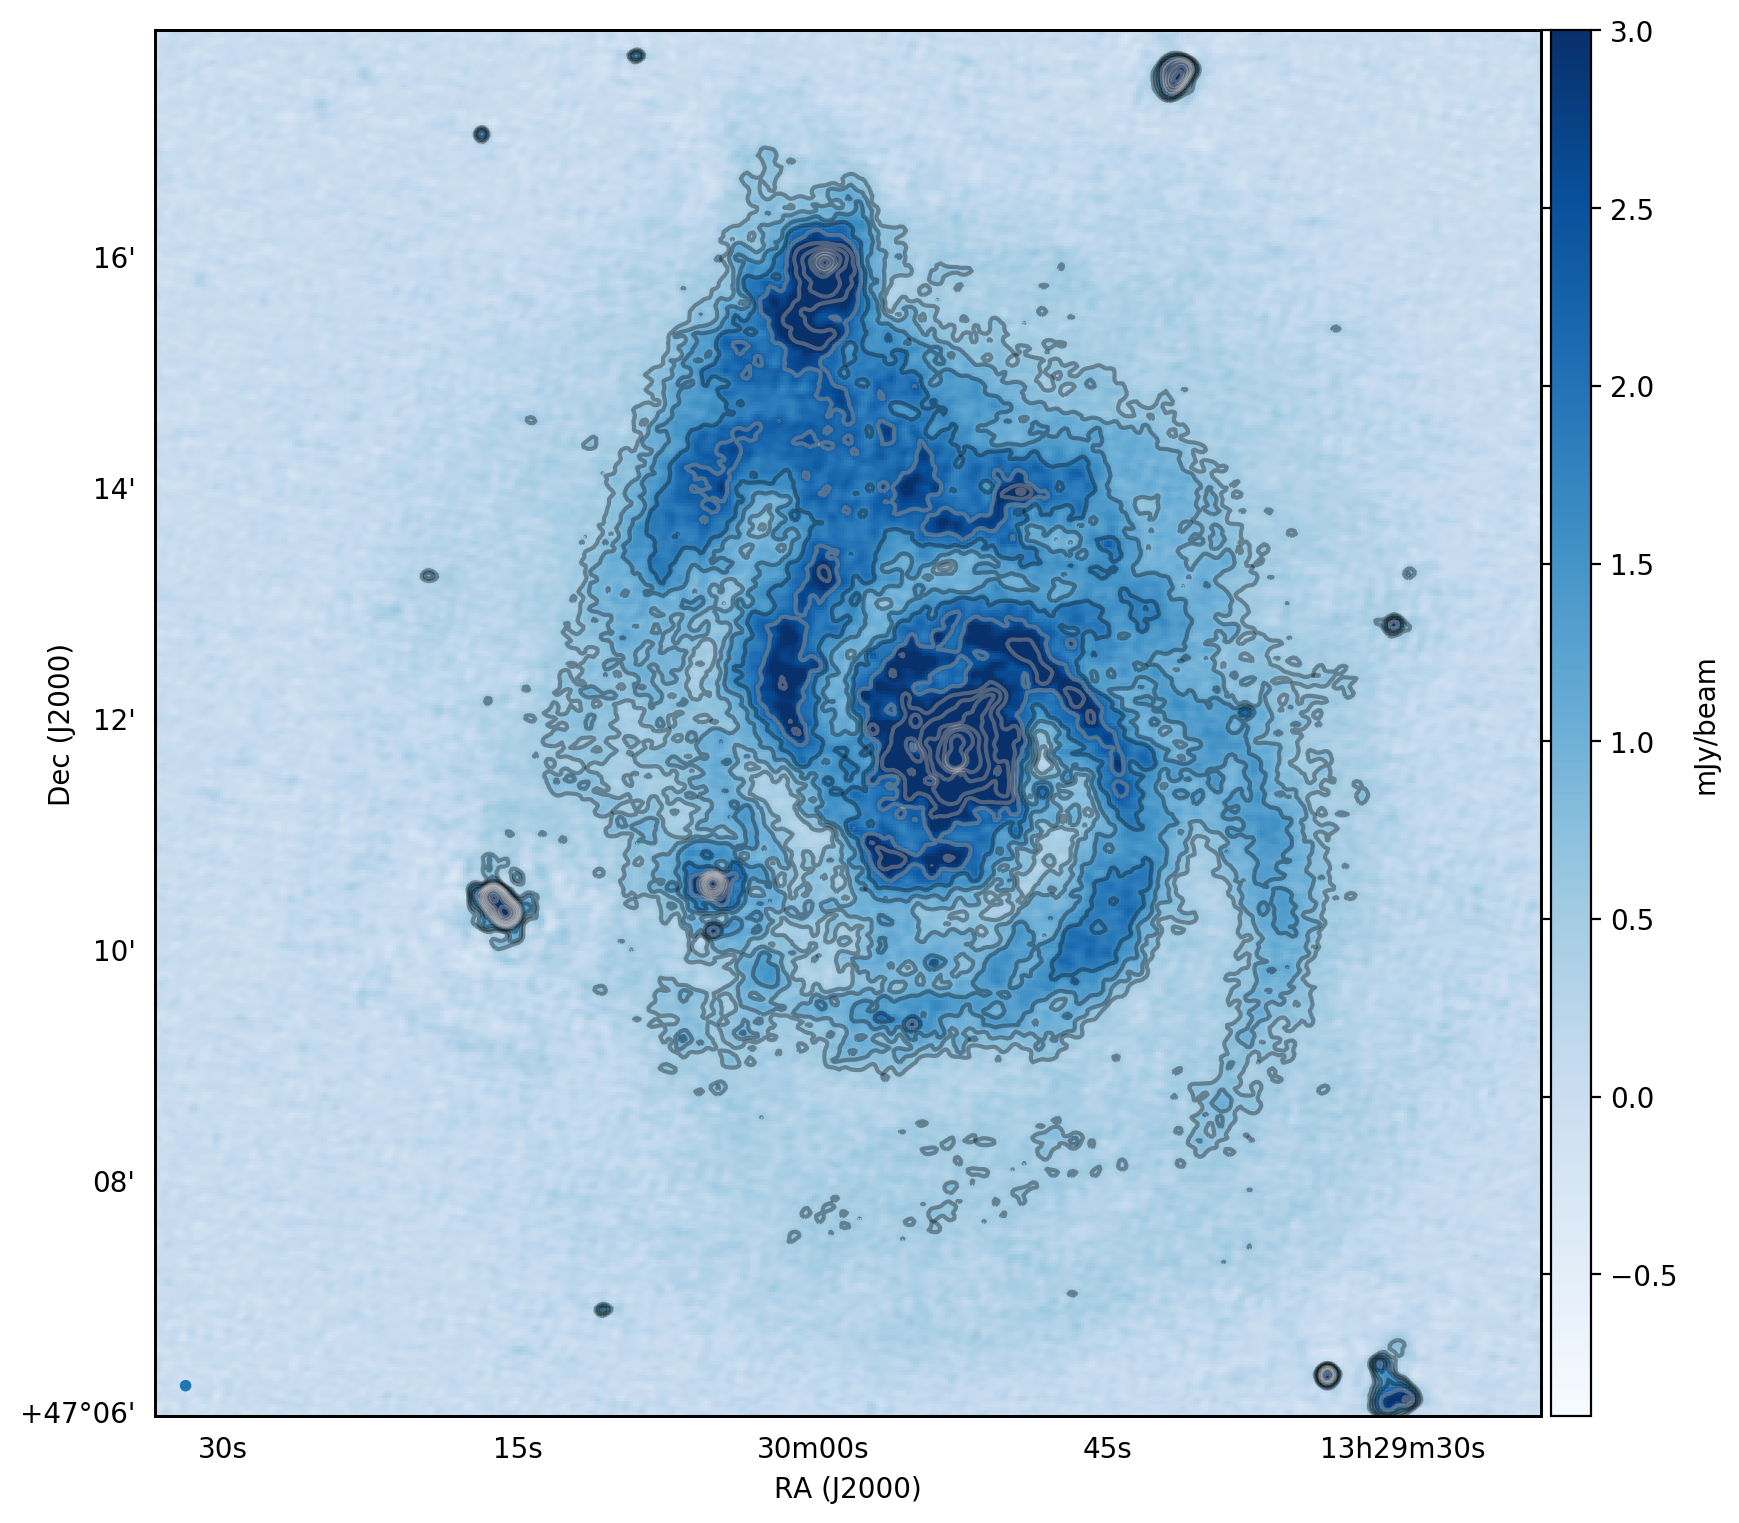
In the concatenated catalogue the columns kept from the PyBDSF output are the source position, peak brightness, integrated flux density, source size and orientation, and the statistical errors from the source fitting for each of these. In addition we keep the source code which describes the type of structure fitted by PyBDSF (see Table 1 caption for the definition of these) and the local root mean square noise estimate. We append columns that provide the mosaic identity, number of pointings that contribute to the mosaic at the position of the source, fraction of those in which the source was in the deconvolution mask, and whether or not the source is believed to be an artefact (see Williams et al. 2018b for a description of artefact identification). The fraction of the source in the deconvolution mask is calculated by finding the mask value (1 or 0) at the centre of each Gaussian component for every source in all of the contributing pointings and using the effective integration times to calculate the weighted average. To find the masked fraction for a source that consists of multiple Gaussian components, we use the integrated flux densities of each component as weights and assign the weighted average of the masked fraction of these components to the source. These final parameters, together with the mosaiced residual images, which are also provided, allow users to assess the quality of the deconvolution for sources. This is particularly important for faint sources that may not be in the masks and also for extended sources where, because of the integral of the dirty beam exceeding that of the restoring beam, the apparent flux density in dirty images is substantially larger than in deconvolved images. Example entries from the catalogue are shown in Table 1 and a selection of some of the more spectacular sources in our images are represented in Fig. 6.
Table 1: Example of entries in the LoTSS-DR1 source catalogue. The entire catalogue contains 325,694 sources. The entries in the catalogue are as follows: source identifier (ID), J2000 right ascension (RA), J2000 declination (Dec), peak brightness (), integrated flux density (), major axis (Maj), minor axis (Min), deconvolved major axis (DC Maj), deconvolved minor axis (DC Min), position angle (PA), local noise at the position of the source (RMS), type of source as classified by PyBDSF (Type – where ‘S’ indicates an isolated source that is fit with a single Gaussian; ‘C’ represents sources that are fit by a single Gaussian but are within an island of emission that also contains other sources; and ‘M’ is used for sources that are extended and fitted with multiple Gaussians), the mosaic identifier (Mosaic), the number of pointings that are mosaiced at the position of the source (Number pointings), the fraction of pointings in which the source is in the deconvolution mask (Masked fraction), and whether or not the entry is believed to be an artefact (Artefact). Only 2590 entries have been identified as artefacts (see Williams et al. 2018b). The errors in the catalogue are the uncertainties obtained from the PyBDSF source fitting. Additional uncertainties on the source extensions, astrometry, and flux scale are described in Section 3.
Source ID
RA
DEC
Maj
Min
DC_Maj
DC_Min
PA
RMS
Type
Mosaic
Number
Masked
Arte-
(mJy/
(mJy)
()
()
()
()
(∘)
(mJy/
pointings
fraction
fact
(beam)
(beam)
ILTJ140629.07
211.6211∘
54.0190∘
0.3
0.6
9.0
7.3
6.7
4.1
89
0.08
S
P209+55
2
0.00
+540108.3
1.2
0.8
0.1
0.1
2.9
2.0
2.9
2.0
64
ILTJ113833.90
174.6413∘
52.4434∘
0.4
0.5
7.7
5.2
0.0
0.0
87
0.06
S
P12Hetdex11
4
0.00
+522636.3
0.6
0.3
0.1
0.1
1.3
0.6
1.3
0.6
19
ILTJ114532.75
176.3864∘
47.9582∘
0.4
0.4
7.3
5.8
4.2
0.0
61
0.06
S
P15Hetdex13
4
0.00
+475729.5
0.6
0.5
0.1
0.1
1.5
0.9
1.5
0.9
36
ILTJ114443.86
176.1827∘
46.5350∘
1.4
2.2
8.7
6.2
6.3
1.7
168
0.11
S
P15Hetdex13
2
0.77
+463206.0
0.2
0.4
0.1
0.2
0.8
0.5
0.8
0.5
12
ILTJ134204.70
205.5196∘
49.5226∘
1.0
1.1
6.8
6.0
0.0
0.0
87
0.06
S
P42Hetdex07
3
1.00
+493121.4
0.2
0.2
0.1
0.1
0.5
0.4
0.5
0.4
21
ILTJ111452.35
168.7181∘
54.7318∘
0.5
0.4
5.9
5.4
0.0
0.0
121
0.08
S
P169+55
3
0.71
+544354.6
0.4
0.3
0.1
0.1
0.9
0.8
0.9
0.8
70
ILTJ122721.08
186.8378∘
50.8748∘
0.6
3.0
17.3
10.2
16.2
8.3
18
0.06
S
P26Hetdex03
4
0.60
+505229.1
0.4
0.7
0.1
0.1
1.8
0.9
1.8
0.9
10
ILTJ121124.15
182.8506∘
47.0435∘
1.9
8.0
27.5
5.5
0.0
0.0
177
0.11
M
P19Hetdex17
3
0.93
+470236.5
1.8
0.2
0.1
0.3
4.2
0.4
4.2
0.4
6
ILTJ143026.91
217.6121∘
48.0969∘
0.5
0.6
7.3
6.2
4.2
1.7
135
0.06
S
P217+47
3
0.70
+480548.8
0.4
0.4
0.1
0.1
1.0
0.7
1.0
0.7
35
ILTJ124531.14
191.3797∘
53.6874∘
0.4
0.7
10.6
6.2
8.8
1.7
46
0.06
S
P191+55
4
0.59
+534114.7
0.7
0.7
0.1
0.1
2.1
0.8
2.1
0.8
17
ILTJ144630.58
221.6274∘
52.8271∘
0.6
7.4
25.7
17.0
25.0
15.9
61
0.30
S
P223+52
3
1.00
+524937.5
3.6
2.8
0.2
0.2
9.2
5.7
9.2
5.7
47
ILTJ115435.71
178.6488∘
49.2769∘
0.3
0.4
9.9
5.0
0.0
0.0
102
0.06
S
P18Hetdex03
5
0.00
+491636.8
1.0
0.4
0.1
0.1
2.5
0.7
2.5
0.7
15
ILTJ134314.24
205.8093∘
51.0778∘
0.3
0.6
8.5
7.7
6.0
4.8
166
0.06
S
P206+52
4
0.00
+510440.1
0.6
0.7
0.1
0.1
1.8
1.5
1.8
1.5
87
ILTJ150957.26
227.4886∘
54.5732∘
0.4
1.9
15.8
11.4
14.6
9.7
99
0.14
S
P227+53
2
0.00
+543423.6
2.5
1.6
0.1
0.2
5.9
3.8
5.9
3.8
56
3 Image quality
The observations used in this data release were conducted between 2014 May 23 and 2015 October 15 and the varying observing conditions significantly impact the image quality even after direction-dependent calibration, which reduces the impact of ionospheric disturbances. In this section, we assess the derived source sizes, astrometric precision, flux-density uncertainty, dynamic-range limitations, sensitivity, and completeness, and briefly discuss some remaining calibration and imaging artefacts.
3.1 Source extensions
Identifying unresolved sources using the PyBDSF-derived measurements is complicated by several factors. For example, astrometric errors in the mosaiced images cause an artificial broadening of sources, the varying quality of calibration blurs the sources by differing amounts, time averaging and bandwidth smearing can artificially extend sources, and the extent to which a source is deconvolved impacts its measured size. To accurately quantify all this would require realistic simulations in which compact sources are injected into the -data taking into account DDEs. Furthermore, as the precise criteria for distinguishing resolved sources varies between facets and observations, a prohibitively large number of these simulations would need to be performed. Our calibration and imaging pipelines are continuing to evolve and hence such a large undertaking is beyond the scope of this present study. An alternative approach would have been to inject point sources into our maps and use these to characterise the source finding algorithm; however, such a simulation would not account for distortions in source morphologies caused by calibration inaccuracies. Instead we attempted to assess whether or not sources are resolved by looking at the extensions of real sources that we assert are unresolved and we used these to define an average criterion with which additional unresolved sources can be identified across the entire mosaic.
To create a sample of unresolved sources the LoTSS-DR1 catalogue was first filtered to contain only isolated sources, which we define as being sources with no other LoTSS-DR1 source within . Any sources that were not in the deconvolution mask in every pointing in which they are detected were also excluded. From the remaining entries we then selected only sources that are classified as ‘S’ by PyBDSF; this source code corresponds to sources that are the only objects within a PyBDSF island and are well fit with a single Gaussian. Finally, as described below, we imposed a cut on the major axis of the LoTSS-DR1 sources to limit the maximum extent of the low-frequency emission.
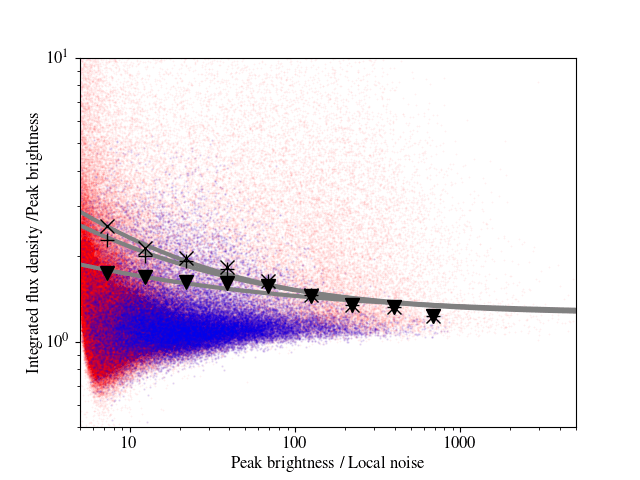
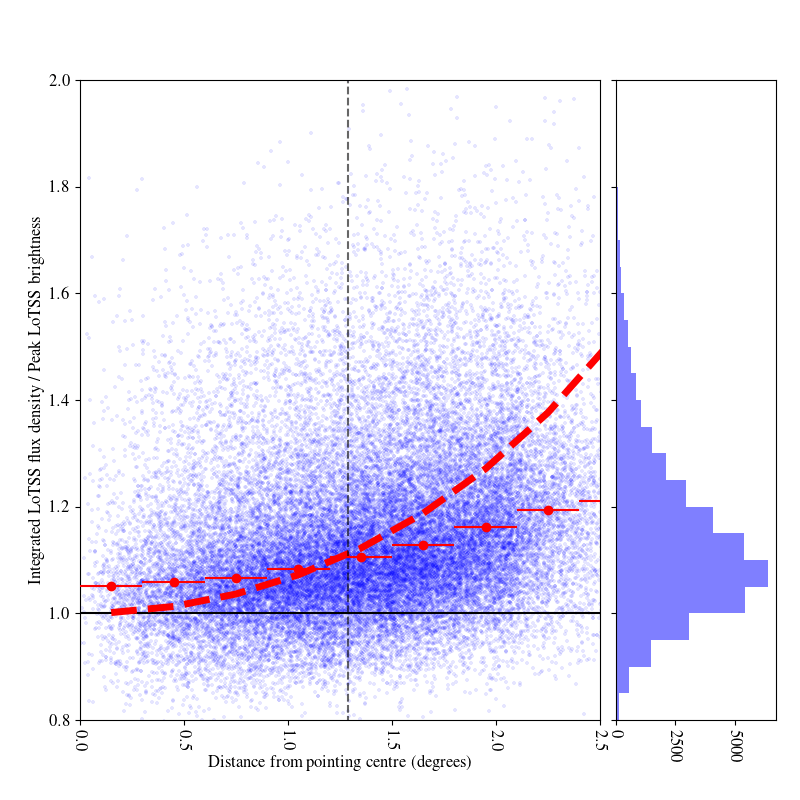
We emphasise that, owing to imperfect calibration, most truly unresolved sources in the LoTSS-DR1 catalogue do not have an integrated flux density to peak brightness ratio of 1.0 or a fitted major axis size of 6 (i.e. a size equal to the restoring beam). For example, the approximately 50 seemingly compact, bright (signal to noise in excess of 500) sources that meet the above criteria all have measured sizes in the FIRST catalogue of less than 5 and we can therefore assert these are either unresolved or barely resolved. However, in the LoTSS-DR1 catalogue these sources have a median ratio of the integrated flux density to peak brightness equal to 1.12 with a median absolute deviation of 0.04. Furthermore, for seemingly compact LoTSS-DR1 sources that are detected with a lower signal to noise there is significantly more variation in the measured integrated flux density to peak brightness ratio. To characterise this, and separate extended from compact sources, we derived an envelope with the functional form , which encompasses 95% of the LoTSS-DR1 sources that meet the above criteria (see Fig. 7). The factor of 1.25 was derived from the median plus three times the median absolute deviation of the integrated flux density to peak brightness ratio of the seemingly compact high signal-to-noise (500) sources. We used this envelope to define a boundary between compact and extended sources.
The fitted envelope is dependent upon the cut used on the major axis of the LoTSS-DR1 sources and we explored the impact of this by varying that selection criterion from 10 to 20 (see Fig. 7). We find that this has little impact on the classification of sources with signal to noise of more than 100 as either extended or compact; however, it has a much larger impact on sources with lower signal-to-noise ratios. Whilst there is no definite value to use for this cut, we chose a 15 limit on the LoTSS-DR1 major axis, which gives a best fit envelope of . There are a total of 280,000 LoTSS-DR1 sources within this envelope and we define these as compact. As a cross check we note that 19,500 of these sources correspond to entries in the FIRST catalogue and in that catalogue 88% of them are less than 5 in size, indicating that they are also compact at higher frequencies.
3.2 Astrometric precision
The astrometry of our images is originally set by our phase calibration based on the TGSS-ADR1 catalogue. However, during direction-dependent calibration the astrometry can shift between regions because of the varying precision of the calibration models that are built up in different facets. For example, after direction-dependent calibration of a LOFAR data set Williams et al. (2016) found offsets that varied systematically across their field, but they were able to correct these using the positions in the FIRST catalogue to provide a LOFAR HBA image with a standard deviation in the RA and Dec offsets from FIRST of just 0.4. In our processing we also refined the astrometric accuracy after the self-calibration cycle is complete by correcting each facet independently using positions in the Pan-STARRS optical catalogue. Furthermore, during the mosaicing we do not include facets that have an uncertainty in the estimated astrometric correction of greater than 0.5 to ensure high astrometric accuracy (see Sec. 2).
To determine the resulting astrometric accuracy of our mosaic catalogue we performed a simple nearest neighbour cross match in which we took the closest Pan-STARRS, WISE, and FIRST counterpart that lies within 5 of each of the compact LoTSS-DR1 sources that were identified using the procedure described in Sec. 3.1. We then created histograms of the RA and Dec offsets and fit these with a Gaussian, where the location of the peak and the standard deviation correspond to our systematic position offset and the total uncertainty; these total errors are a combination of errors in the LoTSS-DR1 positions from the source finding software, the real astrometric errors in the LoTSS-DR1 positions, and the errors in the positions of objects in the cross-matched surveys (which were selected owing to their high astrometric accuracy). The astrometry of the Pan-STARRS catalogue was determined using a combination of 2MASS and GAIA positions and the typical standard deviation of the offsets from GAIA positions is less than 0.05 (Magnier et al. 2016). The WISE catalogue has a positional uncertainty of 0.2 (Cutri et al. 2012) in RA and Dec with respect to the 2MASS Point Source Catalog for sources detected at high significance, and the FIRST survey has astrometric uncertainties of 0.1 with respect to the absolute radio reference frame (White et al. 1997).
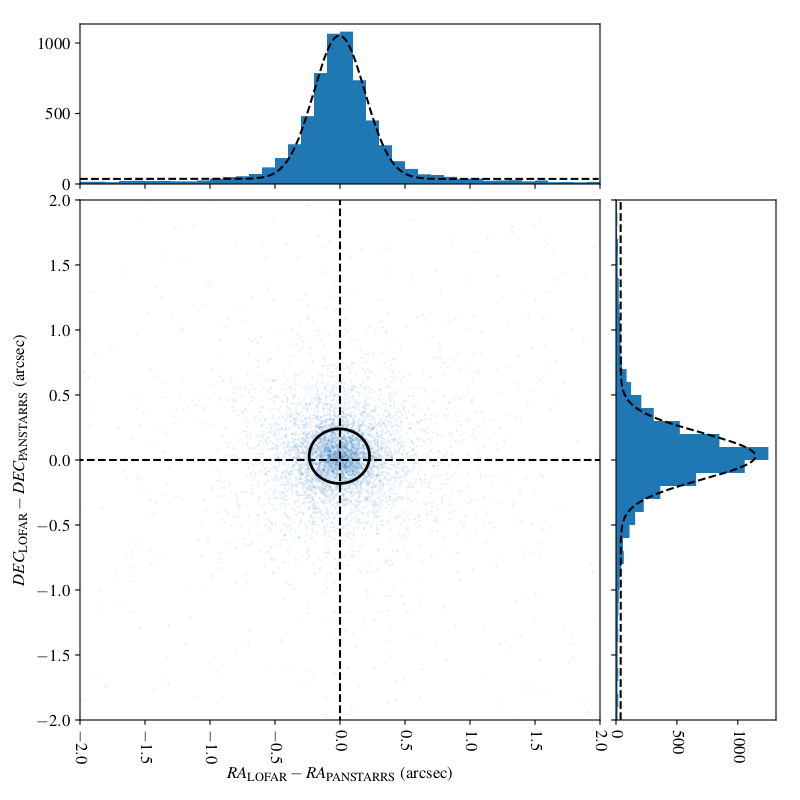
We cross-matched a total of 7100 sources from the LoTSS-DR1 catalogue to all three comparison sources and we found that, for these sources, there is a systematic positional offset from Pan-STARRS of less than 0.03 and the standard deviation of the offsets is less than 0.2 in both RA and Dec (see Fig. 8). Similarly, in comparison to WISE, we found the same sources have a systematic offset of less than 0.01 and a standard deviation of less than 0.27 in both RA and Dec. When comparing to FIRST, the systematic offsets are less than 0.02 and the standard deviation is approximately 0.3 in both RA and Dec. The direction of the derived systematic offsets varies when comparing the LoTSS positions with the three different surveys. We also examined the astrometric accuracy of our mosaic catalogue as a function of the LoTSS-DR1 peak brightness. We checked the accuracy of the catalogue to better estimate the real astrometric errors in the LoTSS-DR1 positions as bright (20 mJy), compact sources typically have errors in their derived positions of less than 0.05. For the compact LoTSS-DR1 sources above 20 mJy the fitted standard deviation to a Gaussian of the RA and Dec offsets from Pan-STARRS, and hence the approximate absolute astrometric accuracy of LoTSS-DR1, is less than 0.2. The standard deviation gradually increases to for the faintest LoTSS-DR1 sources (0.6 mJy) where the uncertainty in position from the source fitting can be as high as 1.0.
To assess the variation in the astrometric accuracy of various pointings prior to mosaicing the same analysis was performed on the catalogues derived from the LoTSS-DR1 images of the individual pointings. We only used similar sources to the previous analyses by first cross-matching the catalogues derived from the individual pointings with the LoTSS-DR1 compact source catalogue (see Sec. 3.1). The resulting catalogue was then cross-matched with the Pan-STARRS catalogue. In addition we also imposed cuts on the catalogues from each LoTSS-DR1 pointing to include only sources within the 0.3 power point of the station beam, which is where the primary cut is made during the mosiacking. Furthermore, we only used sources classified by PyBDSF as ‘S’ type sources in the pointing catalogues and those located in facets where the uncertainties in the Pan-STARRS dervied astrometric corrections of less than . We found that the standard deviation of the Gaussian fitted to a histrogram of the RA and Dec astrometric offsets from Pan-STARRS varied from 0.31 to 0.54 with an average of 0.39 and that the peak of the fitted Gaussian functions were displaced by between 0.05 and 0.12. These numbers give an indication of the varying astrometric accuracy across the HETDEX Spring Field region. We note that, as was found in the mosaiced images, these astrometric errors vary with the signal to noise of the detections and this explains why the individual pointings have apparently larger astrometric errors than the mosaiced images.
3.3 Accuracy of the flux density scale
Owing to inaccuracies in the existing LOFAR beam models, transferring amplitude solutions derived from calibrators to the target field data does not generally result in an accurate flux density scale for the target field. For example, Hardcastle et al. (2016) found the errors in the flux density scale to be up to 50%. To correct this Hardcastle et al. (2016) devised a bootstrapping approach to align the flux density scale of their LOFAR images with the flux density scales of other surveys whilst also providing more reliable in-band spectral index properties. We applied this technique early in the LoTSS-DR1 processing pipeline to ensure consistency with the VLSSr and WENSS flux density scales (see Sec. 2). To assess whether the flux density scale remains consistent throughout the processing we performed the same bootstrapping calculation with our final images. From our final images, the recalculated correction factors range from 0.8 to 1.3 with a mean of 1.0 and a standard deviation of 0.08. We did not apply these recalculated factors in this data release but they indicate that in some circumstances the flux density scale can drift during the processing; however, 60% percent of the fields remain within 5% of the original bootstrapped derived values.
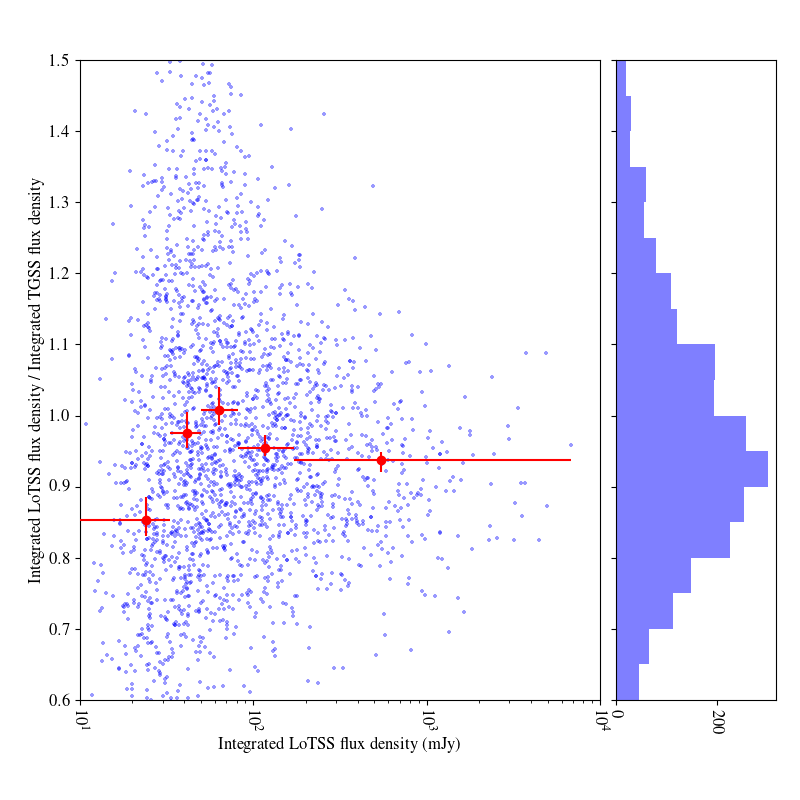
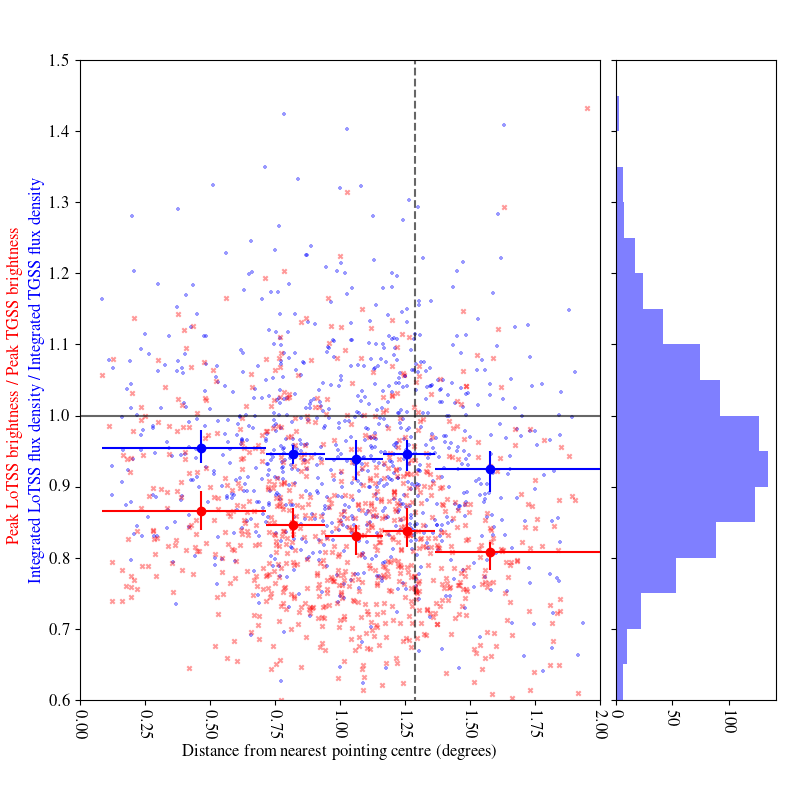
For further verification of the flux density scale we compared the catalogued integrated flux density in the compact source LoTSS-DR1 catalogue to those in the TGSS-ADR1 catalogue. The TGSS-ADR1 measurements were not used during the bootstrapping to allow for this comparison. Furthermore, the TGSS-ADR1 flux density scale is not tied to the flux density scales of VLSSr or WENSS as the survey was instead calibrated directly against bright, well-modelled sources, on the Scaife & Heald (2012) flux density scale. For the 835 compact sources with LoTSS-DR1 integrated flux densities in excess of 100 mJy the median ratio of the integrated LoTSS-DR1 flux densities to the integrated TGSS-ADR1 flux densities is 0.94 and the standard deviation of 0.14 (see the left panel of Fig. 9). However, at integrated flux densities below 100 mJy, where the point-source completeness of the TGSS-ADR1 catalogue decreases to less than 90% and detections are not always at very high significance, there is substantially more scatter in the ratio of TGSS-ADR1 to LoTSS-DR1 integrated flux densities with a standard deviation of 0.27.
Part of the scatter in the TGSS-ADR1 and LoTSS-DR1 integrated flux density ratios is from variations in the quality of the images of various LoTSS-DR1 pointings. To examine the consistency of our measurements we compared the integrated flux density of compact sources in catalogues derived from each of the pointings used in LoTSS-DR1 with the TGSS-ADR1 catalogue. The median ratio of the LoTSS-DR1 integrated flux densities to the TGSS-ADR1 integrated flux densities varies from 0.75 to 1.15 with an median of 1.0 and a standard deviation of 0.08. The discrepancy between this median integrated flux density ratio, which is derived from individual LoTSS-DR1 pointings, and corresponding value for the entire mosaic (0.94), appears to be a consequence of the mosaicing. Sources with apparently low LoTSS-DR1 integrated flux densities more often reside in pointings with apparently low noise levels that are more highly weighted during the mosaicing procedure. Furthermore, we made use of the large overlap between pointings to examine flux density scale variations and found that the standard deviation of the median ratio of the integrated flux density between pointings is 0.2 and, whilst the maximum discrepancy in the integrated flux density measurements is 55%, 80% of the ratios are within 20% of unity.
We also searched for trends between the source integrated flux density measurements and the distance from the LoTSS pointing centres (see Fig. 9). Using the 835 bright compact sources in the mosaic catalogue that were cross-matched with TGSS-ADR1 we found no strong dependence of the ratio of the LoTSS-DR1 integrated flux density to the TGSS-ADR1 integrated flux density on the distance from the closest LoTSS pointing; the inner bin has a ratio of 0.95 and the outer has a ratio of 0.92. For the peak brightness the radial dependence is slightly stronger with the inner bin at 0.86 and the outer bin at 0.81. To assess the impact at further distances we look at the peak brightness to integrated flux density ratio of compact sources in the LoTSS-DR1 catalogues derived from individual pointings. Given that our data are averaged to two channels per SB and 8 s, it may be expected that time-averaging and bandwidth-smearing effects are non-negligible in the LoTSS-DR1 mosaics; for example, we estimate using the formulas given by Bridle & Schwab (1989) that at 6 resolution the time-averaging and bandwidth smearing are as shown in Fig. 10. However, ddfacet has a facet-dependent PSF which, for deconvolved sources, accounts for the impact of smearing. As a result the ratio of the peak brightness to integrated flux density in our LoTSS-DR1 images does not have as strong a dependence on distance from the nearest pointing centre as found in other studies that used imagers that do not correct for this. We note that there is still a small radial dependence. This may be because facets further from the pointing centre are generally larger and, as a consequence, the ionospheric calibration in those regions is not as precise. Overall, whilst there are variations in the accuracy of the flux density scale across the mosaic, we place a conservative uncertainty of 20% on the LoTSS-DR1 integrated flux density measurements.
3.4 Dynamic range
The dynamic range in our images is limited and bright sources have an impact on the image noise properties in a non-negligible fraction of the area that has been mapped. Whilst there are many factors that impact the dynamic range, our testing of the data processing procedure has indicated that the amplitude normalisation scheme that we used certainly plays a significant role. Other contributors include the layout and size of the facets and the quality of the models that are built up during the self-calibration procedure.
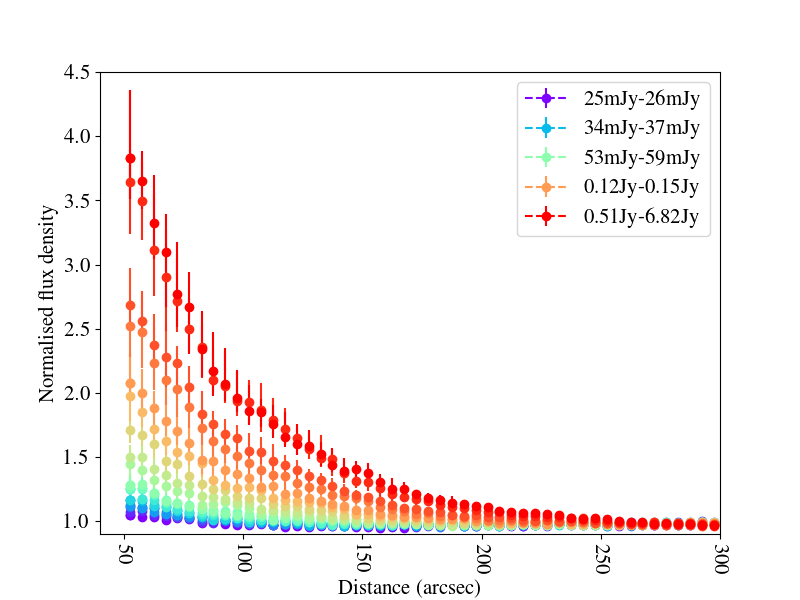
To assess the dynamic-range limitations we examined pixels on mosaics of the final ddfacet residual images in 5 wide annuli around compact LoTSS-DR1 sources that were identified in Sec. 3.1. A profile of the pixel standard deviation within every annulus was determined for each of these sources out to a radius of 500. Each profile was fit with a Gaussian function plus a constant, which we assume is the level of the noise in the surrounding region and we used this to normalise the measurements. Within each distance bin, we averaged together all normalised noise measurements of sources within a given integrated flux density ranger and the mean and standard deviation was determined to create an average noise profile as a function of distance. These average noise profiles for various integrated flux density ranges are shown in Fig. 11.
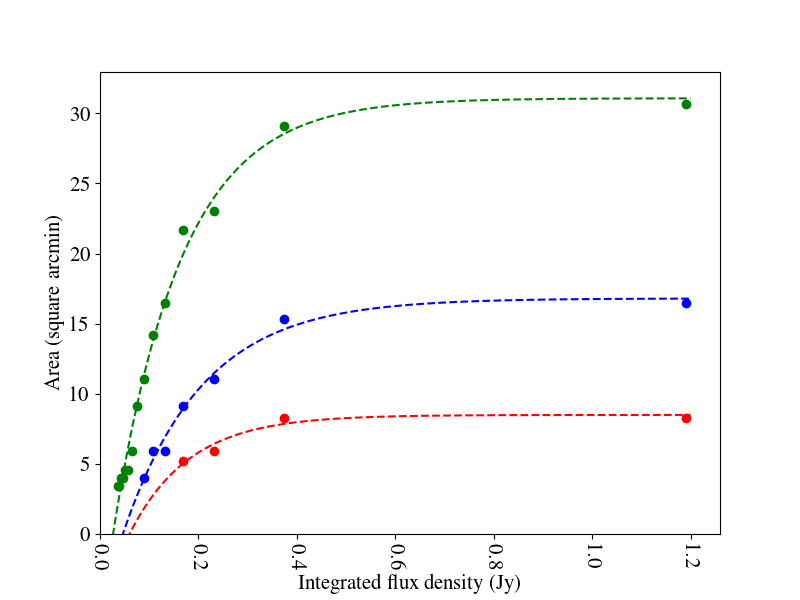
The area in square degrees of sky that surrounds bright sources and has a noise level more than 15% higher than the noise in the wider region depends on the source integrated flux density according to approximately , where is the integrated flux density in mJy. From this equation, and removing overlapping regions, we calculated that the noise is limited by the dynamic range of our maps (i.e. the noise is more than 15% higher than the noise level in regions uncontaminated by bright sources) for 32 square degrees of the 424 square degrees that were imaged, i.e. 8% of the total area of the survey. Similarly, we calculated the area with even more enhanced noise levels of 50% and 100% higher than the noise level in uncontaminated regions as 3% and 2%, respectively.
3.5 Sensitivity
The latitude of LOFAR is 52∘5432, putting the HETDEX Spring Field region, which has a declination ranging from 47∘ to 55∘, close to the optimal location where the projected area of the HBA dipoles and hence the sensitivity of the array is at its highest. The entire LoTSS-DR1 6 resolution mosaic of the HETDEX Spring field region covers an area of 424 square degrees and the median noise level across the mosaic is 71 Jy beam-1 ; 65%, 90%, and 95% of the area has noise levels below 78 Jy beam-1, 115 Jy beam-1, and 147 Jy beam-1, respectively (see Fig. 12). These variations are due to varying observing conditions, telescope performance (e.g. missing stations or a higher level of interference), pointing strategy, and imperfections in the calibration and imaging procedure. The impact of the calibration and imaging procedure is particularly evident around bright sources in which the noise is limited by the dynamic range, as discussed in Sec. 3.4. The variations due to the observing conditions are also significant and the noise level on images of the individual pointings varies from 60 Jy beam-1 to 160 Jy beam-1. The sensitivity variations due to the mosaicing strategy in this region are much smaller. We find that the average mosaic noise as a function of distance from the closest pointing centre (just including regions covered by more than one pointing) only varies from 72Jy beam-1 to 78Jy beam-1 with a minimum at 1∘ from a pointing centre and a maximum at 1.6∘ from the nearest pointing centre. By comparison, the LoTSS-DR1 20 resolution mosaic has higher noise levels due to the -cut applied in the imaging step. In this case the median noise level is 132 Jy beam-1 , and 65%, 90%, and 95% of the area has noise levels below 147 Jy beam-1, 223 Jy beam-1, and 302 Jy beam-1, respectively.
The contribution of confusion noise to the total noise level that is measured on our 6 resolution images is also small. To quantify this we followed the approach of Franzen et al. (2016) and injected a broken power-law distribution of point sources convolved with a 6 Gaussian into a blank image. As in Franzen et al. (2016) the power law used for sources with an integrated flux density in excess of 6 mJy was Jy-1sr-1 in agreement with Euclidean normalised differential counts at 154 MHz derived by Intema et al. (2011), Ghosh et al. (2012), and Williams, Intema, & Röttgering (2013). For fainter sources we fitted a power law of Jy-1sr-1 to the deep 150 MHz counts presented in Williams et al. (2016) and, whilst these counts reach a depth of 700Jy, for simplicity we assumed they hold to an integrated flux density limit of 10Jy. Given that the counts are thought to decrease towards such low flux densities (e.g. Wilman et al. 2008) this should result in a conservative estimate for the confusion noise. From the pixel values in the simulated image we derived the probability of deflection [P(D)], which is highly skewed with an interquartile range of 18Jy/beam. Whilst this distribution is not Gaussian, to approximate the confusion noise this can be converted to a crude estimate of the sigma by dividing the interquartile range by a factor of 1.349, which gives a confusion noise estimate at 6 of 14Jy/beam, which is significantly lower than the rms levels obtained. Our lower resolution images, however, are much more severely impacted by confusion noise and when repeating the analysis at 20 our confusion noise estimate is 85Jy/beam. We note that the very faint sources do not have a large impact on the sigma for the P(D) distributions; for example assuming the counts instead extend to 1Jy assumes 5.1 million sources rather than 200,000 sources per square degree but increases the 20 resolution confusion noise estimate by only 5% to 89Jy/beam. The power-law indices assumed in the calculations, however, play a more significant role; for example, again following Franzen et al. (2016), if for the sources between 10Jy and 6 mJy we assume , , or Jy-1sr-1 we estimate 20 resolution P(D) sigma values of 1Jy/beam, 10Jy/beam, 24Jy/beam, and 47Jy/beam.
Several of the early LoTSS observations were conducted in a manner in which two neighbouring pointings were observed simultaneously, including 10 observations (thus 20 pointings) in this data release. In these circumstances a minor impact on the sensitivity in the overlapping regions of the simultaneously observed pointings is correlated noise. In an attempt to quantify the impact we examined pixel values in the overlapping regions of pointings by reprojecting the images to a common frame and ignoring regions containing sources (defined as those with values more than 1). The Pearson correlation coefficient calculated from these noise pixels was generally found to be 0.03-0.13 for pointings observed simultaneously but typically less than 0.03 for pointings observed at separate times. We also compared noise levels in mosaiced regions that contained data from two simultaneously observed pointings with regions where all contributing pointings were observed at different times. We found that regions where simultaneously observed pointings contribute to the mosaics have a median noise level that is 2% higher than other regions. The LoTSS observations of neighbouring pointings have not been conducted simultaneously since these very early observations.
3.6 Completeness
To thoroughly estimate the completeness of the survey, sources of varying flux densities and positions should be injected into simulated data sets that include realistic DDEs. However, in the absence of such simulations, we instead inject sources into the direction-independent calibrated data sets taking into account the direction-dependent corrections that are applied in that specific direction to correct for the ionospheric and beam errors. After these data sets are processed with the pipeline and the injected sources are catalogued and their properties are compared to the parameters of the sources that were injected. We note that this procedure assumes that the direction-dependent corrections, with which the fake sourcs are injected, accurately describe the real DDEs. Given the computational cost of our calibration and imaging and that our pipelines will be improved for future data releases, we only performed this analysis for 10 SBs of data from one pointing following the procedure outlined below:
-
Step.1
Obtain the final direction dependent calibration solutions from a 240 SB run of the LoTSS-DR1 pipeline
-
Step.2
Create a simulated image of 300 delta functions drawn from a power-law distribution () and use ddfacet to predict the visibilites for this model, corrupted by the same direction dependent distortions and add these to real direction independent calibrated data in the 10-SB data set
-
Step.3
Execute the LoTSS-DR1 pipeline on the 10-SB simulated data set
For comparison, following the approach described in Heald et al. (2015), we also estimated the completeness by injecting 300 point-like sources with integrated flux densities drawn from a power-law distribution () into the final restored image of 1 of the 10 SB runs produced in Step.3. To improve the statistics the realistic simulations were repeated 8 times giving a total of 2400 simulated point sources and the injection of sources into the final image was repeated 50 times giving a total of 15,000 sources. For both simulation types we ran PyBDSF on the simulated images and classifed the injected sources as detected if they are recovered within 7.5 of the injected location and with a measured integrated flux density within 10 times the error on the integrated flux density uncertainty. The fraction of the simulated sources that were detected as a function of integrated flux density, and the derived completeness, for both methods are shown in Fig. 13.
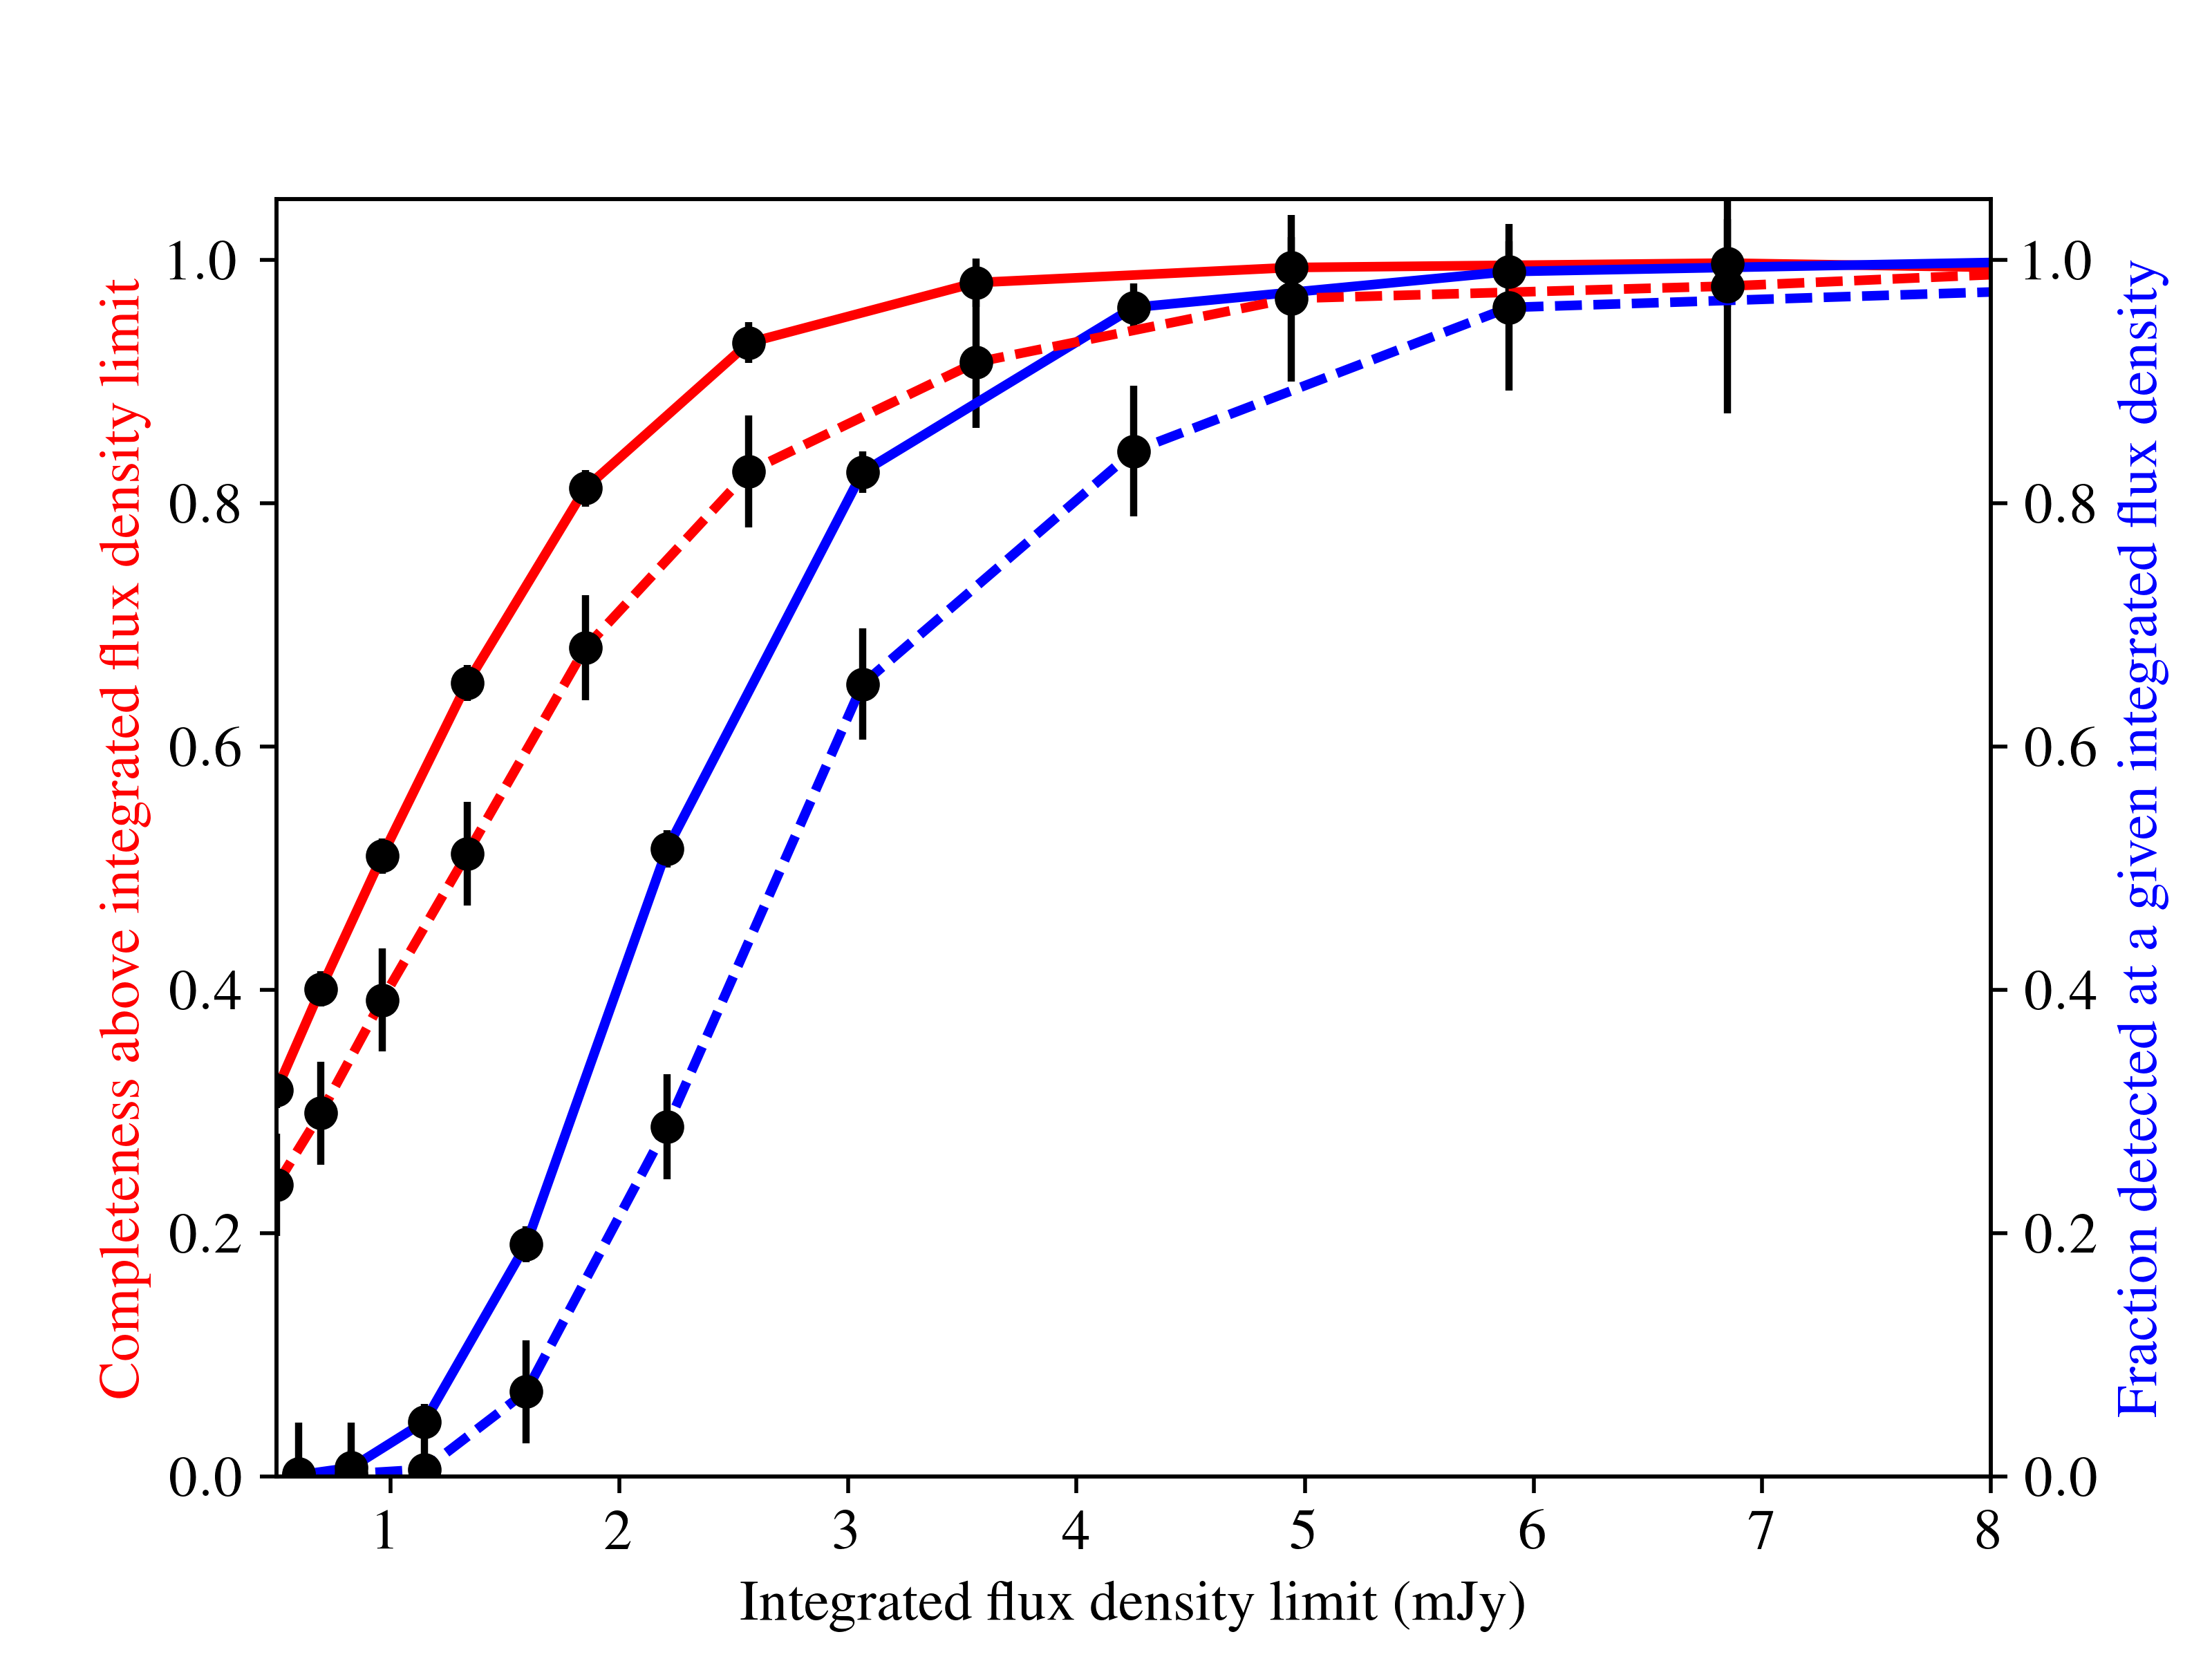
Whilst the injection of distorted point-like sources into the -data gives a much accurate understanding of the true completeness that we obtain from LoTSS-DR1 it is computationally expensive to perform such simulations for the full bandwidth of each of the data sets in the survey with the full bandwidth of data. However, performing such simulations with 10 SBs of data from a single pointing suggests that the shape of completeness curves derived from realistic simulations is similar to that obtained from injecting sources into calibrated images (Fig. 13). Therefore, to approximate the completeness of the entire LoTSS-DR1 we only used the less computationally expensive approach of injecting point sources into residual images.
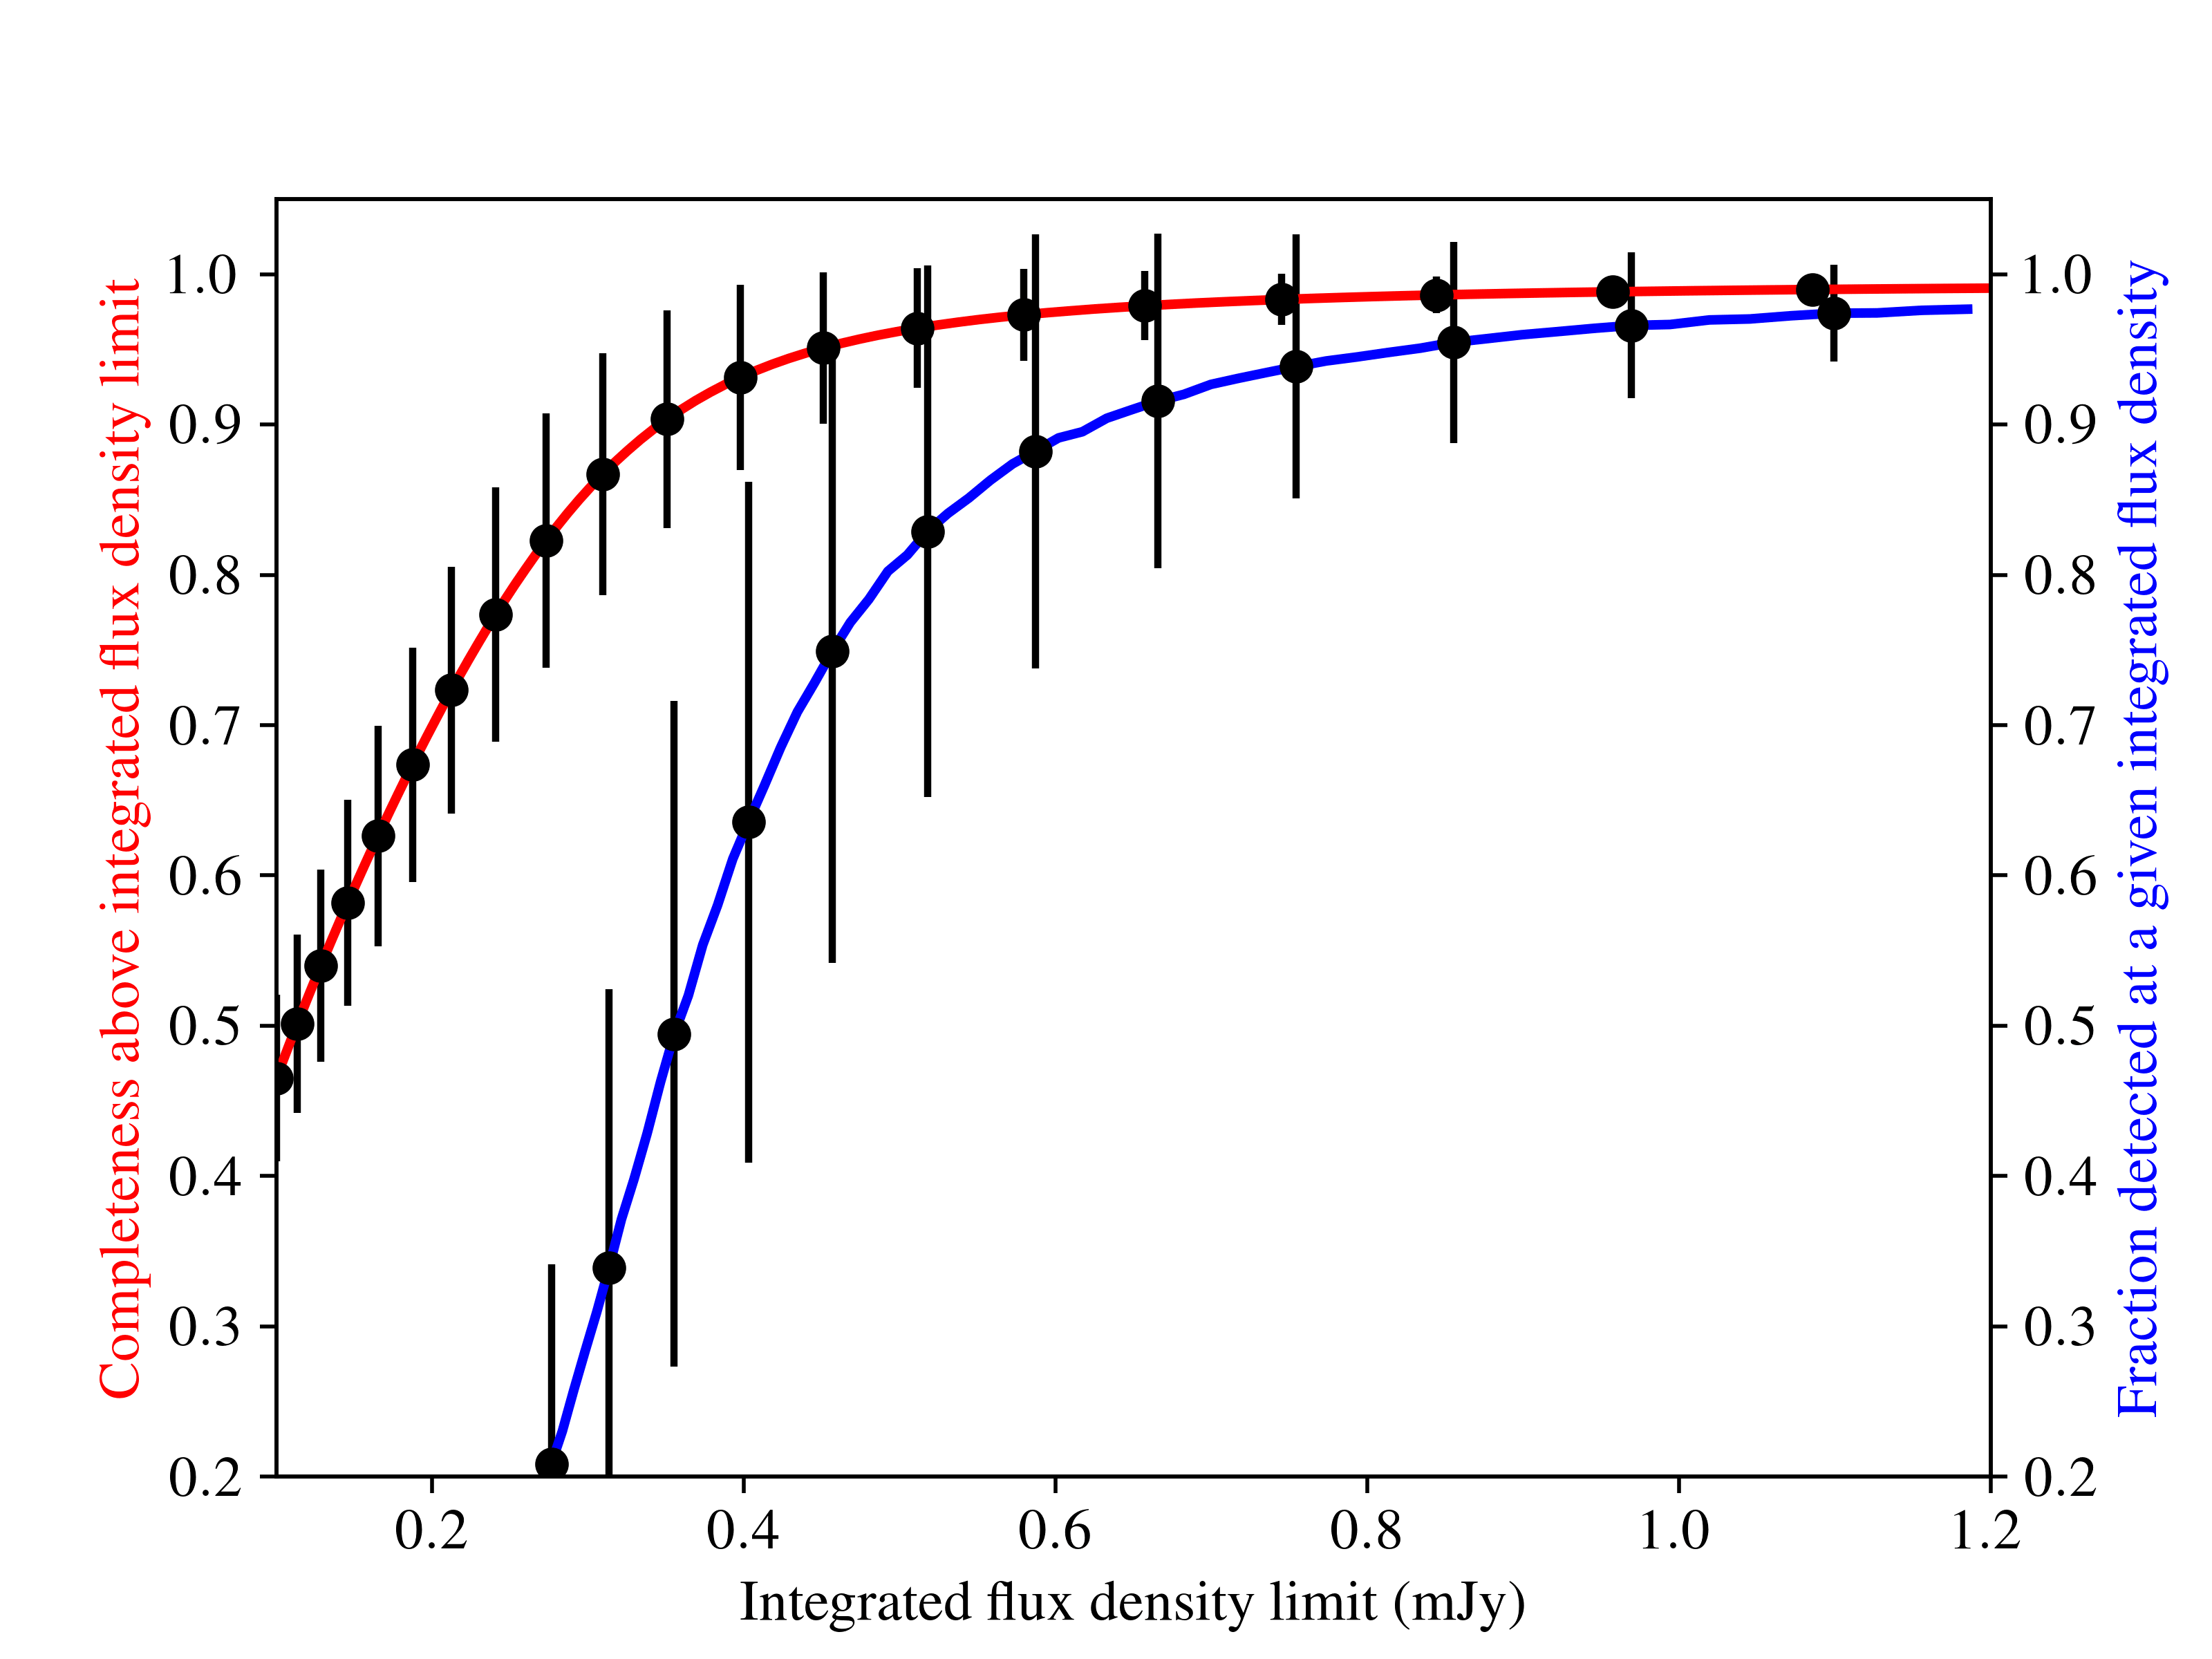
From each of the 58 mosaic images a residual image is generated using PyBDSF as a byproduct of the LoTSS-DR1 catalogue creation. Into each of these residual maps we inject 6,000 sources with integrated flux densities drawn from a power-law distribution () and ranging from 0.1 mJy to 10 Jy. This procedure is repeated 50 times for each of the mosaiced images to ensure a statistically robust measurement. The fraction of sources recovered above an integrated flux density limit, or the point-source completeness, varies with integrated flux density as shown in Fig. 14 and is 65% at 0.18 mJy, 90% at 0.35 mJy, and 95% complete at 0.45 mJy. However, we emphasise that, as shown in Fig. 13, the real integrated flux density level for the completeness levels is likely a factor of 1.3 higher (thus 90% at 0.45 mJy).
3.7 Image artefacts
In the LoTSS-DR1 mosaics there are several different types of artefacts. The low-level positive and negative haloes are particularly prominent around some sources; these haloes can be difficult to distinguish from real emission and make it challenging to precisely characterise faint diffuse emission. These artificial haloes are believed to be a product of having a minimum -distance on the baselines used in the calibration; we suspect this expedient, implemented to avoid modelling out extended emission, can cause the amplitude solutions of the antennas with more short baselines to become slightly discrepant from the more remote antennas. For comparison with our images, we note that several diffuse objects within the region covered by this data release have been processed using a different direction dependent calibration algorithm (Facet Calibration; van Weeren et al. 2016a). This procedure does not use a large minimum -distance in the calibration and the images do not suffer from artificial haloes; see the maps presented in, for example Brüggen et al. (2018), Savini et al. (2018), and Wilber et al. (2018a).
In some fields there are also clear amplitude calibration artefacts that are primarily a consequence of the amplitude normalisation scheme that we used during the direction-dependent calibration. Some fields that were observed in bad conditions also have clear phase errors that are dependent on both our calibration solution interval (1min) and the size of the facets. Finally, whilst we attempted to ensure that our masks encompass extended sources, there are instances in which faint diffuse emission has still not been fully deconvolved.
As described in Sec. 5.1, in future data releases we plan on improving upon each of these issues. However, for this data release, to aid with the identification of artefacts, we provided mosaics of the final residual maps to accompany our deconvolved continuum images along with the artefact flag resulting from the source (dis-)association and host galaxy identification work of the companion paper Williams et al. (2018b).
4 Public data release
In this section, we summarise the products that form the first LoTSS public data release, which are accessible on https://lofar-surveys.org. These products consist of the mosaiced images that have been described in this paper in addition to the catalogue that we derived from the direct application of PyBDSF to the mosaiced 6 resolution images. In some cases, PyBDSF does not perfectly represent the radio source population: large extended radio sources may be split across several different catalogue entries in the PyBDSF catalogue, or alternatively two closely separated but physically distinct radio sources may be merged into a single catalogue entry by PyBDSF. Therefore, to enhance the scientific value of the released LoTSS-DR1 catalogues we attempted to associate or deblend the catalogued components of radio emission into actual radio sources where necessary, and also to identify the optical counterparts of all sources. If an optical counterpart has been located we also estimated its photometric redshift. For completeness, these projects that add value to publicly released LoTSS-DR1 catalogue are briefly summarised below, but for a full description see Papers III and IV in this series (Williams et al., 2018b; Duncan et al., 2018c).
4.1 Mosaics and raw PyBDSF catalogue
We released both the 6 and 20 resolution 120-168MHz mosaiced images that were created following the direction dependent calibration procedure described in Sec. 2. These mosaics cover 424 square degrees in the region of the HETDEX Spring Field (see Fig. 5) and have the quality shown in Figs. 4 and 6 and described in detail in Sec. 3. We released 6 and 20 mosaiced residual images to help assess the reliability of the morphology of extended structures; these images show the quality of deconvolution and properties of the background noise.
The raw PyBDSF catalogue that was released was created from the 6 resolution mosaiced images; this catalogue is described in Sec. 2.4. This catalogue contains 325,694 radio sources, has a source density of 770 sources per square degree and a point-source completeness of 90% at an integrated flux density of 0.45 mJy (see Sec. 3.6). To aid the interpretation of the catalogue completeness we released the PyBDSF derived noise maps of the 6 mosaics.
4.2 Source (dis-)association and optical counterparts
For most radio sources the expected host galaxy position is well defined by the properties of the radio source and it is therefore appropriate to use a statistical method to identify the counterparts in Pan-STARRS and WISE. For this we employ a likelihood ratio method (e.g. Richter 1975, de Ruiter, Willis, & Arp 1977 and Sutherland & Saunders 1992). However, for a number of complex sources, such methods are either not possible or unreliable, so we employ a human visual classification scheme based on the Zooniverse111111www.zooniverse.org framework. Sources in the raw PyBDSF catalogue are first sorted based on their catalogued characteristics and selected either for visual (dis-)association and identification or for likelihood ratio cross-matching by means of a decision tree. The details of how these decisions are made and full details of the likelihood ratio and visual classification methods are given by Williams et al. (2018b). Using this procedure, counterparts were identified for 71% of the radio sources. These source characteristics and visual inspection procedure are also very useful in flagging probable artefacts in the PyBDSF catalogue. Again, details are given by Williams et al. (2018b), but the final column of Table 1 provides a flag highlighting the PyBDSF sources identified as probable artefacts based on that work.
4.3 Photometric redshift estimation
Knowing the redshift of a source is a fundamental requirement for extracting key physical properties from continuum radio observations, such as luminosity or physical size, and for understanding the host galaxy (e.g. its stellar mass). Although future optical spectroscopy campaigns such as WEAVE-LOFAR121212http://www.ing.iac.es/weave/weavelofar/ (Smith et al., 2016) will target more than 150 MHz-selected sources and provide high-precision spectroscopic redshifts and accurate source classifications for a large portion of the LoTSS population, existing spectroscopic redshifts, largely from SDSS, are available only for a very small subset of sources. Therefore, photometric redshifts (photo-s) are a vital method for identifying the physical properties of radio sources and we produced photo- estimates for all plausible counterparts in the combined Pan-STARRs/All-WISE catalogue that was used for host-galaxy identification in the previous section. Full details of the photo- estimation, which combines template-based and machine-learning estimates, are presented in a companion release paper (Duncan et al. 2018c).
5 Future prospects
In future data releases we will not only present maps from a significantly larger fraction of the sky, but there is also active development to improve many aspects of the LoTSS data processing; in the survey we observed almost 20% of the northern sky and in this work we only presented 10% of these data or 2% of the northern sky. For example, to tackle the large LoTSS data rates we are working with the LOFAR e-infra group to implement our direction-independent calibration pipeline on the Forschungszentrum Jülich and Poznań LTA sites. Furthermore, the observatory is beginning to utilise Dysco compression (Offringa 2016) to reduce the size of the archived data sets by a factor of approximately four. To improve the accuracy of the direction-independent calibration pipeline, amongst other things, the accuracy of the derived amplitude and clock solutions are being increased. In the direction-dependent calibration and imaging pipeline there is significant work to improve the fidelity of the images and to implement the pipeline on the SURFsara Grid. To further enhance the scientific potential of our data products there is also active work to exploit the polarisation (e.g. Van Eck et al. 2018), wide fractional bandwidth, the longest baselines provided by the international stations, and to use the data for spectral line studies (Oonk et al. 2017, Salas et al. 2018 and Emig et al. in prep) and for searches for transient sources.
Discussing all of these future prospects in detail is beyond the scope of this article; however, in the following subsections we provide some details on several prospects, namely improving the direction-dependent calibration and exploiting the fractional bandwidth of LoTSS.
5.1 Reducing image artefacts
The LoTSS-DR1 processing strategy has produced sensitive and good quality LOFAR images, however it failed for 8% of the fields and, as described in Sec. 3.7, the final mosaics contain several different types of artefacts. Therefore, in an attempt to improve the images the development of the pipeline has been ongoing. The latest tests that use a refined recipe that still makes use of kms and ddfacet for calibration and imaging, respectively, have shown that by removing the minimum -distance in the calibration and instead smoothing the amplitude solutions with a low-order polynomial function and fitting the phase solutions with a function proportional to (which is, to first order, the phase behaviour introduced by free electrons in the ionosphere) the artificial haloes and holes can be effectively removed. Furthermore, these changes, together with other enhancements such as turning off the amplitude normalisation, improving the sky models used for calibration by increasing the depth of the deconvolution, and refining the direction-independent calibration by making use of accurate models derived from the direction-dependent imaging, have allowed us to decrease the failure rate of the pipeline, improve the dynamic range, and increase the number of sources detected. A demonstration of the improvements that are a result of these recent developments is shown in Fig. 15 and a refined version of the LoTSS processing pipeline will be fully described in a future publication.
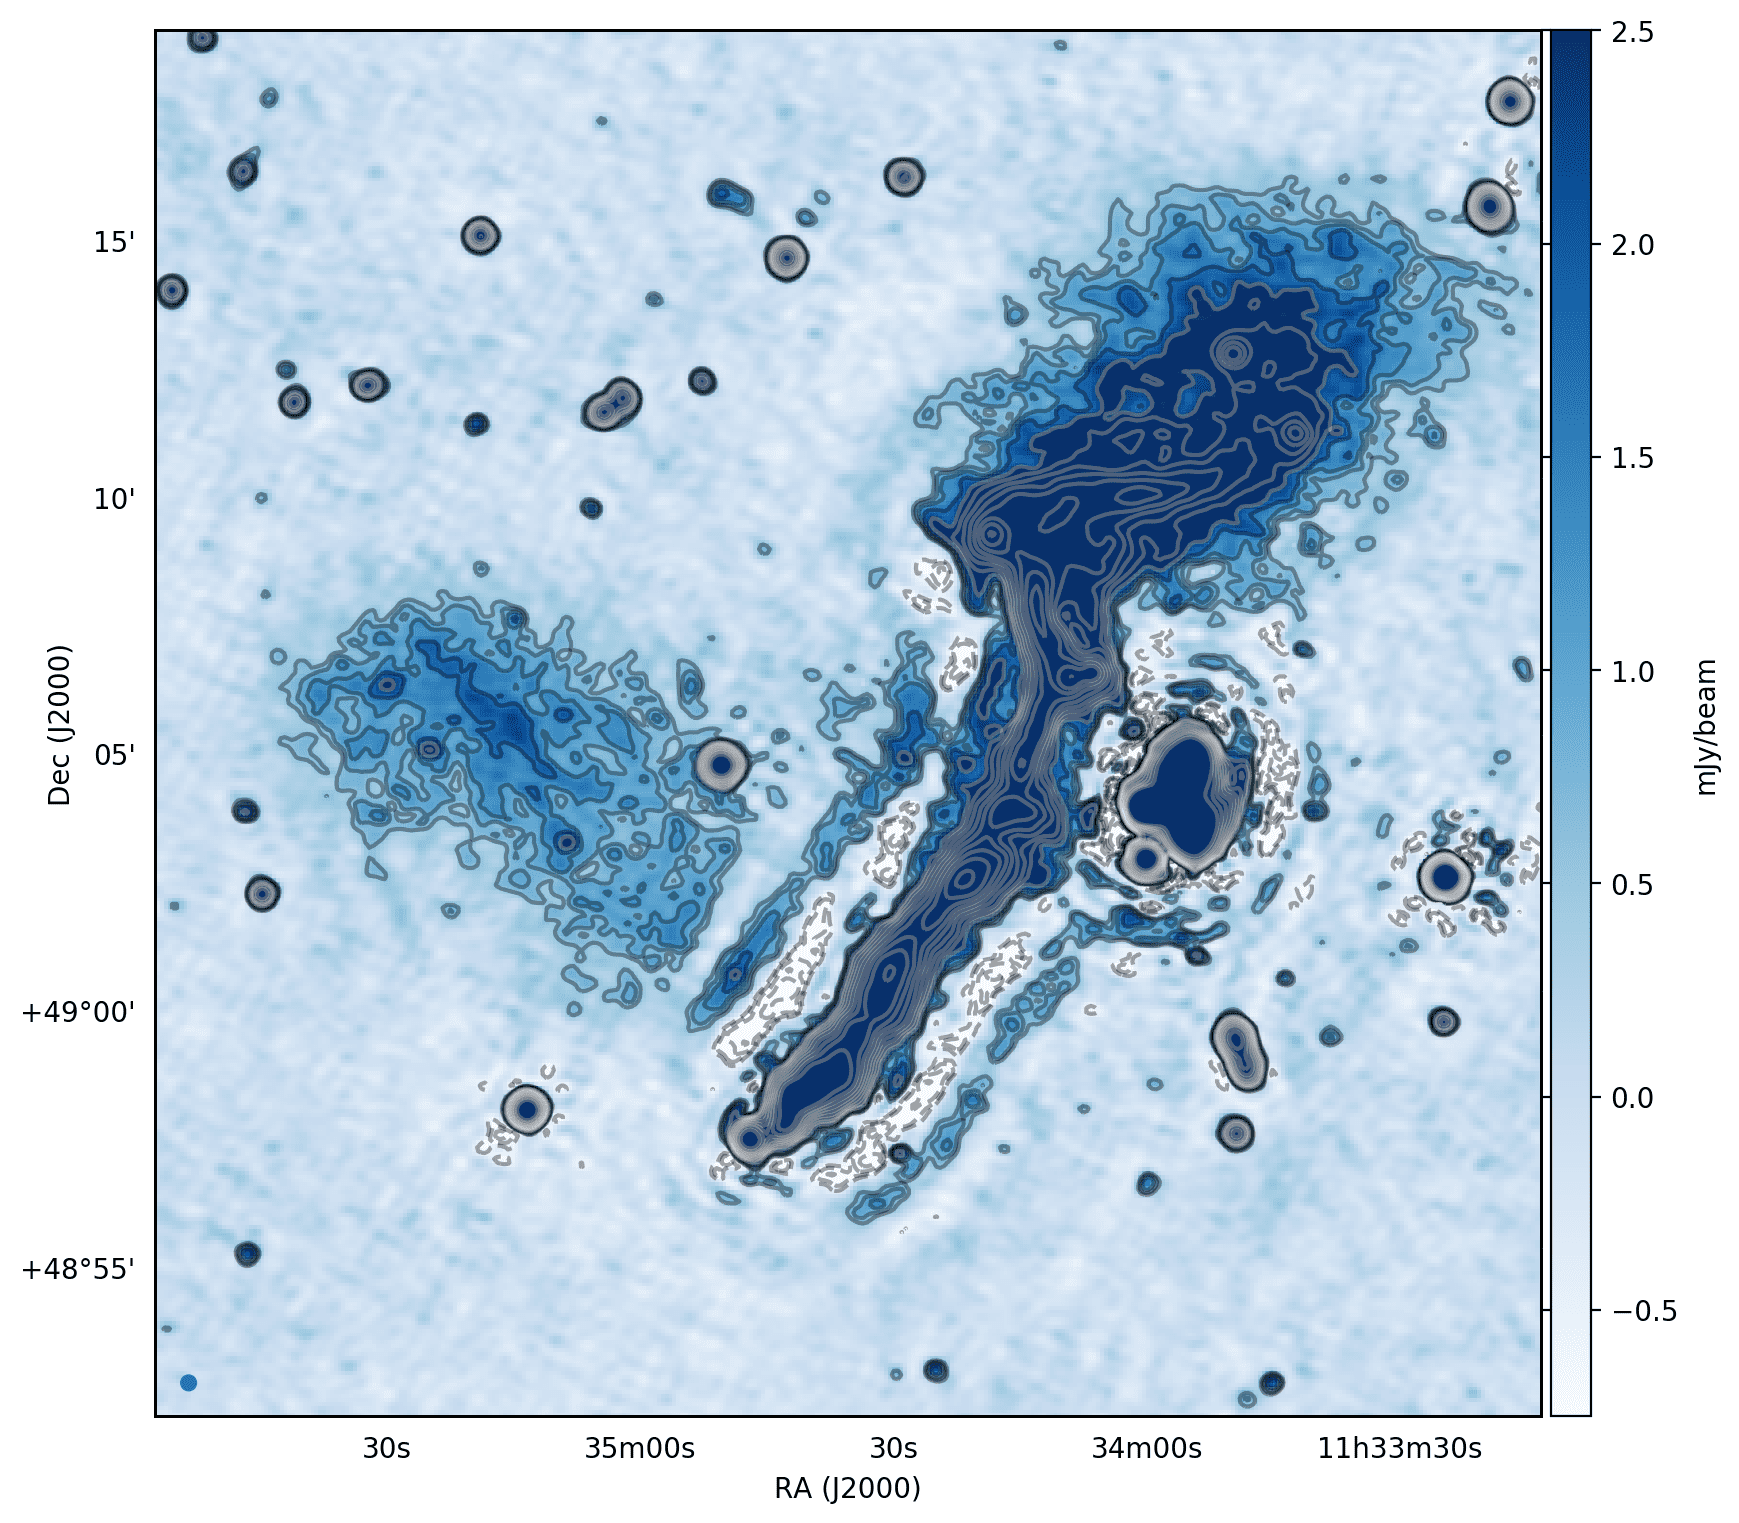
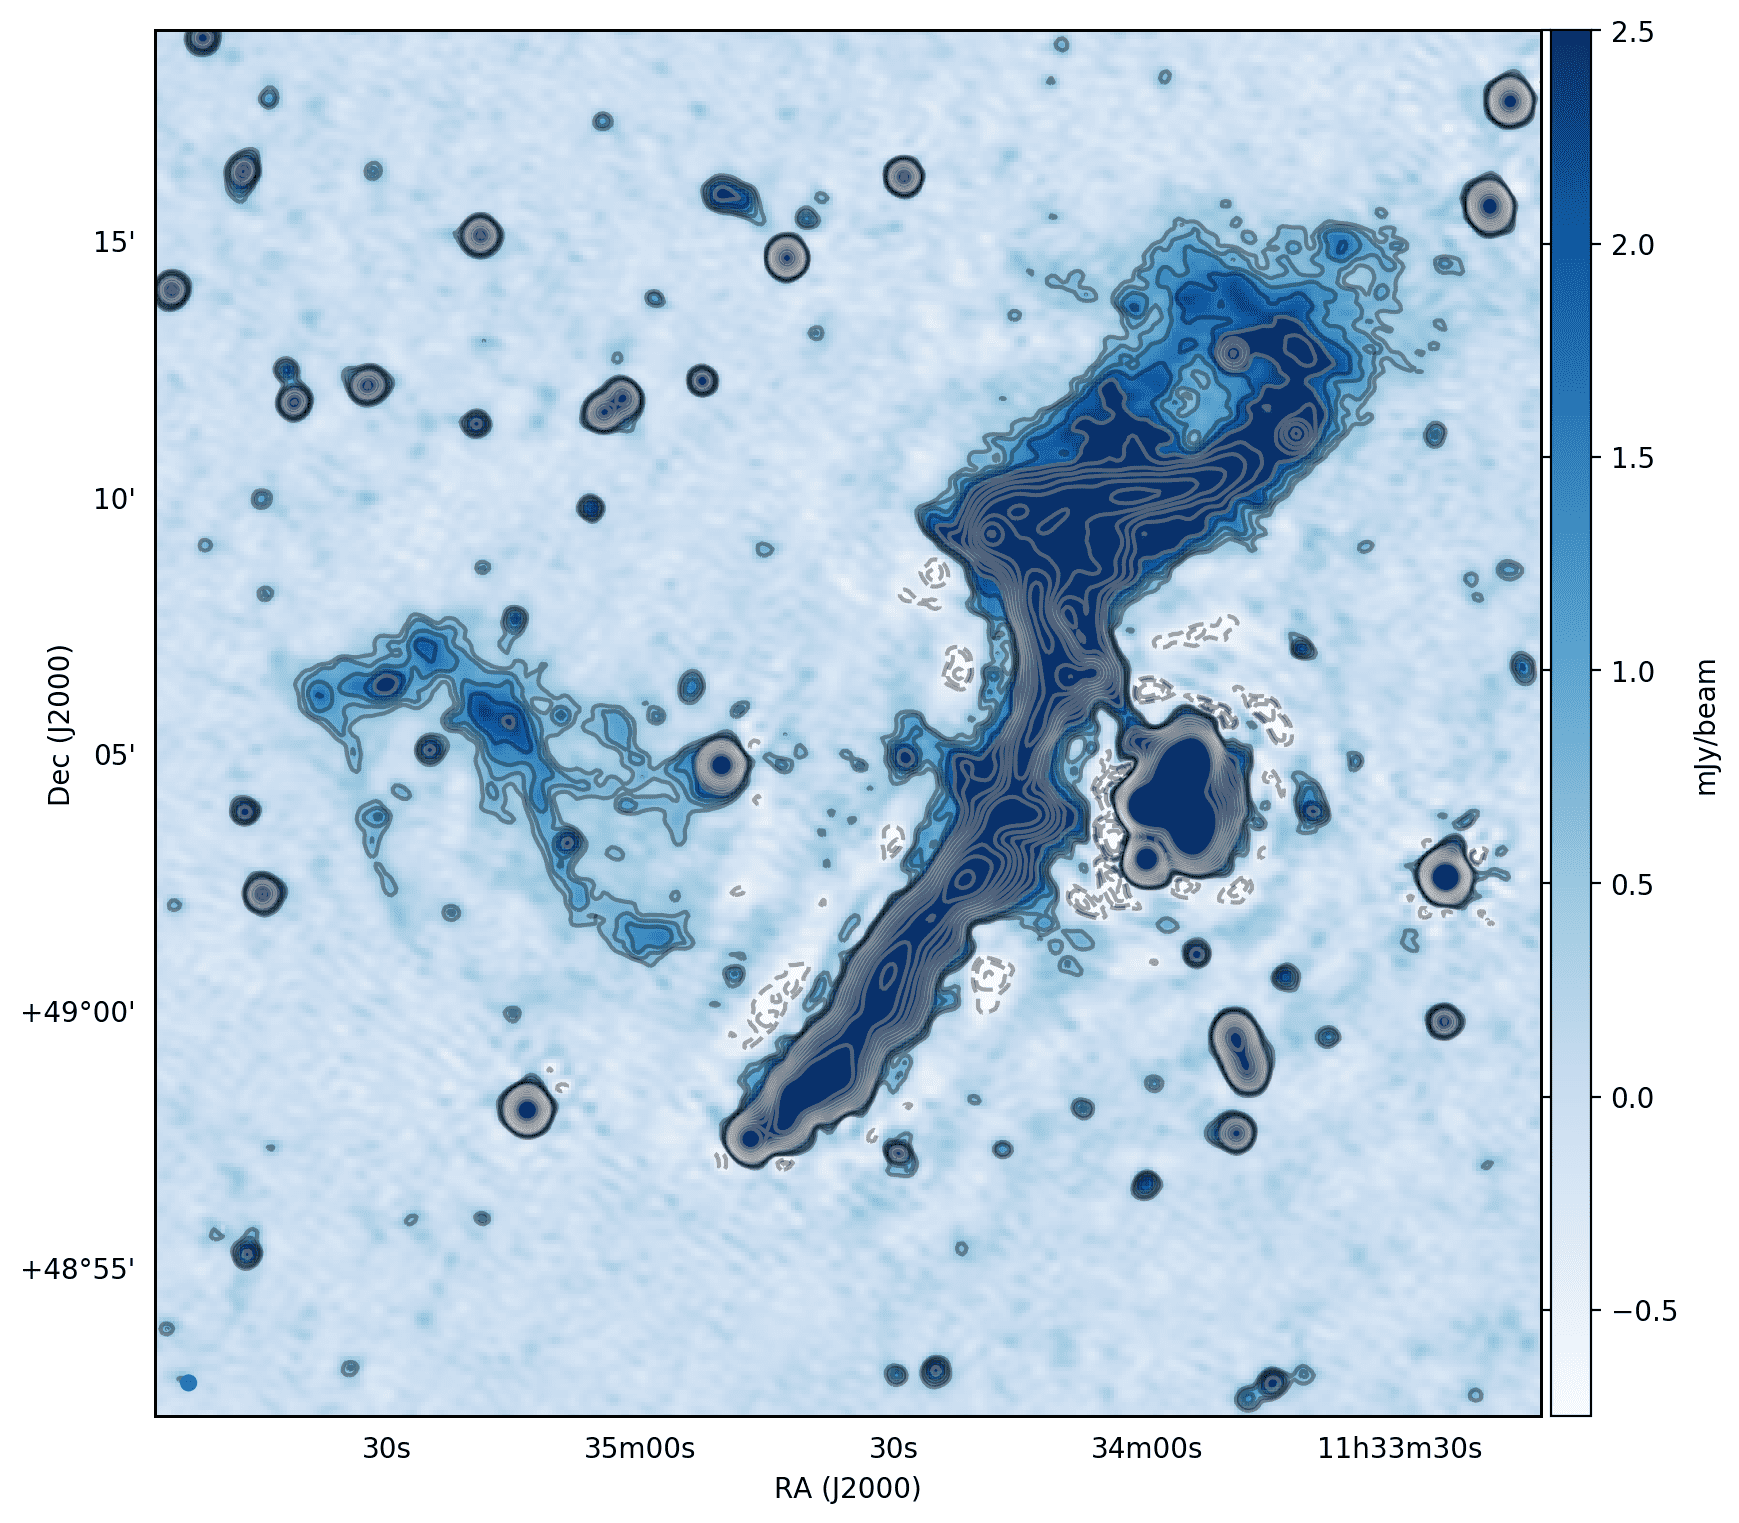
5.2 Exploiting the large fractional bandwidth of LoTSS
With a fractional bandwidth of approximately 33%, LoTSS has the third largest fractional bandwidth of any very wide area radio continuum survey produced to date. Only MSSS (Heald et al. 2015) and the GLEAM (Wayth et al. 2015 and Hurley-Walker et al. 2017) survey have observed the sky with larger fractional bandwidths, but both have significantly poorer angular resolutions and sensitivities (see Fig. 1). To demonstrate the scientific potential of the spectral information that can be derived from LoTSS, for a test field we divided a direction-dependent calibrated LoTSS data set into three parts, each with a width of 16 MHz, and generated a three-channel image with ddfacet. The integrated flux density measurements in each part of the bandwidth and the source association between the three images was done using PyBDSF. An example of some observed spectra, with comparison to other surveys, is shown in Fig. 16. In this demonstration field we were able to accurately derive (with 10% uncertainty or less) in-band spectra for compact, isolated (no other source within 100 of the LoTSS position) sources with integrated flux densities 10 mJy, where the uncertainty estimate of the derived spectral indexes was obtained by comparing with spectral indexes measured from fitting to VLSSr and NVSS ( 50 mJy) or to TGSS-ADR1 and NVSS for the fainter sources ( 10 mJy).
Low-frequency spectral information is valuable for many science cases, such as for identifying low-luminosity peaked-spectrum sources (Callingham et al. 2017) and investigating the energy distribution of electrons in the emitting region of radio sources (e.g. Bonavera et al. 2011). For example, the source shown in the left panel of Fig. 16 is a peaked-spectrum source with a radio luminosity W Hz-1, which is two orders of magnitude fainter than the median radio luminosity of previous peaked-spectrum samples (e.g. O’Dea 1998). Probing this population of low-luminosity peaked-spectrum sources could potentially identify sources powered by a short-lived outburst of the central activity that might not able to escape from the host galaxy (Czerny et al. 2009). Such sources could be the short-lived precursors needed to account for the overabundance of peaked-spectrum sources relative to the large-scale radio galaxies (Kunert-Bajraszewska & Labiano 2010).
The right panel of Fig. 16 is the spectrum of a source that shows a significant deviation from a standard power law. If such a deviation is not taken into account, it leads to orders of magnitude uncertainty in the estimate of the energy stored by the lobes of the radio galaxy (Duffy & Blundell 2012; Harwood et al. 2017).
Therefore, the spectral information that can be supplied by LoTSS will have diverse scientific impact, providing internal spectral index information to flux densities below the levels possible by cross-comparison with existing sky survey data. As a consequence of processing constraints this spectral information is not included with this current release, but we plan to include it in future releases.


6 Summary
In this publication we have described the first full quality LoTSS data release, which is available on-line https://lofar-surveys.org. We outlined how we managed the large LoTSS data rate and we introduced the completely automated direction-dependent calibration and imaging pipeline that we used to produce 120-168 MHz continuum images. The high-resolution (6) images we present cover 424 square degrees in the region of the HETDEX Spring Field and contain 325,694 sources that are detected with a significance in excess of five times the noise. This source density is a factor of at least ten higher than any existing very wide area radio continuum survey. As described in companion papers (Williams et al. 2018b and Duncan et al. 2018c) the LoTSS-DR1 catalogue has been enhanced by identifying the optical counterparts of radio sources and estimating their photometric redshifts. Finally, this data release is published together with 20 articles to highlight the scientific potential of LoTSS.
The LoTSS-DR1 images have a median sensitivity of 71Jy beam-1 with approximately 10% of the mapped area being dynamic-range limited. For point sources, the survey is 90% complete at a peak brightness of 0.45 mJy beam-1. We examined the fidelity of our images and found that the astrometric accuracy is approximately 0.2 in both RA and Dec. The flux density scale is in overall agreement with other radio surveys and the uncertainty on the integrated flux density measurements is 20%.
There are many opportunities to enrich the LoTSS data products through, for example polarimetric measurements or full exploitation of the longest baselines in the international LOFAR array. We briefly demonstrated a few such possibilities including improvements to the calibration and imaging and the measurement of the in-band spectral index.
7 Acknowledgements
We thank the anonymous referee for his/her comments. This paper is based on data obtained with the International LOFAR Telescope (ILT) under project codes LC2_038 and LC3_008. LOFAR (van Haarlem et al. 2013) is the LOw Frequency ARray designed and constructed by ASTRON. It has observing, data processing, and data storage facilities in several countries, which are owned by various parties (each with their own funding sources) and are collectively operated by the ILT foundation under a joint scientific policy. The ILT resources have benefited from the following recent major funding sources: CNRS-INSU, Observatoire de Paris and Université d’Orléans, France; BMBF, MIWF-NRW, MPG, Germany; Department of Business, Enterprise and Innovation (DBEI), Ireland; NWO, The Netherlands; The Science and Technology Facilities Council (STFC), UK.
Part of this work was carried out on the Dutch national e-infrastructure with the support of the SURF Cooperative through grant e-infra 160022 & 160152. The LOFAR software and dedicated reduction packages on https://github.com/apmechev/GRID_LRT were deployed on the e-infrastructure by the LOFAR e-infragroup, consisting of J. B. R. Oonk (ASTRON & Leiden Observatory), A. P. Mechev (Leiden Observatory) and T. Shimwell (ASTRON) with support from N. Danezi (SURFsara) and C. Schrijvers (SURFsara).
This work made use of the University of Hertfordshire high-performance computing facility (http://uhhpc.herts.ac.uk) and the LOFAR-UK computing facility located at the University of Hertfordshire and supported by STFC [ST/P000096/1]. The Data Center of the Nançay Radioastronomy Station acknowledges the support of the Conseil Régional of the Région Centre Val de Loire in France. We thank Forschungszentrum Jülich for storage and computing.
This research made use of Astropy, a community-developed core Python package for astronomy (Astropy Collaboration et al., 2013) hosted at http://www.astropy.org/, and of the astropy-based reproject package (http://reproject.readthedocs.io/en/stable/). We are grateful to Thomas Robitaille for support in adapting the reproject package to support the very large images used in this paper.
HR, DNH, KJD, and RJvW acknowledge support from the ERC Advanced Investigator programme NewClusters 321271. AB acknowledges support from the ERC-Stg DRANOEL, no 714245. AOC gratefully acknowledges support from the European Research Council under grant ERC-2012-StG-307215 LODESTONE. RM and MB gratefully acknowledge support from the European Research Council under the European Union’s Seventh Framework Programme (FP/2007-2013) /ERC Advanced Grant RADIOLIFE-320745. RJvW acknowledges support from the ERC VIDI research programme with project number 639.042.729, which is financed by the Netherlands Organisation for Scientific Research (NWO). KLE acknowledges financial support from the Dutch Science Organization (NWO) through TOP grant 614.001.351. MJH and WLW acknowledge support from the STFC ST/M001008/1. PNB and JS acknowledge support from the STFC ST/M001229/1. JHC and BM acknowledge support from the STFC ST/M001326/1 and ST/R00109X/1. CL, RK, RKC, and BW acknowledge support from STFC studentships. LA acknowledges support from the STFC through a ScotDIST Intensive Data Science Scholarship. LKM acknowledges the support of the Oxford Hinzte Centre for Astrophysical Surveys, which is funded through generous support from the Hintze Family Charitable Foundation. LKM is also partly funded by the John Fell Oxford University Press (OUP) Research Fund. GJW gratefully acknowledges support from the Leverhulme Trust. VHM thanks the University of Hertfordshire for a research studentship ST/N504105/1. AD acknowledges financial support from German Federal Ministry for Education and Research (BMBF, Verbundforschung, projects D-LOFAR III and IV, grants 05A15STA and 05A17STA). S.P.O acknowledges financial support from the Deutsche Forschungsgemeinschaft (DFG) under grant BR2026/23. AG acknowledges full support from the Polish National Science Centre (NCN) through the grant 2012/04/A/ST9/00083. MJ acknowledges support from the Polish National Science Centre under grant no. 2013/09/B/ST9/00599. Grudziacka 5, 87-100 Toruń, Poland. MKB acknowledges support from the Polish National Science Centre under grant no. 2017/26/E/ST9/00216. IP acknowledges support from the INAF SKA/CTA PRIN project ”FORECaST”. EB, MA, and OS are supported by the South African Research Chairs Initiative of the Department of Science and Technology and National Research Foundation. GGU acknowledges OCE Postocdoral fellowship from CSIRO. SM acknowledges funding through the Irish Research Council New Foundations scheme and the Irish Research Council Postgraduate Scholarship scheme. This publication has emanated from research supported in part by a research grant from Science Foundation Ireland (SFI) under the Grant Number 15/RI/3204.
References
- Astropy Collaboration et al. (2013) Astropy Collaboration et al., 2013, A&A, 558, A33
- Atemkeng et al. (2016) Atemkeng M. T., Smirnov O. M., Tasse C., Foster G., Jonas J., 2016, MNRAS, 462, 2542
- Baars et al. (1977) Baars J. W. M., Genzel R., Pauliny-Toth I. I. K., Witzel A., 1977, A&A, 61, 99
- Becker, White, & Helfand (1995) Becker R. H., White R. L., Helfand D. J., 1995, ApJ, 450, 559
- Bennett (1962) Bennett A. S., 1962, MmRAS, 68, 163
- Best et al. (2003) Best P. N., Arts J. N., Röttgering H. J. A., Rengelink R., Brookes M. H., Wall J., 2003, MNRAS, 346, 627
- Best (2004) Best P. N., 2004, MNRAS, 351, 70
- Best et al. (2014) Best P. N., Ker L. M., Simpson C., Rigby E. E., Sabater J., 2014, MNRAS, 445, 955
- Bock et al. (1999) Bock, D. C.-J., Large, M. I., & Sadler, E. M. 1999, AJ, 117, 1578
- Bonavera et al. (2011) Bonavera L., Massardi M., Bonaldi A., González-Nuevo J., de Zotti G., Ekers R. D., 2011, MNRAS, 416, 559
- Bonnassieux et al. (2017) Bonnassieux E., Tasse C., Smirnov O., Zarka P., 2017, arXiv, arXiv:1711.00421
- Botteon et al. (2018) Botteon A., et al., 2018, MNRAS,
- Bridle & Schwab (1989) Bridle A. H., Schwab F. R., 1989, ASPC, 6, 247
- Brienza et al. (2017) Brienza M., et al., 2017, A&A, 606, A98
- Brüggen et al. (2018) Brüggen M., et al., 2018, MNRAS,
- Brunetti & Jones (2014) Brunetti G., Jones T. W., 2014, IJMPD, 23, 1430007
- Callingham et al. (2015) Callingham J. R., et al., 2015, ApJ, 809, 168
- Callingham et al. (2017) Callingham J. R., et al., 2017, ApJ, 836, 174
- Calistro Rivera et al. (2017) Calistro Rivera G., et al., 2017, MNRAS, 469, 3468
- Cassano et al. (2010) Cassano R., Brunetti G., Röttgering H. J. A., Brüggen M., 2010, A&A, 509, A68
- Chambers (2016) Chambers K. C., 2016, arXiv:1612.05560
- Ciliegi et al. (2003) Ciliegi P., Zamorani G., Hasinger G., Lehmann I., Szokoly G., Wilson G., 2003, A&A, 398, 901
- Condon et al. (1998) Condon J. J., Cotton W. D., Greisen E. W., Yin Q. F., Perley R. A., Taylor G. B., Broderick J. J., 1998, AJ, 115, 1693
- Condon (1997) Condon J. J., 1997, PASP, 109, 166
- Condon et al. (2012) Condon J. J., et al., 2012, ApJ, 758, 23
- Cotton et al. (2004) Cotton W. D., Condon J. J., Perley R. A., Kassim N., Lazio J., Cohen A., Lane W., Erickson W. C., 2004, SPIE, 5489, 180
- Cutri et al. (2012) Cutri R. M., et al., 2012, Explanatory Supplement to the WISE All-Sky Data Release Products. Technical Report.
- Cutri & et al. (2013) Cutri R. M., et al., 2013, yCat, 2328,
- Czerny et al. (2009) Czerny, B., Siemiginowska, A., Janiuk, A., Nikiel-Wroczyński, B., & Stawarz, Ł. 2009, ApJ, 698, 840
- de Gasperin et al. (2017) de Gasperin F., et al., 2017, arXiv, arXiv:1710.06796
- de Gasperin et al. (in prep) de Gasperin F., et al., in prep
- de Ruiter, Willis, & Arp (1977) de Ruiter H. R., Willis A. G., Arp H. C., 1977, A&AS, 28, 211
- Dalton et al. (2012) Dalton G. et al., 2012, SPIE, 8446, 0
- Dalton et al. (2014) Dalton G. et al., 2014, SPIE, 9147, 0
- Dewdney et al. (2009) Dewdney P. E., Hall P. J., Schilizzi R. T., Lazio T. J. L. W., 2009, IEEEP, 97, 1482
- Duffy & Blundell (2012) Duffy, P., & Blundell, K. M. 2012, MNRAS, 421, 108
- Duncan et al. (2018a) Duncan K. J., et al., 2018, MNRAS, 473, 265
- Duncan et al. (2018b) Duncan K. J., Jarvis M. J., Brown M. J. I., Rottgering H. J. A., 2017, arXiv, 1712.04476
- Duncan et al. (2018c) Duncan K., et al., LOFAR SI
- Emig et al. (in prep) Emig K., et al., in prep LOFAR SI
- Flewelling et al. (2016) Flewelling H. A., et al., 2016, arXiv, arXiv:1612.05243
- Fleuren et al. (2012) Fleuren S., et al., 2012, MNRAS, 423, 2407
- Foreman-Mackey et al. (2013) Foreman-Mackey D., Hogg D. W., Lang D., Goodman J., 2013, PASP, 125, 306
- Franzen et al. (2016) Franzen T. M. O., et al., 2016, MNRAS, 459, 3314
- Ghosh et al. (2012) Ghosh A., Prasad J., Bharadwaj S., Ali S. S., Chengalur J. N., 2012, MNRAS, 426, 3295
- Hardcastle et al. (2016) Hardcastle M. J., et al., 2016, MNRAS, 462, 1910
- Harwood et al. (2017) Harwood J. J., et al., 2017, MNRAS, 469, 639
- Hamaker, Bregman, & Sault (1996) Hamaker J. P., Bregman J. D., Sault R. J., 1996, A&AS, 117, 137
- Hamaker (2000) Hamaker J. P., 2000, A&AS, 143, 515
- Harwood et al. (2017) Harwood, J. J., Hardcastle, M. J., Morganti, R., et al. 2017, MNRAS, 469, 639
- Heald et al. (2015) Heald G. H., et al., 2015, A&A, 582, A123
- Hill & Lilly (1991) Hill G. J., Lilly S. J., 1991, ApJ, 367, 1
- Hill et al. (2008) Hill G. J., et al., 2008, ASPC, 399, 115
- Hoang et al. (2017) Hoang D. N., et al., 2017, MNRAS, 471, 1107
- Hurley-Walker et al. (2017) Hurley-Walker, N., Callingham, J. R., Hancock, P. J., et al. 2017, MNRAS, 464, 1146
- Intema et al. (2011) Intema H. T., van Weeren R. J., Röttgering H. J. A., Lal D. V., 2011, A&A, 535, A38
- Intema et al. (2009) Intema H. T., van der Tol S., Cotton W. D., Cohen A. S., van Bemmel I. M., Röttgering H. J. A., 2009, A&A, 501, 1185
- Intema et al. (2017) Intema H. T., Jagannathan P., Mooley K. P., Frail D. A., 2017, A&A, 598, A78
- Jackson et al. (2016) Jackson N., et al., 2016, A&A, 595, A86
- Jarrett et al. (2000) Jarrett, T. H., Chester, T., Cutri, R., et al. 2000, AJ, 119, 2498
- Kazemi et al. (2011) Kazemi S., Yatawatta S., Zaroubi S., Lampropoulos P., de Bruyn A. G., Koopmans L. V. E., Noordam J., 2011, MNRAS, 414, 1656
- Kunert-Bajraszewska & Labiano (2010) Kunert-Bajraszewska, M., & Labiano, A. 2010, MNRAS, 408, 2279
- Lane et al. (2014) Lane W. M., Cotton W. D., van Velzen S., Clarke T. E., Kassim N. E., Helmboldt J. F., Lazio T. J. W., Cohen A. S., 2014, MNRAS, 440, 327
- Mahony et al. (2016) Mahony E. K., et al., 2016, MNRAS, 463, 2997
- Mauch et al. (2003) Mauch, T., Murphy, T., Buttery, H. J., et al. 2003, MNRAS, 342, 1117
- Magnier et al. (2016) Magnier E. A., et al., 2016, arXiv, arXiv:1612.05242
- McAlpine et al. (2012) McAlpine K., Smith D. J. B., Jarvis M. J., Bonfield D. G., Fleuren S., 2012, MNRAS, 423, 132
- Mechev et al. (2017) Mechev A., Oonk J. B. R., Danezi A., Shimwell T. W., Schrijvers C., Intema H., Plaat A., Rottgering H. J. A., 2017, isgc.conf, 2
- Mohan & Rafferty (2015) Mohan N., Rafferty D., 2015, ascl.soft, ascl:1502.007
- Morabito et al. (2017) Morabito L. K., et al., 2017, MNRAS, 469, 1883
- Nisbet et al. (2018) Nisbet D. et al., MNRAS submitted
- Noordam & Smirnov (2010) Noordam J. E., Smirnov O. M., 2010, A&A, 524, A61
- Norris et al. (2011) Norris R. P., et al., 2011, PASA, 28, 215
- O’Dea (1998) O’Dea C. P., 1998, PASP, 110, 493
- Offringa, van de Gronde, & Roerdink (2012) Offringa A. R., van de Gronde J. J., Roerdink J. B. T. M., 2012, A&A, 539, A95
- Offringa (2016) Offringa A. R., 2016, A&A, 595, A99
- Oonk et al. (2017) Oonk J. B. R., van Weeren R. J., Salas P., Salgado F., Morabito L. K., Toribio M. C., Tielens A. G. G. M., Röttgering H. J. A., 2017, MNRAS, 465, 1066
- Oonk et al. (in prep) Oonk J. B. R., et al., 2017, in prep.
- Pandey et al. (2009) Pandey V. N., van Zwieten J. E., de Bruyn A. G., Nijboer R., 2009, ASPC, 407, 384
- Perley & Butler (2017) Perley R. A., Butler B. J., 2017, ApJS, 230, 7
- Prestage & Peacock (1988) Prestage R. M., Peacock J. A., 1988, MNRAS, 230, 131
- Raccanelli et al. (2012) Raccanelli A., et al., 2012, MNRAS, 424, 801
- Rengelink et al. (1997) Rengelink R. B., Tang Y., de Bruyn A. G., Miley G. K., Bremer M. N., Roettgering H. J. A., Bremer M. A. R., 1997, A&AS, 124, 259
- Richter (1975) Richter G. A., 1975, AN, 296, 65
- Röttgering et al. (2011) Röttgering H., et al., 2011, JApA, 32, 557
- Saff & Kuijlaars (1997) Saff E. B. & and Kuijlaars A.B.J., 1997, Mathematical Intelligencer 19.1, 5–11
- Salas et al. (2018) Salas P., Oonk J. B. R., van Weeren R. J., Wolfire M. G., Emig K. L., Toribio M. C., Röttgering H. J. A., Tielens A. G. G. M., 2018, MNRAS, 475, 2496
- Salvini & Wijnholds (2014) Salvini S., Wijnholds S. J., 2014, A&A, 571, A97
- Savini et al. (2018) Savini F., et al., 2018, MNRAS, 474, 5023
- Saxena, Röttgering & Rigby (2017) Saxena A, Röttgering H. J. A. & Rigby E. E., 2017, MNRAS, 469, 4083
- Scaife & Heald (2012) Scaife A. M. M., Heald G. H., 2012, MNRAS, 423, L30
- Schlegel, Finkbeiner, & Davis (1998) Schlegel D. J., Finkbeiner D. P., Davis M., 1998, ApJ, 500, 525
- Shimwell et al. (2017) Shimwell T. W., et al., 2017, A&A, 598, A104
- Smirnov (2011) Smirnov O. M., 2011, A&A, 527, A106
- Smirnov & Tasse (2015) Smirnov O. M., Tasse C., 2015, MNRAS, 449, 2668
- Smith et al. (2011) Smith D.J.B., et al., 2011, MNRAS, 416, 2857
- Smith et al. (2016) Smith D. J. B., et al., 2016, sf2a.conf, 271
- Stewart et al. (2016) Stewart A. J., et al., 2016, MNRAS, 456, 2321
- Sutherland & Saunders (1992) Sutherland W., Saunders W., 1992, MNRAS, 259, 413
- Tasse (2014b) Tasse C., 2014, arXiv, arXiv:1410.8706
- Tasse et al. (2017) Tasse C., et al., 2017, arXiv, arXiv:1712.02078
- Tasse (in prep.) Tasse C., in prep
- van Diepen & Dijkema (2018) van Diepen G., Dijkema T. J., 2018, ascl.soft, ascl:1804.003
- Van Eck et al. (2018) Van Eck C. L., et al., 2018, arXiv, arXiv:1801.04467
- van Haarlem et al. (2013) van Haarlem M. P., et al., 2013, A&A, 556, A2
- van Weeren et al. (2016a) van Weeren R. J., et al., 2016, ApJS, 223, 2
- Wayth et al. (2015) Wayth R. B., et al., 2015, PASA, 32, e025
- White et al. (1997) White R. L., Becker R. H., Helfand D. J., Gregg M. D., 1997, ApJ, 475, 479
- Wilber et al. (2018a) Wilber A., et al., 2018, MNRAS, 473, 3536
- Wilber et al. (2018b) Wilber A., et al., 2018, A&A submitted
- Williams, Intema, & Röttgering (2013) Williams W. L., Intema H. T., Röttgering H. J. A., 2013, A&A, 549, A55
- Williams et al. (2016) Williams W. L., et al., 2016, MNRAS, 460, 2385
- Williams et al. (2018a) Williams, W. L., Calistro Rivera, G., Best, P. N., et al. 2018, MNRAS, 475, 3429
- Williams et al. (2018b) Williams W. L., et al., A&A LOFAR SI
- Wilman et al. (2008) Wilman R. J., et al., 2008, MNRAS, 388, 1335
-
Yatawatta (2015)
Yatawatta S., 2015, MNRAS, 449, 4506
1ASTRON, the Netherlands Institute for Radio Astronomy, Postbus 2, 7990 AA, Dwingeloo, The Netherlands
2 Leiden Observatory, Leiden University, PO Box 9513, NL-2300 RA Leiden, The Netherlands
3GEPI, Observatoire de Paris, Universit?? PSL, CNRS, 5 Place Jules Janssen, 92190 Meudon, France
4Department of Physics & Electronics, Rhodes University, PO Box 94, Grahamstown, 6140, South Africa
5Centre for Astrophysics Research, School of Physics, Astronomy and Mathematics, University of Hertfordshire, College Lane, Hatfield AL10 9AB, UK
6SUPA, Institute for Astronomy, Royal Observatory, Blackford Hill, Edinburgh, EH9 3HJ, UK
7University of Hamburg, Hamburger Sternwarte, Gojenbergsweg 112, 21029 Hamburg, Germany
8SKA South Africa, 3rd Floor, The Park, Park Road, Pinelands, 7405, South Africa
9Ampyx Power B.V. Lulofsstraat 55 – Unit 13, 2521 AL The Hague, The Netherlands
10INAF - Istituto di Radioastronomia, via Gobetti 101, 40129 Bologna, Italy
11 School of Physics and Astronomy, The Open University, Walton Hall, Milton Keynes, MK7 6AA, UK
12RAL Space, The Rutherford Appleton Laboratory, Chilton, Didcot, Oxfordshire OX11 0NL, England
13LESIA, Observatoire de Paris, PSL, CNRS, Sorbonne Universités, UPMC Univ. Paris 06, Univ. Paris Diderot, Sorbonne Paris Cité, 5 place Jules Janssen, 92195 Meudon, France
14Astronomical Observatory, Jagiellonian University, ul. Orla 171, 30-244 Kraków, Poland
15Department of Space, Earth and Environment, Chalmers University of Technology, Onsala Space Observatory, SE-439 92 Onsala, Sweden
16SURFsara, Science Park 140, 1098 XG Amsterdam, Netherlands
17Department of Astrophysics/IMAPP, Radboud University Nijmegen, PO Box 9010, 6500 GL Nijmegen, The Netherlands
18CSIRO Astronomy and Space Science, PO Box 1130, Bentley WA 6102, Australia
19Jodrell Bank Centre for Astrophysics, School of Physics and Astronomy, University of Manchester, Manchester M13 9PL, UK
20Astrophysics, University of Oxford, Denys Wilkinson Building, Keble Road, Oxford, OX1 3RH, England
21Physics and Astronomy Department, University of the Western Cape, Bellville 7535, South Africa
22Oxford e-Research Centre, University of Oxford, 7 Keble Road, Oxford, OX1 3QG
23Wolfson College, University of Oxford, Linton Road, Oxford, OX2 6UD 24Kapteyn Astronomical Institute, University of Groningen, Postbus 800, 9700 AV Groningen, The Netherlands
25 Anton Pannekoek Institute for Astronomy, University of Amsterdam, Postbus 94249, 1090 GE Amsterdam, The Netherlands
26 Institute of Cosmology and Gravitation, University of Portsmouth, Dennis Sciama Building, Burnaby Road, Portsmouth PO1 5AR, UK
27Joint Institute for VLBI ERIC, PO Box 2, 7990 AA, The Netherlands
28Dipartimento di Fisica e Astronomia, Università di Bologna, via P. Gobetti 93/2, I-40129 Bologna, Italy
29Center for Astronomy and Particle Theory, University of Nottingham NG7 2RD, Nottingham, UK
30 Astronomical Institute, Ruhr-University Bochum, 44780 Bochum, Germany
31Thüringer Landessternwarte, Sternwarte 5, 07778 Tautenburg, Germany
32Mbarara University of Science & Technology, PO. Box 1410 Mbarara, Uganda
33 Max Planck Institute for Astrophysics, Karl-Schwarzschild-Str. 1, 85741 Garching, Germany
34Laboratoire Lagrange, Université Côte d’Azur, Observatoire de la Côte d’Azur, CNRS, Blvd de l’Observatoire, CS 34229, 06304 Nice cedex 4, France
35Instituto de Astrofisíca de Canarias, 38200 La Laguna, Tenerife, Canery Islands, Spain
36 Departamento de Astrofísica, Universidad de La Laguna (ULL), 38206 La Laguna, Tenerife, Spain
37Toruń Centre for Astronomy, Faculty of Physics, Astronomy and Informatics, NCU, Grudziacka 5, 87-100 Toruń, Poland
38CSIRO Astronomy and Space Science, PO Box 76, Epping, NSW 1710, Australia
39 Max-Planck Institute für Extraterrestrische Physik, Giessenbachstr. 1, 85741 Garching, Germany
40Excellence Cluster Universe, Boltzmann Strasse 2, 85748 Garching, Germany
41School of Physics, University College Dublin, Belfield, Dublin 4, Ireland
42Max-Planck-Institut für Radioastronomie, Auf dem Hügel 69, 53121 Bonn, Germany
43 Fakultät für Physik, Universität Bielefeld, Postfach 100131, 33501 Bielefeld, Germany