GRRMHD Simulations of Tidal Disruption Event Accretion Disks around Supermassive Black Holes:
Jet Formation, Spectra, and Detectability
Abstract
We report results from general relativistic radiation MHD (GRRMHD) simulations of a super-Eddington black hole (BH) accretion disk formed as a result of a tidal disruption event (TDE). We consider the fiducial case of a solar mass star on a mildly penetrating orbit disrupted by a supermassive BH of mass , and consider the epoch of peak fall back rate. We post-process the simulation data to compute viewing angle dependent spectra. We perform a parameter study of the dynamics of the accretion disk as a function of BH spin and magnetic flux, and compute model spectra as a function of the viewing angle of the observer. We also consider detection limits based on the model spectra. We find that an accretion disk with a relatively weak magnetic field around the BH (so-called SANE regime of accretion) does not launch a relativistic jet, whether or not the BH is rotating. Such models reasonably reproduce several observational properties of non-jetted TDEs. The same is also true for a non-rotating BH with a strong magnetic field (MAD regime). One of our simulations has a rapidly rotating BH (spin parameter 0.9) as well as a MAD accretion disk. This model launches a powerful relativistic jet, which is powered by the BH spin energy. It reproduces the high energy emission and jet structure of the jetted TDE Swift J1644+57 surprisingly well. Jetted TDEs may thus correspond to the subset of TDE systems that have both a rapidly spinning BH and MAD accretion.
keywords:
accretion, accretion discs - black hole physics - MHD - radiative transfer - gamma-rays: galaxies - X-rays: galaxies1 Introduction
When a star wanders too close to the black hole (BH) at the center of its galaxy, the tidal gravitational forces acting on the star overcome its self-gravity and ultimately disrupt the star (Hills, 1975; Rees, 1988; Phinney, 1989; Evans & Kochanek, 1989). The disruption leads to streams of bound and unbound material, with roughly half of the disrupted mass returning to form an accretion disk. The rate at which the bound material returns, or the “fall back rate”, declines with time and scales roughly as . The energy released from fall back and accretion is predicted to produce a transient that peaks in the UV and soft X-rays (Cannizzo et al., 1990). The emission is expected to decline in a similar fashion to the fall back rate.
Several decades after the initial theoretical bedrock was laid in the above-cited papers, several TDEs were detected by the soft X-ray telescope ROSAT (Komossa, 2015). These TDEs peaked in the soft X-ray with within months, and followed a roughly decay as predicted, fading over years. The spectra appeared very soft at peak and hardened on the timescale of a few years.
More recently, UV and optical wide-field surveys revealed TDEs flaring in the UV/optical, with several of these events also showing an X-ray flare (Gezari et al., 2006, 2008, 2009; Komossa et al., 2008; van Velzen et al., 2011; Holoien et al., 2016a). Where both UV/optical and X-ray data are available, it appears that the two components are associated with different regions, with the UV/optical emission having a characteristic temperature K and the X-ray component . It is not clear if the spectrum is simply the sum of two thermal components with these temperatures, as there are no observations of the FUV component.
TDEs are capable of launching powerful relativistic jets, as the Swift J1644+57 (J1644 hereafter) event showed (Bloom et al., 2011; Burrows et al., 2011; Zauderer et al., 2011). This transient, which is the prototypical example of what is referred to as a “jetted TDE,” was initially detected as a gamma-ray burst (GRB) in a quiescent host galaxy; however, the light curve was rapidly variable and remained visible for much longer than GRBs do. The peak X-ray luminosity of was much higher than in TDEs previously detected. Follow-up radio observations revealed radio emission from a relativistic jet shocking with the surrounding medium. The emission was likely the result of a jet with , viewed near the jet axis (Metzger et al., 2012). Two other jetted TDE candidates, Swift J2058+0516 (J2058 hereafter) and Swift J1112-8238 (J1112 hereafter), have since been detected (Cenko et al., 2012; Brown et al., 2015).
Recent theoretical works have investigated the hydrodynamics (Ramirez-Ruiz & Rosswog, 2009; Guillochon & Ramirez-Ruiz, 2013; Shiokawa et al., 2015; Bonnerot et al., 2016a; Hayasaki et al., 2016), emission properties (Strubbe & Quataert, 2009; Lodato & Rossi, 2011; Guillochon et al., 2014), impact of BH spin (Kesden, 2012a, b; Stone & Loeb, 2012; Guillochon & Ramirez-Ruiz, 2015), and jet properties (Giannios & Metzger, 2011; Piran et al., 2015; Lu et al., 2017), of TDEs. A fundamental question regarding the nature of TDEs is the mass accretion rate onto the BH. The possibility of super-Eddington rates was pointed out early on (Rees, 1988), but this requires that the circularization and viscous dissipation timescales are small relative to the fall back time of the most bound material. Mockler et al. (2018) find that the light curves of many observed TDEs are consistent with a short viscous dissipation timescale; however, numerical simulations suggest circularization times that are several times longer than the fall back time (Bonnerot et al., 2016a; Hayasaki et al., 2016).
Super-Eddington, rotating black holes produce highly relativistic jets (Sa̧dowski & Narayan, 2015b; Narayan et al., 2017; O’Riordan et al., 2017), fueled at least in part by the extraction of spin energy from the black hole via the Blandford-Znajek process (Blandford & Znajek, 1977). A magnetically arrested accretion disk (MAD, see Narayan et al. 2003, also Bisnovatyi-Kogan & Ruzmaikin 1974; Igumenshchev et al. 2003; Tchekhovskoy et al. 2014) provides an attractive explanation for jetted TDEs since magnetohydrodynamical (MHD) simulations have shown they can launch powerful jets, e.g. Tchekhovskoy et al. (2011). Whether the magnetic field needed for the Blandford-Znajek mechanism to operate is from the disrupted star itself or was already present in the form of a fossil disk is still an open question. Kelley et al. (2014) demonstrated that accumulating a magnetic flux sufficient to launch a jet is possible if the BH had a fossil accretion disk threaded with a magnetic field. They found that the tidal stream from the disrupted star effectively drags the remnant magnetic field in. Studies of the magnetic field evolution during a TDE suggest that field amplification during disruption may also be sufficient to provide the magnetic flux (Guillochon & McCourt, 2017; Bonnerot et al., 2017).
Observations indicate that there is a zoo of TDE properties despite the somewhat simple physics. Some TDEs are seen only in the UV/optical while others have been detected in both soft X-ray and UV/optical bands. The rarity of jetted TDEs suggests that there is a specific region of parameter space where a jet will form. It is reasonable to suppose that this range of behavior is related to the viewing angle as well as the properties of the BH and star.
Dai et al. (2018) examined the viewing angle dependence. They presented the first 3D general relativistic radiation magnetohydrodynamics (GRRMHD hereafter) simulation of a TDE accretion disk near the peak fall back accretion rate. They investigated the case of a modestly rotating BH of mass with spin parameter, , and mean accretion rate . Their model led to a mildly relativistic, wide angle, ultrafast outflow with a Lorentz factor . The viewing angle-dependent spectra computed from their model suggests that the optical to X-ray flux ratio increases as the observer moves towards the disk plane. While their model may only apply to “non-jetted TDEs,” i.e., TDEs that do not launch an ultra relativistic jet (though they may have a mildly relativistic jet), it does offer a qualitative picture of how the viewing angle of the observer can affect the observed properties of a TDE.
In the present work, we use GRRMHD simulations in 2D and 3D to study the post-fallback accretion disk for the fiducial case of a supermassive black hole (SMBH) that disrupts a solar mass star on a slightly penetrating orbit. We run four models to investigate the properties of super-Eddington accreting TDEs as well as the conditions for the launching of an ultra relativistic jet. We consider two values of the BH spin: . For each spin, we initialize the magnetic field so that the BH either does or does not build up a high magnetic flux. These four models correspond to a TDE accretion disk around a low (high) spin BH which has (has not) become a magnetically arrested disk (MAD). We post-process the simulation output using a fully general relativistic radiative transfer code. We study the spectra from each model as a function of viewing angle and investigate how BH spin, magnetic field strength, viewing angle and interstellar extinction change the properties of the observed TDE emission. The angular momentum of the initial disk is aligned with the BH spin in the models we consider in this work. If they were misaligned, Lense-Thirring torques would cause the disk to precess (Fragile et al., 2007). In addition, jet precession would occur until a MAD state was achieved, after which wobbling during jet alignment with the BH spin might cause intense flaring (Tchekhovskoy et al., 2014). A larger amount of mass may also be ejected in this scenario as the precessing jet sweeps up material in its path.
In Section 2, we review the physics involved in a TDE and discuss our choice of parameters for initial conditions. In Section 3, we describe our numerical methods. In Section 4, we describe the results of our simulations in terms of the dynamics and energetics. In Section 5, we discuss the viewing angle dependent spectra computed from the four models and describe the emission in detail. We then compute relevant properties and compare our models to observations of jetted and non-jetted TDEs. We conclude in Section 6.
2 Tidal Disruption Event Physics
A star will be disrupted by a supermassive BH (SMBH) if it comes closer than the tidal radius (Hills, 1975):
| (1) |
where is the dimensionless mass of the SMBH, is the dimensionless mass of the disrupted star, and is its dimensionless radius. It is useful to describe the disruption in terms of the ratio between the tidal radius and pericenter separation of the star, . Disruption occurs for , where is the Schwarzschild radius of the BH.
Following pericentric passage, nearly half of the material in the disrupted star remains bound and will return to form a disk, while the other half is unbound and escapes (Rees, 1988). The spread in specific orbital energy of the streams is effectively ‘frozen in’ at the tidal radius and has a spread given by (Stone et al., 2013)
| (2) |
The bound material returns at the fall back rate, which initially peaks at a super-Eddington rate for , and then falls off as . More recent works show that, depending on the stellar properties, the fall back rate can deviate at early times from the decline (Lodato et al., 2009). For , the peak fall back accretion rate is expected to be roughly (Stone et al., 2013).
Rees (1988) suggested that internal dissipation would lead the bound material to form a radiation-supported torus with a density maximum at . This disk is fed by the accretion of the bound material in the tidal stream. Hydrodynamical simulations (Shiokawa et al., 2015; Bonnerot et al., 2016a; Hayasaki et al., 2016; Sa̧dowski et al., 2016a) and semi-analytic studies (Dai et al., 2013, 2015; Guillochon & Ramirez-Ruiz, 2015) have demonstrated that the formation of a thick torus is possible within a certain parameter space. For highly penetrating orbits, stream-stream collisions can drive disk formation on a relatively short timescale. The rate at which material actually accretes onto the SMBH from the torus is then mediated by the viscous dissipation timescale. If the viscous dissipation timescale is short, the mass accretion rate is expected to closely match the fall back accretion rate.
In this work, we simulate the accretion flow of an efficiently circularizing TDE disk for the case of a mildly penetrating disruption of a Sun-like star of mass and solar metallicity. The disrupting hole is a SMBH. For such an event, the star is initially on a parabolic trajectory and the circularization radius of the disk can be approximated as
| (3) |
In initializing the gas in the simulations presented in this work, we set the Bernoulli number to the binding energy as given in equation (2). Following Rees (1988), we assume that the debris that forms the disk all comes in with roughly the same specific angular momentum and that the density maximum of the resulting disk occurs at . We also assume that the viscous dissipation timescale is short enough that the mass accretion rate onto the black hole is similar to the fall back rate.
3 Numerical Methods
3.1 KORAL
The GRRMHD simulations presented in this work were performed using the code KORAL (Sa̧dowski et al., 2013a, 2014, 2015, 2017), which solves the following conservation equations of MHD in a fixed, arbitrary spacetime using finite-difference methods:
| (4) | ||||
| (5) | ||||
| (6) | ||||
| (7) |
where we use standard relativistic notation, with a semicolon denoting a covariant derivative () and a dot denoting a time derivative in the comoving frame (, with being the proper time of the relevant fluid). Here, is the gas density in the comoving fluid frame; are the components of the gas four-velocity as measured in the “lab frame”; are the components of the radiation fluid four-velocity (see Sa̧dowski & Narayan 2015b); is the MHD stress-energy tensor in the lab frame,
| (8) |
is the stress-energy tensor of radiation (Sa̧dowski & Narayan, 2015b); is the radiative four-force which describes the interaction between gas and radiation (Sa̧dowski et al., 2014); and is the photon number density. The internal energy and gas pressure are related by , where is the adiabatic index of the gas, and the magnetic field four-vector is evolved following the ideal MHD induction equation (Gammie et al., 2003).
The radiative stress-energy tensor is obtained from the evolved radiative primitives, namely, the four velocity of the radiative rest frame and the radiative energy density in this frame (Sa̧dowski et al., 2013a, 2014). The M1 closure scheme (Levermore, 1984) is used, modified by the addition of radiative viscosity (Sa̧dowski et al., 2015).
The interaction between gas and radiation (absorption, emission, and scattering) is described by the radiation four-force . The opposite signs of this quantity in the conservation equations for gas and radiation stress-energy reflect the fact that the gas-radiation interaction is conservative, i.e. energy and momentum lost by one is gained by the other. For a detailed description of the four-force see Sa̧dowski et al. (2017).
Two of the simulations described in this work were performed in 2D, assuming axisymmetry and using the mean-field dynamo model described in Sa̧dowski et al. (2015). These 2D runs correspond to the SANE (“Standard and Normal Evolution”, see Narayan et al. 2012) regime of accretion, where the magnetic field that accumulates around the BH is relatively weak. Previous work has shown that, for SANE simulations, 2D and 3D runs give similar results (Sa̧dowski et al., 2016b; Narayan et al., 2017). The remaining two simulations correspond to the MAD regime, and these require 3D. For these, we use a similar grid to the 2D simulations, but with lower resolution. We initially ran the simulations in 2D with the mean-field dynamo until the accretion flow became MAD. We then switched off the mean-field dynamo, re-gridded the data on a 3D grid by copying the primitives in azimuth and perturbing the azimuthal fluid velocity, and then continued evolving the simulation in 3D. We find that the effects of the initial 2D run and the regridding dissipate completely within after switching to 3D, where is the gravitational time.
For both 2D and 3D simulations we use modified Kerr-Schild coordinates with the inner edge of the domain inside the BH horizon. The radial grid cells are spaced logarithmically in radius and the cells in polar angle are smaller towards the equatorial plane. The cells are equally spaced in azimuth, covering a range of . At the inner and outer radial boundaries, we use outflow boundary conditions, which prevent the inflow of gas and radiation. At the polar boundaries, we use a reflective boundary condition, while in the azimuthal direction we employ a periodic boundary condition. Table 1 lists the resolution, grid parameters and other relevant information of the four simulations. The models are given descriptive names – s00, m00, s09, m09 – which distinguish whether they are SANE or MAD, and identify the BH spin.
We have verified that the fastest growing mode of the magnetorotational instability (MRI, Balbus & Hawley 1991) is adequately resolved within each simulation. For this we compute the quantities (Hawley et al., 2011),
| (9) | |||
| (10) |
where (the grid cell size) and (the magnetic field strength) are both evaluated in the orthonormal frame, is the angular velocity, and is the gas density. For the 2D SANE models, we find in the disk region within , where is the gravitational radius. For the 3D MAD models, we find and within the same region. In both cases, this is sufficient to resolve the MRI (Hawley et al., 2011).
3.2 HEROIC
The output from each GRRMHD simulation was post-processed using the general relativistic multi-dimensional radiative transfer code HEROIC (Zhu et al., 2015; Narayan et al., 2016), using the procedures described in Narayan et al. (2017). In brief, time- and azimuth-averaged output from the simulation is transferred to an axisymmetric grid with uniform spacing in and . The radiation field in each cell within this grid is described by rays oriented along 162 angular directions distributed uniformly on the sphere. The intensity distribution of each ray is described by a spectrum with 160 frequencies spaced uniformly in from Hz to Hz.
The global radiation field over the entire grid is obtained by solving the radiative transfer equation iteratively. HEROIC uses the same continuum opacities as those in KORAL, viz., free-free, thermal synchrotron, atomic processes (via the model of Sutherland & Dopita 1993), and Comptonization of all of these. However, HEROIC includes the frequency dependence of the various opacities (only approximately in the case of atomic edges), whereas KORAL works with gray opacities. In the process of solving for the radiation field, HEROIC also solves for the gas temperature in selected regions of the grid, using the viscous heating rate estimated in KORAL and applying the condition of energy balance. The temperature solution is restricted to those regions of the flow that either have reached steady state in the GRRMHD simulation or from which radiation can diffuse out in less than the duration of the simulation ( or , see Table 1). For the remaining cells, we keep the temperature fixed at the value obtained from the GRRMHD simulation. In practice, the only cells with fixed temperature are those deep inside the torus in regions of large optical depth. All regions from which any significant radiation reaches an external observer have their temperature solved for self-consistently.
After we obtain a converged solution for the radiation field from HEROIC, we use general relativistic ray-tracing to calculate the radiation spectrum seen by observers located at different viewing angles. We also compute synthetic images of the accretion flow to identify which regions of the flow contribute to which parts of the spectrum.
4 Simulations
4.1 Units
We define the gravitational radius and the gravitational time by
| (11) |
We use these as our units of length and time. Often, we set , so the above relations would be equivalent to . However, we occasionally restore and when we feel it helps to keep track of units.
We adopt the following definition for the Eddington mass accretion rate:
| (12) |
where is the Eddington luminosity, is the radiative efficiency of a thin disk around a BH with spin parameter ,
| (13) |
and is the radius of the Innermost Stable Circular Orbit (ISCO, Novikov & Thorne 1973) in the Kerr metric, where and .
4.2 Definitions
4.2.1 Useful Quantities
In a quasi-steady state, the net accretion rate is constant in time and independent of radius. The accretion rate can be estimated from the simulation data by computing the following integral at any radius within the region of inflow equilibrium:
| (14) |
Here is the radial component of the four-velocity and is the determinant of the metric (which is proportional to ). Positive values of correspond to an outward mass flux, hence the minus sign in front of the integral. In this paper, we compute at the event horizon, which is located at .
The flow of energy in different forms is fundamental to understanding the properties of GRRMHD simulations. The most fundamental quantity is the total luminosity in all forms of energy (radiative, electromagnetic, thermal, gravitational, and binding energy) minus the rest mass energy of the accreted gas. We call this the total luminosity,
| (15) |
where we integrate the radial flux of energy carried by gas plus magnetic field () and radiation (), and subtract out the rest-mass energy (, since it does not lead to observational consequences for an observer at infinity). Note that positive values of and correspond to an inward flux of energy, hence the minus sign in front of the integral. In a stationary state, the total luminosity integrated over all angles is independent of radius. It gives the total luminosity of the whole system, and represents for instance the luminosity, both radiative and kinetic, seen at infinity.
It is also useful to define individual components of the energy flow (e.g., Sa̧dowski et al. 2016c). The corresponding luminosities will not be independent of radius since energy could be transferred from one form to another as gas flows inward or outward. Nevertheless, these luminosities often provide useful insights. The radiative luminosity is given by:
| (16) |
which gives the flux of radiation energy through a surface at a given radius. A related luminosity we consider is the radiative isotropic equivalent luminosity, which is the radiative luminosity of the source if we take the radiative flux corresponding to a given direction (in the case of 3D models, we average over ) and assume that the source emits the same flux isotropically over all angles:
| (17) |
In addition to these radiative luminosities, we similarly define the kinetic luminosity, magnetic (i.e., Poynting) luminosity, etc.
The relativistic kinetic energy density is given by . The total kinetic energy within any given region of the grid, e.g., between and and between and , is found by integrating over the corresponding volume. This quantity is given by:
| (18) |
and is sometimes useful when analyzing physics in the jet.
Another important quantity is the efficiency, which is the fraction of the accreted rest-mass energy that is converted into any particular form of energy. For any given energy form, we define the efficiency via the corresponding luminosity:
| (19) |
where is any of the luminosities above. When studying efficiencies, a useful benchmark is the radiative efficiency of a general relativistic thin disk (Novikov & Thorne, 1973), which is for and for (the two spins we consider in this paper).
We quantify the magnetic field strength at the BH horizon through the dimensionless magnetic flux parameter (Tchekhovskoy et al., 2011):
| (20) |
where is the radial component of the magnetic field and the integral is computed at the radius of the horizon. For geometrically thick disks such as those considered in this work, the MAD state is achieved once (Tchekhovskoy et al., 2011, 2012).
We have written the upper and lower bounds of in many of the integrals above as , , to signify that we do not always integrate over the entire sphere when considering these quantities. For instance, we sometimes perform the integrals over the disk, wind, and jet regions separately in order to determine where most of the energy released by the system is deposited.
We estimate the electron scattering photosphere location for an observer at infinity along the direction by integrating the optical depth radially inward from the outer boundary of the grid. Far from the BH, the curvature of spacetime is negligible, so we simply integrate at constant in the “lab frame” (i.e., we ignore frame-dragging in this computation):
| (21) |
where is the electron scattering opacity, is the Klein-Nishina correction factor for thermal electrons (Sa̧dowski et al., 2017), and is the radius corresponding to the outer boundary of the grid. For the gas and radiation temperatures in the simulations presented here, the Klein-Nishina correction is negligible and the electron scattering opacity is essentially the Thomson opacity. In this work, we choose the location of the photosphere as the surface.
As our simulations couple gas and radiation, it is useful to consider the temperatures of the two separately. The gas temperature quantifies the thermal energy of the gas while the radiation temperature is related to the mean photon energy in a cell. As an example, if the emission of a cell were strictly black-body emission in LTE, then one would expect . However, in regions where synchrotron emission or Compton/inverse Compton scattering are significant or the optical depth is not large, the radiation tends to have .
4.2.2 ‘Jet’, ‘Wind’, and ‘Disk’
For optically thick accretion flows in TDEs, one can generally identify three distinct regions. Near the BH at equatorial angles, there is an accretion disk which consists of high density gas flowing in. This transitions on the outside to a bound torus with low binding energy that serves as a gas reservoir for mass accretion. In our simulations, the torus also provides the magnetic field to trigger the MRI and feed gas onto the BH. All this constitutes the ‘disk’.
At more polar angles, gas and radiation flow out of the system. The outflow may be divided into (i) a ‘jet’ with a large energy flux and high velocity, and (ii) a ‘wind’ with a large mass flux and slower velocity. The exact separation between these two regions is somewhat ambiguous. We use a similar method to that employed in Sa̧dowski et al. (2013b), viz., in terms of the Bernoulli number, which is defined as follows:
| (22) |
We use the value of Be to divide the various regions in the simulation. For the disk/torus, we simply use the condition , i.e., the gas is bound to the BH. The jet and wind are both unbound with , and we select a critical value of to define the boundary between the fast jet and the slower wind. Here we adopt , which corresponds to a particle velocity of at infinity. We define the ‘jet’ as those regions with and the ‘wind’ as the regions with .
4.3 Initial Setup
| s00 (SANE, 2D) | m00 (MAD, 3D) | s09 (SANE, 2D) | m09 (MAD, 3D) | |
| 3.4 | 2.2 | 4.0 | 615 | |
| 0.6% | 0.132% | 1.2% | 64.0% | |
| 3.3% | 1.8% | 7.2% | 105.2% | |
| 1.26 | 0.17 | 2.29 | 135.59 | |
| 20,000 | 25,000 | 20,000 | 25,000 |
We initialize the simulations with the hydrostatic equilibrium torus model of Kato et al. (2004). Since the tidal fall back stream comes in with nearly constant specific angular momentum (Rees, 1988), we initialize the torus such that the fluid has the same specific angular momentum throughout.
The Bernoulli number of this model, assuming a constant angular momentum torus in hydrostatic equilibrium, is also constant throughout. As such, we find it convenient to set the Bernoulli number of the torus equal to the binding energy of the most bound material, which is given by equation (2). This leads to a tenuously bound torus which is nearly spherical in structure with an evacuated polar region. The pressure of the gas (as determined from the model) is then redistributed between thermal gas and blackbody radiation such that local thermal equilibrium is maintained (). The resulting torus is close to equilibrium. Appendix A gives a more detailed description of the torus model and how it is initialized in KORAL.
The initial torus in the simulations described in this paper (the same torus was used for all four models) has a total mass of , which is slightly lower than the expected for the disruption of a solar mass star. The majority of TDEs are expected to be of low mass stars (Kroupa et al., 1993), so the initial disk mass is probably quite reasonable. The fall back accretion rate would still be super Eddington, as in the simulations presented herein, since the peak fall back accretion rate scales (approximately) only as the square root of the mass of the disrupted star (see Stone et al. 2013).
We thread the torus with a weak magnetic field whose strength is scaled such that the minimum magnetic pressure ratio:
| (23) |
is , where is the gas pressure, is the radiation pressure, and is the magnetic pressure. The initial radiation pressure ratio (defined in an analogous manner to ):
| (24) |
is quite small, meaning that the torus is highly radiation dominated.
To study the conditions under which a TDE will or will not result in a jet, we perform four accretion disk simulations: two BH spins, two magnetic field geometries. The properties of the simulations are summarized in Table 1. The two SANE models are initialized with multiple poloidal loops of magnetic field of changing polarity, while the two MAD models are initialized with a single large scale dipolar field loop. Appendix A gives details. The initial field configuration in the SANE models is designed such that relatively little magnetic flux accumulates around the BH. On the other hand, the field configuration in the MAD models ensures that the magnetic flux very rapidly builds up around the BH; the back reaction of this field causes the accretion flow to be magnetically arrested and to settle down to the MAD state (Narayan et al., 2003).
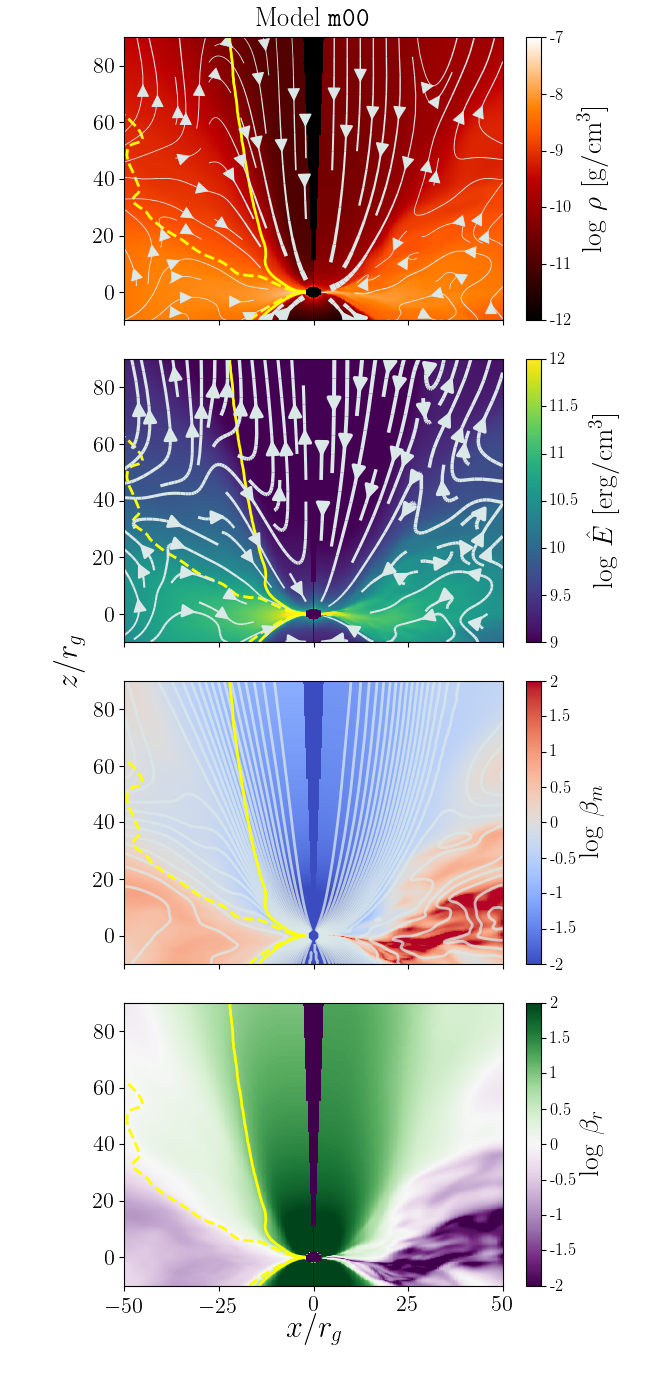
As we show below, three of the simulations, viz., s00, s09, m00, resemble typical non-jetted TDEs. We consider all three to be viable models of non-jetted TDEs. In the main paper, we present detailed results for one of the models, s00; results for the other two are summarized in Appendix C. The fourth model, m09, strongly resembles jetted TDEs, especially J1644. We consider this to be an excellent prototype for a jetted TDE.
4.4 Properties of Models
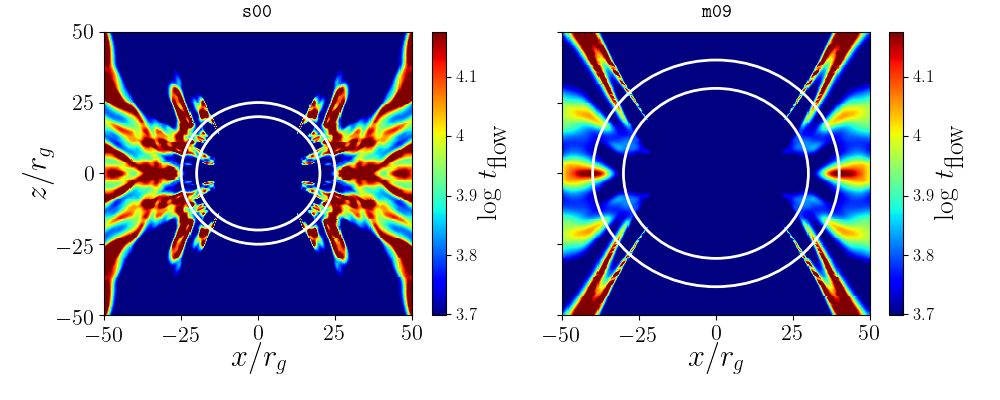
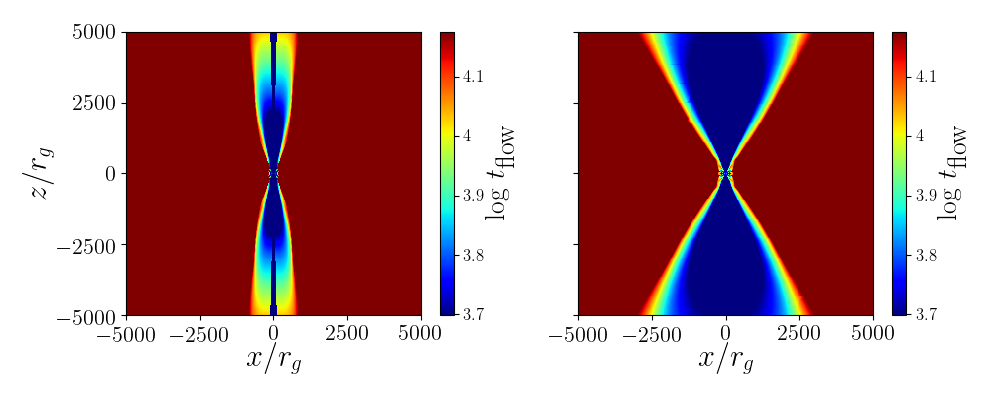
When analyzing the simulation output from KORAL, we focus on the converged, steady-state regions of the flow. As a diagnostic for convergence, we compute the flow time in each cell,
| (25) |
where is the radius and is the poloidal fluid velocity. Eliminating the first of the simulation, which is a transient phase during which the accretion rate is building up from zero, we consider the effective duration of each simulation to be
| (26) |
where the values are given in Table 1. We consider cells with to have reached a steady state.
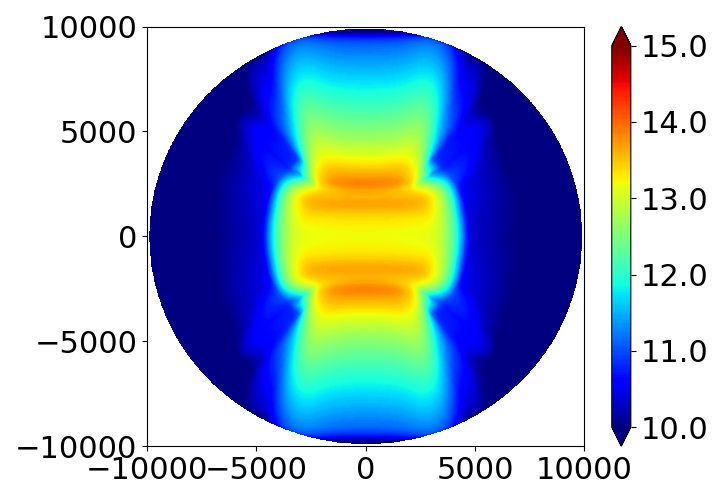
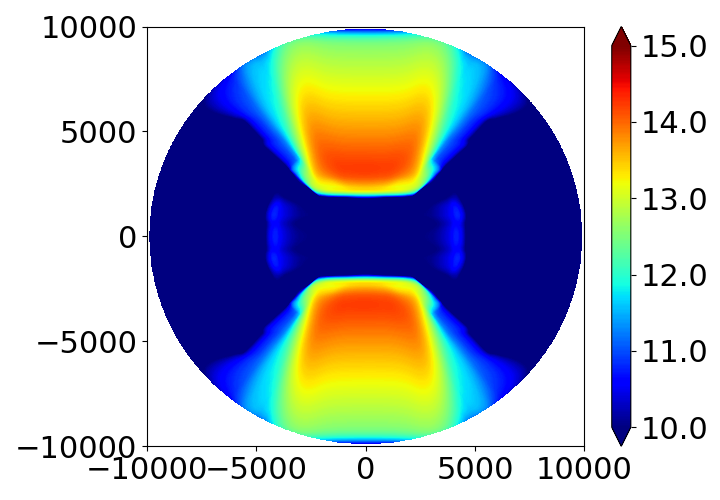
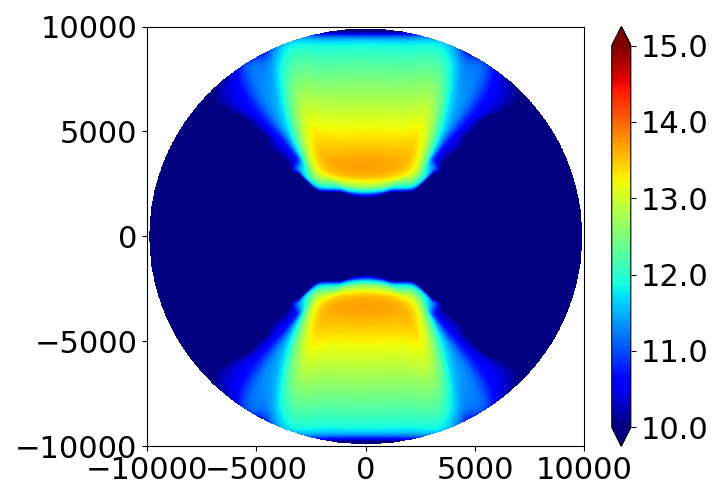
Given the relatively short duration of the simulations discussed here, most regions of the disk have not reached steady state. However, most regions of the wind and jet are in a steady state. This can be seen in Figure 1 where we show (colors) for the simulations s00 and m09. Deep blue regions correspond to and are safely in inflow equilibrium. Deep red regions correspond to , and are certainly not in inflow equilibrium. Intermediate color regions have achieved partial inflow equilibrium, but for the purposes of this paper we consider them to be in steady state.
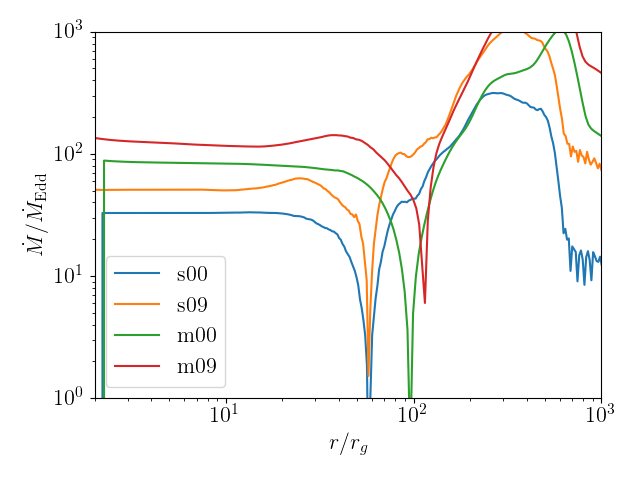
The two panels showing regions close to the BH () indicate that the disk has reached inflow equilibrium out to a radius in s00 and in m09 (indicated by the white circles). The MAD simulation is in steady state out to a larger radius because of its larger magnetic field which gives stronger angular momentum transfer and hence a larger radial infall velocity in the disk. For the same reason, as Table 1 and Figure 2 show, the two MAD simulations have larger mass accretion rates compared to their SANE counterparts, even though both are initialized with the same torus.
The two panels that show the large scale structure of the simulations () indicate that the region near the poles has reached steady state out to quite large radii. This region corresponds to the jet and the wind. Therefore we can study the properties of these two regions out to . This is beyond the photosphere of the torus, which is at (see Figure 6 later), and hence allows us to study observational signatures of the jet/wind even for off-axis observers. The torus itself is far from reaching a dynamical steady state, though it is in hydrostatic equilibrium by construction (initial state). However, regions close to the photosphere of the torus have achieved energy balance (viscous heating balanced by radiative cooling) to an optical depth of several. Hence we can study the radiation emerging from the photosphere when we carry out the radiative transfer calculations described later.
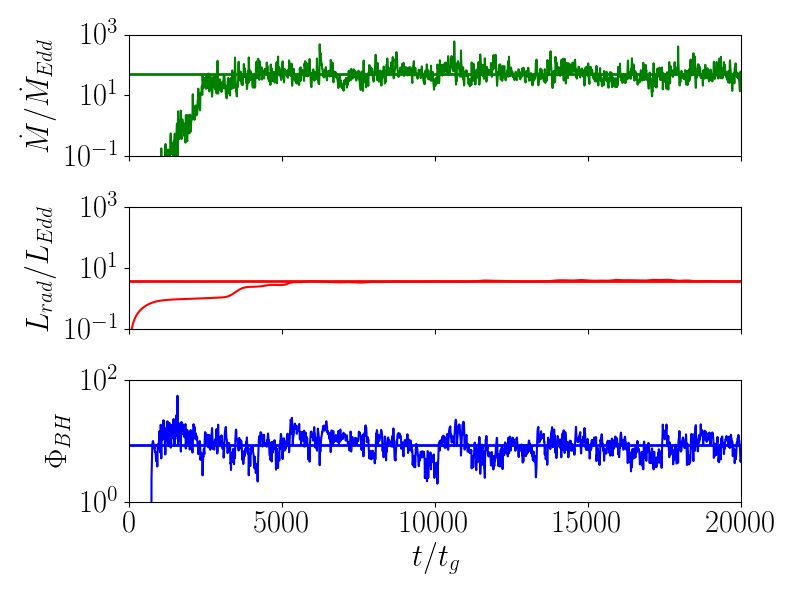
In Figure 2 we show the time- and azimuth-averaged mass accretion rates for the four models. We see that model s00 has reached a quasi-steady constant value of out to , and that m09 has achieved steady state out to . These estimates agree with the discussion in the previous paragraphs.
Figure 2 and Table 1 indicate that the spin 0.9 models have values about 50% larger than the equivalent spin 0 models. This is caused by a combination of two factors. First, note that is defined via the radiative efficiency of a thin accretion disk (eq. 12). Since the value of for spin 0.9 is 2.7 times greater than that for spin 0 (0.156 vs 0.0572), this effect by itself implies that, for the same physical mass accretion rate (), the spinning BH models would have larger by a factor of 2.7. However, this factor is partly counteracted by the fact that the ISCO and horizon radii are both substantially smaller for a spinning BH (, respectively, vs , for a non-spinning BH). Since super-Eddington accretion flows lose a lot of mass via winds, the smaller radii mean that a smaller fraction (by almost a factor of 2) of the available gas crosses the horizon. The combination of the two effects results in a net enhancement of by 50%.
4.4.1 Models without a Relativistic Jet: Non-Jetted TDEs
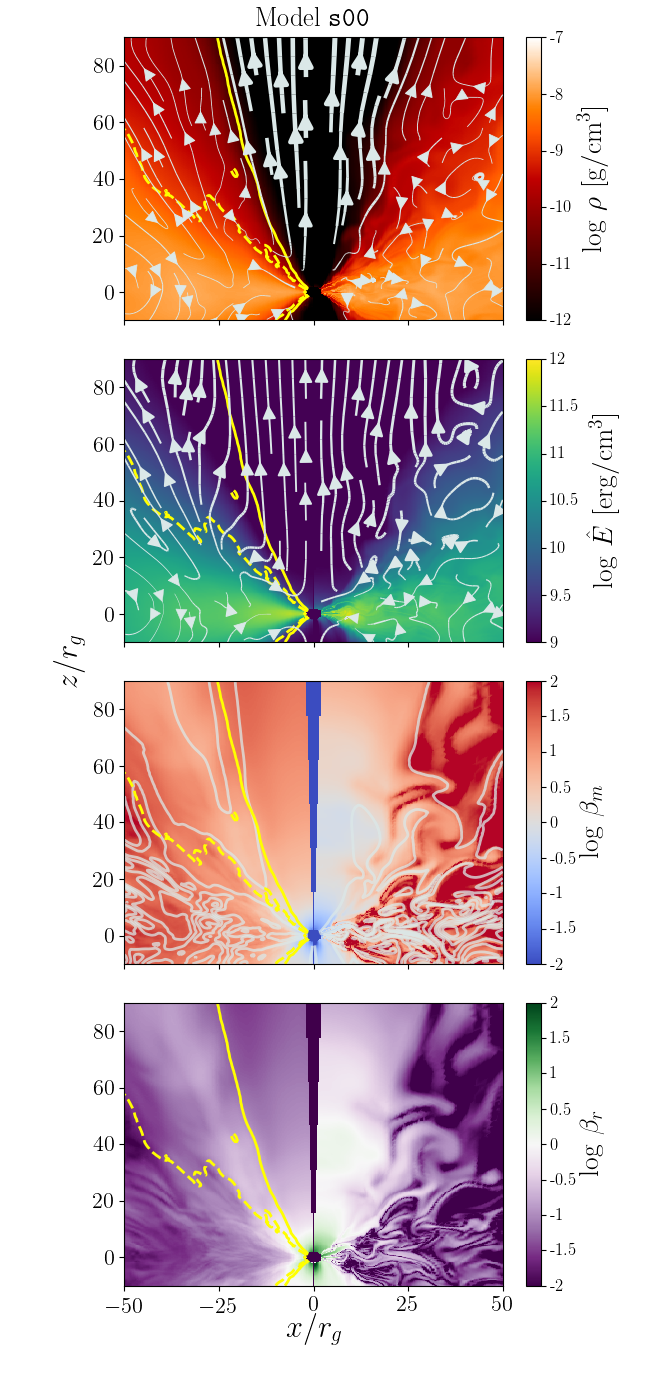


In Figure 3 we show some properties of the simulation s00, which we consider to be our fiducial non-jetted TDE model. Models s09 and m00 also have similar properties and are equally valid models of non-jetted TDEs. Results corresponding to these other models are shown in Appendix C. The right and left halves of the panels in Figure 3 show, respectively, a snapshot of simulation s00 at , and time-averaged properties over .
The topmost panel shows the distribution of gas density (colors) and velocity (streamlines). The disk is evidently thick and turbulent. The gas accretes onto the black hole primarily along the equatorial plane. The flow shows significant turbulence even at relatively large radii. The turbulent structure of the velocity streamlines is the result of material near the black hole gaining energy and being launched back into the disk. For such a low binding energy disk, small perturbations can lead to the material becoming unbound quite easily (Coughlin & Begelman, 2014). Outflows driven predominantly by radiation pressure are evident within from the pole.
The second panel shows the radiation energy density (colors) and radiative flux (streamlines). Much of the radiation energy density is contained within the disk near the equatorial plane. Radiation is advected in with the accretion flow and escapes out through the funnel, driving a mildly relativistic outflow (). We will refer to the highest velocity material here as the ‘jet’ even though it is too slow to be considered a true relativistic jet.
The third panel shows , the ratio between gas plus radiation pressure and magnetic pressure (colors). The contours follow the vector potential (), which maps the poloidal magnetic field structure. The torus is predominantly gas/radiation pressure dominated throughout, but there are pockets of magnetic field dominance in the jet region.
In the bottom panel, we show , the ratio between gas plus magnetic pressure and radiation pressure. The disk and wind are evidently radiation dominated while the jet has nearly equal magnetic and radiation pressures.
In each panel in Figure 3, we show the contour corresponding to as the solid yellow line, and as the dashed yellow line. We find that our choice of divides the simulation appropriately between the faster jet and slower wind. This contour also divides the simulation into the magnetic pressure dominated jet and radiation/gas pressure dominated wind (and disk). We estimate the jet opening angle using the contour of at large radii (). For models s00 and s09, we find a similar jet opening angle of . For model m00, we find that the outflow actually becomes quite optically thick. Furthermore, the simulation appears to have only launched a wind, with hardly any ‘jet’ (see below).
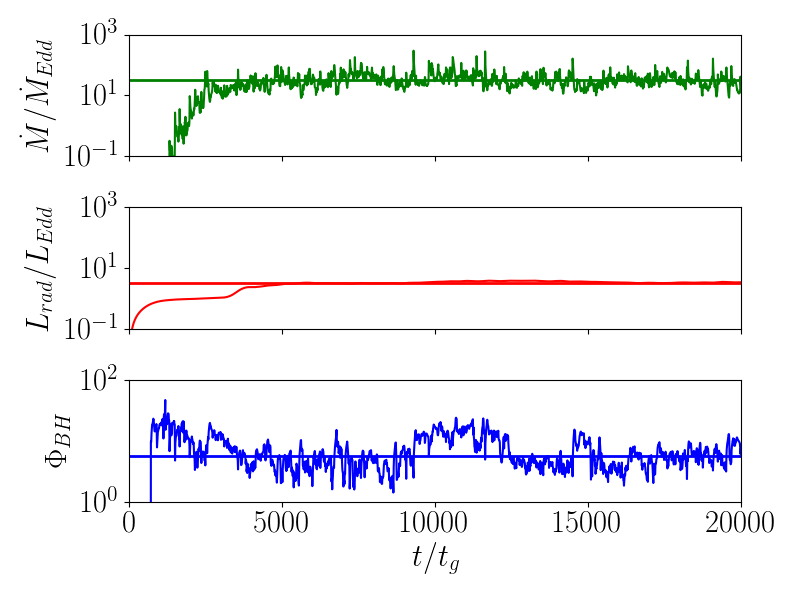
In Figure 4 we show for model s00 the mass accretion rate as a function of time in units of (top), the radiative luminosity in units of (middle), and the magnetic flux parameter as given by equation (20). The average accretion rate over the last of the simulation is roughly times the Eddington rate. In contrast, the radiative luminosity [equation (16)], computed outside the photosphere (, see Figure 6 below) is roughly . Thus the accretion flow is radiatively very inefficient, consistent with expectations for this regime of accretion (see the discussion of the slim disk model in Abramowicz et al. 1988). As for the magnetic flux parameter, the initial setup of multiple quadrupolar field loops prevents the accumulation of much magnetic field (of single polarity) around the BH. This leads to a low magnetic flux parameter even at late times, which is much smaller than that expected for a MAD system (). Hence model s00 belongs firmly to the class of SANE accretion flows.
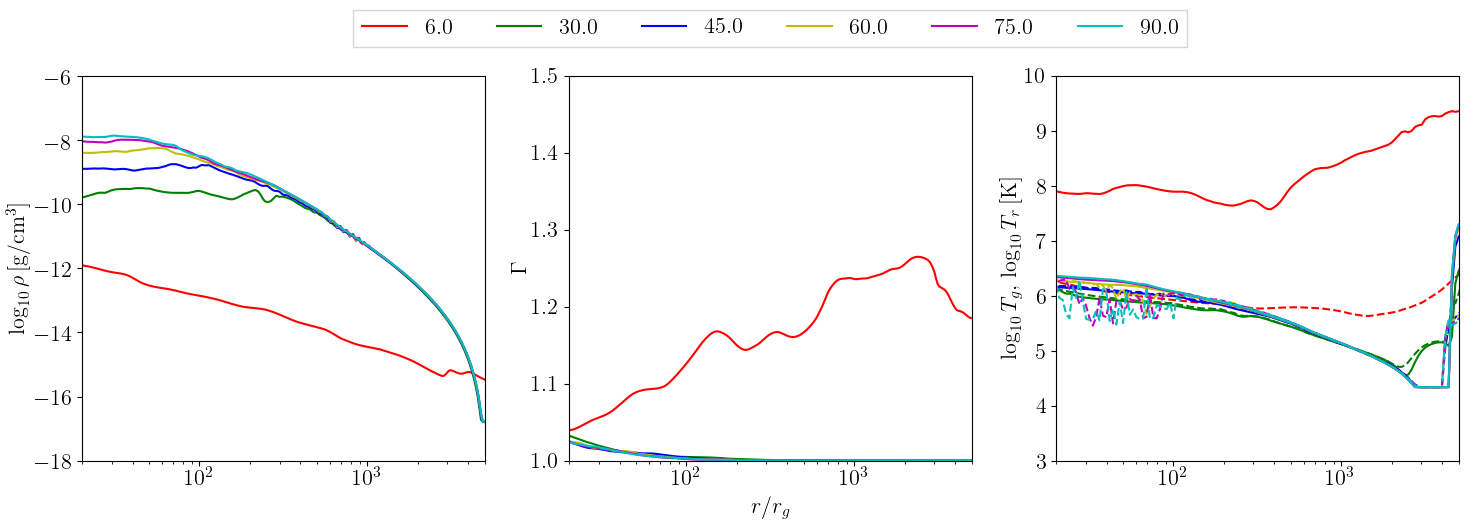
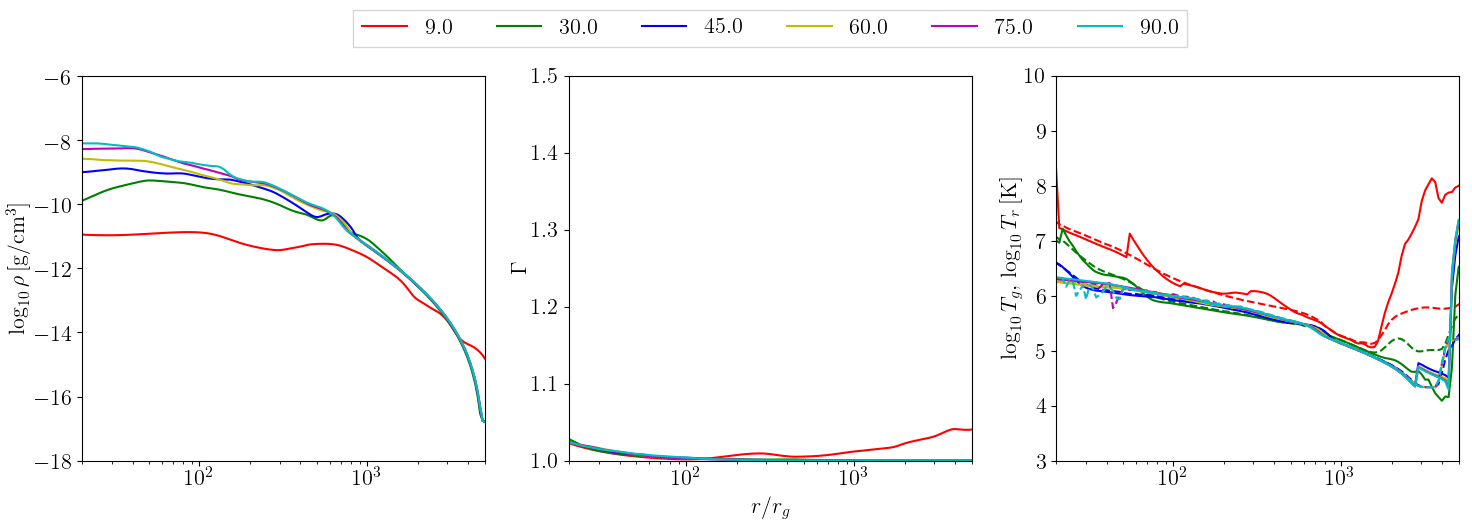
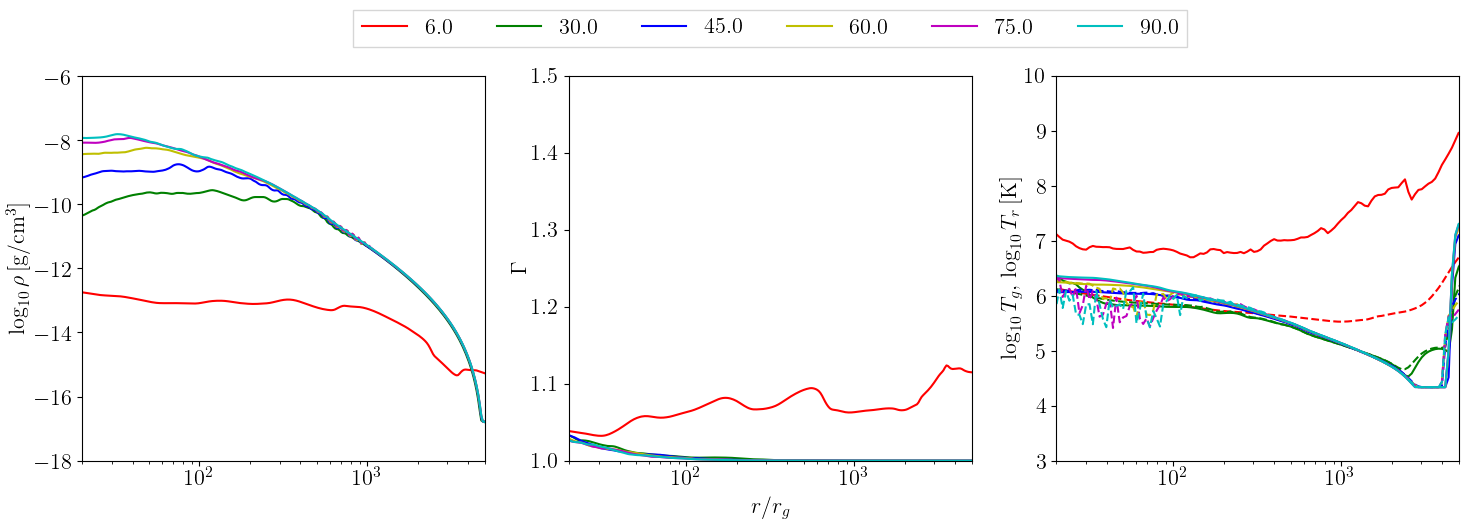
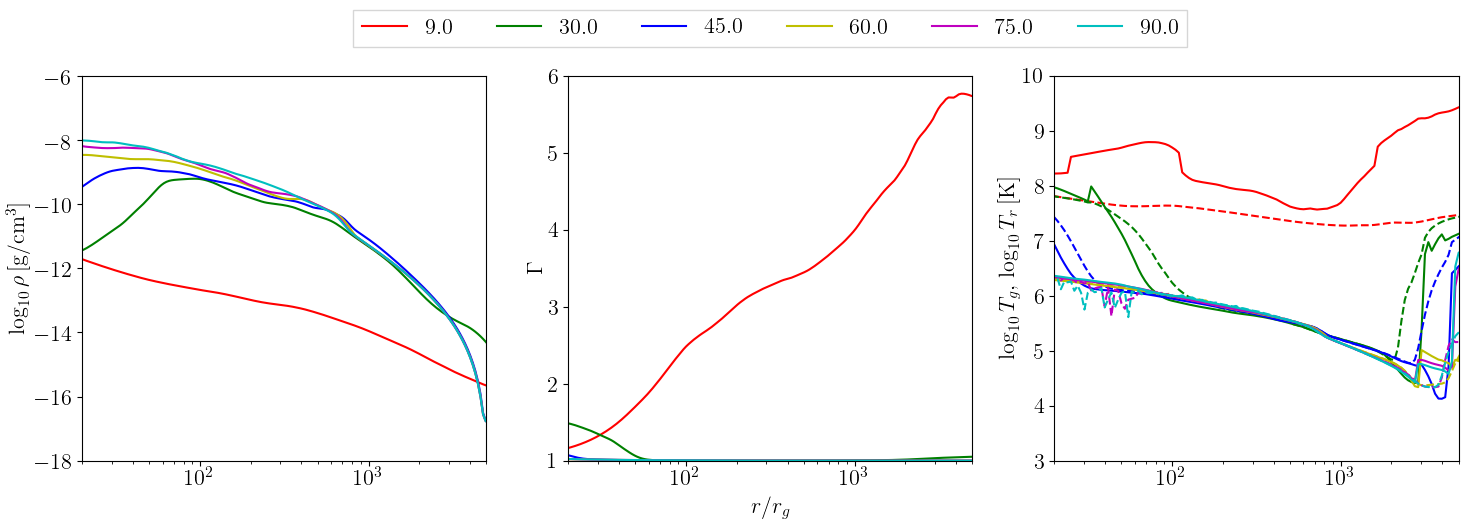
In Figure 5 we show radial profiles of density, Lorentz factor, gas temperature and radiation temperature, corresponding to various polar angles . The gas density in the jet () is roughly four orders of magnitude less than that in the disk. The jet is optically thin and the gas here can be accelerated by radiation leaking towards the pole from the funnel wall. However, despite the low gas density, the Lorentz factor only goes up to at large radii. The velocity is much smaller in the wind.
The third panel in Figure 5 and the right panel in Figure 6 indicate that the gas and radiation temperature (as obtained after post-processing with HEROIC) track each other closely in the disk and wind but deviate significantly in the jet. In addition, the radiation temperature at the photosphere (see Figure 6) is noticeably hotter in the wind and jet in comparison to the torus. This is the case for three reasons: (i) viscous heating is largest in the jet, wind, and funnel walls and the gas temperature in these regions is elevated compared to the torus, where there is negligible heating, (ii) the wind is optically thick and the gas and radiation have come into equilibrium, (iii) the jet is optically thin, so the radiation and gas remain out of equilibrium; however, Compton scattering of soft photons still elevates the radiation temperature here significantly. Radiation in the jet is dominated by flux coming out of the cooler funnel wall. Given the low optical depth of the jet, this radiation is only mildly Comptonized by the hotter jet gas, hence . If we focus on the outer photosphere of the torus (), the emerging radiation at and higher has a temperature K, the radiation in the wind and jet () has a temperature of K. As we discuss later, there are signatures of emission from all of these regions in the spectra we calculate from this model.
The three upper panels in Figure 6 show the large scale properties of model s00. The location of the electron scattering photosphere is indicated by the yellow contours. The radiation temperature in the last panel confirms the discussion in the previous paragraph. For a wide range of angles surrounding the equator, K (purple color), so the escaping radiation here will be in the optical/UV band. For a range of angles closer to the pole, the temperature is around K (light blue). This region corresponds to the slow-moving wind. Finally, close to the pole, the temperature goes up to K. This is the jet. How much radiation each of these three zones contributes to the observed spectrum depends on the gas density and temperature (at the photosphere) and also the viewing angle, as we will discuss later.
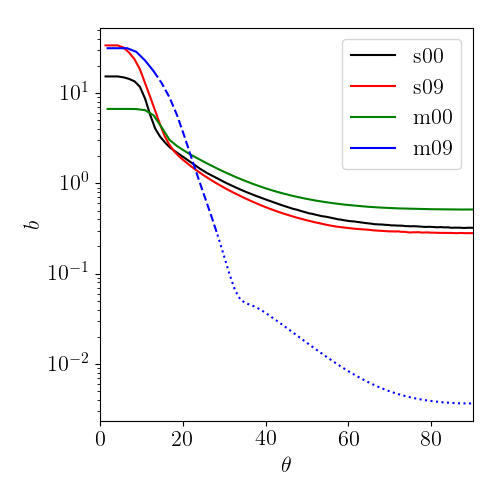
We find it useful to define the beaming factor , which is the ratio of the isotropic equivalent luminosity along a given direction to the total radiation luminosity, . We compute this quantity at (somewhat outside the photosphere) and show the results in Figure 7. Leaving aside model m09, which we discuss later, we see that the other three models, s00, s09 and m00, all have similar behavior. The beaming factor is largest at the poles and drops by an order of magnitude at the equator. Most of the radiation escapes within , which agrees fairly well with our definition of the jet boundary. The steady decline of between and is due to the wind, which allows some radiation to escape. Beyond this angle, we have the torus, and here the beaming is effectively independent of angle.
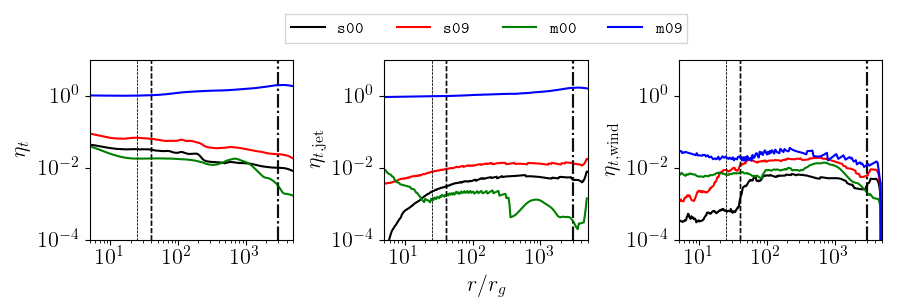
Finally we discuss various efficiencies. The radiative efficiency , computed just outside the photosphere, is % for model s00, % for model s09, and % for model m00. All three models are clearly radiatively inefficient, with efficiencies a tenth or less of the standard Novikov-Thorne efficiency of a thin accretion disk (5.7% for and 15.6% for ).
The total efficiency , which is computed from the total luminosity including all forms of energy, is a different story. We show this quantity in Figure 8 for the entire flow (left panel) as well as for the jet (middle panel) and wind (right panel) separately. Given that the wind/jet are converged out to much larger radii than the disk, for each simulation we compute a representative at the extent of the converged region (see Figure 1) while and are computed outside of the photosphere at . Thus, for the purposes of this discussion, is a useful diagnostic for how efficiently rest mass energy is converted to other forms of energy while the ratio describes how much energy escapes in the jet versus the wind. For model s00 we find %, for s09 , and for model m00 %. By this measure all three flows are reasonably efficient, with total efficiencies of around half the standard thin disk efficiency. The radiative efficiency in each model is nearly 10 times smaller than the total efficiency. This is because, in super-Eddington accretion flows, the outflowing energy is primarily in the form of gravitational, binding, and magnetic energy (see Sa̧dowski et al. 2016c). This is particularly true of the disk, where radiation is trapped because of the large optical depth and photons are advected in with the accreting gas. Considering the efficiencies in the jet and wind, we find for model s00 and for model s09. These two models have nearly equal amounts of energy escaping in the jet and the wind. By contrast, model m00 is evidently a wind dominated system, since .
The various efficiencies discussed here are listed in Table 1.
4.4.2 Model with a Relativistic Jet: Jetted TDE
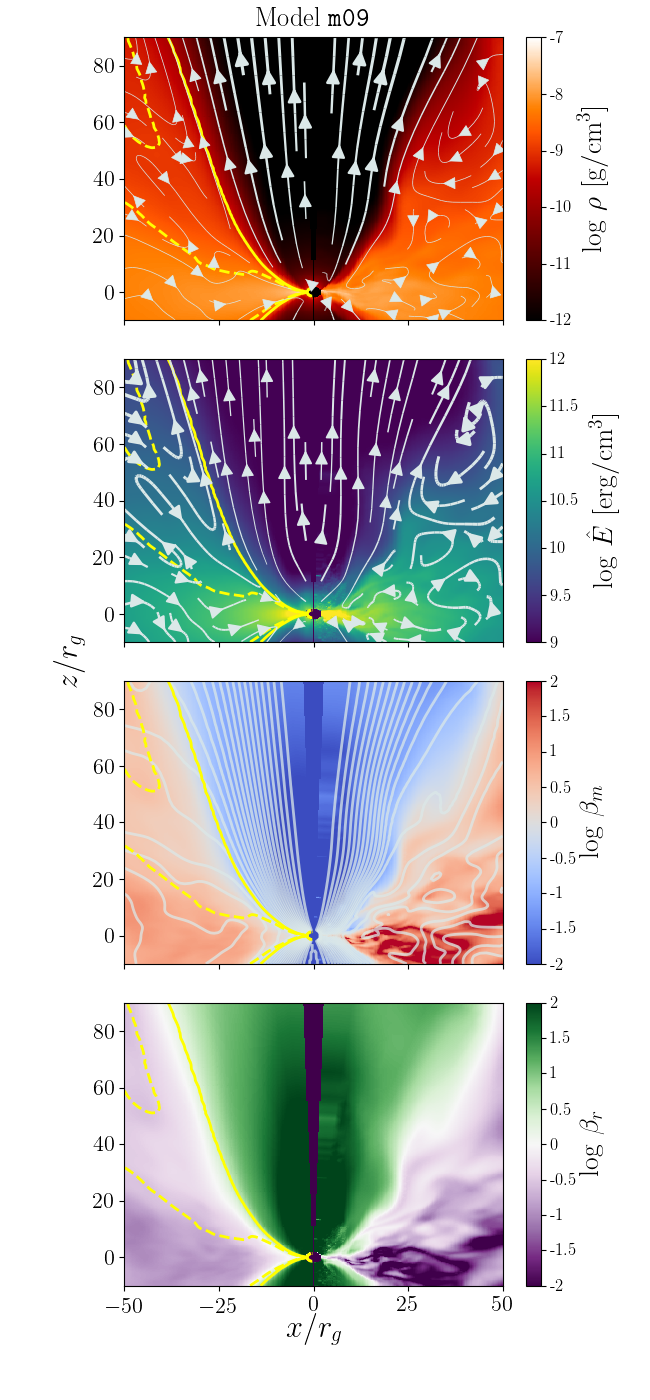
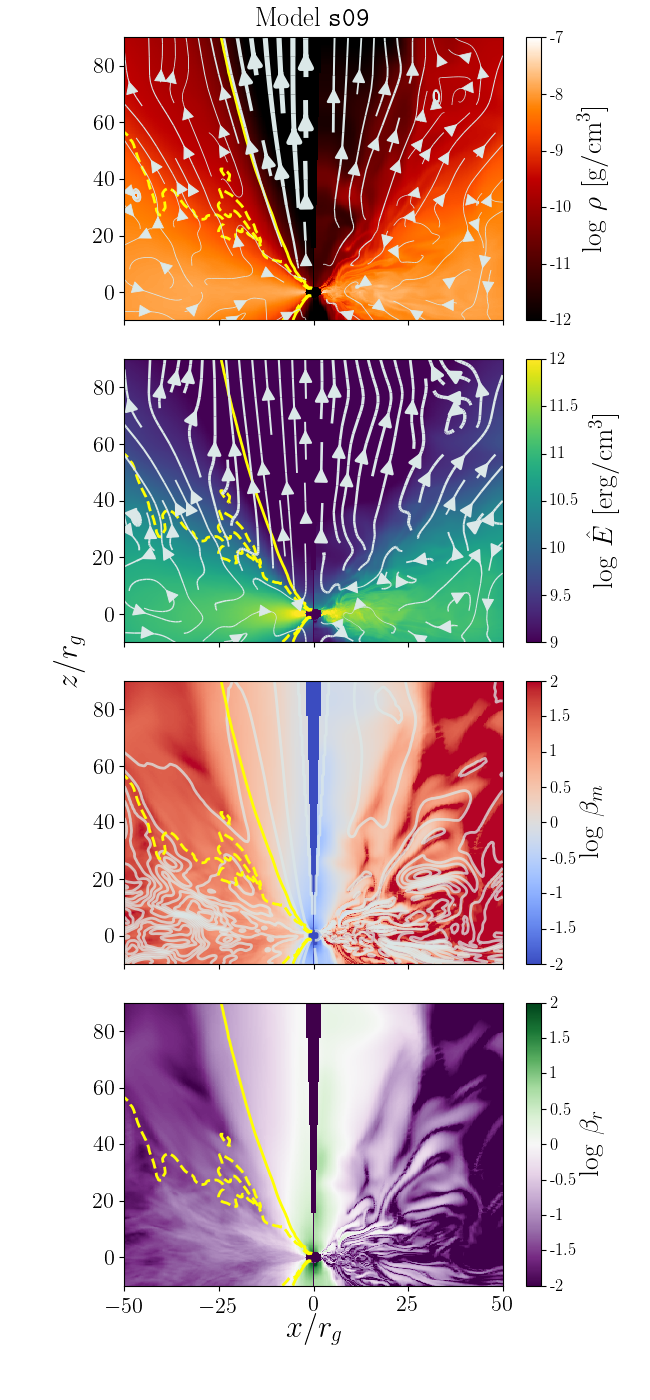
The simulation m09 behaves very differently from the other three models. Notably, it shows strong jet-related features. For this reason, we consider it our fiducial model of a jetted TDE. In Figure 9 we show some properties of this model. The left half of each panel shows the time and azimuth averaged properties taken over , while the right half shows the state of the simulation at .
The four panels correspond to the same quantities as in the case of the non-jetted model s00 discussed earlier (Figure 3). The gas density (top panel) and radiation energy density (second panel) are both slightly lower in the case of m09, despite the larger . The magnetic pressure ratio (third panel) clearly shows that the funnel region is dominated by magnetic pressure. This is natural since this model is in the MAD state and is much more magnetized than model s00. Similarly, the bottom panel shows that radiation pressure is negligible in the funnel compared to the other pressures (notably magnetic).
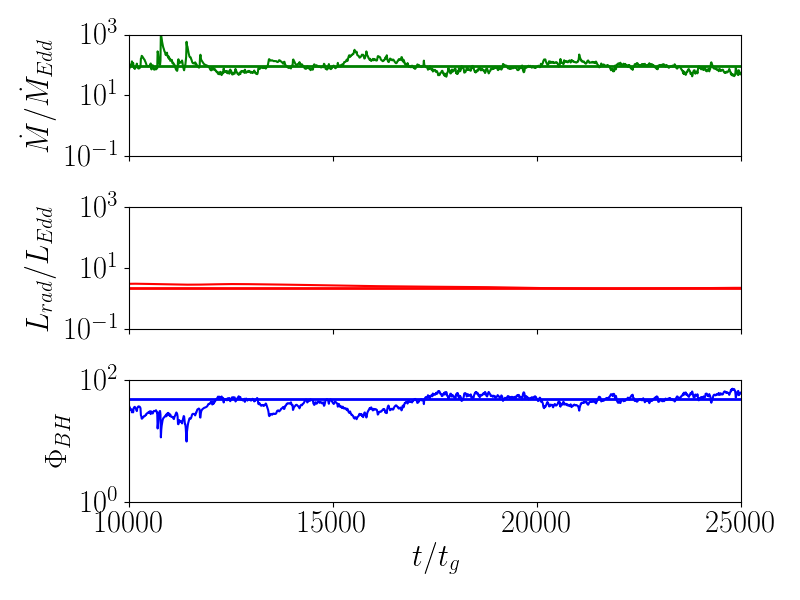
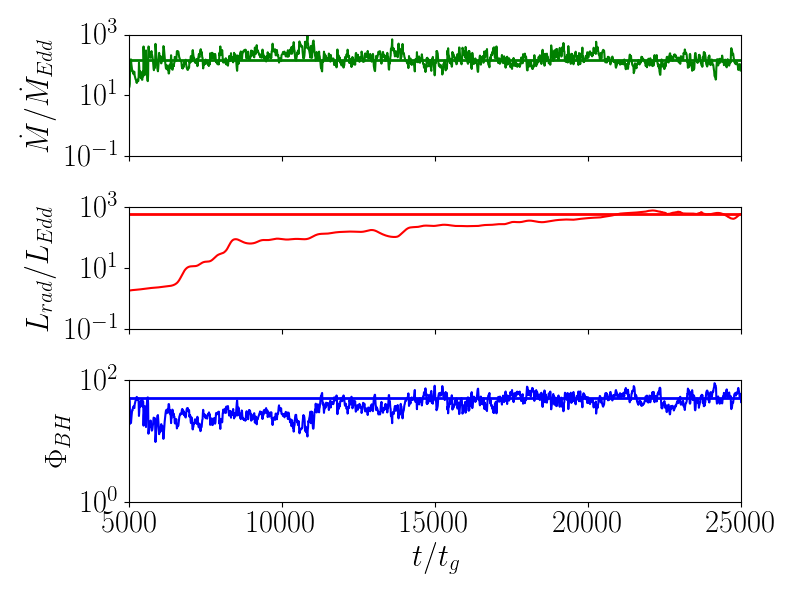
Figure 10 shows the same quantities as Figure 4, but now for model m09. The average accretion rate over the last of the simulation is roughly times the Eddington rate. This model is initialized with a single large scale dipolar loop, which causes significant accumulation of magnetic field around the BH with a single polarity. The accretion flow thus becomes MAD already around , and remains MAD throughout the rest of the simulation ().
The radiative luminosity as measured at is shown in the middle panel of Figure 10. The luminosity rapidly rises to early on, this rise coinciding with the ultra-relativistic jet head crossing the radius where we compute the luminosity. The luminosity then continues to increase slowly until it finally saturates at at .
Note the huge difference in radiative luminosity between the jetted TDE model m09 we are discussing here and the non-jetted TDE models s00, s09, m00 discussed in the previous subsection. The non-jetted models all had luminosities of only a few Eddington, despite having highly super-Eddington mass accretion rates. That is consistent with theoretical expectations for super-Eddington accretion, e.g., the slim disk model (Abramowicz et al., 1988), and implies very radiatively inefficient accretion. In contrast, not only is the jetted TDE model m09 radiatively efficient, it is in fact super-efficient in the sense that an accretion rate of gives a luminosity of not just , but ; the radiative efficiency is thus a factor of 4 larger than the efficiency of a thin accretion disk around a BH of the same spin.
Figure 11 is similar to Figure 5, but now refers to model m09. The central region of the jet () is accelerated to a fairly large Lorentz factor , while at larger angles from the pole the Lorentz factor drops off rapidly. Motivated by the observation that the late-time radio emission from J1644 is likely due to a two component jet (Berger et al., 2012; Wang et al., 2014; Mimica et al., 2015; Liu et al., 2015), we define two jet regions. We call the higher Lorentz factor zone the jet ‘core’ and the rest of the jet the ‘sheath’, defining the boundary between the two to be located at (following Mimica et al. 2015). With this definition, the boundary between the core and the sheath is at , while the boundary between the sheath and the wind (defined by ) is at .
The lower panels in Figure 6 show the large scale properties of model m09. Outside of the jet and wind, the electron scattering photosphere is at , similar to model s00. However, the jet and wind regions look noticeably different. For angles close to the axis, i.e., the jet region, the gas in m09 is largely optically thin and the electron scattering photosphere penetrates all the way down to the base of the jet (r ). In contrast, the gas in s00 becomes optically thick near ; however, we note that the photosphere depth of s09 in the jet is at (see 25), which is quite similar to that of m09. At larger angles, the photosphere in model m09 extends to radii well outside the torus. This model ejects a lot of gas in the wind which forms an optically thick region surrounding the jet. There is no comparable feature in model s00.
The jet in m09 has a radiative flux that is roughly 2-3 orders of magnitude greater than the flux in s00. Also, the jet covers a much wider angle. Whereas s00 showed hardly any radiation energy density outside of the optically thick regions, m09 carries a significant amount of radiation energy density throughout the jet, signifying that photons escape more easily through the funnel and that synchrotron and inverse Compton processes are more effective at transferring energy from the gas to radiation. The radiation temperature in m09 also shows significant differences. While the radiation properties of the torus are similar ( K), the wind is characterized by a range of temperatures, K; the jet is slightly hotter than the hottest region of the wind, K. Edge-on observers are thus expected to see thermal emission in the optical/UV from the torus with a temperature of K, and X-rays from the wind photosphere at temperatures up to K. For face-on observers, since the funnel is optically thin to electron scattering, high energy photons from the entire length of the jet (down to ) will be seen, as well as Compton-upscattered photons in the hot gas. This emission will be strongly beamed because of the relativistic motion of the jet, and the jet will dominate the observed radiation. A face-on observer will also receive radiation from the wind and the torus, but there is little beaming so their contribution will be a sub-dominant component of the observed radiation. The emission properties are discussed in more detail later.
The much stronger beaming in model m09 relative to the other three models is also evident in Figure 7. Note that the beaming factor in the jet sheath, jet core, and disk/wind region of the simulation are plotted as a solid, dashed, and dotted line for m09. The beaming factor drops by two orders of magnitude between the pole and the jet sheath boundary (marked by the extent of the dashed line) and more than three orders of magnitude between the poles and the equator. Thus, in this model, most of the radiation escapes within degrees of the axis, which coincides with our definition of the jet boundary.
We discuss next various efficiencies in model m09. The radiative efficiency is %, i.e., about 4 times the efficiency of an equivalent thin accretion disk, as already discussed. Figure 8 shows the other efficiencies. The total efficiency (all energy forms) is %, which is only modestly larger than the radiative efficiency. In contrast to the non-jetted models, where most of the energy emerges in forms other than radiation, the energy output of the jetted TDE model is dominated by radiation. In addition, the jet efficiency is nearly the same as the total efficiency (% at ). Thus, nearly all the luminosity emerges in the jet.
All of these features are the result of the fact that, among the four models considered in this paper, model m09 uniquely combines both a spinning black hole and MAD-level magnetic field strength. This combination is especially conducive to energy extraction from black hole spin via the Blandford-Znajek mechanism. As a result, in model m09, the total efficiency is unusually large, and moreover almost all the energy comes out in the jet. Furthermore, much of the jet energy gets converted into gas thermal energy and comes out in the form of radiation via inverse-Compton scattering. The low optical depth of the funnel region enables this radiation to escape. The other three models have negligible jet luminosity, so the funnel gas in those models is heated less and radiation from the funnel is less important.
The wind efficiency in model m09 is negligibly small compared to the jet efficiency: . Note again the large difference between model m09 and the three other non-jetted TDE models, which have (in two models) and (in the third model).
It is worth highlighting that, among the four simulations we have described in this paper, only one is jet-dominated. What is unique about this model is that it is both MAD and has a rapidly spinning BH. Either of these features alone is not enough, e.g., the MAD model m00 and the rapidly spinning BH model s09 are essentially non-jetted. Only when both features are present, as in m09, does a powerful jet emerge.
Another notable point is that the total efficiency of model m09 is 105% or even slightly larger. This is reminiscent of the 140% efficiency obtained by Tchekhovskoy et al. (2011) in their GRMHD simulation of a MAD rapidly spinning BH. Such efficiencies cannot be generated purely by accretion. Some of the luminosity must be emerging directly from the BH spin energy. There is thus a strong case for the Blandford-Znajek mechanism, or something akin to it, operating in model m09.
The many unique features of the jetted TDE model m09 are consistent with the suggestion of Tchekhovskoy et al. (2014) that jetted TDEs such as J1644 must be MAD systems with rapidly spinning BHs. Those authors proposed their model on the basis of non-radiative GRMHD simulations (specifically Tchekhovskoy et al. 2011). Here we show via a GRRMHD simulation with full treatment of radiation that their proposal is indeed correct.
5 Spectra and Comparisons with Observations
5.1 Radiation post-processing
We post-process the KORAL simulation data using the radiative transfer code HEROIC described in §3.2, and compute model spectra of the simulated systems. For all models, we use simulation data time-averaged over the final . In the case of the 3D models, m00 and m09, we also azimuthally-average the data. All models show quasi-steady behavior during the selected time interval. Also, their jets and winds have emerged outside the photosphere, so these components are able to contribute to the radiation seen by distant observers.
5.2 Model Spectra
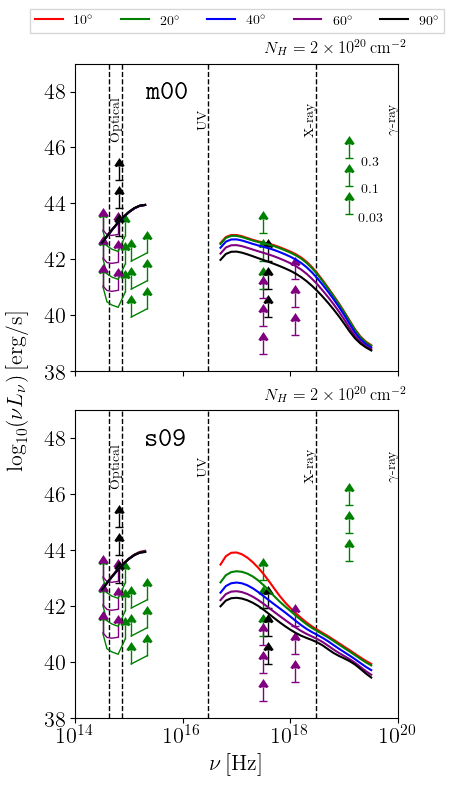
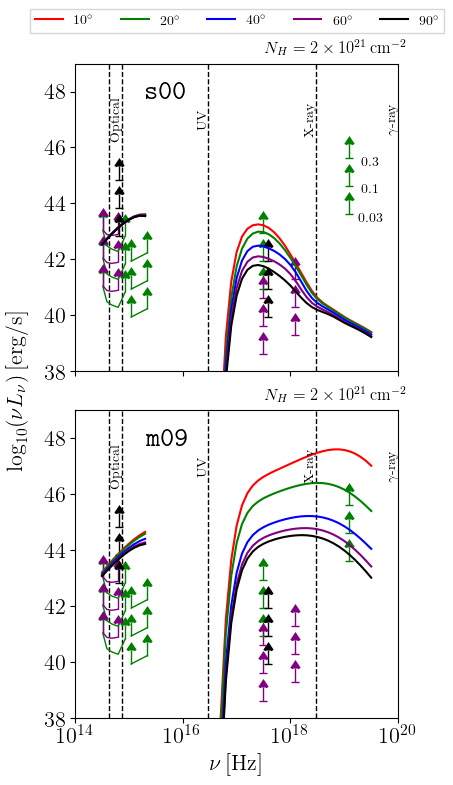
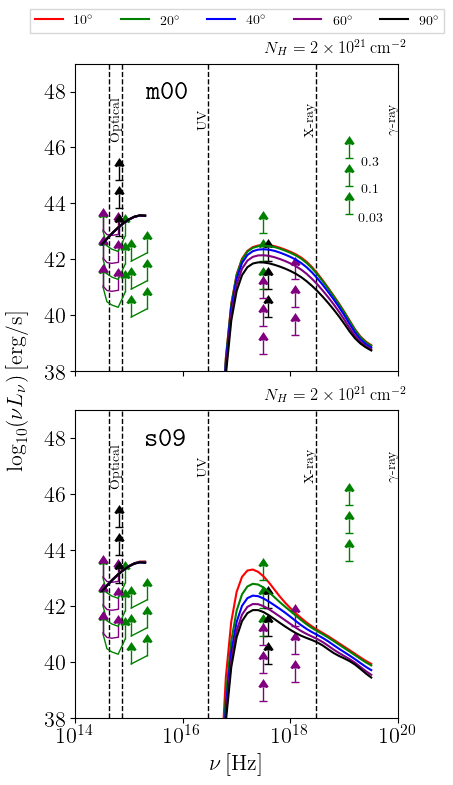
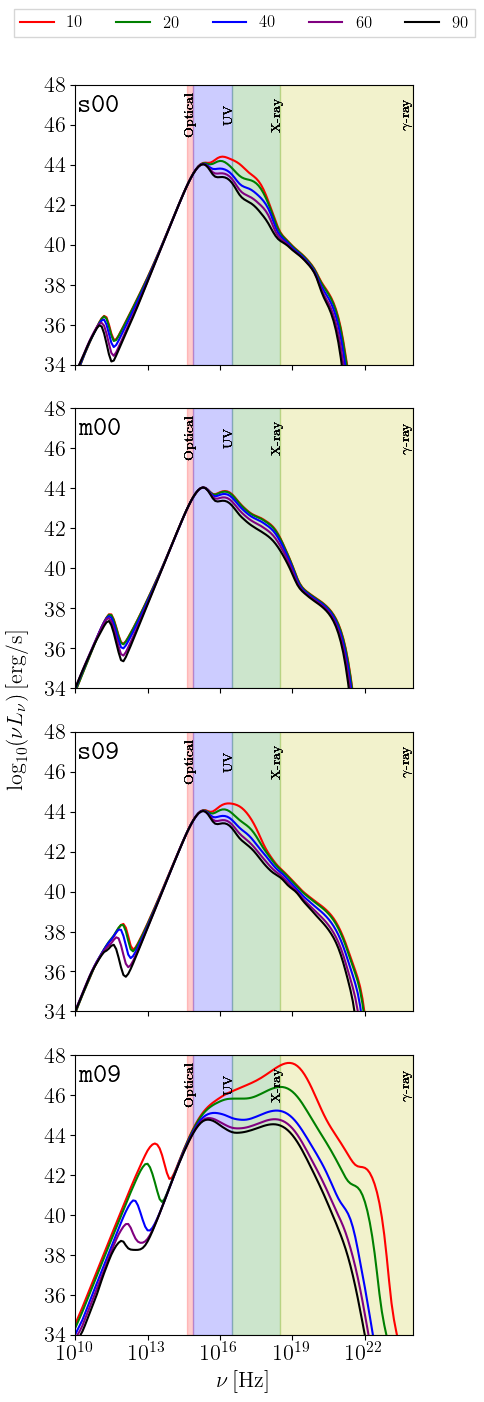
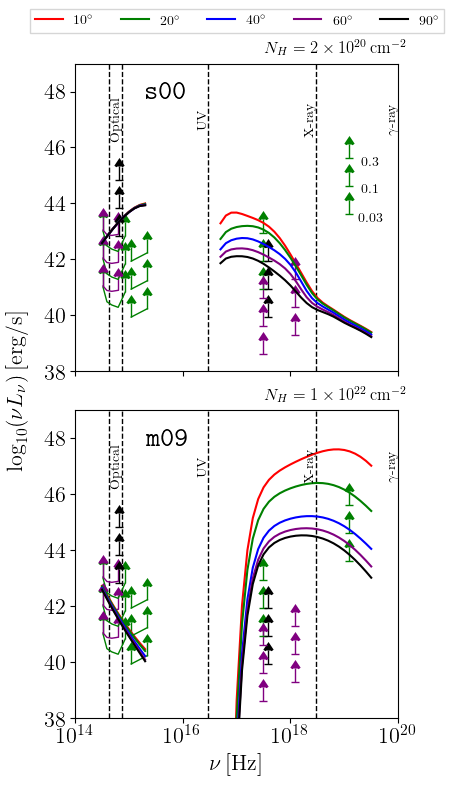
In Figure 12 we show the spectra of the four models as seen by distant observers at different viewing angles. Spectra computed for the two non-jetted SANE models s00 and s09 are qualitatively quite similar, and can be decomposed into four peaks, one in the infrared (IR), one in near-UV, one in far-UV/soft X-rays and one in hard X-rays. The first peak (near-UV) is from the K photosphere of the torus, the second (far-UV) is from hotter gas ( K)in the funnel wall/wind, and the third peak (hard X-rays) is from the hottest gas, which is in the jet. A tail of very high energy gamma-ray emission comes from Compton-upscattered radiation by hot gas, but this component is extremely weak. Thermal synchrotron emission from the jet produces the low luminosity ( ) peak in the IR.
In models s00 and s09, the near-UV peak is essentially independent of viewing angle, as expected for a quasi-spherical optically-thick photosphere. This component has approximately an Eddington luminosity ( for a BH), as we would expect for a radiation-dominated system. The other two components show viewing angle dependence in the case of models s00, s09. Observers looking down the radiation driven outflow () see strong emission from both the wind and the jet, the latter mildly enhanced by relativistic boosting. The spectra at these angles peak in far-UV/soft-X-rays, showing that they are dominated by the wind/jet. With increasing viewing angle, the contribution of the wind emission declines, and that of the jet emission declines even more strongly. At higher angles of inclination, the jet and the funnel wall become obscured by the torus material and the observed radiation in soft and hard X-rays is primarily from the part of the wind that pokes out beyond the torus photosphere. The bolometric luminosity for a viewing angle is , most of it coming from the torus.
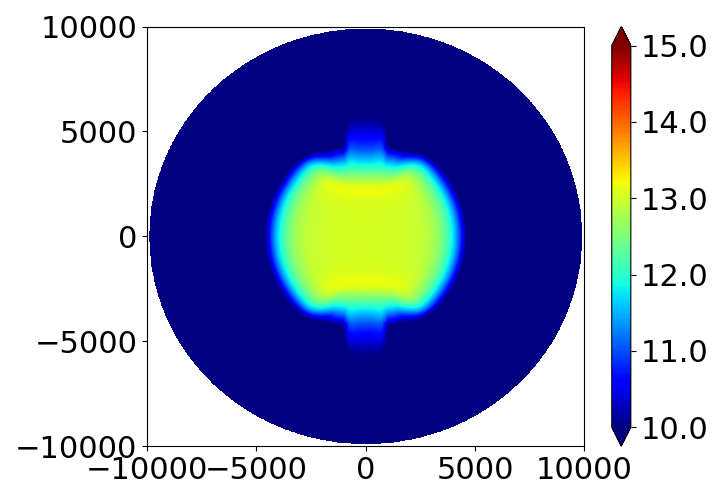
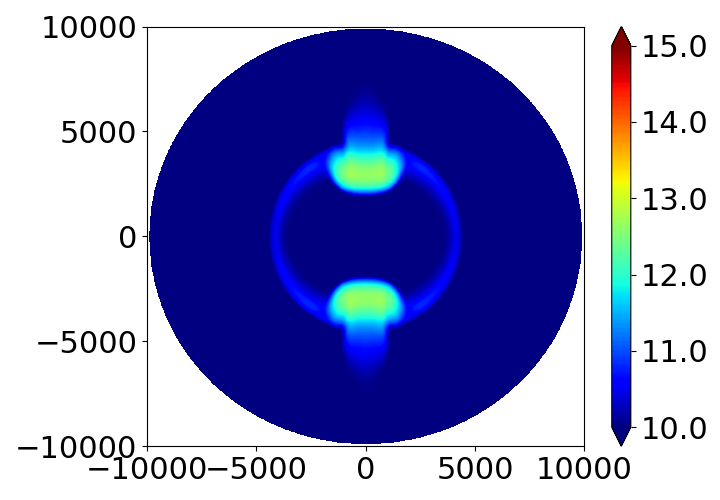
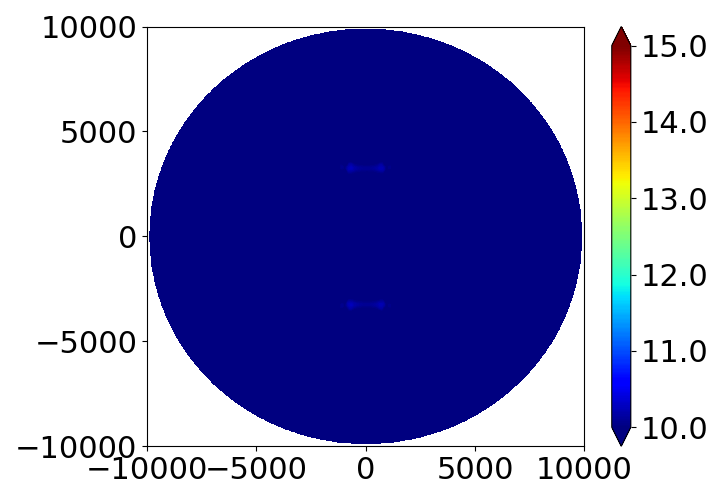
In Figure 13 we illustrate the above points via images of the fiducial model s00 for an observer at viewing angle . The optical/UV emission (left panel) is clearly dominated by the large scale torus with a small contribution from the outflow. In the X-ray band (middle panel), the torus contributes virtually nothing, and the inner regions of the jet and wind (radii below ) are obscured by the torus. The dominant source of X-rays is emission from the base of the wind where it emerges outside the torus photosphere. In the -ray band (right panel), there is virtually no emission since none of the visible regions of the system are hot enough. Model s09 is similar, but with slightly more X-ray emission in the outflow. The key point of this discussion is that non-jetted TDEs produce X-rays that are visible in all directions, but this radiation does not come from near the BH or from a corona surrounding the inner disk. Rather, the X-rays are from hot material in the outflow and come from regions that are thousands of from the BH. It is only out here that the X-rays are finally able to escape without being absorbed by the torus.
Our third non-jetted TDE model m00 is similar in many respects to the two models discussed above, except that in this case even the funnel is optically thick (see the shape of the photosphere in Figure 25). As a result, the emission is nearly isotropic in all bands, and there is very little boost of the jet and wind emission for on-axis observers. Optical/UV radiation from the torus dominates at all angles, and the isotropic equivalent luminosity varies only a small amount with angle, going from at the poles to at the equator.
The model in Dai et al. (2018) is similar to m00 in some respects, despite the fact that their accretion rate is lower by a factor of a few and their BH spin is much larger ( vs in m00). They obtain a bolometric luminosity of when viewed nearly face-on and when viewed edge-on, just like m00. In addition, they too predict the presence of soft X-ray emission even for an edge-on observer. Note that they account for the absorption of soft X-rays by helium ions, which we do not model in this work (although the effect is roughly accounted for through our frequency-dependent opacity model).
One interesting point is that the BH spin of 0.8 in Dai et al. (2018) is much closer to what we used in model m09 () than to model m00 (). Nevertheless, their model is more similar to m00 in the sense that they do not find a relativistic jet just as in m00, whereas our model m09 has a powerful and highly relativistic jet. One caution is that Dai et al. (2018) employed very low numerical resolution, viz., cells in covering the same range of radius as in our work, 64 cells in from to , and 32 cells in for the full 0 to . Our models m00 and m09 have much larger resolution, cells in , 192 cells in and 32 cells in for the range 0 to . It is possible that their low resolution prevented the formation of a strong jet. It would be of interest to carry out high resolution simulations for other intermediate spin values.
The spectrum of the jetted TDE model m09 is very different from the spectra of the other models, as is evident from Figure 12. This model emits strongly in high energy bands (X-ray and -ray). The hard radiation is strongly beamed along the axis, and the apparent luminosity for on-axis observers is . The luminosity falls off for larger viewing angles, but even at , the luminosity is still . On the other hand, the thermal emission from the torus in the NUV is largely independent of the viewing angle. It is sub-dominant in most direction, and becomes comparable to the hard emission only for edge-on observers. Note that there are no non-thermal electrons in the models studied in this paper. Even the hard radiation is produced by thermal gas. The large amount of X-ray and gamma-ray emission from m09 is because (i) the gas in the jet is very hot, so the intrinsic emission is hard, and (ii) any soft radiation present tends to be Compton-upscattered by the same hot electrons. The soft radiation for Comptonization is provided from the funnel wall. Thermal synchrotron emission produces a far infrared peak, as seen in the bottom panel of Figure 13.
In Figure 14 we show images of model m09 for an observer at viewing angle. The optical/UV emission (left panel) is partly from the torus and partly from the outer boundary of the jet, the two contributions being roughly equal. In the X-ray band (middle panel), the image is completely dominated by the jet. Notice the dramatic change in intensity and width of the X-ray emitting region when compared to the equivalent panel in Figure 13. In the -ray band, most of the photons again appear to originate from the region of the jet that is outside the torus photosphere. Again, there is an enormous difference between the jetted m09 model in Figure 14 and the non-jetted s00 model in Figure 12.
5.3 Detection Limits
In this subsection we compare our models with detection limits for various state of the art telescopes. Namely, we include limits for the Sloan Digital Sky Survey (SDSS, York et al. 2000), Pan-STARRS1 (Kaiser et al., 2002), ASAS-SN (Shappee et al., 2014), GALEX Deep Imaging Survey (DIS, Martin et al. 2005), Swift X-ray Telescope (XRT, Burrows et al. 2005), Chandra Advanced CCD Imaging Spectrometer (ACIS, Burke et al. 1997), XMM-Newton (Jansen et al., 2001), and Swift Burst Alert Telescope (BAT, Barthelmy et al. 2005). Motivated by the distances of many of the previously discovered TDEs (Komossa, 2015; Auchettl et al., 2017), we consider sources in the redshift range . We compute detection limits for each instrument in the relevant band using the typical exposure time. The assumed exposure times are 55 s (SDSS), 114-240 s (Pan-STARRS1), 30 ks (GALEX DIS), s (Swift XRT, Chandra, XMM-Newton), and s (Swift BAT). For ASAS-SN, we use a band limiting magnitude of mag.
In Figure 15, we compare extincted band luminosities computed from the model spectra of s00 and m09 with detection limits for a point source. Since the hydrogen column density in jetted TDEs has been observed to be significantly enhanced in comparison to the average non-jetted TDE (e.g. see Auchettl et al. 2017), we consider detection limits using a different hydrogen column density () for the two classes. Based on the reported column densities, we assume for the three non-jetted TDE models, s00, s09, m00, and for the jetted TDE model m09. We describe the method we use to compute extinction in Appendix B. We also examine detection limits for m00 and s09 in detail, as well as for all four models for the case where the column has an intermediate value, , and show the results in Figures 26-28.
5.3.1 Non-jetted TDEs
For model s00, the optical/UV band luminosities are essentially the same for all viewing angles since the quasi-spherical torus is the source of this emission. As the upper panel in Figure 15 indicates, for both SDSS and Pan-STARRS1, the optical emission in s00 is bright enough to be detectable out to . In the case of ASAS-SN, only for will s00 be detectable. In the UV we predict that, for the assumed low hydrogen column density of , the NUV emission is detectable by GALEX well beyond . For Swift XRT, the soft X-ray emission is detectable for all viewing angles at , but only for more pole-on viewing angles at . Even in the latter case, follow-up observations with more sensitive instruments (e.g. Chandra or XMM-Newton) should pick up the soft X-ray emission for any viewing angle based on our model spectra. The -ray emission in s00 is extremely weak and would not be detected as a GRB by Swift BAT. The results are identical for model s09 (see Figure 26).
In the case of model m00, since the outflow is largely optically thick, the spectrum is nearly identical at all viewing angles (see Figure 26). In fact, the spectrum resembles that of s00 and s09 at the equatorial plane. As such, m00 meets the same detection limits as discussed above, except that the X-ray band luminosity is much lower for pole-on viewing angles.
For completeness, we also considered the case when the column density is an order of magnitude larger: ); however, our conclusions regarding the detection limits do not change much, since the extinction is less than one magnitude in each band (see Figures 27 and 28).
It is worth noting that the upper limit on the distance out to which the non-jetted models, s00, s09, and m00, can be detected in the band (with the assumed low column density) match well the redshifts of previous ASAS-SN detections of TDEs with a BH mass . ASASSN-14ae (Holoien et al., 2014), ASASSN-14li (Holoien et al., 2016a), and ASASSN-15oi (Holoien et al., 2016b) are all quite nearby TDEs with redshifts between . Indeed, the analysis of each of these objects suggests the optical/UV emission originates from a thermal source of K, much like in our models. We do not consider ASASSN-15lh (Dong et al., 2016; Leloudas et al., 2016; Godoy-Rivera et al., 2017) in this comparison as the BH mass is too large for the peak accretion rate to be super-Eddington.
The detection limits described above are considered only for the emission from the accretion flow. Based on this analysis, we do not predict that viewing angle dependence alone can lead to a non-detection of either optical/UV or X-ray emission at peak accretion for a BH. The previously discovered non-jetted TDEs have all had relatively small column densities (Auchettl et al., 2017), so it is unlikely that extinction is enough to explain the non-detection of optical/UV TDEs in the X-ray, though it is possible that reprocessing of emission by debris at larger radii could lead to significant absorption in the X-ray (Guillochon et al., 2014).
Roth et al. (2016) find that TDE emission in the optical through X-ray is sensitive to the mass of the envelope of absorbing material (e.g. the large scale torus in our model) and the luminosity of the source. If the bolometric luminosity becomes low enough, they predict the formation of a helium recombination front which can completely absorb the X-ray photons. While this model provides some intuition for why some TDEs show no X-rays, the geometry of our models are quite different. They consider a spherical symmetry whereas our models (save m00) have an optically thin funnel of low density gas that emits soft X-rays that can be detected even by an edge-on observer. In addition, the model presented by Dai et al. (2018) shows that, even with ions included in the radiative transfer, the hot wind and outflow will produce luminous, super-Eddington X-ray emission that will be detected by an edge-on observer. It is important to note that Dai et al. (2018) and our work only explore the case of a near solar mass star being disrupted. For higher mass stars (and thus more massive envelopes), the additional absorbers in the torus could potentially absorb out the soft X-rays even at small angles (i.e. ) where much of the X-ray emission is escaping in model s00. This could explain the observation of veiled TDEs in the context of a super-Eddington accretion disk.
5.3.2 Jetted TDEs
We discuss the spectrum of our jetted TDE model m09 assuming a large column density, , as has been seen in the jetted TDEs discovered so far. The emission in the optical/UV in this model (lower panel in Figure 15) is somewhat enhanced relative to the non-jetted TDE models because, apart from radiation from the torus, there is also some optical/UV radiation from the outflow. As a result, despite the larger column, this model is detectable in the optical and NUV up to . The FUV is, however, undetectable. The jet emission is very luminous, so the X-ray emission is detectable by all instruments at all viewing angles, even for .
We also examine the case of a lower column density, as in J2058 and J1112 (see Figure 27). Extinction of high energy photons is negligible, so we find the same detection limits in the X-ray and -ray bands. Predictably, the extinction of optical and UV photons is much less and our models indicate that an object like J2058 (or J1112) should appear in the optical and NUV for the instruments considered.
For both cases, the -ray emission from model m09 is detectable by Swift BAT up to depending on the orientation of the jet. Interestingly, our analysis suggests that jetted TDEs at redshifts larger than will only be detected for nearly face-on observers (). All three of the proposed jetted TDEs have been discovered at quite large distances, (Bloom et al., 2011; Burrows et al., 2011; Zauderer et al., 2011; Cenko et al., 2012; Brown et al., 2015). J1644 is the closest jetted TDE at and was likely observed face-on given the strongly beamed emission. Given the rather large distance of J1112 () and J2058 () our models suggest near face-on observations of these events as well.
5.4 Comparison with observational properties of TDEs
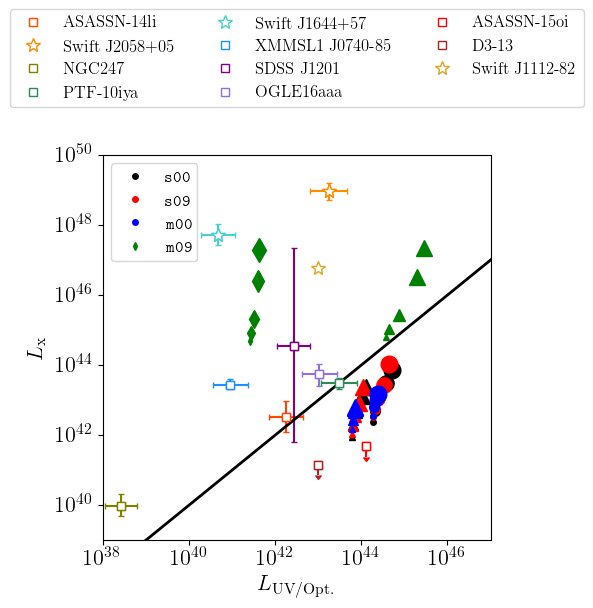
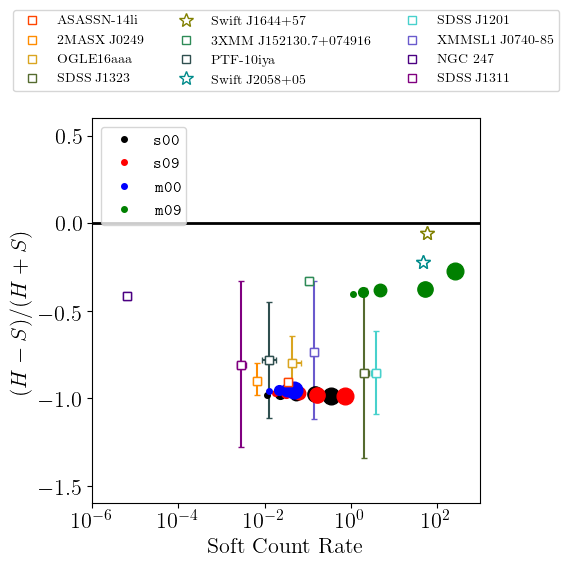
In the thorough analysis of the catalog of TDEs carried out by Auchettl et al. (2017), the observational characteristics of the different classes of TDEs are examined in great detail. Of particular interest to us is the separation of TDE emission properties at peak. They find that at peak (a) jetted TDEs have a relatively hard X-ray spectrum, producing almost equal counts in the soft and hard X-ray bands, while non-jetted TDEs tend to be softer, (b) non-jetted TDEs radiate nearly equal amounts of energy in the X-ray band as they do in the UV/Optical bands, while the jetted TDEs emit much more energy in X-rays, with an X-ray band luminosity up to nearly 5-6 orders of magnitude higher than the UV/Optical, and (c) jetted and non-jetted TDEs self-separate when comparing the hard (2-10 keV) and soft (0.3-2 keV) count rates. Here we use the same bands and definitions as in Auchettl et al. (2017) to compare the spectra of our simulation-based jetted and non-jetted models with observations.
In the computations, we assume that the source is located at redshift . In order to compute count rates, we assume 100% of the photons are detected and use the effective area of the Swift XRT.
5.4.1 Optical/UV and X-ray Emission
In Figure 16, we compare the X-ray luminosity (0.3-10 keV emission) and the UV/Optical luminosity (0.002-0.1 keV emission) for each model. We show observational data (Gezari et al., 2009; Cenko et al., 2012; Holoien et al., 2016b; Auchettl et al., 2017) for several TDEs at peak as open squares (non-jetted TDEs) and open stars (jetted TDEs). Note that for D3-13 and ASAS-SN 15oi upper limits of the peak X-ray luminosity are provided as the peak X-ray emission in both events is comparable to the host galaxy’s emission in a quiescent state. For comparison, we show our model results for non-jetted TDEs for (filled circles) and (filled triangles), and for jetted TDEs for (triangles) and (diamonds). The sizes of the points decrease as the viewing angle increases, i.e., the largest symbols correspond to viewing down the jet axis and the smallest symbols to viewing edge-on.
For , we find that the non-jetted TDE models, s00, s09, m00, have X-ray luminosities roughly consistent with observations (compare open squares and filled circles in Figure 16). However, the models predict more optical/UV luminosity than observed in TDEs that have well constrained X-ray emission. The discrepancy is more than an order of magnitude, which is difficult to understand. A characteristic (and unavoidable) feature of our super-Eddington models is that they will emit thermal Optical/UV radiation with a luminosity of around Eddington, i.e., . This statement should be true for any viewing angle. Assuming the observed systems are super-Eddington accretors, two possible explanations are (i) the BH masses are much smaller than the mass used in our simulations, and (ii) the extinction columns are much larger than . Neither option is very likely. For instance, the estimated BH masses are, if at all, larger than for many systems. Also, the hydrogen column densities of non-jetted TDEs have thus far not been very large. Auchettl et al. (2017) report values generally around with most of the well constrained TDEs having . Given Auchettl et al. (2017) obtain the NUV/FUV component of the spectrum by fitting a decaying power law to the data, another possibility is that the reported luminosities underestimate the NUV/FUV emission. For instance, note that our model non-jetted TDE spectra (Figure 12) have a second peak in the FUV which has a significant luminosity at near face-on observing angles. It is important to note that FUV emission from TDEs has yet to be observed, and our models produce significant FUV emission from the outflow. It is also possible that the peak emission of certain TDEs was not picked up in transient surveys due to insufficient cadence.
In the case of the jetted TDE model m09, the model predictions shown in Figure 16 agree fairly well with the observations when we use a large column of . The agreement with J1644 is particularly good, provided we accept the general assumption that the source was observed at a small inclination angle. In the case of J1112 and J2058, we would obtain reasonable agreement with a slightly smaller , but the estimated is substantially smaller (). Another issue is that J2058 had an X-ray luminosity of , whereas model m09 barely reaches for a face-on observer. This is not a serious discrepancy because we have considered only a single fiducial model here. By changing the BH mass, BH spin or mass accretion rate, it ought to be possible to obtain the required luminosity.
5.4.2 X-ray Spectral Hardness
The hardness ratio HR is defined as , where is the count rate in the hard (2-10 keV) band and is the count rate in the soft (0.3-2 keV) band. In Figure 17, we plot HR as a function of the count rate in the soft band. We again include observational data for several confirmed TDEs at peak from (Auchettl et al., 2017) and compare them against predictions of our models. Note that we do not include extinction when computing the hardness ratio for our models, as the spectral hardness is likely uncorrelated with the column density (Auchettl et al., 2017). Both data and models are scaled for source redshift of 0.1. For the observational data, we only include those events that are classified as the disruption of a star by a SMBH.
The non-jetted models become harder as the viewing angle increases towards the equatorial plane and they populate HR values between -1 and -0.9. The non-jetted TDE data reasonably match the models with the exception of 3XMM J152130.7+074916 (3XMM hereafter) and NGC 247. Interestingly, model m09 has a slightly softer spectrum than the estimates from Auchettl et al. (2017) for the jetted TDEs J1644 and J2058. This is true even for a nearly face-on observer. Despite these minor caveats, the qualitative agreement is quite good in that there is a clear separation in spectral hardness between the jetted and non-jetted TDE model spectra.
3XMM and NGC 247 appear to be quite hard compared to the rest of the non-jetted TDEs, which is puzzling. Both 3XMM and NGC 247 are classified as likely TDEs in Auchettl et al. (2017), but they clearly stand out from most other TDEs in the literature. 3XMM is classified as a TDE partly because of its transient nature, but the BH mass inferred from the X-ray data is small compared to other TDEs () and it has not been well constrained to the center of the host galaxy (Lin et al., 2015). NGC 247 is both less luminous than the typical TDE and is significantly harder. Feng et al. (2015) note that the lack of data on NGC 247 for the 3 years prior to the transient event may imply that the transient actually appeared 1-3 years before being detected. This might imply that the accretion rate is not near the peak, and thus the system is possibly not comparable to our models.
5.5 Comparison with Swift J1644+57
5.5.1 Emission Properties
The observational characteristics of the jetted TDE J1644 are qualitatively similar to the spectra we compute for model m09. In particular, the model spectrum extends to the -ray band, consistent with the Swift-BAT detection. The emission in the GeV-TeV band is weak or absent, consistent with Fermi LAT and Veritas upper limits (Burrows et al., 2011). Aliu et al. (2011) and Aleksić et al. (2013) find that J1644 does not show -ray emission at frequencies greater than Hz, similar to our model. In fact, the spectrum of m09 cuts off quite abruptly at Hz. The peak luminosity observed by an on-axis observer is roughly for the model, within a factor of a few of the observed luminosity.
The evolution of J1644 has been followed in detail from radio to hard X-ray bands. The observations suggest that the jet is responsible for the X-ray emission while the interaction between the jet and surrounding medium leads to a shock which produces non-thermal synchrotron emission in the radio bands (Bloom et al., 2011; Metzger et al., 2012; Berger et al., 2012; Zauderer et al., 2013). Crumley et al. (2016) considered several radiation mechanisms and find that external IC (within the jet, as in m09) or magnetic reconnection in a Poynting dominated jet are favorable mechanisms. In addition, Auchettl et al. (2017) claim that the IR emission is well described by optically thin thermal synchrotron emission while emission in higher energy bands (up to the UV) can be described by thermal blackbody emission. Our model (m09) generally matches predictions made in the literature (see Figure 12 and discussion in Section 5.2) with the exception of the radio component which is usually interpreted in terms of a shock as the jet interacts with the external medium. Note that the earliest radio data come from days after the BAT detection while our simulations were run for a total time of only day. Also, our simulations do not extend to a large enough radius, nor do they attempt to model a realistic external medium, so the lack of emission from an external shock in the models is to be expected.
Tchekhovskoy et al. (2014) proposed that the large X-ray luminosity and highly variable light curve of J1644 could be explained simply by assuming that a strong magnetic flux was present in this system and powered the jet. They suggested that the BH and disk spin axes were likely misaligned when the accretion disk first formed, which would lead to an initially precessing jet that later becomes aligned with the BH spin. This would produce the observed variability and explain the late-time radio emission. We agree with Tchekhovskoy et al. (2014) that the J1644 transient was likely powered by a MAD TDE accretion disk around a rapidly spinning BH; however, we leave considerations of quasi-periodic oscillations in the X-ray emission to a future analysis.
5.5.2 Jet Structure
With the abundance of observational data on J1644, the jet structure has been examined in several studies. The transient exhibited strongly beamed radiation from an ultra-relativistic jet with (Metzger et al., 2012). Follow-up radio observations presented by Berger et al. (2012) showed that the radio emission re-brightened well after the initial burst of emission. This suggested that the model used by Metzger et al. (2012) of a single component blast-wave was insufficient and that there might be a slower moving component that shocks later than the faster moving jet core.
A two component model has been employed in several studies to model the jet structure and emission (Wang et al., 2014; Mimica et al., 2015; Liu et al., 2015). Each of these works suggests that the emission is best explained by a two component jet that is separated in velocity space.
The jet structure produced by model m09 is similar to the best fit models of Mimica et al. (2015). The central jet in our simulated model has a relatively large Lorentz factor (, compared with in Mimica et al. 2015), and it is surrounded by a slower moving, mildly relativistic outflow in a sheath ( in our model and in Mimica et al. 2015). We also find a similar opening angle for the sheath as the value they report: .
We compute the total kinetic energy contained in the core and sheath directly from the KORAL data on model m09, using cells over the radius range . This range of radii is well inside the jet head and spans the region where the jet is roughly conical. We integrate the kinetic energy over the core and sheath regions to obtain the net kinetic energy in the two regions, as described in equation (18) using the angular extent of each region described in Section 4.4.2. We compute the ratio of kinetic energy in the sheath versus the core as . Using our previously estimated core opening angle of , we find that the above ratio is only a bit greater than unity: . If we instead use the jet opening angle reported by Metzger et al. (2012), we find .
An explicit assumption made by Mimica et al. (2015) is that the core and sheath of the jet contribute significantly to the early X-ray emission. The X-ray emission from the jet in m09 clearly has significant contributions from regions extending all the way to the edge of the jet (see Figure 14). If jetted TDEs are indeed MAD and super-Eddington, the early X-ray emission would be expected to originate from both the relativistic and mildly relativistic outflow.
6 Discussion and Conclusions
We used the general relativistic radiation MHD (GRRMHD) code KORAL to carry out numerical simulations of a super-Eddington accretion disk that forms after the disruption of a star by a SMBH. We ran four simulations with parameters designed to explore how the dynamics and radiative properties of the accretion flow depend on the BH spin and magnetic field strength (SANE vs MAD). We initialized the models with a weakly bound, constant angular momentum torus of mass , which is in the mass range expected for typical TDEs. The resulting mass accretion rate is around 100 times Eddington, as appropriate for the peak of a TDE transient. One of our models, m09, is to our knowledge the first GRRMHD simulation of a jetted TDE.
We post-processed the output from the four simulations using the radiative transfer code HEROIC, and computed spectra and images as a function of the viewing angle of a distant observer. We then carried out a comprehensive comparison of the model spectra with TDE observations.
Three of our models, s00, s09, m00, agree well with observations of non-jetted TDEs, while the fourth model, m09, closely resembles jetted TDEs. The latter model has a rapidly spinning BH () and develops a strong dipolar magnetic field at the BH horizon, i.e., it is in the MAD state. Evidently, both rapid BH spin and MAD accretion are necessary to produce a jetted TDE.
The three non-jetted TDE models, s00, s09, m00, are highly inefficient, with a radiative efficiency %. Including all forms of energy (radiation, kinetic, magnetic), however, these systems are somewhat more efficient, with %. The models s00 and s09 both launch a wind and ‘jet’, though the latter is not a true relativistic jet but is more accurately described as a radiation driven outflow. The energy carried by the jet is not very large, %, and there is roughly an equal amount in the wind. The MAD, non-jetted model m00 on the other hand may be thought of as a wind dominated accretion disk since it has .
The jetted model m09 is very different from the other three models. It is characterized by rather high efficiencies, with %, and %. The very large efficiency of this model is because the accretion flow extracts a large amount of spin energy from the BH. Almost all of this energy goes into the jet. Model m09 also launches a wind, but the wind efficiency is much smaller, . For comparison, Dai et al. (2018) presented a MAD, , TDE accretion disk with %, %, and % (their accretion rate was several times smaller than in our models). While their model did not produce a relativistic jet, as did m09, it may be taken as an intermediate case between our models m00 (a low spin, MAD model) and m09 (a near extremal spin, MAD model). The effect of increasing the spin of the BH clearly leads to the injection of more energy into the jet and a higher radiative efficiency; however, the lack of a jet in their model suggests is needed to produce a truly relativistic jet. We should note that it is possible that the lack of an ultra relativistic jet in Dai et al. (2018) is due to inadequate numerical resolution.
We computed model spectra from our simulations and compared them with observational data on jetted and non-jetted TDEs. We found surprisingly good qualitative agreement. We did note some quantitative discrepancies, which call for more detailed study, but the overall conclusion is that the super-Eddington models described here provide a promising explanation of TDE phenomenology, at least near the peak of these outbursts.
The spectra of the three non-jetted models have many similarities with observations of non-jetted TDEs. The model spectra are double peaked, with emission from the torus producing optical/UV emission at K, while the funnel walls and heated wind produce a component peaking in the UV/soft X-ray at K. The radiation driven outflow is accelerated to high velocities with () in the jet, depending on the spin of the BH. The presence of an ultrafast outflow has been inferred in the non-jetted TDE ASASN-14li in both X-rays and radio (Alexander et al., 2016; Kara et al., 2018).
The optical/UV luminosity of the non-jetted models is around Eddington, which for our BH corresponds to . The observed luminosity is nearly independent of the viewing angle. The X-ray luminosity is of the order of , varying from the upper end for face-on observers to the lower end for edge-on observers. The X-ray luminosity of model m00 is nearly independent of viewing angle and is near the lower end of the range. The X-ray spectral shapes (hardness ratios) are broadly consistent with observations.
An interesting point is that the observed X-rays in the non-jetted TDE models do not come from the ‘base of the jet’ or a ‘corona above the accretion disk’ near the BH, as usually assumed. Rather, they come from the jet and wind at radii of several thousand , where the outflowing material emerges outside the optically thick torus. This radiation is visible for all viewing angles. Dai et al. (2018) reached a similar conclusion, viz., that X-ray photons from polar regions can reach even edge-on observers.
Comparing our model spectra with the detection limits of various telescopes and surveys we find that, in the absence of a significant hydrogen column, our non-jetted models should be detectable in optical, UV, and soft X-rays, regardless of viewing angle. The models thus do not explain why some optical/UV non-jetted TDEs are not detected in X-rays. This is an area of discrepancy between the models and observations. Furthermore, this result disagrees with the idea, proposed by Dai et al. (2018), that the viewing angle can explain the different TDE classes if TDE accretion disks are geometrically thick. While the ratio between X-ray and optical/UV luminosity does decrease with increasing viewing angle, there is still a detectable X-ray flux even for an edge-on observer. This statement is true even for the spectra presented by Dai et al. (2018), so in both models the X-ray emission ought to be detectable regardless of viewing angle.
Turning to model m09, we find that a MAD accretion disk around a rapidly spinning BH produces a powerful jet that can reproduce several features observed in the jetted TDE J1644, in agreement with the proposal of Tchekhovskoy et al. (2014). The model has a highly relativistic jet with , which is powered by spin energy from the BH, presumably via the Blandford & Znajek (1977) mechanism. The core of the relativistic jet has an opening angle of and there is a mildly relativistic sheath at angles . The core and sheath carry nearly equal amounts of energy.
The core-sheath structure of the jet is in agreement with models of the radio emission from J1644, which indicate that a single component cannot explain the late-time radio emission. However, models in the literature differ widely in the properties of the two regions. Wang et al. (2014) predicted that the sheath carries nearly twice as much energy as the core. On the other hand, the sheath could carry more than 25 times less kinetic energy than the core (Mimica et al., 2015; Liu et al., 2015). Our model m09 has roughly equal amounts of energy in the core and the sheath.
Model m09 also reproduces several features in the observed spectrum of J1644. The hard X-ray luminosity for a face-on observer is nearly , within a factor of a few of the luminosity observed at early times in J1644. The X-ray spectrum of model m09 is much harder than that of non-jetted models, in agreement with observations which show that jetted TDEs generally have harder spectra. The high velocity outflow launched by m09 is consistent with velocities inferred from X-ray reverberation mapping of J1644 (Kara et al., 2016). Assuming an enhanced hydrogen column, as observed in J1644, the model is able to explain the unusually weak optical emission in this system. Finally, the model suggests that distant jetted TDEs () will be detected as GRBs only when viewed close to the jet axis, where relativistic beaming strongly enhances the observed luminosity.
Between our two MAD models, m00 and m09, and the MAD simulation presented in Dai et al. (2018), a significant range of the spin parameter has been probed using GRRMHD simulations of MAD systems. These three simulations suggest that (i) the extraction of spin energy from the BH results in higher total efficiencies and injects a significant portion of this energy into the jet or wind, (ii) the emission properties of both non-jetted and jetted TDEs can be reasonably described using a MAD accretion disk model, and (iii) a MAD disk with is necessary to produce a jet. The third point follows from the fact that Dai et al. (2018) did not find a relativistic jet. It is a surprising result since the physics of jet acceleration as presently understood does not demand such large spins. We should caution that the lack of a relativistic jet in the Dai et al. (2018) model may be merely because of inadequate numerical resolution (their resolution was a factor of 2 to 3 lower along each spatial dimension).
In summary, in this paper we have presented simulations of the accretion disk that forms from rapid circularization of TDE fall back material. We find good agreement between the dynamics and spectra of our simulated models and observational properties of both jetted and non-jetted TDEs. Our results confirm that a rapidly spinning BH with a MAD accretion disk is a likely explanation of jetted TDEs.
Before concluding, we discuss some caveats. The GRRMHD simulations with KORAL described here use the so-called M1 closure scheme (Levermore, 1984) to model the radiation stress-energy tensor. The moment-based M1 method is more accurate than Eddington closure or simple diffusion (or even flux-limited diffusion), but it is nevertheless an approximation. Previous studies have shown that M1 closure, while perfectly adequate in most regions of the accretion disk, has difficulties in polar regions, where beams from the disk or funnel converge toward the axis. An artificial radiative viscosity mitigates the problem considerably (Sa̧dowski et al., 2015), but it is likely that the treatment of radiation in the jet is still far from perfect. This is a potential issue for some of the quantitative results we report here regarding the speed and luminosity of the jet, since a part of the jet acceleration is from radiative driving.
The radiation post-processing code HEROIC does not suffer from this problem since it uses a large number of rays (162 rays in this study) and thus has ample angular information to handle physics near the axis. However, HEROIC does not solve for the gas dynamics – it merely carries out a more accurate calculation of the gas thermodynamics and radiative transfer. Thus, at least in the matter of jet dynamics, the caveat of the previous paragraph remains.
One other minor point is that HEROIC uses a simple model for the frequency dependent opacity of atomic processes. In particular, it replaces atomic edges from bound-free transitions with a smoothed out opacity profile, and it does not include any line opacity. We do not think this is a serious issue, given the data presently available on TDEs, but we note that Dai et al. (2018) did include the opacity edge due to ionized helium in their calculations.
Acknowledgements
We are grateful to James Guillochon for guidance throughout this work. We thank Aleksander Sa̧dowski for assistance with the KORAL code, and Andrew Chael, Pawan Kumar, and especially Wenbin Lu and the referee for useful comments and suggestions. This work was supported in part by NSF grant AST-1816420, and made use of computational support from NSF via XSEDE resources (grant TG-AST080026N) and NASA via High-End Computing (HEC) resources. This work was carried out at the Black Hole Initiative at Harvard University, which is supported by a grant from the John Templeton Foundation.
References
- Abramowicz et al. (1988) Abramowicz M. A., Czerny B., Lasota J. P., Szuszkiewicz E., 1988, ApJ, 332, 646
- Aleksić et al. (2013) Aleksić, J., Antonelli, L. A., Antoranz, P., et al. 2013, A&A, 552, A112
- Alexander et al. (2016) Alexander, K. D., Berger, E., Guillochon, J., Zauderer, B. A., & Williams, P. K. G. 2016, ApJ, 819, L25
- Aliu et al. (2011) Aliu, E., Arlen, T., Aune, T., et al. 2011, ApJ, 738, L30
- Auchettl et al. (2017) Auchettl, K., Guillochon, J., & Ramirez-Ruiz, E. 2017, ApJ, 838, 149
- Balbus & Hawley (1991) Balbus, S. A., & Hawley, J. F. 1991, ApJ, 376, 214
- Barthelmy et al. (2005) Barthelmy, S. D., et al. 2005, Space Science Reviews, 120, 143
- Berger et al. (2012) Berger, E., Zauderer, A., Pooley, G. G., Soderberg, A. M., Sari, R., Brunthaler, A., & Bietenholz, M. F. 2012, ApJ, 748, 36
- Bisnovatyi-Kogan & Ruzmaikin (1974) Bisnovatyi-Kogan, G. S., & Ruzmaikin, A. A. 1974, Ap&SS, 28, 45
- Blandford & Znajek (1977) Blandford, R. D., & Znajek, R. L. 1977, MNRAS, 179, 433
- Bloom et al. (2011) Bloom, J. S., Giannios, D., Metzger, B. D., et al. 2011, Science, 333, 203
- Bonnerot et al. (2016a) Bonnerot, C., Rossi, E. M., Lodato, G., & Price, D. J. 2016a, MNRAS, 455, 2253
- Bonnerot et al. (2016b) Bonnerot, C., Rossi, E. M., & Lodato, G. 2016b, MNRAS, 458, 3324
- Bonnerot et al. (2017) Bonnerot, C., Price, D. J., Lodato, G., & Rossi, E. M. 2017, MNRAS, 469, 4879
- Brown et al. (2015) Brown, G. C., Levan, A. J., Stanway, E. R., Tanvir, N. R., Cenko, S. B., Berger, E., Chornock, R., & Cucchiaria, A. 2015, MNRAS, 452, 4297
- Burke et al. (1997) Burke, B. E., Gregory, J., Bautz, M. W., Prigozhin, G. Y., Kissel, S. E., Kosicki, B. N., Loomis, A. H., & Young, D. J. 1997, IEEE Trans. Electron Devices, 44, 1633
- Burrows et al. (2005) Burrows, D. N., et al. 2005, Space Science Reviews, 120, 165
- Burrows et al. (2011) Burrows, D. N., Kennea, J. A., Ghisellini, G., et al. 2011, Nature, 476, 421
- Cannizzo et al. (1990) Cannizzo, J. K., Lee, H. M., & Goodman, J. 1990, ApJ, 351, 38
- Cardelli et al. (1989) Cardelli, J. A., Clayton, G. C., & Mathis, J. S. 1989, ApJ, 345, 245
- Cenko et al. (2012) Cenko, S. B., Krimm, H. A., Horesh, A., et al. 2012, ApJ, 753, 77
- Cheng & Bogdanović (2014) Cheng, R. M., & Bogdanović, T. 2014, Phys. Rev. D, 90, 064020
- Coughlin & Begelman (2014) Coughlin, E. R., & Begelman, M. C. 2014, ApJ, 781, 82
- Crumley et al. (2016) Crumley, P., Lu, W., Santana, R., Hernández, R. A., Kumar, P., & Markoff, S. 2016, MNRAS, 460, 396
- Dai et al. (2013) Dai, L., Escala, A., & Coppi, P. 2013, ApJ, 775, L9
- Dai et al. (2015) Dai, L., McKinney, J. C., & Miller, M. C. 2015, ApJ, 812, L39
- Dai et al. (2018) Dai, L., McKinney, J. C., Roth, N., Ramirez-Ruiz, E., & Miller, M. C. 2018, ApJ, 859, L20
- Dong et al. (2016) Dong, S., Shappee, B. J., Prieto, J. L., et al. 2016, Science, 351, 257
- Evans & Kochanek (1989) Evans, C. R., & Kochanek, C. S. 1989, ApJ, 346, L13
- Feng et al. (2015) Feng, H., Ho, L. C., Kaaret, P., Tao, L., Yamaoka, K., Zhang, S., & Grisé, F. 2015, ApJ, 807, 185
- Fragile et al. (2007) Fragile, P. C., Blaes, O. M., Anninos, P., & Salmonson, J. D. 2007, ApJ, 668, 417
- Güver & Özel (2009) Güver, T., & Özel, F. 2009, MNRAS, 400, 2050
- Gammie et al. (2003) Gammie, C. F., McKinney, J. C., & Tóth, G. 2003, ApJ, 589, 444
- Gezari et al. (2008) Gezari, S., Basa, S., Martin, D. C., et al. 2008, ApJ, 676, 944
- Gezari et al. (2006) Gezari, S., Martin, D. C., Milliard, B., et al. 2006, ApJ, 653, L25
- Gezari et al. (2009) Gezari, S., Heckman, T., Cenko, S. B., et al. 2009, ApJ, 698, 1367
- Giannios & Metzger (2011) Giannios, D., & Metzger, B. D. 2011, MNRAS, 416, 2102
- Godoy-Rivera et al. (2017) Godoy-Rivera, D., Stanek, K. Z., Kochanek, C. S., et al. 2017, MNRAS, 466, 1428
- Guillochon et al. (2014) Guillochon, J., Manukian, H., & Ramirez-Ruiz, E. 2014, ApJ, 783, 23
- Guillochon & Ramirez-Ruiz (2013) Guillochon, J., & Ramirez-Ruiz, E. 2013, ApJ, 767, 25
- Guillochon & Ramirez-Ruiz (2015) Guillochon, J., & Ramirez-Ruiz, E. 2015, ApJ, 809, 166
- Guillochon & McCourt (2017) Guillochon, J., & McCourt, M. 2017, ApJ, 834, L19
- Hawley et al. (2011) Hawley, J. F., Guan, X., & Krolik, J. H. 2011, ApJ, 738, 84
- Hayasaki et al. (2016) Hayasaki, K., Stone, N., & Loeb, A. 2016, MNRAS, 461, 3760
- Hills (1975) Hills, J. G. 1975, Nature, 254, 295
- Holoien et al. (2016b) Holoien, T. W.-S., Kochanek, C. S., Prieto, J. L., et al. 2016, MNRAS, 463, 3813
- Holoien et al. (2016a) Holoien, T. W.-S., Kochanek, C. S., Prieto, J. L., et al. 2016, MNRAS, 455, 2918
- Holoien et al. (2014) Holoien, T. W.-S., Prieto, J. L., Bersier, D., et al. 2014, MNRAS, 445, 3263
- Igumenshchev et al. (2003) Igumenshchev, I. V., Narayan, R., & Abramowicz, M. A. 2003, ApJ, 592, 1042
- Jansen et al. (2001) Jansen, F., Lumb, D., Altieri, B., et al. 2001, A&A, 365, L1
- Kaiser et al. (2002) Kaiser, N., et al. 2002, SPIE Conf. Ser., 4386, 154
- Kara et al. (2018) Kara, E., Dai, L., Reynolds, C. S., & Kallman, T. 2018, MNRAS, 474, 3593
- Kara et al. (2016) Kara, E., Miller, J. M., Reynolds, C., & Dai, L. 2016, Nature, 535, 388
- Kato et al. (2004) Kato, Y., Mineshige, S., & Shibata, K. 2004, ApJ, 605, 307
- Kawashima et al. (2012) Kawashima, T., Ohsuga, K., Mineshige, S., Yoshida, T., Heinzeller, D., & Matsumoto, R. 2012, ApJ, 752, 18
- Kelley et al. (2014) Kelley, L. Z., Tchekhovskoy, A., & Narayan, R. 2014, MNRAS, 445, 3919
- Kesden (2012a) Kesden, M. 2012a, Phys. Rev. D, 85, 024037
- Kesden (2012b) Kesden, M. 2012b, Phys. Rev. D, 86, 064026
- Komossa (2015) Komossa, S. 2015, Journal of High Energy Astrophysics, 7, 148
- Komossa et al. (2008) Komossa, S., Zhou, H., Wang, T., et al. 2008, ApJ, 678, L13
- Kroupa et al. (1993) Kroupa, P., Tout, C. A., & Gilmore, G. 1993, MNRAS, 262, 545
- Leloudas et al. (2016) Leloudas, G., Fraser, M., Stone, N. C., et al. 2016, Nature Astronomy, 1, 0002
- Levan et al. (2011) Levan, A. J., Tanvir, N. R., Cenko, S. B., et al. 2011, Science, 333, 199
- Levermore (1984) Levermore, C. D. 1984, J. Quant. Spectrosc. Radiat. Transfer, 31, 149
- Lin et al. (2015) Lin, D., Maksym, P. W., Irwin, J. A., Komossa, S., Webb, N. A., Godet, O., Barret, D., Grupe, D., & Gwyn, S. D. J. 2015, ApJ, 811, 43
- Liu et al. (2015) Liu, D., Pe’er, A., & Loeb, A. 2015, ApJ, 798, 13
- Lodato et al. (2009) Lodato, G., King, A. R., & Pringle, J. E. 2009, MNRAS, 392, 332
- Lodato & Rossi (2011) Lodato, G., & Rossi, E. M. 2011, MNRAS, 410, 359
- Lu et al. (2017) Lu, W., Krolik, J., Crumley, P., & Kumar, P. 2017, MNRAS, 471, 1141
- Martin et al. (2005) Martin, D. C., et al. 2005, Astrophys. J., 619, L1
- Metzger et al. (2012) Metzger, B. D., Giannios, D., & Mimica, P. 2012, MNRAS, 420, 3528
- Mimica et al. (2015) Mimica, P., Giannios, D., Metzger, B. D., & Aloy, M. A. 2015, MNRAS, 450, 2824
- Mockler et al. (2018) Mockler, B., Guillochon, J., & Ramirez-Ruiz, E. 2018, arXiv:1801.08221
- Narayan et al. (2003) Narayan, R., Igumenshchev, I. V., & Abramowicz, M. A. 2003, PASJ, 55, L69
- Narayan et al. (2012) Narayan, R., SÄ dowski, A., Penna, R. F., & Kulkarni, A. K. 2012, MNRAS, 426, 3241
- Narayan et al. (2016) Narayan, R., Zhu, Y., Psaltis, D., & Saḑowski, A. 2016, MNRAS, 457, 608
- Narayan et al. (2017) Narayan, R., Saḑowski, A., & Soria, R. 2017, MNRAS, 469, 2997
- O’Riordan et al. (2017) O’Riordan, M., Pe’er, A., & McKinney, J. C. 2017, ApJ, 843, 81
- Novikov & Thorne (1973) Novikov, I. D., & Thorne, K. S. 1973, Black Holes (Les Astres Occlus), 343
- Paczyńsky & Wiita (1980) Paczyńsky, B., & Wiita, P. J. 1980, A&A, 88, 23
- Phinney (1989) Phinney, E. S. 1989, The Center of the Galaxy, 136, 543
- Piran et al. (2015) Piran, T., Sa̧dowski, A., & Tchekhovskoy, A. 2015, MNRAS, 453, 157
- Pushkarev et al. (2009) Pushkarev, A. B., Kovalev, Y. Y., Lister, M. L., & Savolainen, T. 2009, A&A, 507, L33
- Ramirez-Ruiz & Rosswog (2009) Ramirez-Ruiz, E., & Rosswog, S. 2009, ApJ, 697, L77
- Rees (1988) Rees, M. J. 1988, Nature, 333, 523
- Roth et al. (2016) Roth, N., Kasen, D., Guillochon, J., & Ramirez-Ruiz, E. 2016, ApJ, 827, 3
- Sa̧dowski et al. (2014) Sa̧dowski, A., Narayan, R., McKinney, J. C., & Tchekhovskoy, A. 2014, MNRAS, 439, 503
- Sa̧dowski et al. (2013b) Sa̧dowski, A., Narayan, R., Penna, R., & Zhu, Y. 2013b, MNRAS, 436, 3856
- Sa̧dowski et al. (2015) Sa̧dowski, A., Narayan, R., Tchekhovskoy, A., Abarca, D., Zhu, Y., & McKinney, J. C. 2015, MNRAS, 447, 49
- Sa̧dowski & Narayan (2015b) Sa̧dowski, A., Narayan, R. 2015, MNRAS, 453, 2372
- Sa̧dowski et al. (2013a) Sa̧dowski, A., Narayan, R., Tchekhovskoy, A., & Zhu, Y. 2013a, MNRAS, 429, 3533
- Sa̧dowski et al. (2016a) Sa̧dowski, A., Tejeda, E., Gafton, E., Rosswog, S., & Abarca, D. 2016a, MNRAS, 458, 4250
- Sa̧dowski et al. (2016b) Sa̧dowski, A., Lasota, J.-P., Abramowicz, M. A., & Narayan, R. 2016b, MNRAS, 456, 3915
- Sa̧dowski et al. (2016c) Sa̧dowski, A., Lasota, J.-P., Abramowicz, M. A., & Narayan, R. 2016c, MNRAS, 456, 3915
- Sa̧dowski et al. (2017) Sa̧dowski, A., Wielgus, M., Narayan, R., Abarca, D., McKinney, J. C., & Chael, A. 2017, MNRAS, 466, 705
- Shappee et al. (2014) Shappee, B. J., Prieto, J. L., et al. 2014, ApJ, 788, 48
- Shiokawa et al. (2015) Shiokawa, H., Krolik, J. H., Cheng, R. M., Piran, T., & Noble, S. C. 2015, ApJ, 804, 85
- Stone & Loeb (2012) Stone, N., & Loeb, A. 2012, Physical Review Letters, 108, 061302
- Stone et al. (2013) Stone, N., Sari, R., & Loeb, A. 2013, MNRAS, 435, 1809
- Strubbe & Quataert (2009) Strubbe, L. E., & Quataert, E. 2009, MNRAS, 400, 2070
- Sutherland & Dopita (1993) Sutherland R. S., Dopita M. A., 1993, ApJS, 88, 253
- Tchekhovskoy et al. (2012) Tchekhovskoy, A., McKinney, J. C., & Narayan, R. 2012, Journal of Physics Conference Series, 372, 012040
- Tchekhovskoy et al. (2014) Tchekhovskoy, A., Metzger, B. D., Giannios, D., & Kelley, L. Z. 2014, MNRAS, 437, 2744
- Tchekhovskoy et al. (2011) Tchekhovskoy, A., Narayan, R., & McKinney, J. C. 2011, MNRAS, 418, L79
- Ulmer (1999) Ulmer, A. 1999, ApJ, 514, 180
- van Velzen et al. (2011) van Velzen, S., Farrar, G. R., Gezari, S., Morrell, N., Zaritsky, D., Östman, L., Smith, M., Gelfand, J., & Drake, A. J. 2011, ApJ, 741, 73
- Wang et al. (2014) Wang, J.-Z., Lei, W.-H., Wang, D.-X., Zou, Y.-C., Zhang, B., Gao, H., & Huang, C.-Y. 2014, ApJ, 788, 32
- Wilms et al. (2000) Wilms, J., Allen, A., & McCray, R. 2000, ApJ, 542, 914
- York et al. (2000) York, P. J., et al. 2000, Astron. J., 120, 1579
- Zauderer et al. (2011) Zauderer, B. A., Berger, E., Soderberg, A. M., et al. 2011, Nature, 476, 425
- Zauderer et al. (2013) Zauderer, B. A., Berger, E., Margutti, R., Pooley, G. G., Sari, R., Soderberg, A. M., Brunthaler, A., & Bietenholz, M. F. 2013, ApJ, 767, 152
- Zhu et al. (2015) Zhu, Y., Narayan, R., Sadowski, A., & Psaltis, D. 2015, MNRAS, 451, 1661
Appendix A Disk Initialization - Hydrostatic Rotating Disk with Power Law Angular Momentum
In this work, we use the power law angular momentum disk in hydrostatic equilibrium that was presented in Kato et al. (2004). Here we briefly describe the model and how we initialize the torus in the KORAL code.
For the model presented in Kato et al. (2004), they use the pseudo-Newtonian potential described in Paczyńsky & Wiita (1980):
| (27) |
where is the radius in polar coordinates, and is the Schwarzschild radius. A polytropic equation of state is assumed such that and the angular momentum distribution of the disk is assumed to be a power law given by:
| (28) |
where and are the cylindrical radius and height, and . Here is simply a scale radius that sets the pressure and density maximum and is a constant. Under these assumptions, the condition for hydrostatic equilibrium combined with the polytropic equation of state yields a complete solution for the entire torus given the pressure () and density () at the characteristic radius :
| (29) | ||||
| (30) |
where is the adiabatic index (which we set to since the torus is radiation dominated which implies ), is the sound speed of the gas, is the effective potential. Here is the centrifugal potential.
The Bernoulli parameter for the gas is given by the sum of the specific kinetic, potential, and internal energy. In the context of the power law angular momentum model employed here the gas is initially on a Keplerian orbit, so it may be expressed as:
| (31) |
where is the internal potential. The condition of hydrostatic equilibrium satisfies the equation , which implies:
| (32) |
Theoretical studies of TDE disks find that the gas comes in with roughly equal angular momentum. As such, we use a constant angular momentum model in this work. This implies that we should choose . Under this condition, the Bernoulli parameter of the disk is also constant given equations (31) and (32).
To initialize the disk within the KORAL code, we specify the characteristic radius (), maximum density (), and initial gas temperature at the density maximum (). We set the characteristic radius to be the circularization radius given by equation (3). The initial gas density effectively sets the accretion rate once the disk reaches a quasi-steady state, and the gas temperature is chosen such that the initial Bernoulli parameter of the torus matches the binding energy specified in equation (2).
To achieve a MAD accretion disk, we initialize the magnetic field as a large dipolar field. This leads to the accumulation of magnetic field of only one polarization and the BH builds up a large magnetic flux quite rapidly. For the SANE models, we initialize the disk with multiple loops of alternating polarity. This prevents the build up of magnetic flux since the field cancels out. We show the gas density and field lines of the initial state of the MAD and SANE models in Figure 18.
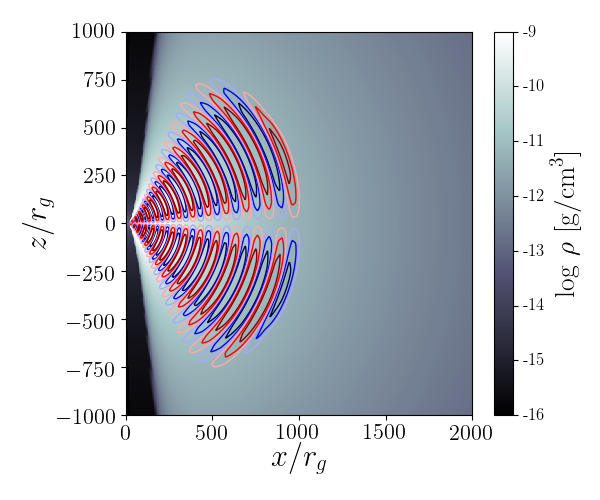
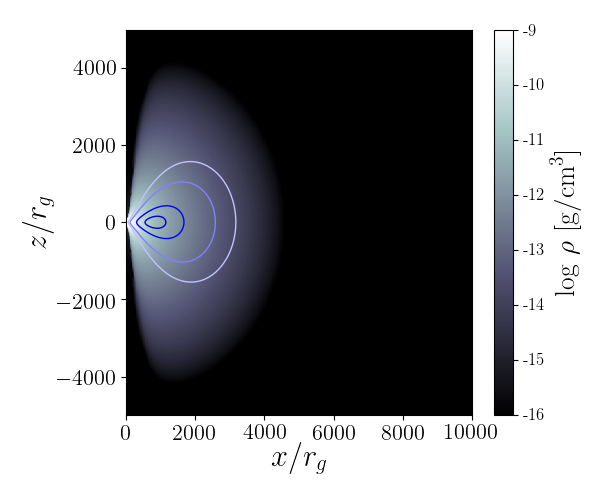
Appendix B Effect of Extinction
For the purposes of comparing the model spectra with observational results, we include the effects of extinction in the optical, UV, and X-ray (0.1-10 keV) bands. For the X-ray bands, we use the interstellar medium (ISM) particle cross section as a function of energy as calculated in Wilms et al. (2000). The extinction is higher in the soft X-ray than in the hard X-ray and is given by:
| (33) |
where is the photon energy, is the initial intensity, is the observed intensity, and is the cross section of ISM particles.
For the optical and UV bands, we make use of the linear relation between the hydrogen column density and the band reddening () as presented in Güver & Özel (2009). We also assume . From the reddening curves presented in Cardelli et al. (1989), we compute the reddening in each band [] and reduce the band luminosity accordingly.
Appendix C Additional Figures
Here we show the dynamics and large scale features of models s09 and m00. In addition we show detection limits for all four models. See the text for a full description.
