Milky Way globular clusters in -rays: analyzing the dynamical formation of millisecond pulsars
Abstract
Globular clusters (GCs) are evolved stellar systems containing entire populations of millisecond pulsars (MSPs), which are efficient -ray emitters. Observations of this emission can be used as a powerful tool to explore the dynamical processes leading to binary system formation in GCs. In this work, 9 years of Fermi Large Area Telescope data were used to investigate the -ray emission from all GCs in the Milky Way. 23 clusters were found as -ray bright, with 2 of them never having been reported before. It was also found that magnetic braking probably has a smaller impact on the formation rate of binary systems in metal-rich GCs than previously suggested, while a large value for the two-body encounter rate seems to be a necessary condition. The influence of the encounter rate per formed binary was for the first time explored in conjunction with -ray data, giving evidence that if this quantity is very high, binary systems will get destroyed before having time to evolve into MSPs, thus decreasing the total number of MSPs in a GC. No extended emission was found even for clusters whose optical extent is ; all of them are point-like sources spatially in agreement with the optical cores of the GCs, supporting previous X-rays results of heavier objects sinking into the clusters’ cores via dynamical friction. The possibility of extrapolating these results to ultra-compact dwarf galaxies is discussed, as these systems are believed to be the intermediate case between GCs and dwarf galaxies.
keywords:
Globular cluster – Millisecond pulsar – Gamma-rays1 Introduction
Since the first detection of -rays from 47 Tucanæ with the Fermi Large Area Telescope (LAT) (Abdo et al., 2009), globular clusters (GCs) have become a new class of -ray source. Previous observations in the 90’s with the Energetic Gamma-ray Experiment (EGRET) aboard the Compton Gamma-ray observatory found no signal of -ray emission from these sources but resulted in important flux upper limits for more than a dozen of them (Michelson et al., 1994). By studying GCs in -rays, one can learn about the dynamical evolution of these systems, as well as the mechanisms behind the formation of their millisecond pulsar (MSP) populations.
The -ray emission from GCs is attributed to their large number of MSPs (Bednarek & Sitarek, 2007; Abdo et al., 2010c; Freire, 2012; Caraveo, 2014), which are known to be efficient -ray emitters (Chen, 1991; Harding et al., 2005; Caraveo, 2014). The recent detection of pulsed -ray emission from some GCs has further strengthened this connection (Freire et al., 2011; Johnson et al., 2013). The populations of MSPs in these systems111List containing all known pulsars in GCs: https://www.naic.edu/~pfreire/GCpsr.html, as the descendants of low-mass X-ray binaries (LMXBs), are believed to be formed as a natural consequence of frequent stellar encounters (Pooley et al., 2003), with the high number density of stars within a GC providing an excellent laboratory to test scenarios for compact binary formation. Evidence favoring this dynamical origin, i.e., positive correlations between the cluster’s -luminosity () with its stellar encounter-rate () and with its metallicity ([Fe/H]) have been found in the past few years (Abdo et al., 2010c; Hui et al., 2010a; Hui et al., 2010b; Bahramian et al., 2013; Hooper & Linden, 2016; Lloyd et al., 2018). In interpretations of the former, the stars are assumed to be captured one by the other at a rate proportional to , where is the central luminosity density and is the cluster core radius (Verbunt, 2003b). In the latter, for a metal-rich cluster, magnetic braking can be more efficient, facilitating orbital decay in binary systems as well as a higher probability of MSP formation (Hui et al., 2010b; Tam et al., 2016).
In contrast with other pulsars, MSPs begin as spun-down neutron stars in binary systems where the companion star is massive enough to evolve into a giant and overflow the Roche limit of the system (Lorimer, 2001). The neutron star is then spun-up and wakes up as a recycled pulsar by accreting matter and increasing angular momentum at the expense of the orbital angular momentum of the binary system (Alpar et al., 1982). Due to their weak surface magnetic fields, MSPs lose their larger store of rotational kinetic energy much more slowly than common pulsars (Lorimer et al., 2005), remaining luminous for up to billions of years. -ray photons are mainly produced in the magnetosphere of MSPs, where inverse Compton scattering, synchrotron and curvature radiation are the main physical processes behind this emission (Sturrock, 1971; Harding et al., 1978; Arons, 1983; Cheng et al., 1986; Bednarek & Sitarek, 2007).
This work presents an analysis of all globular clusters in the Milky Way (Harris 1996 – 2010 edition), using 9 years of Fermi LAT data as an effort for detecting them and characterizing their -ray emission and MSP formation scenarios. The observations and cuts on Fermi LAT data are described in Section 2; followed by the light curve analysis and study of correlations between -ray emission, encounter rate and metallicity, in Section 3. Section 4 discusses the influence of magnetic braking on the formation of MSPs and the possibility of extrapolating the results in this work to ultra-compact dwarf galaxies.
2 Data selection and analysis
The sample analyzed consists of all 157 known GCs in the Milky Way. For 25 of them, -ray emission was previously described in Acero et al. (2015), Hooper & Linden (2016) and Zhang et al. (2016), although four of these sources were not confirmed here (2MASS-GC02, M15, NGC 6342 and Pal6). Each GC treated here was observed with LAT during a 9-year period ranging from August 5th 2008 to August 5th 2017 (MET 239587201 - 523584005). The data was analyzed using Fermi Science Tools v10r0p5, fermipy python package v0.16.0 (Wood et al., 2017) and Pass 8 (Atwood et al., 2013), which present better energy and angular resolution as well as an increased effective area and energy range than its predecessor Pass 7.
Following standard procedures 222Fermi science tools and fermipy tutorials: https://fermi.gsfc.nasa.gov/ssc/data/analysis/scitools/ and http://fermipy.readthedocs.io/en/latest/quickstart.html, data for each source was selected within a region-of-interest (ROI), centered on the GCs positions given in the GLOBCLUST catalog (Harris 1996 – 2010 edition), with energies ranging between 100 MeV and 100 GeV divided into 12 logarithmically spaced energy bins. Photons with energies GeV were not considered, as the spectra of MSPs frequently presents an exponential cutoff behavior above only a few GeV (Abdo et al., 2010a). Sources included in the Fermi LAT Third Source Catalog (3FGL – Acero et al., 2015) and lying up to outside the ROIs were taken into account as well as all sources found with the fermipy function find_sources(sqrt_ts_threshold=5.0, min_separation=0.4). The number of new sources found with find_sources() varied substantially depending on the adopted ROI: for ROIs lying close to the Galactic plane, a number of new sources was common; for the other ROIs, the number of new sources was typically . In very few cases, a new source was found closer than from the GC position (e.g.: Palomar 6 and Whiting 1). In these situations, a case-by-case approach was performed, manually including a new source to avoid contamination on the GC flux upper limit measurement. Only events belonging to the Source class were used (evclass=128 and evtype=3). The filters applied with were DATA_QUAL > 0 and the recommended instrument configuration for science LAT_CONFIG == 1. A zenith angle cut of was applied to avoid contamination from the Earth limb. For modeling the Galaxy and the extragalactic background emission, the Galaxy background model gll_iem_v06.fits and the isotropic spectral template iso_P8R2_SOURCE_V6_v06.txt were adopted.
All sources were investigated by means of binned likelihood analysis (gtlike tool – MINUIT algorithm). To quantify the significance among the detections, a test statistic (TS) was calculated, defined as , where the term inside parentheses is the difference between the maximum log-likelihoods with () and without () modeling the source. The chosen criteria for detection was , corresponding formally to a significance slightly above (Mattox et al., 1996). If the detected GC belonged to 3FGL, its spectrum was modeled according to its description there. If a detected GC was not included in 3FGL (post-3FGL clusters, from now on), its spectrum was modeled with a power-law. For all sources lying within a radius of from the center of the ROIs, the normalization parameter was left free to vary.
| Cluster | SM | Luminosity | Energy flux | TS |
|---|---|---|---|---|
| erg s-1 | erg cm-2s-1 | |||
| 47 Tuc | LP | 5604 | ||
| Terzan5 | LP | 3854 | ||
| M62 | LP | 1036 | ||
| NGC6388 | LP | 880 | ||
| Cent | LP | 863 | ||
| 2MS-GC01 | LP | 731 | ||
| NGC6440 | PL | 518 | ||
| NGC6316 | PL | 276 | ||
| NGC6441 | PL | 331 | ||
| NGC6752 | PL | 149 | ||
| NGC6652 | LP | 129 | ||
| M80 | PL | 92 | ||
| NGC2808 | PL | 81 | ||
| NGC6541 | PL | 78 | ||
| NGC6717 | PL | 31 | ||
| Glimp01 | PL | 286 | ||
| Glimp02 | PL | 98 | ||
| NGC6397 | PL | 64 | ||
| NGC6139 | PL | 59 | ||
| M12 | PL | 43 | ||
| M5 | PL | 31 | ||
| M14 | PL | 29 | ||
| M79 | PL | 26 |
Point sources consistent with the optical center of the GCs were added to the models for each GC in the analysed sample and a TS residuals map was constructed for each one of them. These residuals maps were used together with aperture photometry light curves to obtain a clean sample of GCs, where only sources with a clear indication for an isolated -ray point-like emission spatially coincident with the optical position of the cluster and presenting steady light curves were taken into account. All detections are described in Section 3, while the TS residuals maps and flux upper limits for all non-detected GCs are shown in Appendix A.
The cases of NGC 6624 and M28 should be considered separately. Both GCs were originally described as -ray bright (Abdo et al., 2010c; Tam et al., 2011). Later, they were observed to host -ray pulsations (Freire et al., 2011; Johnson et al., 2013) and were cataloged as individual pulsars in 3FGL. When modeling both clusters, these cataloged pulsars were taken into account, with their normalizations left free to vary. After that, the clusters’ emission laid below the detection threshold.
3 Results
3.1 Detections
Among the 157 GCs, 23 presented -ray emission spatially coincident with the optical center of the clusters. Another 4 clusters (2MASS-GC02, M15, NGC 6342 and Pal6) were previously described as -ray bright in literature, but in this work their significances were found to be below the adopted threshold of TS = 25; the results for these clusters are described in Appendix A. The 23 detected clusters are shown in Table 1, which is segmented in three panels: the upper one shows the 15 GCs cataloged in 3FGL; the middle panel shows the post-3FGL clusters, and the last/bottom panel shows the new GCs candidates detected in this work.
3.1.1 Fermi-LAT 8 years source list
Cross checking the detections in this work with the ones available on the preliminary LAT 8-year Point Source List (FL8Y333https://fermi.gsfc.nasa.gov/ssc/data/access/lat/fl8y/), some differences are found. Six sources (2MASS-GC02, M92, NGC 362, NGC 6304, NGC 6342 and Terzan 1) associated to GCs in FL8Y are not significant detections in this work; and only one of the GCs detected in this work is not listed in FL8Y (M79). All of these clusters (with exception of Terzan 1) are very close to the detection threshold. The found differences may be related to the different likelihood method adopted in FL8Y (weighted likelihood444https://fermi.gsfc.nasa.gov/ssc/data/access/lat/fl8y/FL8Y_description_v8.pdf) and may vary depending on the analyzed region. The clusters 2MASS-GC02, NGC 362 and Terzan 1, for instance, are located on very complicated regions of the sky with bright diffuse emission. Also M92 and M79 are apart from very bright sources. Future analyses including the 4th source catalog of the Fermi-LAT (4FGL, in preparation) will benefit from a new Galactic diffuse -ray emission model based on Pass 8 data, allowing for better results.
3.2 Point-like sources
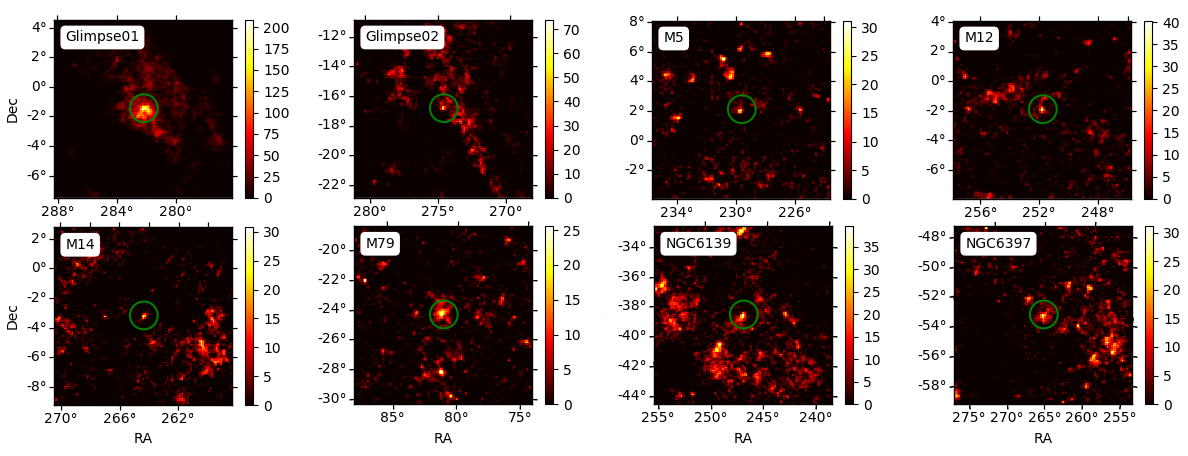
The spatial consistency between the -ray and optical/infrared emission for the firmly detected post-3FGL sources can be checked in Figure 1, where the low-energy centers of the GCs are always coincident with the centers of the TS residuals maps. All maps have evidence for -ray emission with a maximum lying less than ( pixels) from their centers. TS maps for 3FGL clusters are not shown here, as their emission is generally easily visible in their counts maps. The two new sources found in this work, M14 and M79, had their best fitted positions obtained with the function localize(), available in fermipy, which found a -optical/infrared spatial separation within uncertainty radius for both cases (Table 2).
In order to test the accidental coincidence rate in the analyzed sample, 200 pre-selected points in RA and Dec (blank fields) were randomly chosen in the sky with and being at least apart from any known 3FGL source. These blank fields were analyzed exactly in the same way as the main GCs analyses and on of them a point source with TS above the threshold was detected. This value corresponds to an upper limit on the false positive rate of the associations with GCs shown in Table 1 and should not be confused with the detection significance of the sources. The 3FGL clusters here were assumed to be truly associated to GCs and are not included in this false alarm association rate.
| Cluster | RA | Dec | ||
|---|---|---|---|---|
| M14 | ||||
| M79 |
3.3 Extended source analysis
For Centauri, 47 Tucanæ and NGC 6397, the three -ray bright GCs with largest optical angular diameter (), extended emission models were tested. The extended emission templates were created in two ways: with DSS optical maps available in NASA’s SkyView555https://skyview.gsfc.nasa.gov/current/cgi/query.pl virtual telescope (McGlynn et al., 1998) and with 25 2D-Gaussian source templates with sizes ranging from to . For all tests, the likelihood ratio method favored the point-like model instead of the extended emission models, which, in the most optimistic cases, presented TS values of only for Centauri (), for 47 Tucanæ () and for NGC 6397 (). These results are in agreement with heavier objects sinking into the clusters’ cores via dynamical friction (Fregeau et al., 2003), as both binaries and single MSPs are significantly more massive than typical stars in a GC. The same conclusion is reached from X-ray observations of 47 Tucanæ (Edmonds et al., 2003; Heinke et al., 2005), where the cluster’s X-ray source population is highly concentrated in its core.
3.4 Light curves
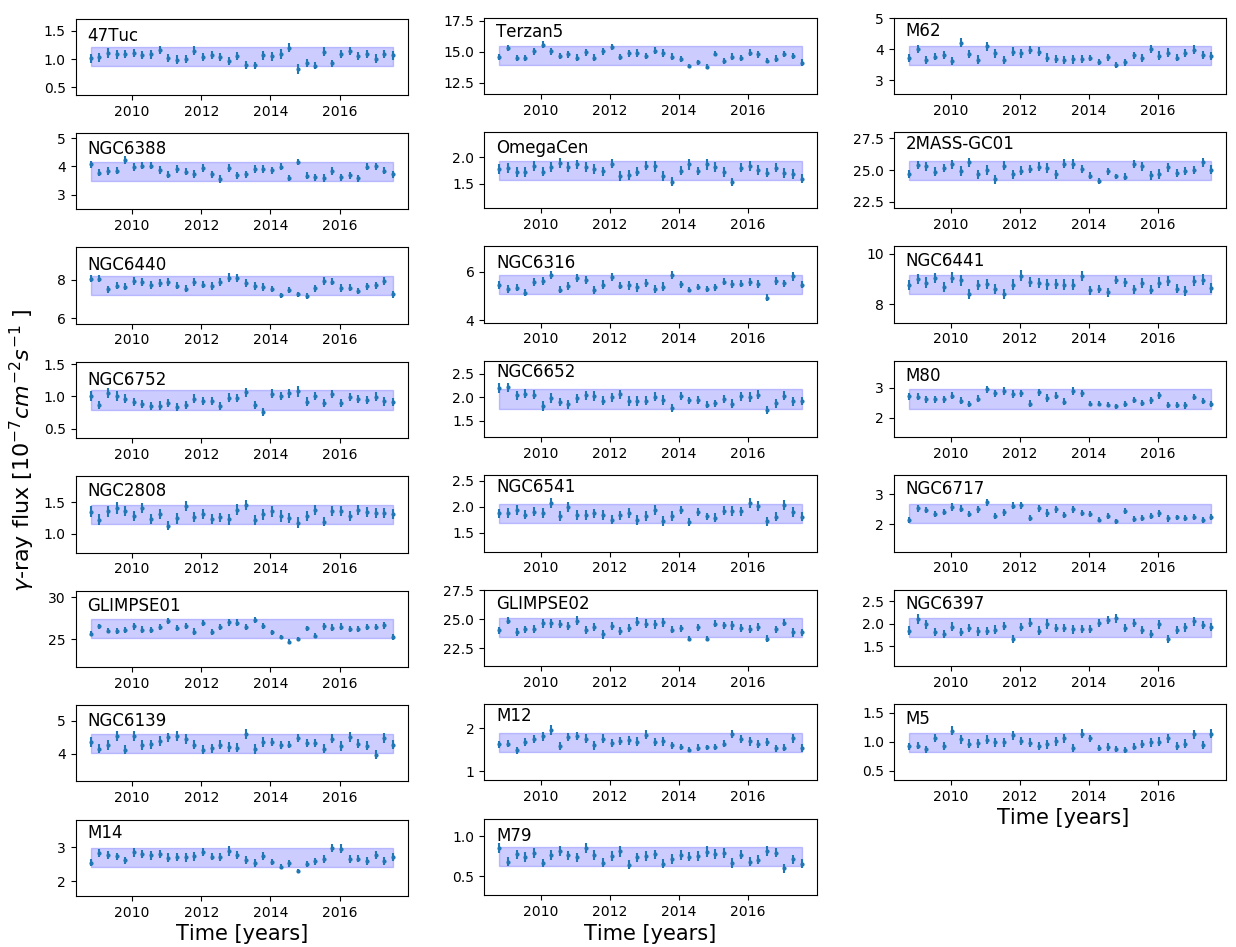
The intrinsic variability of MSPs completely disappears when the observations span through timescales much longer than the MSP typical revolution time. A light curve with bins of months is expected to be quiescent (Abdo et al., 2010c), where its variability is attributed only to statistical fluctuations. High levels of variability in a light curve with such timescales are unlikely to be associated with a GC; they could nevertheless be due to a background active galactic nucleus.
To test for variability, aperture photometry light curves were created with gtbin for every single -ray GC. The results are shown in Figure 2, where the data was binned in 3-month intervals, the chosen aperture radius was and the spectral index was kept fixed at 2. All light curves analyzed presented quiescent behavior, as expected for GCs, with all data points lying within the standard deviation level (blue band).
3.5 Spectral emission models
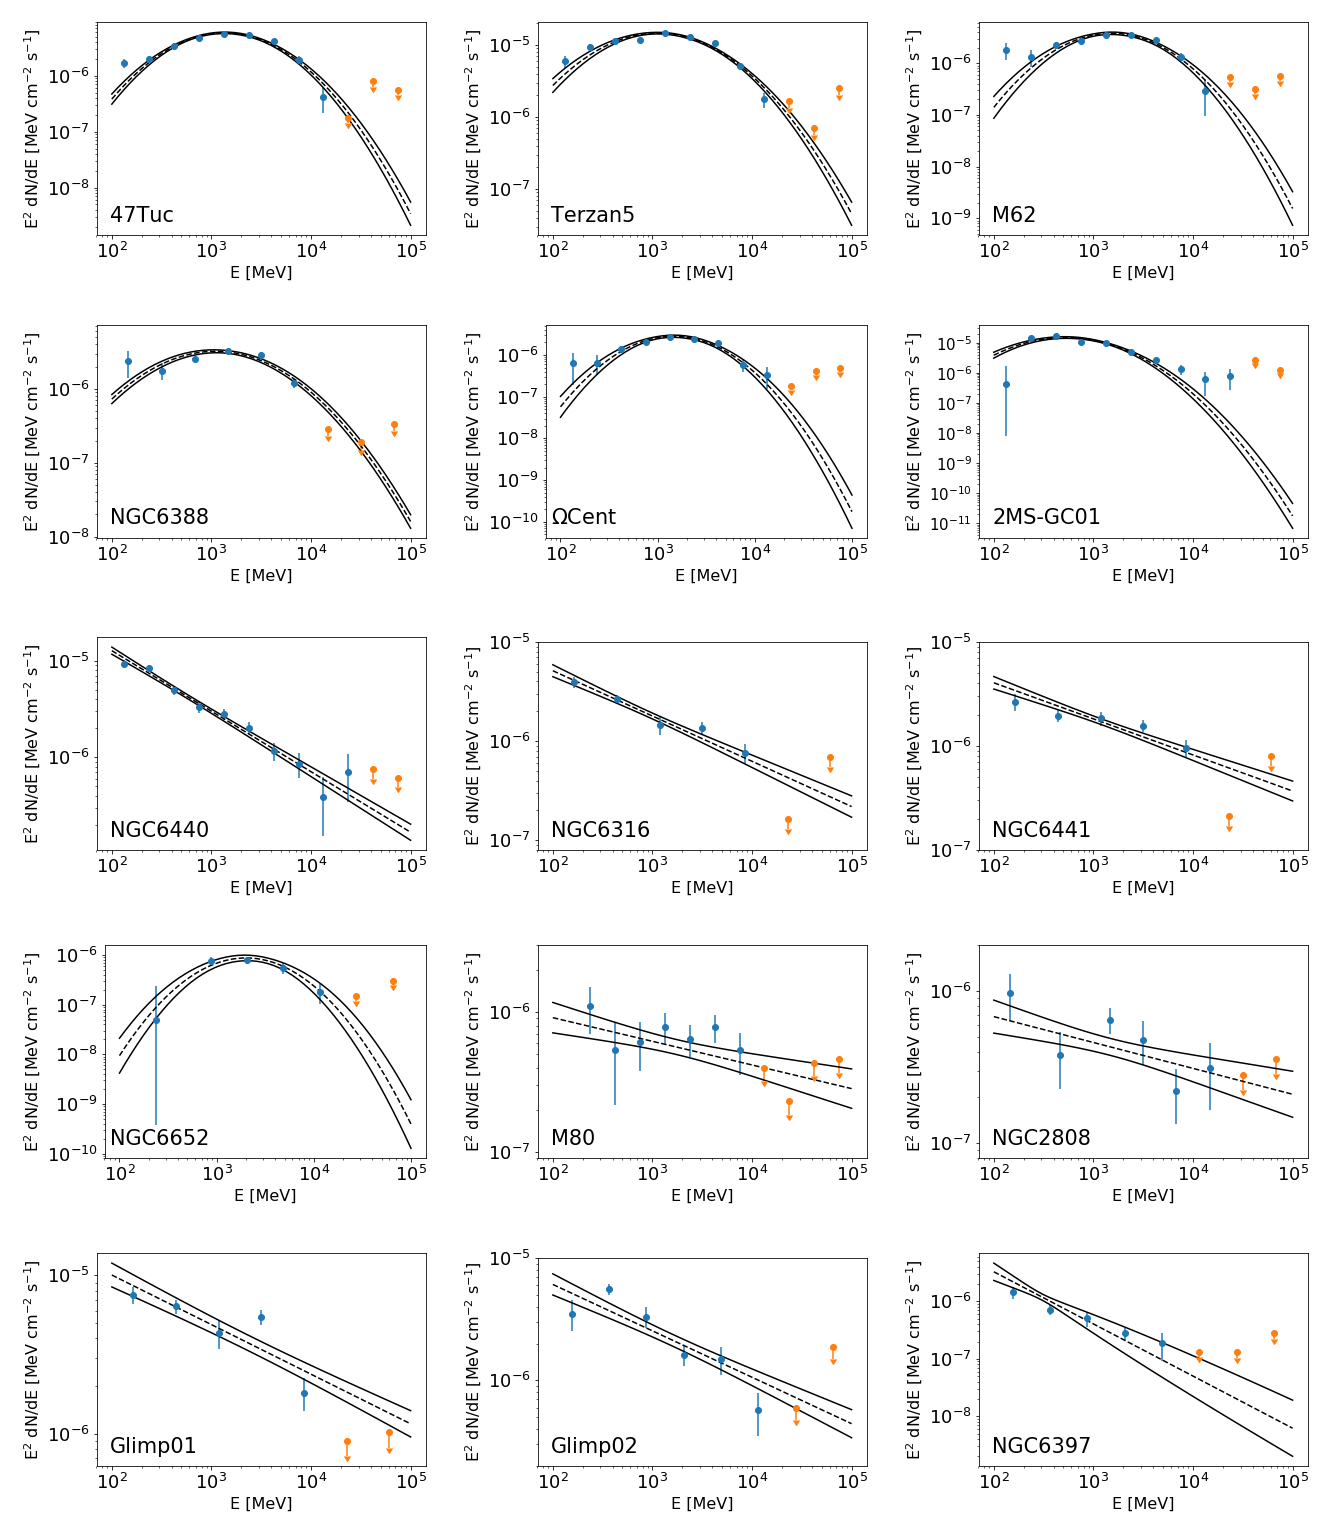
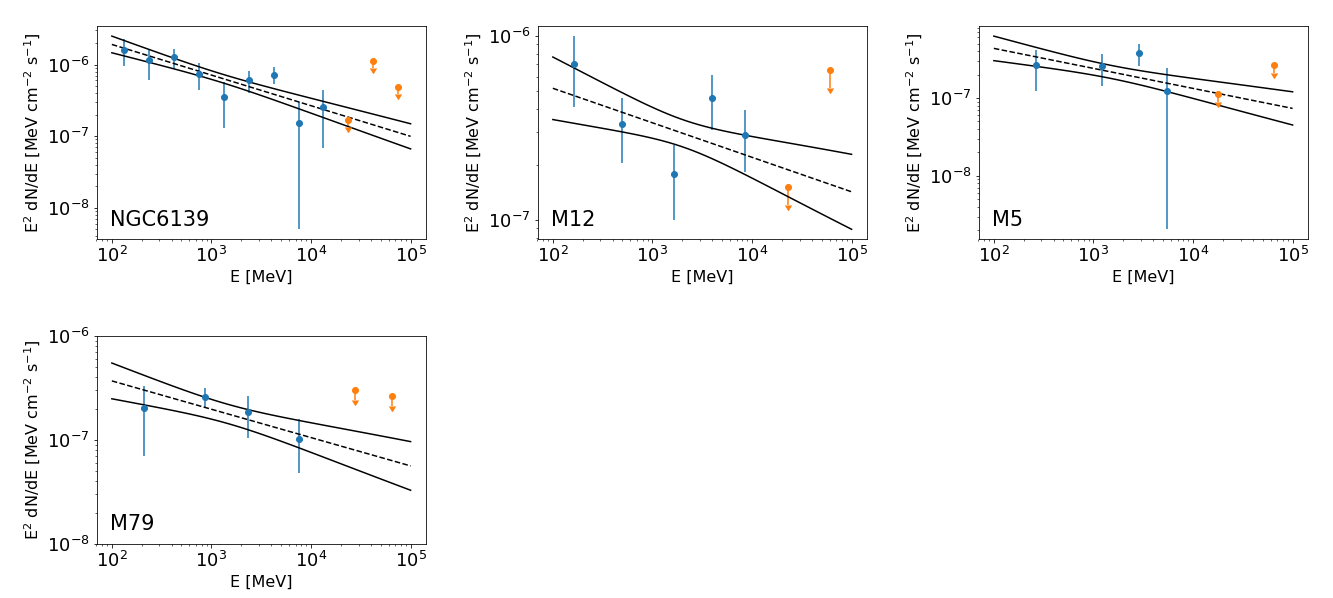
The high energy -ray spectra for 19 of the 23 detected GCs are shown in Figure 9 in Appendix A. All spectra are reasonably well fitted by a Logparabola or a power-law model, in agreement with the GCs discussed in Abdo et al. (2010c). As no significant deviation from such models is observed, the traditional interpretation that the -ray emission observed is coming from populations of MSPs was assumed throughout this work. Other models are discussed below.
One possible mechanism for producing -rays in GCs is inverse Compton scattering (ICS) by a relativistic population of electrons in the intracluster medium (Bednarek & Sitarek, 2007). The spectra derived from such model, however, predict a hardening of the spectrum around 1-10 GeV (Bednarek & Sitarek, 2007; Lloyd et al., 2018). In this work, no strong evidence for a spectral hardening was found in this band (Figure 9).
Although dark matter annihilation has been proposed as another source of -rays in GCs (Brown et al., 2018), the lack of strong dynamical evidence (Moore, 1996; Haşegan et al., 2005) suggests such processes cannot explain the majority of the -ray emission.
The results shown in Figure 2 reduces the possibility of associating the observed -ray emission with cataclysmic variables within the clusters, as such sources are transient in nature (Abdo et al., 2010b) and no significant variability was observed in the analyzed light curves.


3.6 Correlated quantities
Parameters such as the two-body encounter rate and metallicity [Fe/H] are expected to influence the formation rate – and so the total number – of MSPs in a GC (see Section 1). For estimating the total number of MSPs, , within a cluster, a simple calculation was performed (Abdo et al., 2010c):
| (1) |
where is the cluster’s isotropic -ray luminosity, is the average power emitted during the spin down of MSPs and is the average efficiency with which the spin down power is converted into -ray luminosity. The isotropic energy luminosity was simply calculated as , where is the measured energy flux (Table 1) and is the distance to the cluster taken from Harris (1996; 2010 edition). The average spin-down power and average spin-down-to--ray efficiency were adopted as erg s-1 and for all clusters (Abdo et al., 2010c). These values were estimated from comparisons of the distributions of Galactic field MSPs with the accelerated corrected distribution for MSPs in 47 Tucanæ and by the average efficiency of the nearest MSPs to date as described in Abdo et al. (2009). Equation (1) is a rough estimate of , as in some cases may be dominated by the emission of a single MSP (Freire et al., 2011; Tam et al., 2011; Wu et al., 2013). Nevertheless, it should be good enough to at least establish an upper limit for the actual number of MSPs in a GC.
The scatter plots for versus and versus [Fe/H] are shown in Figure 3. For these plots, all -ray bright GCs with data values for metallicity and central luminosity density (needed for calculating ) available in the GLOBCLUST catalog were used. Note that the encounter rate is in arbitrary units and was normalized such that for M62, as done in Abdo et al. (2010c).
A simple linear least-squares regression was performed to the data displayed in Fig. 3. In the upper panel,
| (2) |
where , with a mean deviation of the data about the model of dex and a Pearson correlation coefficient and -value for testing non-correlation of and , respectively. In the bottom panel,
| (3) |
with , , dex, and . Both correlations indicate that the -ray luminosity (or , since ) of a cluster increases with its and/or metallicity.
To test if these correlations are valid for all GCs in the Milky Way, Figure 4 shows the scatter plot. As can be seen, all detected -ray clusters have a relatively large encounter rate, while their metallicities assume very dispersed values. This result may indicate that the magnetic braking effect is not significantly enhanced in metal-rich clusters, having a smaller role in the compact binary system formation rate than previously suggested (Hui et al., 2010b; Tam et al., 2016). Although the metallicity and the (or ) indeed present a correlation, as shown in Figures 3 and 5, the high metallicity may not be interpreted as causing the formation of MSPs (via magnetic braking). If the metallicity increased the MSP formation, then the detections (red dots) in Figure 4 should be concentrated in the upper part of the plot. On the other hand, the presence of MSPs is an indicative of a past full of supernovae explosions, which could enhance the clusters’ environments with metals (see section 4 for a discussion).

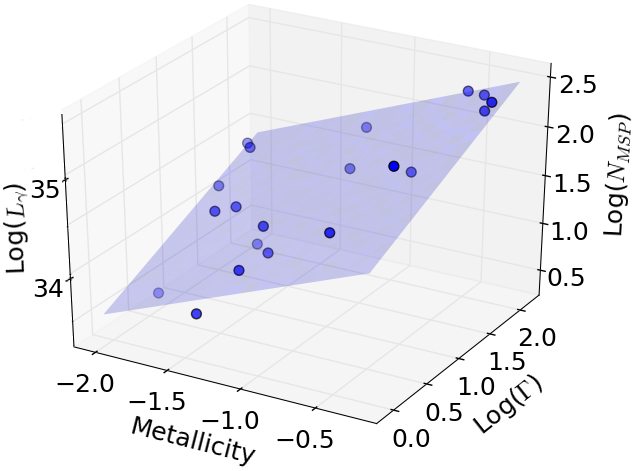
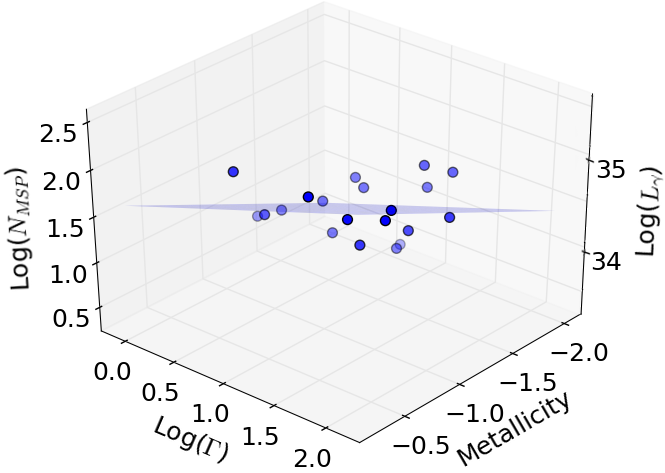
A correlation between , and [Fe/H] in a plane was also explored in a three-dimensional log space. Figure 5 shows the fit from different angles. For testing its goodness of fit, a reduced chi-squared coefficient was calculated, giving . The plane is described by
| (4) |
where , and , with a mean deviation of the data about the model of only dex. In comparison with the fits in Figure 3, the scatter here is smaller, suggesting that a plane is a better description of the data. The advantage of displaying the data in this way is that once two low-energy observables are obtained ( and ), one can roughly constrain the -luminosity of a GC.
Planes relating with and (the soft photon energy density), and with and , were proposed in the past (Hui et al., 2010b), but the data used there was limited to less than 2 years of Fermi-LAT observations, resulting in high dispersion plots.
3.7 Secondary encounters and binary disruption
Besides the observed correlation between and , there are some aspects of the formation and evolution of MSPs not described by , like the effects caused by secondary encounters. Once the binary is formed, it may undergo subsequent encounters, which may disrupt the system or even exchange binary members.
Analogously to the estimation of described in section 1, one can estimate the encounter rate per formed binary as (Verbunt, 2003a; Verbunt & Freire, 2014), where and are the central luminosity density and core radius respectively. In GCs with large values for , the lifetime of binaries should be relatively short () before being disrupted or undergoing an exchange. The evolution of LMXBs in such clusters may be interrupted before their neutron stars become completely recycled, which may affect their overall population of MSPs. This behavior is perhaps what is seen in Figure 6, where a drop in is evident for very large values of (normalized such that for M62). The high values for NGC 6752 and NGC 6397 can also explain why these clusters have such low -ray luminosity and appear as outliers in Figure 3.
Interestingly, GCs with intermediate values for are those with the largest populations of MSPs (Figure 6). This suggests that MSPs are preferentially formed in secondary exchange encounters, as only clusters with intermediate or high are likely to host pulsar binaries formed in this way (Verbunt & Freire, 2014).
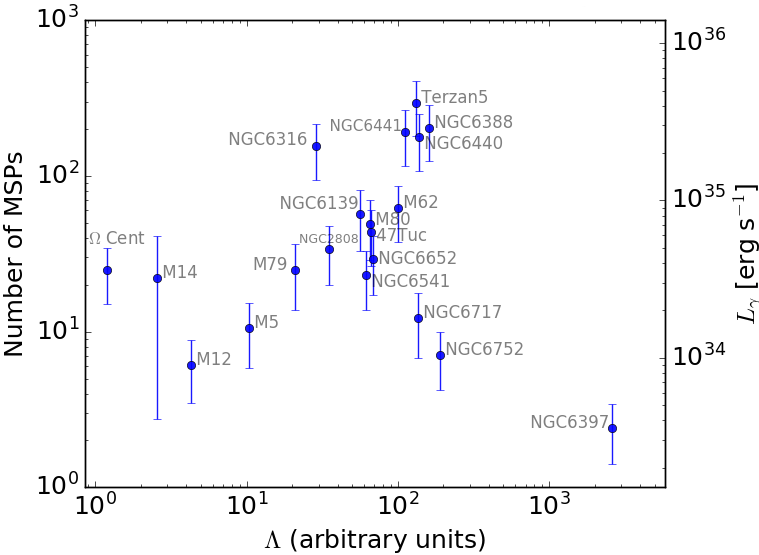
High values for may also be the explanation for many of the non-detections shown in Figure 4. Many of the clusters with high , which are roughly expected to be -ray bright, also have high , which may negatively affect their MSP population. Non-detected clusters with are plotted in dark blue in Figure 4.
4 Discussion
4.1 Connection between GCs and UCDs
Ultra-compact dwarf galaxies (UCDs) are a class of stellar system much brighter and more massive than typical globular clusters, but slightly more extended (Drinkwater et al., 2003). Similarities between both classes of objects are extensively discussed in literature (Mieske et al., 2002; Drinkwater et al., 2004; Forbes et al., 2008), where UCDs are treated as a link between GCs and dwarf galaxies, with the possible presence of dark matter in UCDs being the main difference between them (Haşegan et al., 2005). Taking advantage of these similarities, a tentative estimate of the -ray emission for a couple of UCDs was performed.
To have an idea of their -ray luminosities, some of the densest known UCDs were chosen: M59-UCD3 (Liu et al., 2015) and M85-HCC1 (Sandoval et al., 2015) and the correlation discussed in section 3 was applied. Using their central luminosity densities and core radii (the core radius was assumed here as , the half-light radius, which is very close to the mean value for the ratio in GLOBCLUST catalog) given by Sandoval et al. (2015), their values for and then were estimated (Table 3). Despite M85-HCC1 presenting a value for beyond the fitted range of Figure 3, it was assumed that the correlation was still valid at least as a first approximation. To estimate their energy fluxes, isotropic emission was assumed and the distances to M59 and M85 were taken from Blakeslee et al. (2009). Despite their high luminosity, these compact galaxies are so far away that their energy fluxes are extremely low, not detectable by the Fermi-LAT.
| UCD | Luminosity | Energy flux | Distance | |
|---|---|---|---|---|
| erg s-1 | erg cm-2s-1 | Mpc | ||
| M59-UCD3 | 1.8 | 6.7 | 123 | |
| M85-HCC1 | 13 | 34 | 2848 |
These estimations, although naive, may be important in the future when looking for very faint signals as, for example, dark matter annihilation lines in galaxy clusters crowded with UCDs, like Virgo (Jones et al., 2006) and Abell 1689 (Mieske et al., 2004), or even in individual dwarf elliptical galaxies. Searches like these were performed in recent years (Ackermann et al., 2010; Ando & Nagai, 2012; Ackermann et al., 2015a, b) where interesting upper limits for dark matter annihilation models were found.
4.2 The driving mechanism behind MSP formation
In a scenario where the magnetic braking effect is significantly enhanced by a metal-rich environment, high -ray fluxes should be seen for clusters with high metallicities; but this is not observed in Figure 4, which shows that metal-rich clusters are not necessarily efficient -ray emitters. This result suggests that a higher metallicity does not imply a significantly larger magnetic braking effect (and thus a higher MSP formation rate). Hypotheses for explaining the high metallicities in clusters crowded with MSP may be related to the feedback of MSPs or their progenitors within the clusters environment.
At least 5 of the 23 clusters described in this work ( Cen, NGC 2808, NGC 6397, NGC 6752 and M5) are abundant in Calcium (Lee et al., 2009). Calcium and other heavy elements can only be supplied to these systems via supernovae explosions (Timmes et al., 1995). As the gravitational potential well in present day clusters cannot retain most of the ejecta from such explosions (Baumgardt et al., 2008), it has been suggested by Lee et al. (2009) that these GCs are most likely relics of what were once the nuclei of primordial dwarf galaxies accreted and disrupted by the Milky Way (Bica et al., 2006). This supernova enrichment hypothesis is also supported by some GCs formation models, where stellar winds and supernova ejecta within proto-GCs are decelerated to speeds below the clusters’ escape velocity by the pressure of the surrounding hot gas in which they are embedded (Brown et al., 1991). The metallicity of a cluster, in this context, is simply a function of its total number of supernovae (and not necessarily ).
5 Conclusions
Nine years of Fermi LAT data were analyzed, revealing GC candidates characterized by quiescent -ray emission spatially coincident with the optical centers of the clusters. The novelty of this work is mainly:
-
•
Evidence that metallicity does not have a significant impact on the MSPs formation. If a metal-rich environment was one of the causes of MSP formation (enhancing the magnetic braking), a concentration of detections (red dots) should be seen in the upper part of Figure 4. The results indicate that the MSP formation may be dominated by the encounter rate and encounter rate per binary rather than by an enhanced magnetic braking effect.
-
•
It was the first time that the encounter rate per formed binary () was analyzed in conjunction with the -ray luminosity (Figure 6). The resulting insight was that if is very high, binary systems will get destroyed before having time to evolve into a MSP, so impacting the total number of MSPs in a GC.
-
•
The characterization of a clean sample of 23 -ray bright GC, where 2 of them (M14 and M79) have never been reported before, as well as upper limits on energy flux for all remaining GCs in the Milky Way.
-
•
No detected cluster presented extended emission; all of them are point-like sources spatially in agreement with the optical core of the GCs. It was confirmed (for the first time in -rays) the X-rays results of heavier objects sinking into the clusters’ cores via dynamical friction.
Acknowledgements
We acknowledge useful discussions with Paulo C. C. Freire, Matthew Kerr, Philippe Bruel, Heitor Ernandes, Ana Chies Santos and Beatriz Barbuy. We thank the anonymous referee for constructive comments which helped to improve the manuscript. This work was supported by CNPq and FAPESP (Fundação de Amparo à Pesquisa do Estado de São Paulo, grants 2016/25484-9 and 2017/01461-2).
The Fermi LAT Collaboration acknowledges generous ongoing support from a number of agencies and institutes that have supported both the development and the operation of the LAT as well as scientific data analysis. These include the National Aeronautics and Space Administration and the Department of Energy in the United States, the Commissariat à l’Energie Atomique and the Centre National de la Recherche Scientifique / Institut National de Physique Nucléaire et de Physique des Particules in France, the Agenzia Spaziale Italiana and the Istituto Nazionale di Fisica Nucleare in Italy, the Ministry of Education, Culture, Sports, Science and Technology (MEXT), High Energy Accelerator Research Organization (KEK) and Japan Aerospace Exploration Agency (JAXA) in Japan, and the K. A. Wallenberg Foundation, the Swedish Research Council and the Swedish National Space Board in Sweden.
Additional support for science analysis during the operations phase is gratefully acknowledged from the Istituto Nazionale di Astrofisica in Italy and the Centre National d’Études Spatiales in France. This work performed in part under DOE Contract DE-AC02-76SF00515.
References
- Abdo et al. (2009) Abdo A., et al., 2009, science, 325, 845
- Abdo et al. (2010a) Abdo A., et al., 2010a, The Astrophysical Journal Supplement Series, 187, 460
- Abdo et al. (2010b) Abdo et al., 2010b, Science, 329, 817
- Abdo et al. (2010c) Abdo A., et al., 2010c, Astronomy & Astrophysics, 524, A75
- Acero et al. (2015) Acero F., et al., 2015, ApJS, 218, 23
- Ackermann et al. (2010) Ackermann M., et al., 2010, Journal of Cosmology and Astroparticle Physics, 2010, 025
- Ackermann et al. (2015a) Ackermann M., et al., 2015a, Physical Review Letters, 115, 231301
- Ackermann et al. (2015b) Ackermann M., et al., 2015b, The Astrophysical Journal, 812, 159
- Alpar et al. (1982) Alpar M., Cheng A., Ruderman M., Shaham J., 1982, Nature, 300, 728
- Ando & Nagai (2012) Ando S., Nagai D., 2012, Journal of Cosmology and Astroparticle Physics, 2012, 017
- Arons (1983) Arons J., 1983, The Astrophysical Journal, 266, 215
- Atwood et al. (2013) Atwood W., et al., 2013, arXiv preprint arXiv:1303.3514
- Bahramian et al. (2013) Bahramian A., Heinke C. O., Sivakoff G. R., Gladstone J. C., 2013, The Astrophysical Journal, 766, 136
- Baumgardt et al. (2008) Baumgardt H., Kroupa P., Parmentier G., 2008, Monthly Notices of the Royal Astronomical Society, 384, 1231
- Bednarek & Sitarek (2007) Bednarek W., Sitarek J., 2007, Monthly Notices of the Royal Astronomical Society, 377, 920
- Bica et al. (2006) Bica E., Bonatto C., Barbuy B., Ortolani S., 2006, Astronomy & Astrophysics, 450, 105
- Blakeslee et al. (2009) Blakeslee J. P., et al., 2009, The Astrophysical Journal, 694, 556
- Brown et al. (1991) Brown J., Burkert A., Truran J. W., 1991, The Astrophysical Journal, 376, 115
- Brown et al. (2018) Brown A. M., Lacroix T., Lloyd S., Bœhm C., Chadwick P., 2018, Physical Review D, 98, 041301
- Caraveo (2014) Caraveo P. A., 2014, Annual Review of Astronomy and Astrophysics, 52, 211
- Chen (1991) Chen K., 1991, Nature, 352, 695
- Cheng et al. (1986) Cheng K., Ho C., Ruderman M., 1986, The Astrophysical Journal, 300, 500
- Drinkwater et al. (2003) Drinkwater M. J., Gregg M. D., Hilker M., Bekki K., Couch W. J., Ferguson H. C., Jones J. B., Phillipps S., 2003, Nature, 423, 519
- Drinkwater et al. (2004) Drinkwater M. J., Gregg M. D., Couch W. J., Ferguson H. C., Hilker M., Jones J. B., Karick A., Phillipps S., 2004, Publications of the Astronomical Society of Australia, 21, 375
- Edmonds et al. (2003) Edmonds P. D., Gilliland R. L., Heinke C. O., Grindlay J. E., 2003, The Astrophysical Journal, 596, 1197
- Forbes et al. (2008) Forbes D. A., Lasky P., Graham A. W., Spitler L., 2008, Monthly Notices of the Royal Astronomical Society, 389, 1924
- Fregeau et al. (2003) Fregeau J. M., Gürkan M., Joshi K., Rasio F., 2003, The Astrophysical Journal, 593, 772
- Freire (2012) Freire P. C., 2012, Proceedings of the International Astronomical Union, 8, 243
- Freire et al. (2011) Freire P., et al., 2011, Science, 334, 1107
- Harding et al. (1978) Harding A. K., Tademaru E., Esposito L., 1978, The Astrophysical Journal, 225, 226
- Harding et al. (2005) Harding A. K., Usov V. V., Muslimov A. G., 2005, The Astrophysical Journal, 622, 531
- Harris (1996) Harris W. E., 1996, The Astronomical Journal, 112, 1487
- Haşegan et al. (2005) Haşegan M., et al., 2005, The Astrophysical Journal, 627, 203
- Heinke et al. (2005) Heinke C. O., Grindlay J. E., Edmonds P. D., Cohn H. N., Lugger P. M., Camilo F., Bogdanov S., Freire P. C., 2005, The Astrophysical Journal, 625, 796
- Hooper & Linden (2016) Hooper D., Linden T., 2016, Journal of Cosmology and Astroparticle Physics, 2016, 018
- Hui et al. (2010a) Hui C., Cheng K., Taam R. E., 2010a, The Astrophysical Journal, 714, 1149
- Hui et al. (2010b) Hui C., Cheng K., Wang Y., Tam P., Kong A., Chernyshov D., Dogiel V., 2010b, The Astrophysical Journal, 726, 100
- Johnson et al. (2013) Johnson T. J., et al., 2013, The Astrophysical Journal, 778, 106
- Jones et al. (2006) Jones J. B., et al., 2006, The Astronomical Journal, 131, 312
- Kelly (2007) Kelly B. C., 2007, ApJ, 665, 1489
- Lee et al. (2009) Lee J.-W., Kang Y.-W., Lee J., Lee Y.-W., 2009, Nature, 462, 480
- Liu et al. (2015) Liu C., et al., 2015, The Astrophysical Journal Letters, 812, L2
- Lloyd et al. (2018) Lloyd S. J., Chadwick P. M., Brown A. M., 2018, Monthly Notices of the Royal Astronomical Society, 480, 4782
- Lorimer (2001) Lorimer D. R., 2001, Living Reviews in Relativity, 4, 5
- Lorimer et al. (2005) Lorimer D., Kramer M., Ellis R., Huchra J., Kahn S., Rieke G., Stetson P., 2005, Cambridge Observing Handbooks for Research Astronomers
- Mattox et al. (1996) Mattox J. R., et al., 1996, The Astrophysical Journal, 461, 396
- McGlynn et al. (1998) McGlynn T., Scollick K., White N., 1998, in Symposium-International Astronomical Union. pp 465–466
- Michelson et al. (1994) Michelson P., et al., 1994, The Astrophysical Journal, 435, 218
- Mieske et al. (2002) Mieske S., Hilker M., Infante L., 2002, Astronomy & Astrophysics, 383, 823
- Mieske et al. (2004) Mieske S., et al., 2004, The Astronomical Journal, 128, 1529
- Moore (1996) Moore B., 1996, The Astrophysical Journal Letters, 461, L13
- Pooley et al. (2003) Pooley D., et al., 2003, The Astrophysical Journal Letters, 591, L131
- Sandoval et al. (2015) Sandoval M. A., et al., 2015, The Astrophysical Journal Letters, 808, L32
- Sturrock (1971) Sturrock P., 1971, The Astrophysical Journal, 164, 529
- Tam et al. (2011) Tam P., Kong A., Hui C., Cheng K., Li C., Lu T.-N., 2011, The Astrophysical Journal, 729, 90
- Tam et al. (2016) Tam P.-H. T., Hui C. Y., Kong A. K., 2016, Journal of Astronomy and Space Sciences, 33, 1
- Timmes et al. (1995) Timmes F., Woosley S., Weaver T. A., 1995, Astrophysical Journal Supplement Series, 98
- Verbunt (2003a) Verbunt F., 2003a, G. Piotto, G. Meylan, SG Djorgovski, & M. Riello (San Francisco, CA: ASP), 245
- Verbunt (2003b) Verbunt F., 2003b, in New Horizons in Globular Cluster Astronomy. p. 245
- Verbunt & Freire (2014) Verbunt F., Freire P. C., 2014, Astronomy & Astrophysics, 561, A11
- Wood et al. (2017) Wood M., Caputo R., Charles E., Di Mauro M., Magill J., et al., 2017, arXiv preprint arXiv:1707.09551
- Wu et al. (2013) Wu J., Hui C., Wu E., Kong A., Huang R., Tam P., Takata J., Cheng K., 2013, The Astrophysical Journal Letters, 765, L47
- Zhang et al. (2016) Zhang P., Xin Y., Fu L., Zhou J., Yan J., Liu Q., Zhang L., 2016, Monthly Notices of the Royal Astronomical Society, 459, 99
Appendix A Upper limits and TS residuals maps for non-detected GC
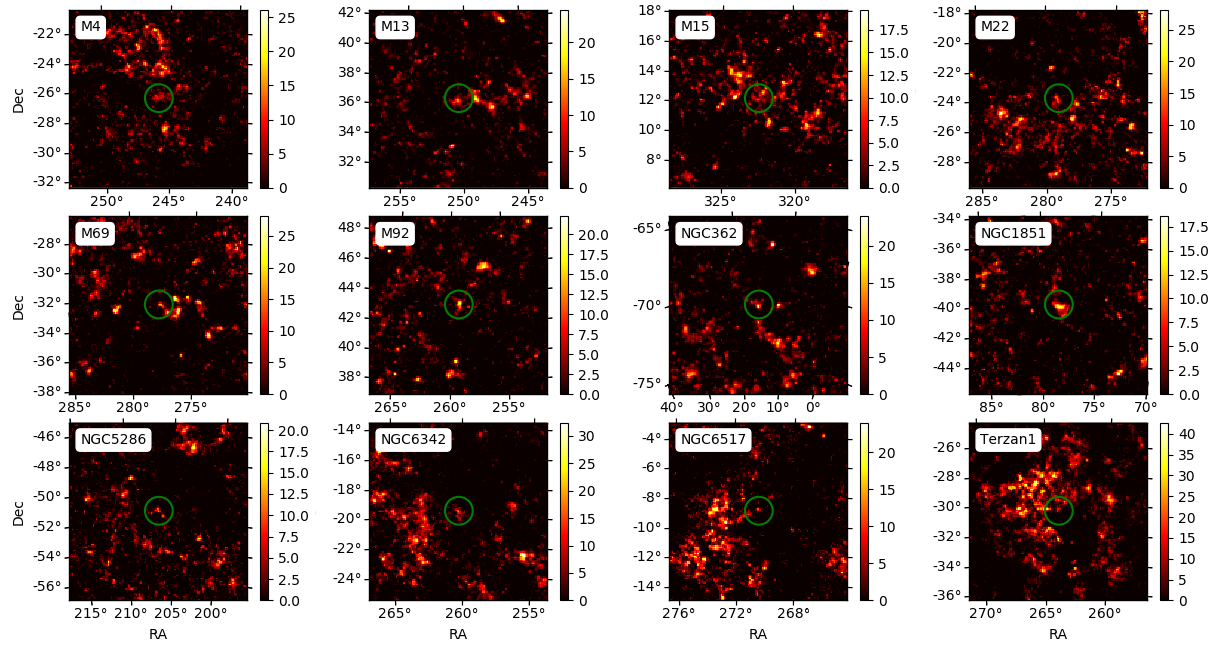
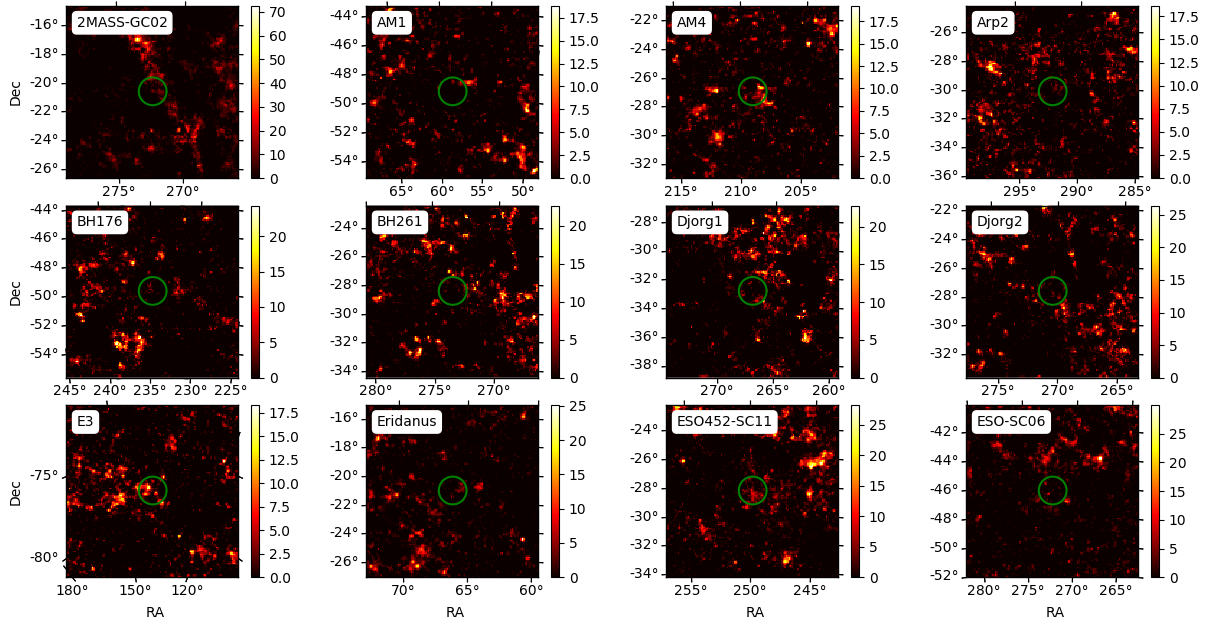
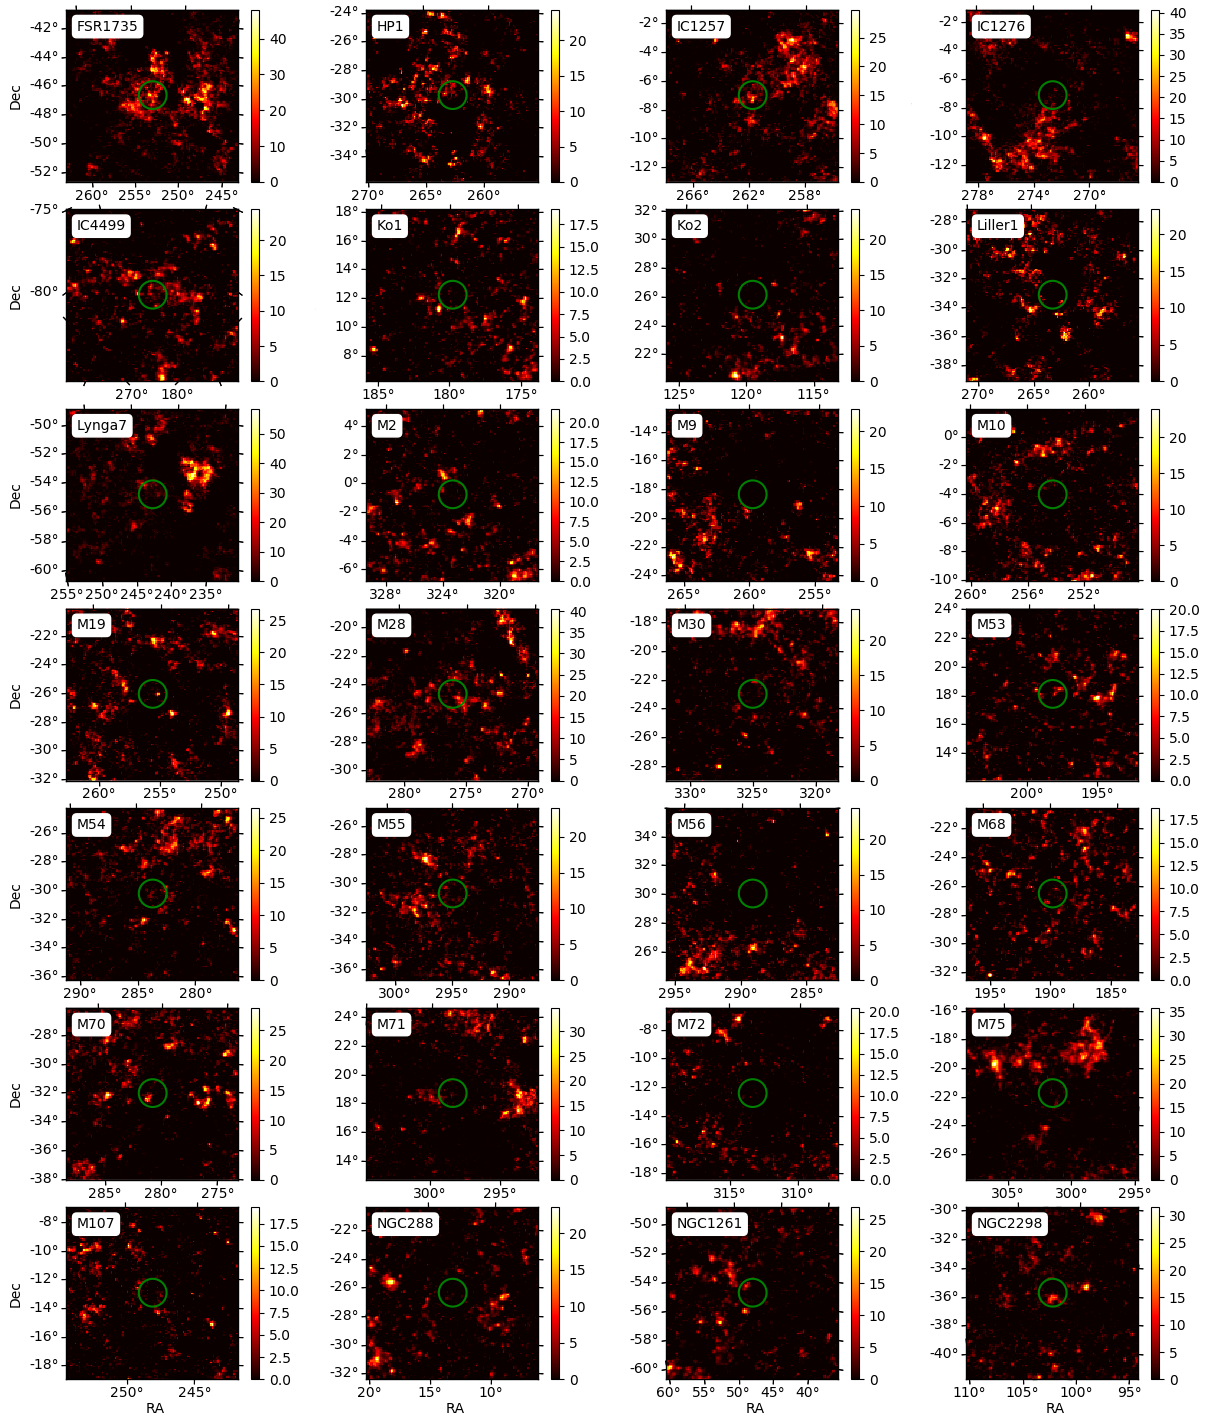
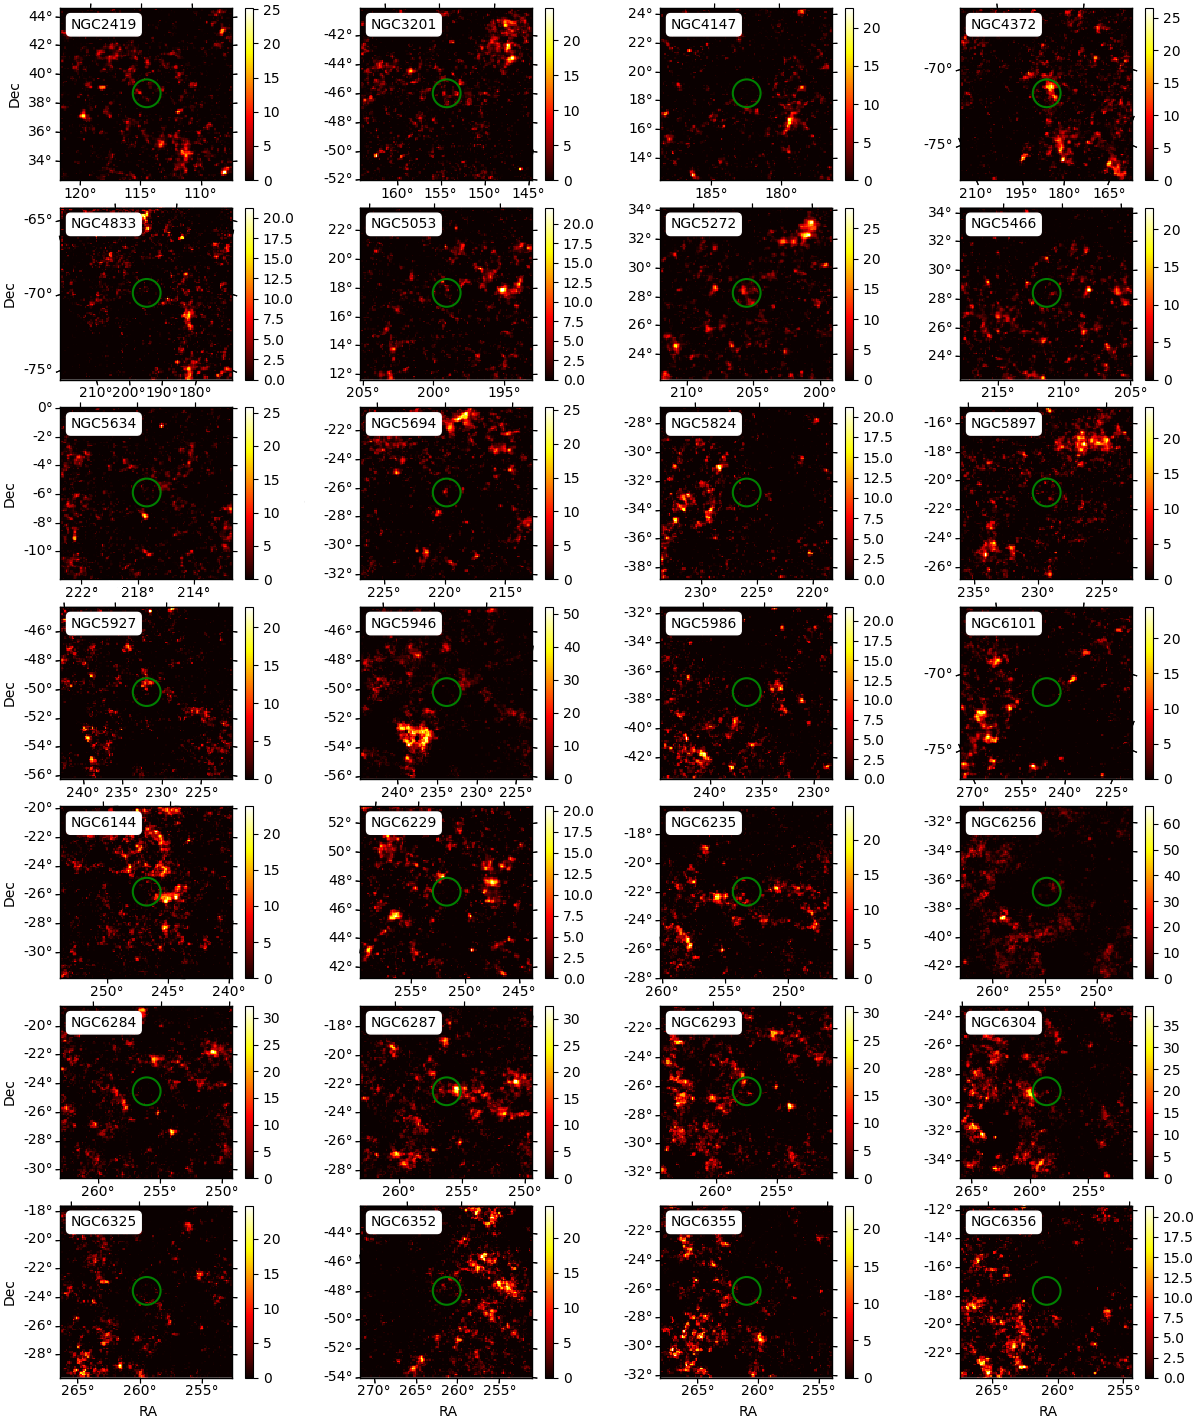
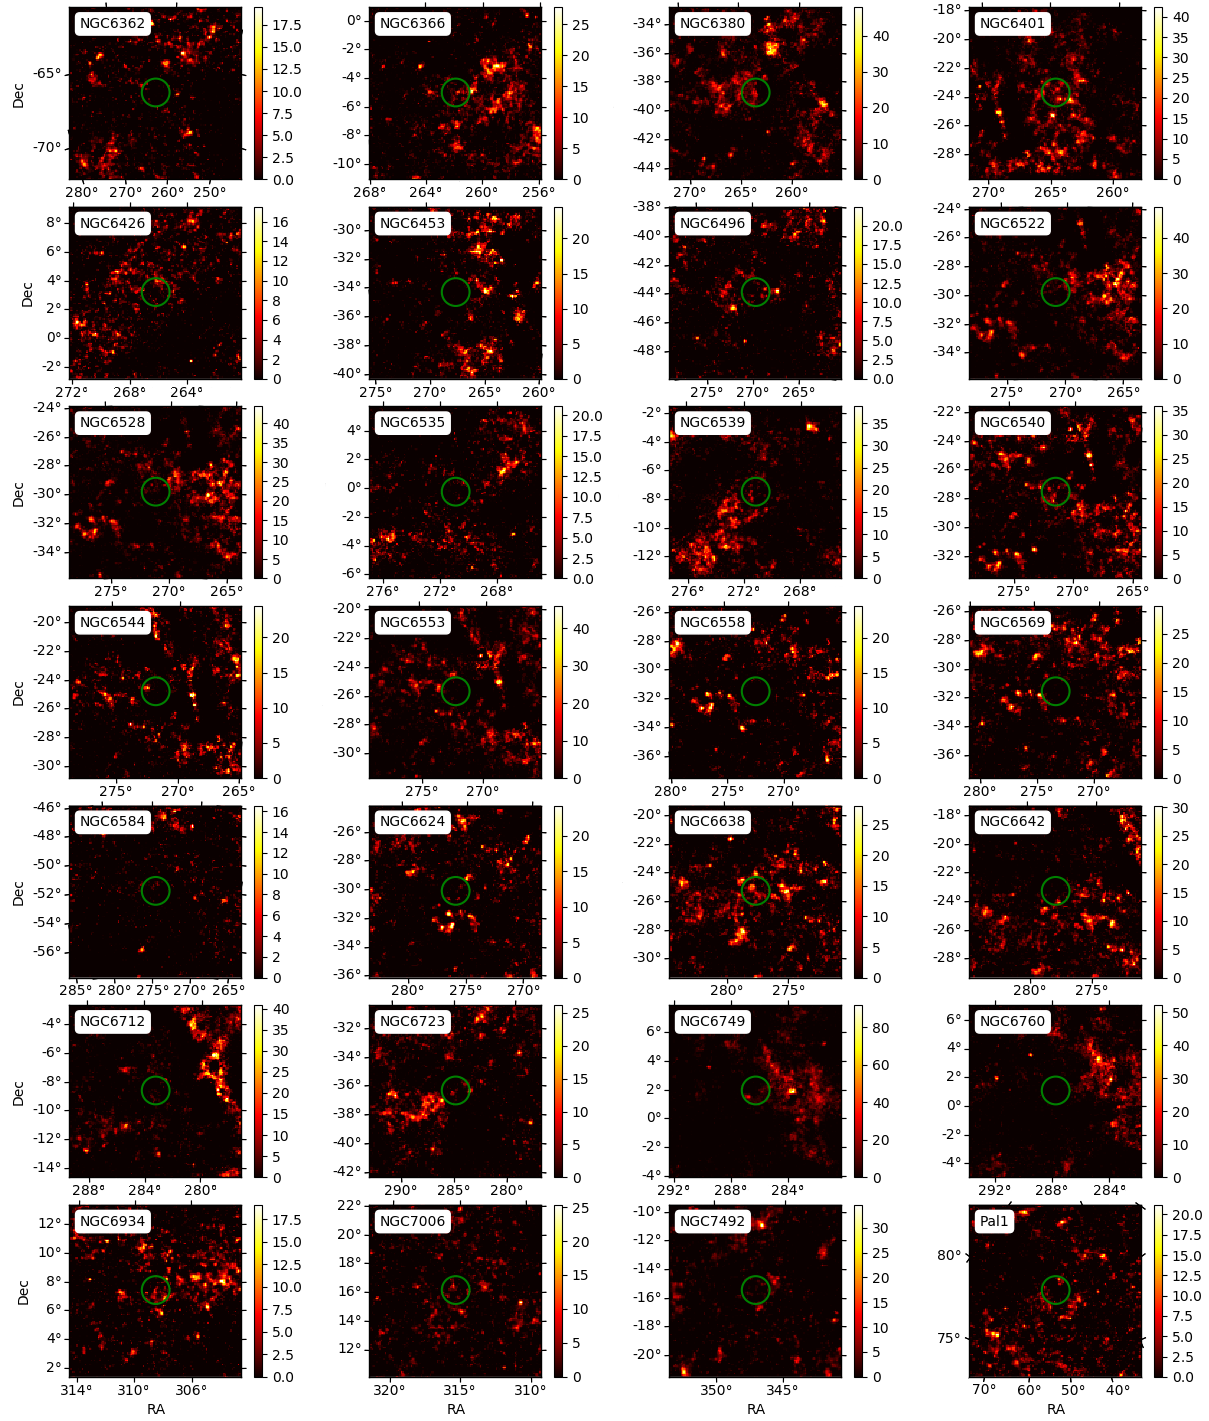
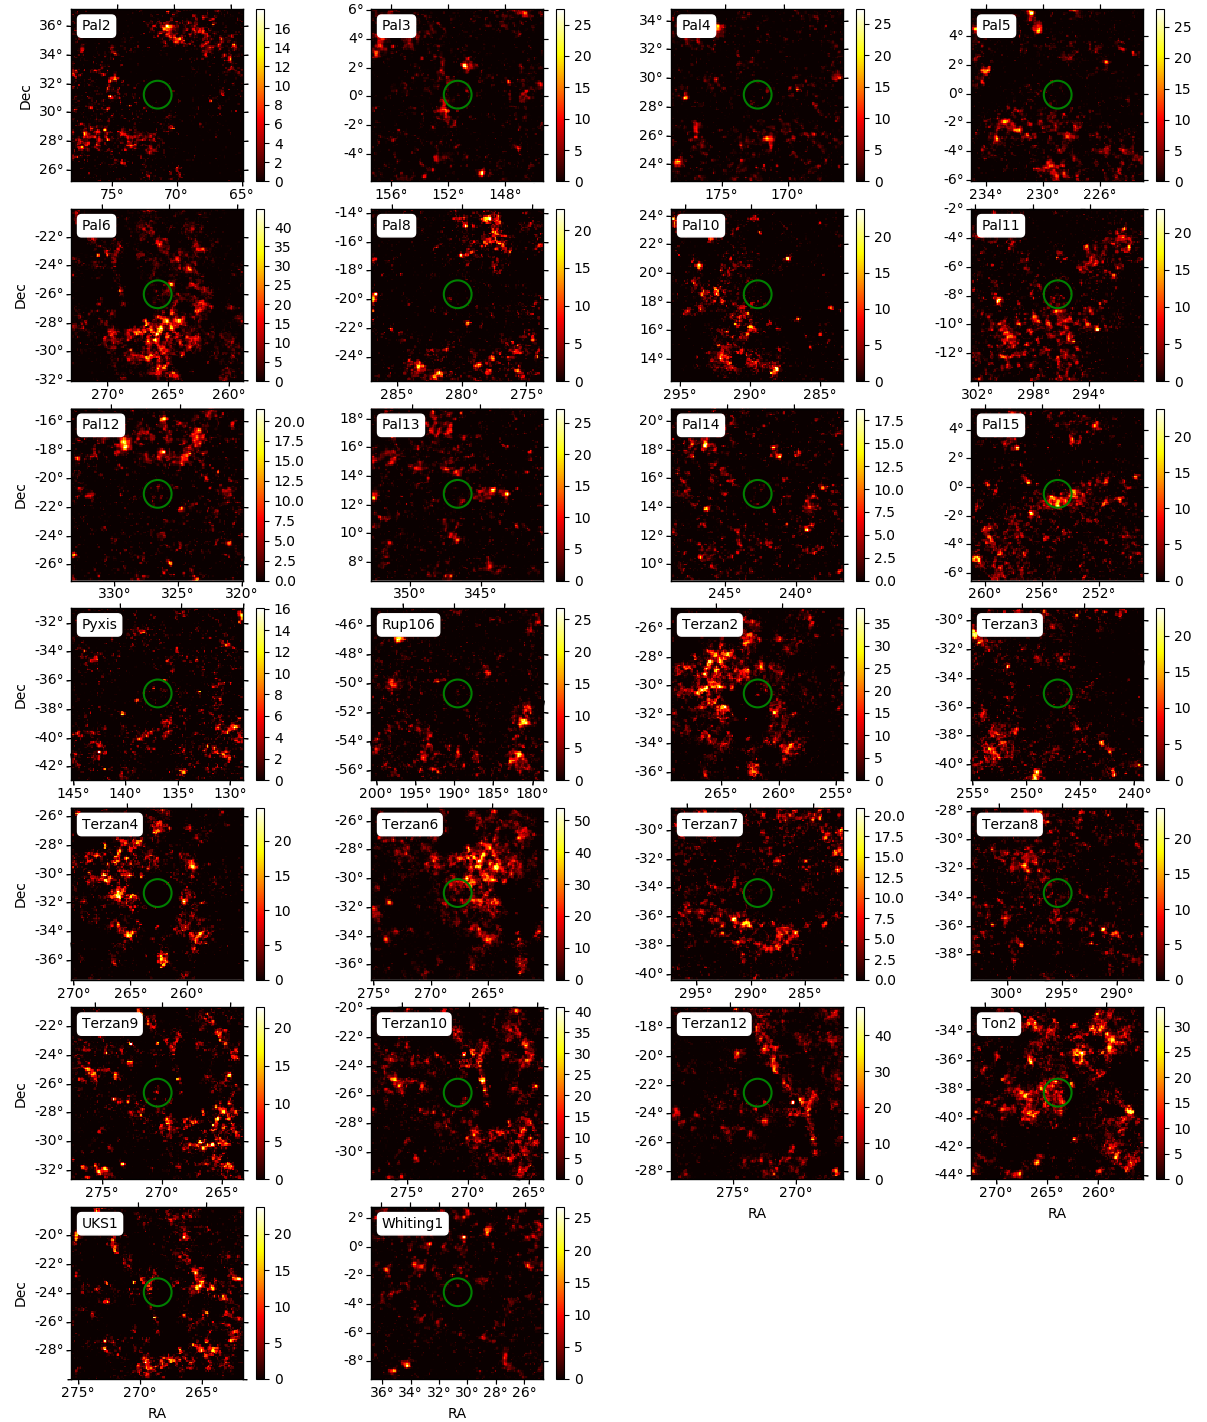
TS residuals maps for all non-detected GCs are presented below, where the chosen test source was point-like, with an index 2 power-law spectrum. Maps presenting an isolated emission coincident with the optical position of a GC with are shown in Figure 7. These weak signals will probably be associated with GCs with a reasonable significance () within the next few years. All other non-detected GCs in the Milky Way presented or are surrounded by several point-sources with similar significance, making them hard to distinguish. These clusters are shown in Figure 8. Energy flux upper limits with 95% confidence levels and integrated over the whole analysis energy range are provided in Tables 4 and 5, where the sources were assumed to have a power-law spectrum with a spectral index fixed at 2. A few of the sources described below are associated with globular clusters very close to the detection threshold in the preliminary LAT 8-year point source list 666https://fermi.gsfc.nasa.gov/ssc/data/access/lat/fl8y/ (FL8Y) and will likely be part of the 4th Fermi-LAT catalog (4FGL, in preparation). The reason why these sources have TS slightly above the threshold in FL8Y is likely related to the different likelihood method used for creating the catalog (weighted likelihood).
The -ray spectra for 19 GCs, as discussed in Section 3.5, are shown in Figure 9. The spectra of only 4 of the 23 detected clusters were not included, all of them due to problems with low statistics or difficult sky positions. The clusters detected with high significance in -rays are mainly dominated by a logparabola spectral shape, while for the low-significance ones, the logparabola model is not statistically preferred over a power-law. The spectra of 2MASS-GC01, Glimpse 01 and Glimpse 02 may have significant contamination from the Galactic diffuse emission, as these GCs are localized very close to the Galactic plane. The 19 spectra were obtained using the fermipy function sed()777https://fermipy.readthedocs.io/en/latest/advanced/sed.html, which computes the -ray spectra by performing independent fits for the flux normalization of a source in logarithmic spaced bins of energy (from 100 MeV up to 100 GeV in this case).
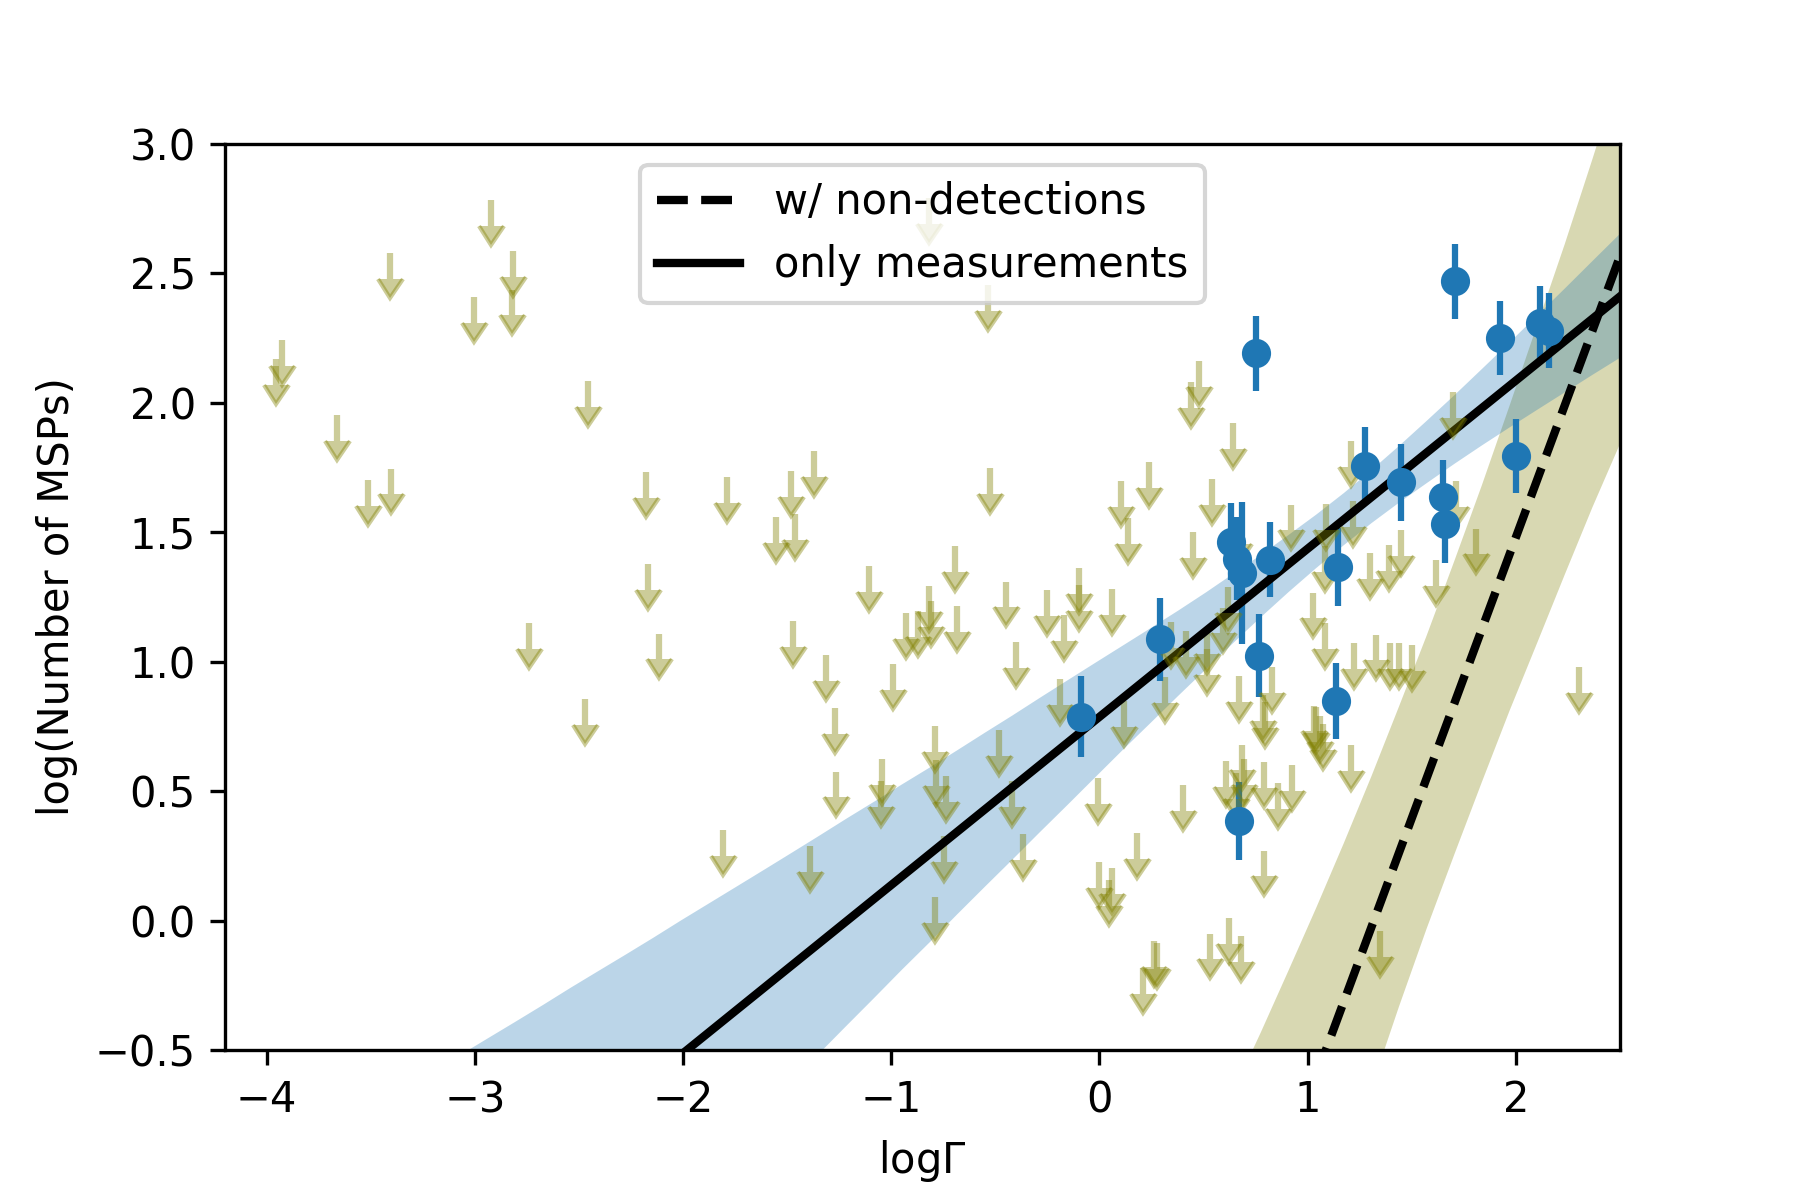
In section 3.6 a linear regression was performed taking into account only the measurements of and (cf. Fig. 3a). In order to quantify the impact of the non-detections on the results, the Python port of the LINMIX_ERR package888https://github.com/jmeyers314/linmix was used. LINMIX_ERR is a Bayesian linear regression method that takes into account both measurement errors and non-detections (Kelly, 2007). The fit incorporating upper limits is given by
| (5) |
which should be compared with the fit incorporating only measured values (cf. section 3.6),
| (6) |
Given that non-detections outnumber the detections by a factor of , it is not surprising that the two fits are considerably different from each other, as can be seen in Figure 10. The fit involving only the detections is in good agreement with what is observed in X-rays and -rays for LMXBs and MSPs in previous works (Pooley et al., 2003; Abdo et al., 2010c; Hooper & Linden, 2016), while the fit incorporating upper limits seems to underestimate the results in these works, giving a much lower number of MSPs per GC. This may be related to the high values of found for many of these non-detections, which may diminish the expected -ray flux even if the source has a large value for (see section 3.7 for details).
| Cluster | Upper limit | TS |
|---|---|---|
| erg cm-2s-1 | ||
| 2MASS-GC02 | 129.6 | 18 |
| AM1 | 32.0 | 0 |
| AM4 | 20.3 | 5 |
| Arp2 | 8.2 | 1 |
| BH176 | 18.2 | 1 |
| BH261 | 6.0 | 0 |
| Djorg1 | 7.6 | 0 |
| Djorg2 | 26.4 | 3 |
| E3 | 13.1 | 4 |
| Eridanus | 5.7 | 0 |
| ESO452-SC11 | 40.9 | 14 |
| ESO-SC06 | 10.1 | 1 |
| FSR1735 | 86.2 | 23 |
| HP1 | 35.1 | 1 |
| IC1257 | 41.1 | 14 |
| IC1276 | 84.1 | 4 |
| IC4499 | 22.2 | 7 |
| Ko1 | 4.7 | 0 |
| Ko2 | 1.7 | 0 |
| Liller1 | 8.5 | 0 |
| Lynga7 | 107.4 | 3 |
| M2 | 6.1 | 0 |
| M4 | 54.3 | 24 |
| M9 | 1.7 | 0 |
| M10 | 5.1 | 0 |
| M13 | 32.3 | 23 |
| M15 | 36.4 | 9 |
| M19 | 10.5 | 0 |
| M22 | 48.6 | 23 |
| M28 | 47.1 | 4 |
| M30 | 12.8 | 1 |
| M53 | 18.7 | 5 |
| M54 | 18.8 | 3 |
| M55 | 23.2 | 6 |
| M56 | 2.2 | 0 |
| M68 | 18.6 | 14 |
| M69 | 25.2 | 8 |
| M70 | 17.2 | 4 |
| M71 | 31.6 | 19 |
| M72 | 1.5 | 0 |
| M75 | 11.5 | 1 |
| M92 | 32.3 | 18 |
| M107 | 6.3 | 0 |
| NGC288 | 5.7 | 0 |
| NGC362 | 19.2 | 16 |
| NGC1261 | 10.4 | 7 |
| NGC1851 | 20.3 | 17 |
| NGC2298 | 28.8 | 14 |
| NGC2419 | 10.9 | 7 |
| NGC3201 | 17.4 | 3 |
| NGC4147 | 4.9 | 0 |
| NGC4372 | 35.1 | 10 |
| NGC4833 | 4.0 | 0 |
| NGC5053 | 9.5 | 1 |
| NGC5272 | 15.2 | 8 |
| NGC5286 | 35.6 | 15 |
| NGC5466 | 6.0 | 0 |
| NGC5634 | 3.6 | 0 |
| NGC5694 | 14.2 | 5 |
| NGC5824 | 3.3 | 0 |
| NGC5897 | 8.2 | 0 |
| NGC5927 | 12.5 | 0 |
| NGC5946 | 8.0 | 0 |
| NGC5986 | 3.7 | 0 |
| NGC6101 | 3.3 | 0 |
| NGC6144 | 6.3 | 0 |
| NGC6229 | 1.8 | 0 |
| Cluster | Upper limit | TS |
|---|---|---|
| erg cm-2s-1 | ||
| NGC6235 | 4.9 | 0 |
| NGC6256 | 45.9 | 1 |
| NGC6284 | 2.1 | 0 |
| NGC6287 | 43.2 | 12 |
| NGC6293 | 15.7 | 1 |
| NGC6304 | 32.9 | 6 |
| NGC6325 | 7.9 | 0 |
| NGC6342 | 32.3 | 21 |
| NGC6352 | 6.4 | 0 |
| NGC6355 | 2.6 | 0 |
| NGC6356 | 2.2 | 0 |
| NGC6362 | 2.5 | 0 |
| NGC6366 | 20.8 | 2 |
| NGC6380 | 84.9 | 21 |
| NGC6401 | 128.4 | 11 |
| NGC6426 | 4.3 | 0 |
| NGC6453 | 3.0 | 0 |
| NGC6496 | 3.2 | 0 |
| NGC6517 | 34.6 | 6 |
| NGC6522 | 53.3 | 1 |
| NGC6528 | 54.1 | 3 |
| NGC6535 | 5.8 | 0 |
| NGC6539 | 11.3 | 0 |
| NGC6540 | 60.4 | 5 |
| NGC6544 | 12.1 | 0 |
| NGC6553 | 29.3 | 4 |
| NGC6558 | 2.2 | 0 |
| NGC6569 | 11.4 | 0 |
| NGC6584 | 2.3 | 0 |
| NGC6624 | 137.3 | 4 |
| NGC6638 | 48.9 | 5 |
| NGC6642 | 8.8 | 0 |
| NGC6712 | 17.8 | 6 |
| NGC6723 | 13.6 | 1 |
| NGC6749 | 113.9 | 0 |
| NGC6760 | 111.9 | 1 |
| NGC6934 | 17.7 | 7 |
| NGC7006 | 20.3 | 4 |
| NGC7492 | 9.5 | 1 |
| Pal1 | 13.7 | 4 |
| Pal2 | 2.1 | 0 |
| Pal3 | 8.5 | 1 |
| Pal4 | 2.8 | 0 |
| Pal5 | 11.2 | 0 |
| Pal6 | 3.00 | 5 |
| Pal8 | 11.5 | 0 |
| Pal10 | 3.1 | 0 |
| Pal11 | 12.7 | 2 |
| Pal12 | 4.8 | 0 |
| Pal13 | 15.9 | 5 |
| Pal14 | 3.0 | 0 |
| Pal15 | 15.1 | 5 |
| Pyxis | 3.3 | 0 |
| Rup106 | 13.9 | 2 |
| Terzan1 | 99.7 | 18 |
| Terzan2 | 42.2 | 8 |
| Terzan3 | 3.4 | 0 |
| Terzan4 | 2.9 | 0 |
| Terzan6 | 129.7 | 14 |
| Terzan7 | 8.4 | 0 |
| Terzan8 | 21.1 | 4 |
| Terzan9 | 40.8 | 5 |
| Terzan10 | 34.2 | 5 |
| Terzan12 | 3.4 | 0 |
| Ton2 | 99.9 | 12 |
| UKS1 | 7.3 | 0 |
| Whiting1 | 2.0 | 0 |