Further author information: E-mail: debesh@iitbombay.org, Tel: +91-9831369809
Teaching the concept of convolution and correlation using Fourier transform
Abstract
Convolution operation is indispensable in studying analog optical and digital signal processing. Equally important is the correlation operation. The time domain community often teaches convolution and correlation only with one dimensional time signals. That does not clearly demonstrate the effect of convolution and correlation between two signals. Instead if we consider two dimensional spatial signals, the convolution and correlation operations can be very clearly explained. In this paper, we propose a lecture demonstration of convolution and correlation between two spatial signals using the Fourier transform tool. Both simulation and optical experiments are possible using a variety of object transparencies. The demonstration experiments help to clearly explain the similarity and the difference between convolution and correlation operations. This method of teaching using simulation and hands-on experiments can stimulate the curiosity of the students. The feedback of the students, in my class teaching, has been quite encouraging.
keywords:
Convolution, correlation, Fourier transform, optical and digital signal processing1 Motivation
In the under graduate programs of electrical, electronics and communication engineering, convolution and correlation are taught in many courses, such as signals and systems, digital signal processing and communication theory. The electronics or the time domain community treat the subject of convolution and correlation mainly with respect to one-dimensional time domain signals. On the other hand, the optics and photonics community teach convolution and correlation with respect to two-dimensional spatial signals. It is observed that the subject can be better appreciated if examples from two-dimensional spatial signals are considered.
2 Introduction
Convolution is a mathematical method of combining two signals to form a third signal. The characteristics of a linear system is completely specified by the impulse response of the system and the mathematics of convolution [1]. It is well-known that the output of a linear time (or space) invariant system can be expressed as a convolution between the input signal and the system impulse response function.
Convolution is the basis for many signal processing techniques. As for example digital filters are synthesized by designing appropriate impulse response functions. Targets are detected on the radar by analyzing the measured impulse responses. In long distance telephone communication, echo suppression is achieved by creating impulse responses those cancel out the impulse responses of the reverberation signal.
Correlation is a simple mathematical operation to compare two signals. Correlation is also a convolution operation between two signals. But there is a basic difference. Correlation of two signals is the convolution between one signal with the functional inverse version of the other signal. The resultant signal is called the cross-correlation of the two input signals. The amplitude of cross-correlation signal is a measure of how much the received signal resembles the target signal. The correlation peak specifies the location of the target.
Correlation operation is regulalrly done in radar communication [1]. Vander Lugt evolved with a novel way of optical character recognition by optical matched filtering what he called “complex spatial filtering” [2]. Goodman and Weaver demonstrated how to optically convolve two spatial signals by joint Fourier transformation [3]. The joint Fourier transform method forms the basis for optical implementation of cross-correlation between two signals, which is popularly known as joint-transfrom correlation [4].
It is worth noting that both convolution and correlation operation can be realized by applying Fourier transform. Thus, it is appropriate to explain the similarity and difference of convolution and correlation using Fourier transform. In this paper, we present a teaching method for understanding the concept of convolution and correlation using the Fourier transform tool.
3 Mathematical expressions of convolution and correlation
The mathematical expression defining a convolution between two continuous time signals and is given by [4]
| (1) | |||||
where represents convolution operation. For discrete time signals and , it can be expressed as a convolution sum given by
| (2) |
Equations (1) and (2) also give the output of a linear time invariant system where / is the system impulse response of the continuous / discrete linear time invariant system.

The correlation between the same two signals may be expressed as
| (3) | |||||
where represents correlation operation. For discrete time signals and , it can be expressed as [1]
| (4) |
Convolution and correlation are similar mathematical operations. Correlation is also a convolution operation between the two signals but one of the signals is the functional inverse. So, in correlation process one of the signals is rotated by 180 degree. This is the basic difference between convolution and correlation. It is interesting to note that convolution and correlation can produce identical results if the signals are rotationally symmetric.
4 2D examples of convolution
The time domain community treats it mostly with 1D signals. It is observed that the concept can’t be appreciated easily using 1D signals. If we take examples of 2D signals, we can show the results pretty simple and the concept is easily understandable by the students. We use the convolution theorem of Fourier transform. This states that the Fourier transform of a product of two signals is the convolution of the respective Fourier transforms. The vice versa is also true.
Let us take two sinusoidal 2D gratings. First we add the gratings and take Fourier transform. If and be the amplitude transmittance of the two gratings, then we can write
| (5) |
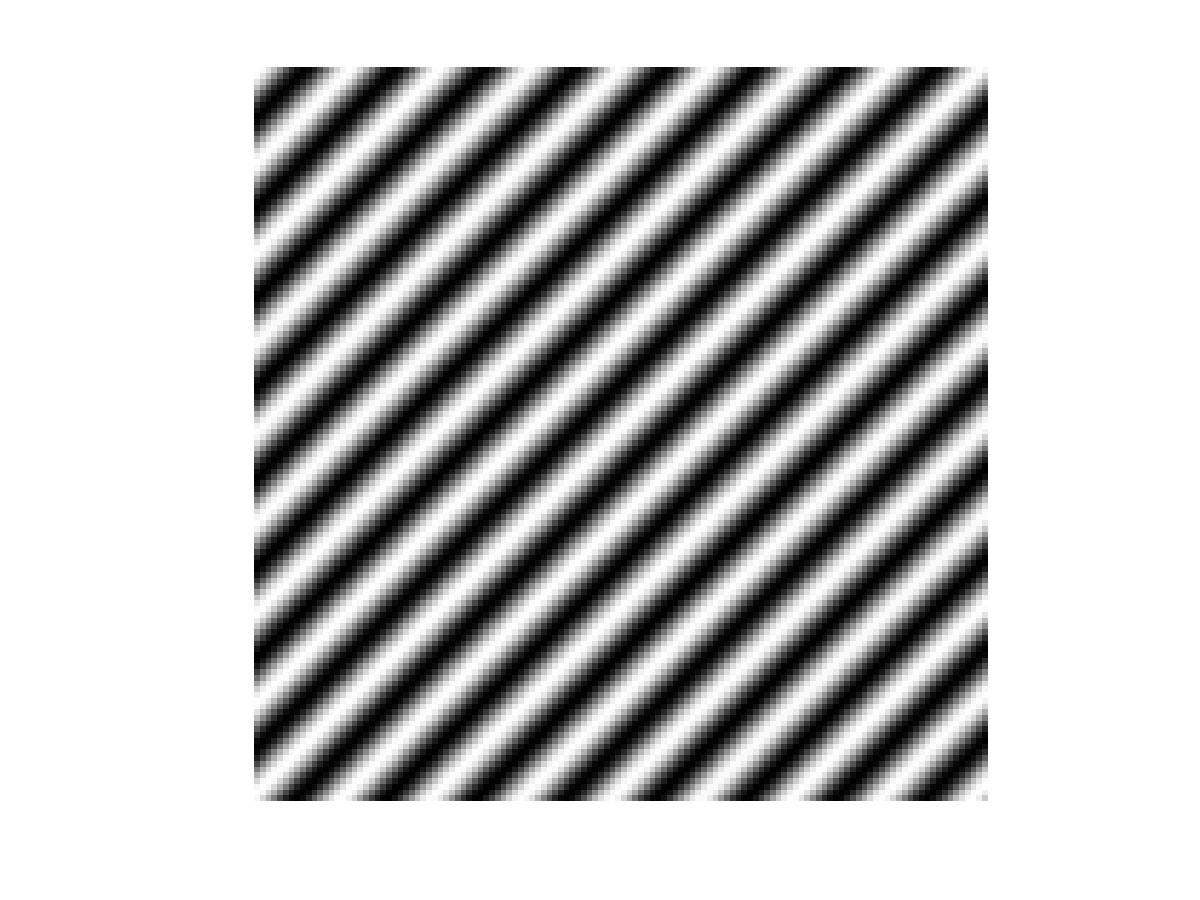
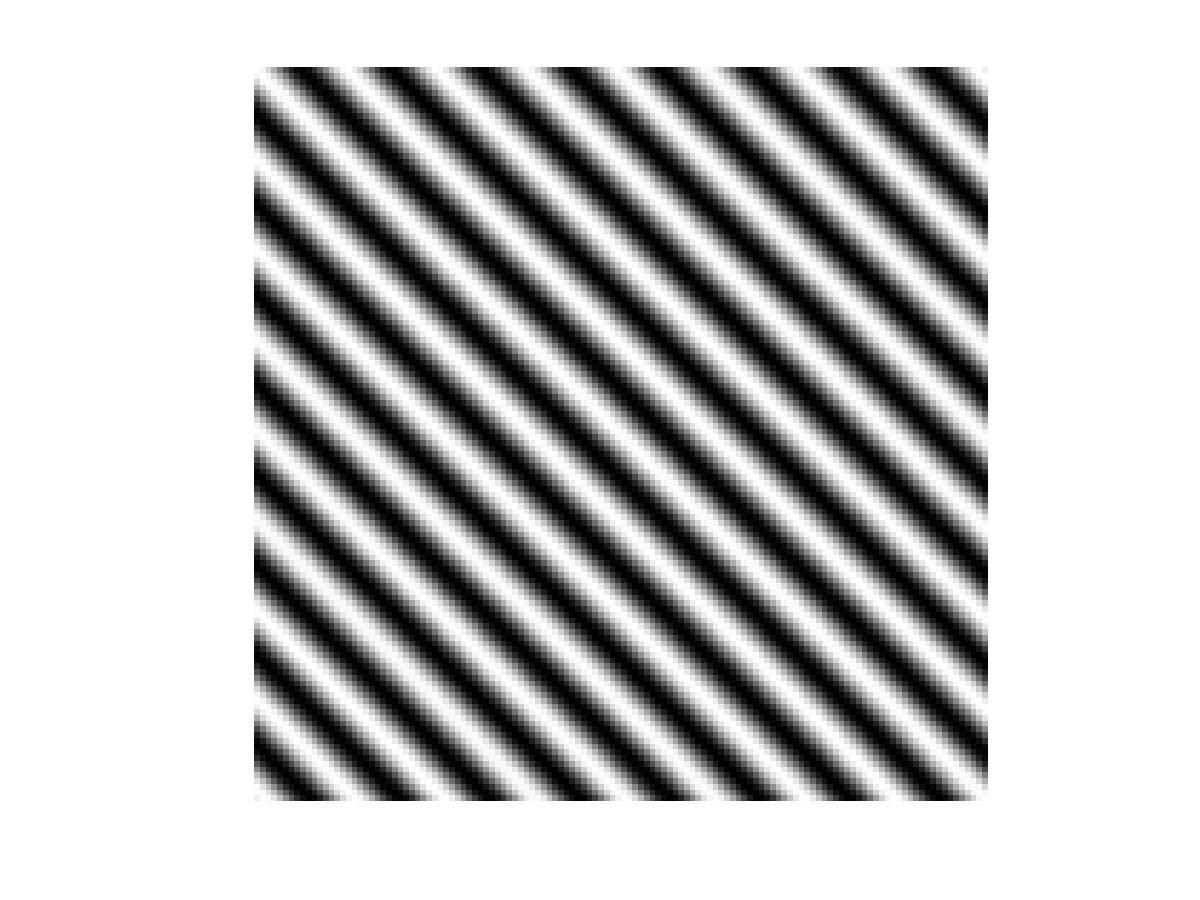
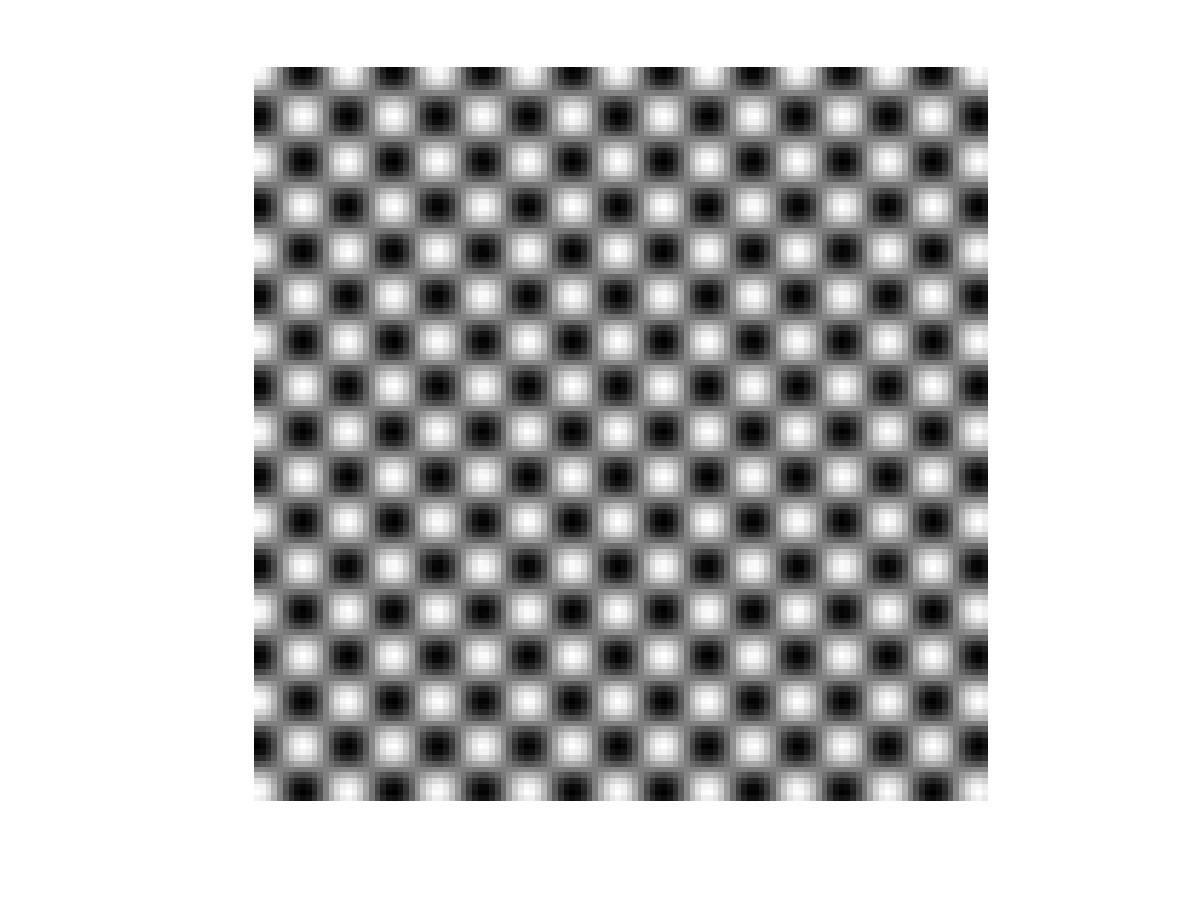
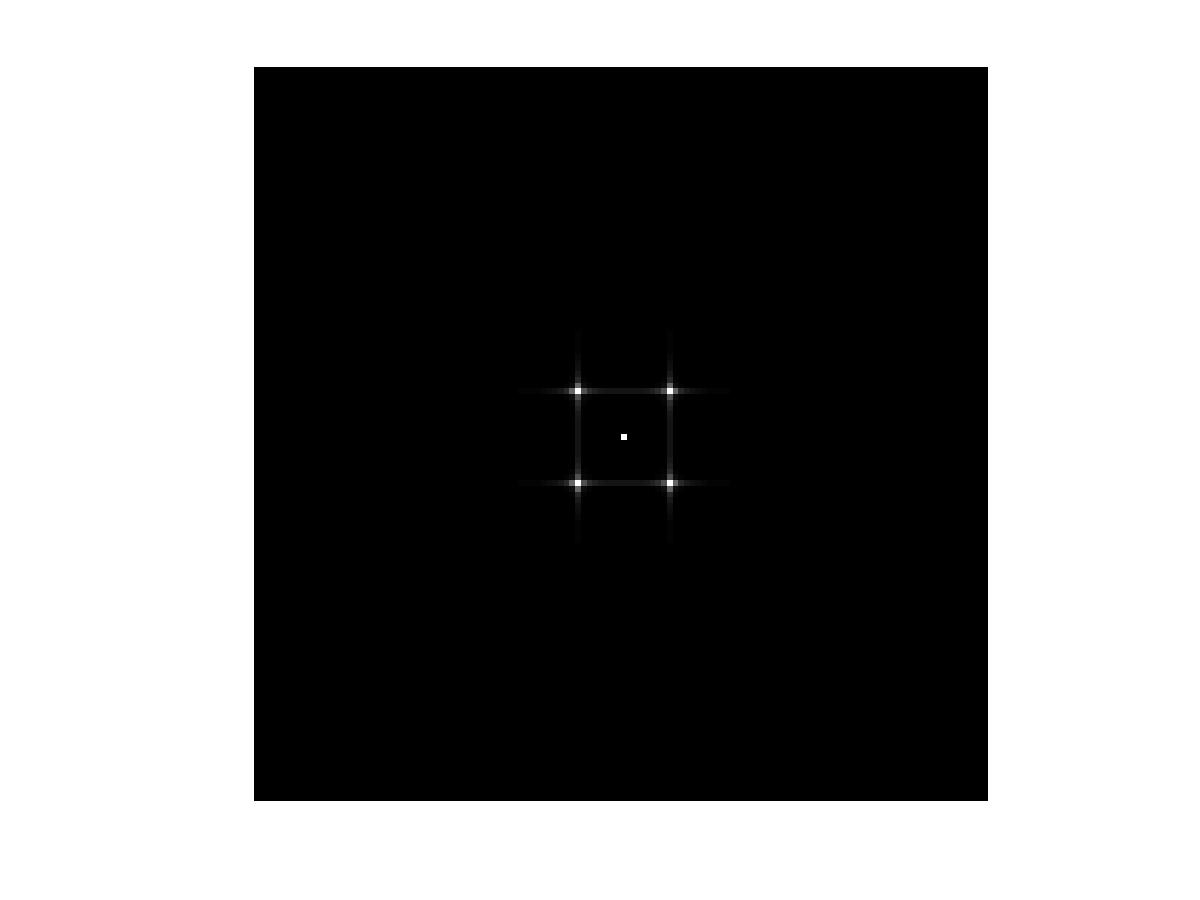
where is a Fourier transform operator. We created 2D sinusoidal gratings, the algebraic addition of the gratings and their Fourier transforms using open source GNU Octave [5]. The results are shown in Fig.2.
(a) (b) (c) (d)
It is evident from Fig.2 that the Fourier transform of the addition signal is just the addition of the Fourier transforms of the individual gratings.
Now let us multiply the amplitude of the gratings and carry out Fourier transform on the product signal. It is equivalent to
| (6) |
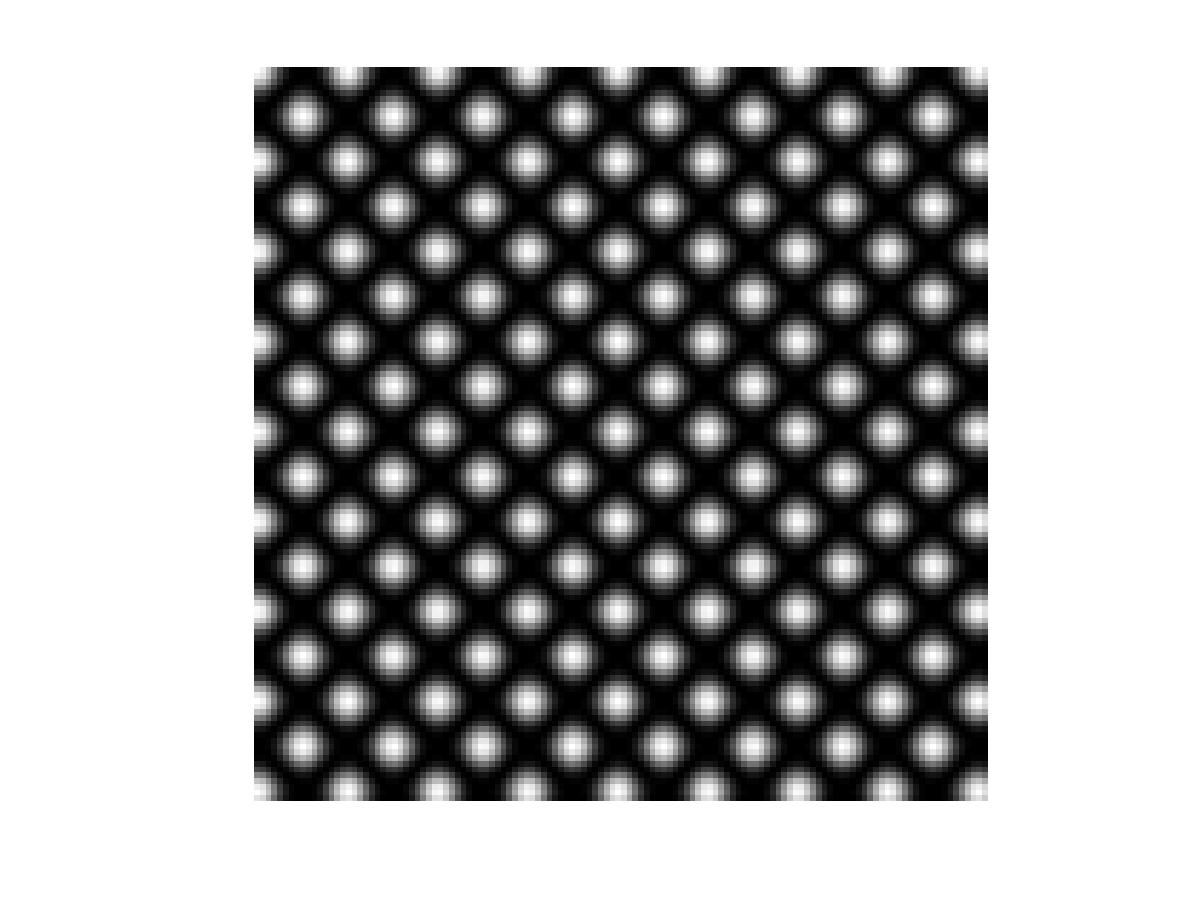
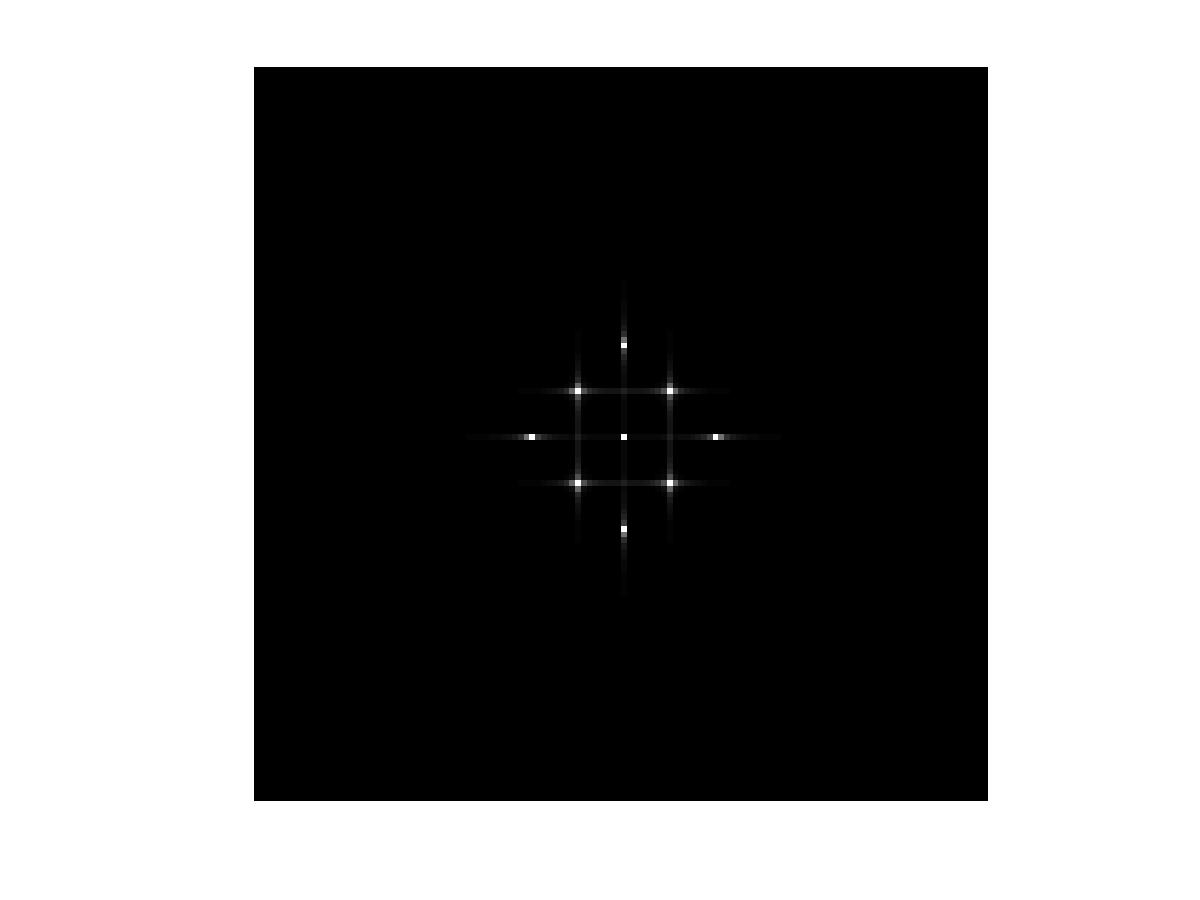
and the simulation results of this operation is displayed in Fig.3.


(a) (b) (c) (d)
The addition signal of Fig.2(c) and the product signal of Fig.3(c) are different although they are almost similar in appearance. That is why the Fourier transform intensity displayed in Fig.2(d) and Fig.3(d) are different. There are five bright dots in Fig.2(d) whereas there are nine bright dots in Fig.3(d). The cross terms (bright dots) in Fig.3(d) are due to the convolution between the Fourier transforms of the two grating functions.
4.1 Optical demonstration of convolution
The above examples can be demonstrated using optical experiments. The example of equation (5) can be optically implemented using a Mach-Zehnder interferometric arrangement as shown in Fig.4. The two grating transparencies are placed inside the two arms of the interferometer such that they are equidistant from the second beam-splitter. The converging lens acts as a 2D Fourier transforming element which produces the Fourier transform of the amplitude distribution at the output plane.

The convolution theorem of Fourier transform can be optically demonstrated using the simple arrangement of optical Fourier transformation by a converging lens as shown in Fig.5.

The effect of equation (6) can be yielded by placing the grating transparencies in contact with each other at the front focal plane of the FT lens in Fig.5. That is equivalent to multiplying the amplitude transmittance functions of the two gratings. Fourier transformation by the FT lens produces the convolution of the Fourier transforms of the grating transmittance functions at the back focal plane which is the output plane.
4.2 Abbe-Porter experiment and spatial filtering
The well-known Abbe-Porter experiment is also portrayed as a demonstrative experiment of convolution theorem of Fourier transform [4]. In this classical experiment, the superposition of all the spatial frequency content of an input 2D image is recombined after a Fourier transform opreation. The 4f Fourier optical set-up with two identical FT lens serves the purpose. The

students can play with such a system to understand the role of free-space propagation and Fourier transform in imaging. Different slits can be placed at the FT plane to study the effect of spatial frequency filtering. This can immensely help to improve the understanding of convolution theorem of Fourier transform.
5 2D examples of correlation
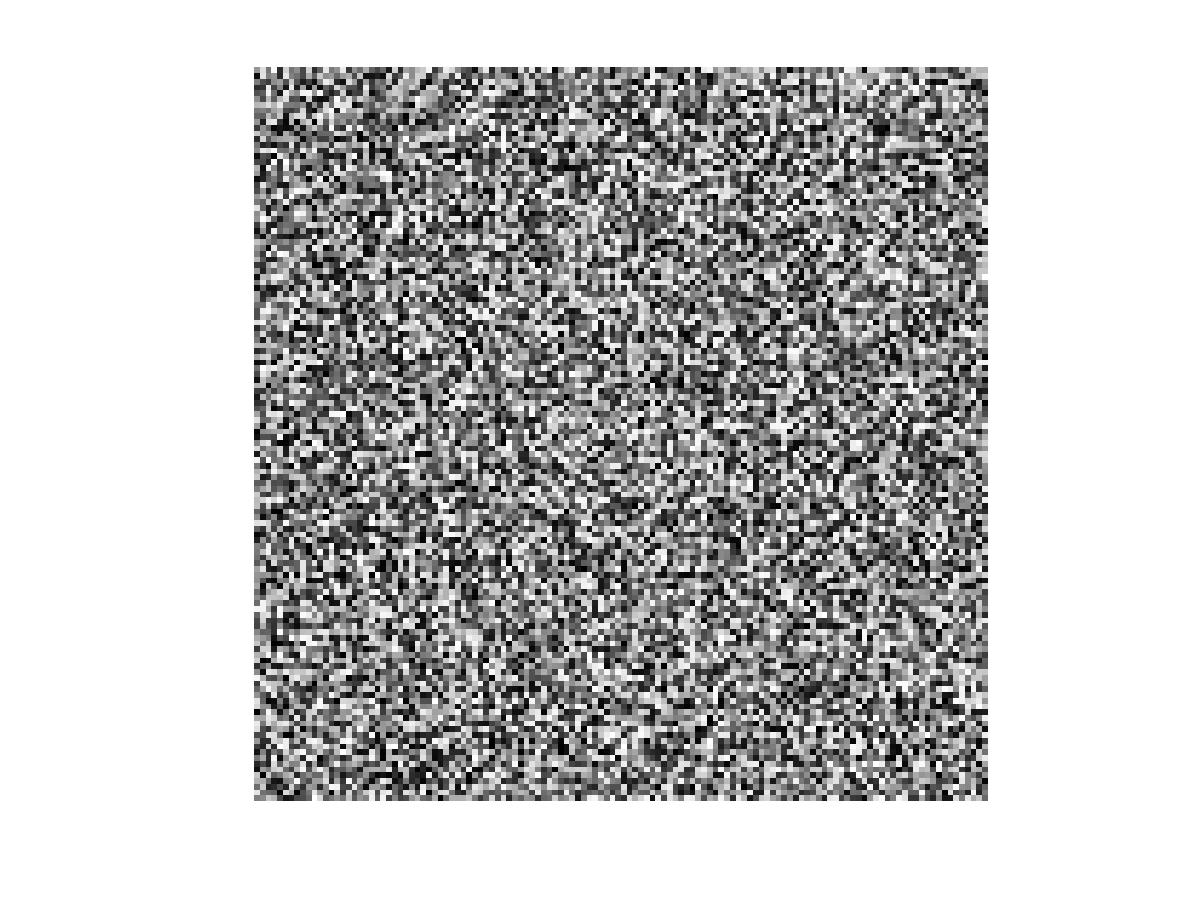
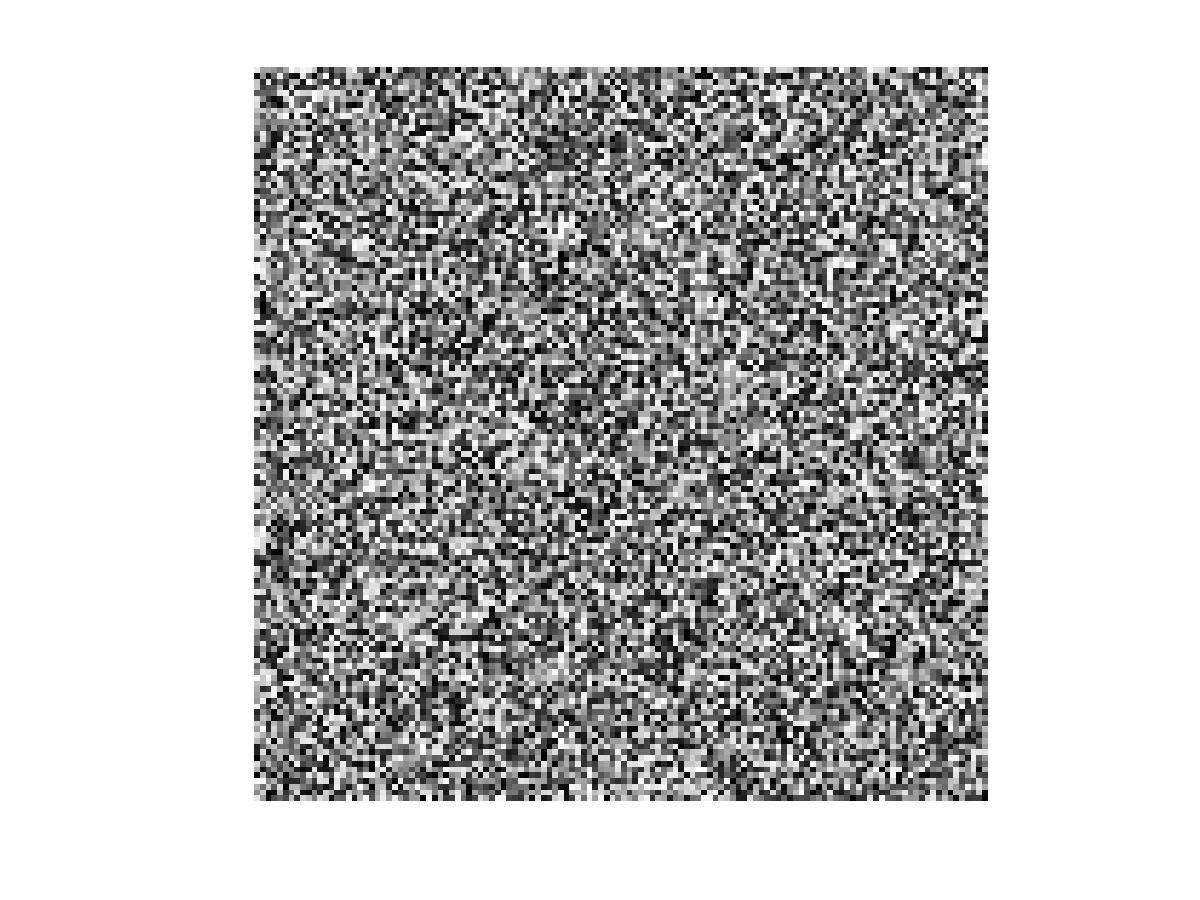
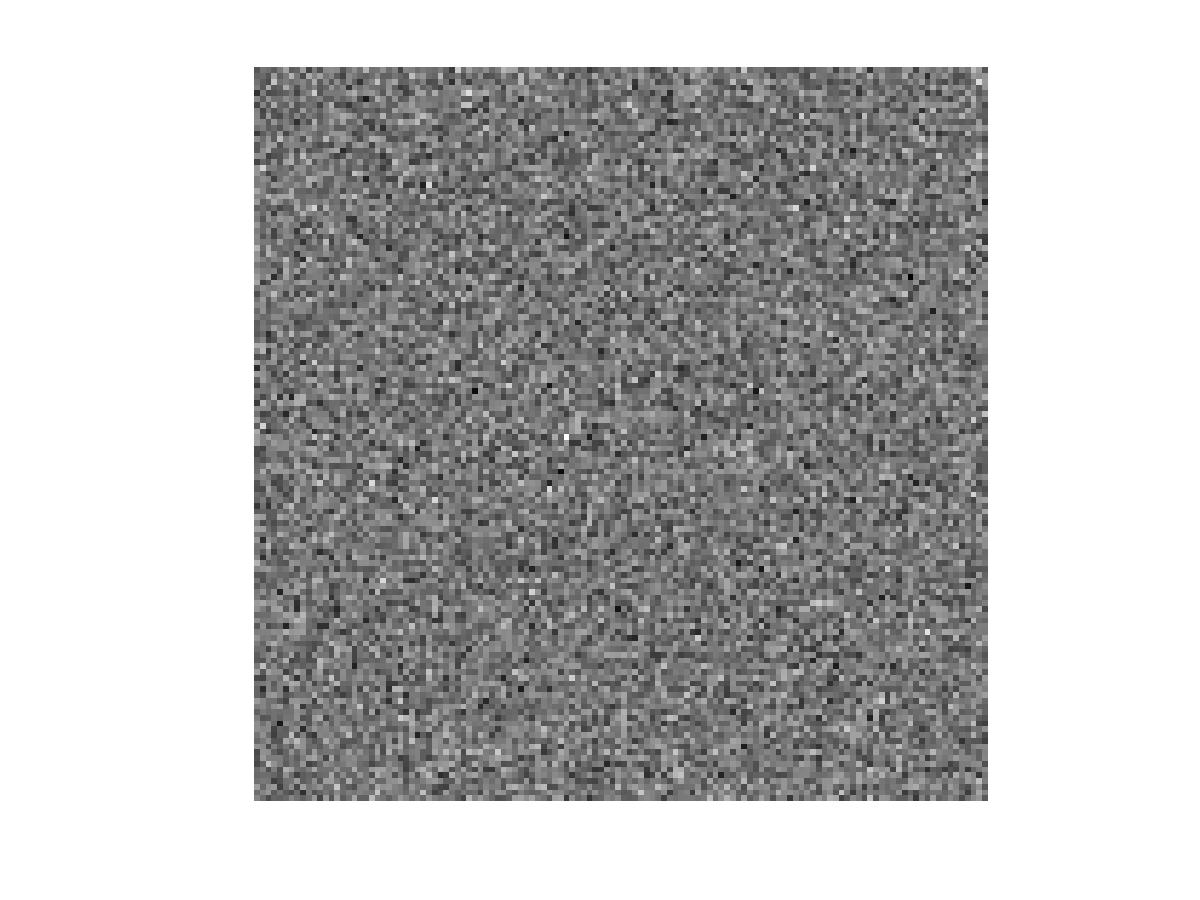
Correlation operation is handy to measure similarity between two signals. Let us take two random screens and inspect the correlation between them. We generate images of two random screens using GNU Octave as shown in Fig.7. The cross-correlation between the images of two random screens will also produce a random image, because the two random images have no correlation. This is shown in Fig.7(c).
(a) (b) (c))
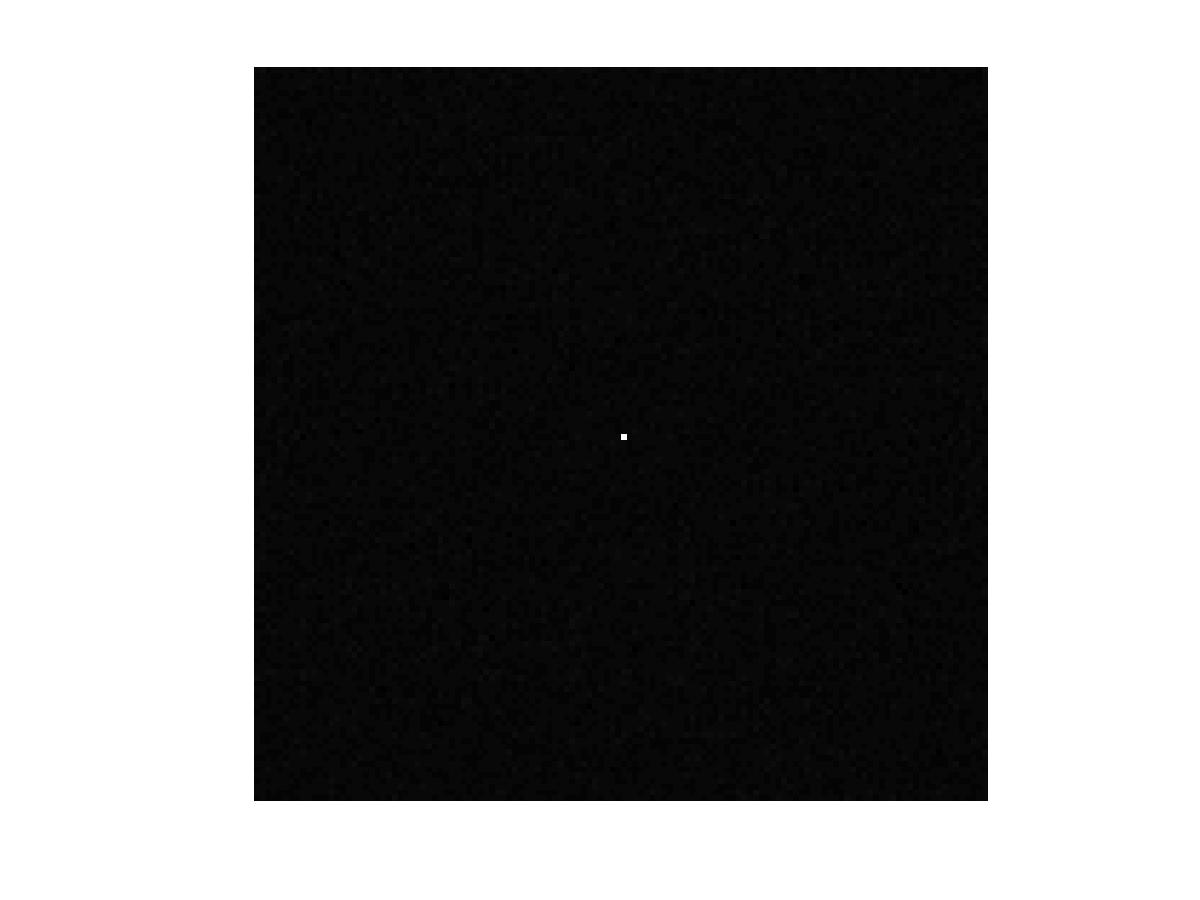
If the two random screens are same, i.e., identical, then the images of the random screens are correlated to yield sharp correlation peak. This is equaivalent to cross-correlation with itself which is called auto-correlation. This result is shown in Fig.8. The presence of a sharp bright dot in Fig.8(c) is the evidence of high correlation between Fig.8(a) and (b).


(a) (b) (c))
5.1 Optical correlation
The Fourier transforming property of converging lens helps implementing correlation operation optically. The Vander Lugt correlation and joint-transform correlation can be explained using both simulation and experiments. The students can be given mini projects on optical correlation.

The recording of a joint Fourier transform can be done using a schematic set-up similar to Fig.9. The object and the target optical transparencies are placed side by side at the front focal plane of a FT lens. The joint Fourier transform intensity is recorded at the FT plane

either on a photographic plate or on a digital camera sensor. For the replay, the photographic record is placed at the front focal plane and the cross-correlation output is obtained at the FT plane as shown in Fig.10. If it is a recording on a digital camera, then the recorded image of the joint Fourier transform can be displayed on a electrically addressed spatial light modulator and joint-transform correlation can be obtained by the same set-up..
The Vander Lugt filter is nothing but a Fourier transform hologram of the target to be correlated. We can simulate a recording of a Vander Lugt filter by recording the Fourier transform of the reference target transparency along with a coherent plane reference wave. The Fourier transform of the object trapsparency is multiplied with the recorded Vander Lught filter and another Fourier transformation produces the correlation result. We can see correlation peaks at the location of the matched targets. All these exercises can be assigned to the students as mini projects which can be carried out using GNU Octave.
6 Conclusion
In this paper we have presented a teaching method to explain convolution and correlation. It is noticed that convolution can be better explained with 2D signals instead of 1D signals. Utilization of interferometric system for producing an addition and product of two signals can help to demonstrate the convolution theorem of Fourier transform. The difference of correlation with convolution can be made clear by demostrating cross-correlation operation by Vander Lugt and joint-transform correlation. Simulation platform such as GNU Octave can be utilized to demonstrate the principles. These exercises can help the students to appreciate and understand the concepts of convolution and correlation more intuitively.
References
- [1] Smith, S. W., [The Scientist and Engineer’s Guide to Digital Signal Processing], California Technical Publishing, (1999).
- [2] Vander Lugt, A. B., “Signal detection by complex spatial filtering”, IEEE Trans. Info. Theory IT-10, 139-145 (1964).
- [3] Weaver, C. J. and Goodman, J. W., “A technique for optically convolving two functions”, Appl. Opt. 5, 1248-1249 (1966).
- [4] Goodman, J. W., [Introduction to Fourier Optics, Third Edition], (Roberts & Company, (2005).
- [5] GNU Octave – A high-level interactive language for numerical computations, http://www.octave.org/