Evidence of a large scale positive rotation-metallicity correlation in the Galactic thick disk
Abstract
This study is based on high quality astrometric and spectroscopic data from the most recent releases by Gaia and APOGEE. We select thin and thick disk red giants, in the Galactocentric (cylindrical) distance range kpc and within kpc, for which full chemo-kinematical information is available. Radial chemical gradients, , and rotational velocity-metallicity correlations, , are re-derived firmly uncovering that the thick disk velocity-metallicity correlation maintains its positiveness over the kpc range explored. This observational result is important as it sets experimental constraints on recent theoretical studies on the formation and evolution of the Milky Way disk and on cosmological models of Galaxy formation.
keywords:
Galaxy: formation — Galaxy: disk — Galaxy: abundances — Galaxy: kinematics and dynamics1 Introduction
Although the existence of a thick disk in the Milky Way was revealed years ago (Gilmore & Reid, 1983) and its spatial, kinematic, and chemical properties are today better defined, its origin is still matter of debate.
Proposed scenarios include the heating of a pre-existing thin disk through a minor merger (Villalobos & Helmi, 2008), accretion of dwarf galaxies stars from disrupted satellites (Abadi et al., 2003), or stars formed in situ from gas-rich mergers at high redshift (Brook et al., 2005; Haywood et al., 2015). On the other hand, simulations suggest that thick disks could be produced through secular radial migration of stars induced by spiral arms (Roskar et al., 2008; Schoenrich & Binney, 2009; Curir et al., 2012) and flaring combined with inside-out disk formation (Minchev et al., 2017). Such models predict characteristic trends on the kinematics and chemical abundances that can be used to discriminate the one, or the ones, favoured by the Milky Way.
Indeed, detailed information can be obtained from massive astrometric and spectroscopic surveys. Quite recently, the European Space Agency’s Gaia mission has made its second data release, or Gaia DR2 (Gaia Collaboration, 2018): it provides unprecedented accurate measurements of parallax and proper motion for more than 1.3 billion stars across the whole sky (Lindegren et al., 2018). On the other hand, as part of SDSS-IV, the Apache Point Observatory Galactic Evolution Experiment fourteenth data release, APOGEE DR14, has delivered high-resolution () high signal-to-noise near-infrared spectra, enabling the determination of precise radial velocities as well as stellar parameters and abundances for more than chemical elements (Majewski et al., 2017; Abolfathi et al., 2018). Finally, we recall that the APOGEE Survey targeted mostly red giant stars (Zasowski et al., 2013).
In this Letter we take advantage of these new superb measurements to improve on the recent work of Kordopatis et al. (2017) based on APOGEE DR12. Section 2 describes our selection of disk stars, Section 3 presents the findings that resulted from our analysis, while Section 4 addresses the theoretical implications of our results.
2 Data and sample selection
This study starts with a new kinematic catalogue, assembled after cross-matching Gaia DR2 and APOGEE DR14. The resulting sample contains DR2 positions, parallaxes and proper motions (Lindegren et al., 2018), plus radial velocities and chemical abundances derived with the APOGEE Stellar Spectra Parameter Pipeline (e. g., Holtzman et al., 2015; Garcia et al., 2016). The data set allows us to derive a complete, 6D, phase-space information for a sufficiently pure sample of tracers of the disk (thin and thick) populations.
We first select only objects having astrometric solutions that are either not affected by excess of noise, , or with a significance level on less than two, to discard astrometric binaries and other anomalous cases (see Lindegren et al., 2018, for details). Then, we retain only those stars with relative parallax error , that allows to compute distances as with quasi-gaussian errors. As for the selection on the APOGEE DR14 data, we reject stars with flags warning of poor stellar parameter estimates, and those with signal-to-noise ratios lower than . Also, in order to work with reliable -element abundances, we only consider stars with and K according to Anders et al. (2014). Therefore, our initial sample comprises a total of red giants down to mag with only stars fainter than mag. Median uncertainties are: in parallax, in annual proper motion, and for the APOGEE provided line-of-sight velocities.
Three-dimensional velocities in Galactocentric cylindrical coordinates, , are derived by assuming that the Sun is away from the Milky Way (MW) centre, the LSR rotates at around the Galactic centre (McMillan, 2017), and the LSR peculiar velocity of the Sun is (Schoenrich et al., 2010). Median uncertainties of the derived Galactocentric velocities are .
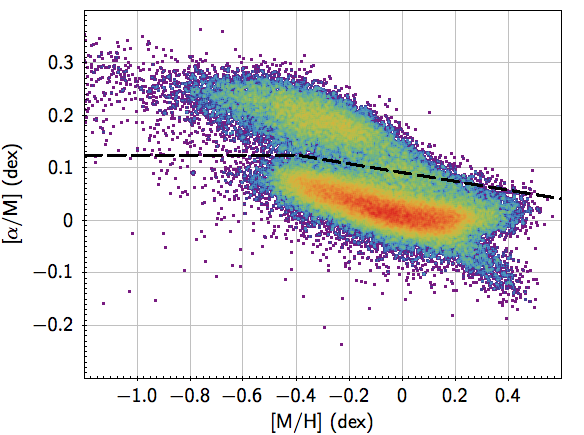
Disk stars are chemically selected utilising the constraint dex111We adopt the overall chemical abundance and -element abundances , as derived by the APOGEE Stellar Parameter and Chemical Abundances Pipeline (ASPCAP, Zamora et al., 2015). The stellar parameters fitted by ASPCAP are , , , , , , and . Here, the overall metallicity is defined as , where and are the number density of all elements with atom number and hydrogen nuclei, respectively. The -elements considered are O, Ne, Mg, Si, S, Ca, and Ti. and kpc, resulting in a sample of objects. Fig. 1 shows the chemical plane, vs. , for this sample; the thin disk (low-) and thick disk (high-) subsamples are reasonably well separated (below and above the dashed line, respectively) by the relation:
| (1) |
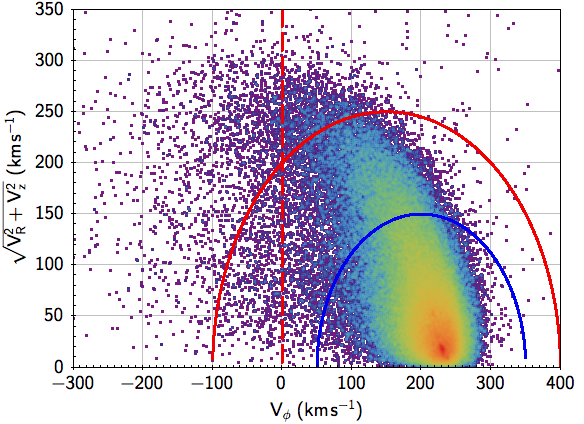
In order to minimise kinematic contamination from the halo, we retain only stars with and apply the Toomre selections (see Fig. 2):
| (2) | |||||
| (3) |
for thin disk (Eq. 2) and thick disk (Eq. 3) stars. With this further selection our sample is composed of disk stars.
Finally, we remind the reader that the photometric selection criteria of the APOGEE targets and the - boundaries of the ASPCAP grid may bias the resulting metallicity distribution, e.g. by undersampling the metal rich tail at dex, as discussed by Hayden et al. (2014). The radial metallicity gradients and the velocity metallicity correlations, especially for the thin disk, could be sensitive to this effect and in particular at larger distances. We briefly address this issue in the next Section.
3 Results
We focus on the sample within the Galactocentric (cylindrical) distance range kpc for a total of disk stars. Also, the following analysis refers to Galactocentric rings, each wide, with central radius at kpc, respectively. In addition, both chemically selected thin and thick disk stars are considered in three height intervals: kpc, kpc, and kpc.
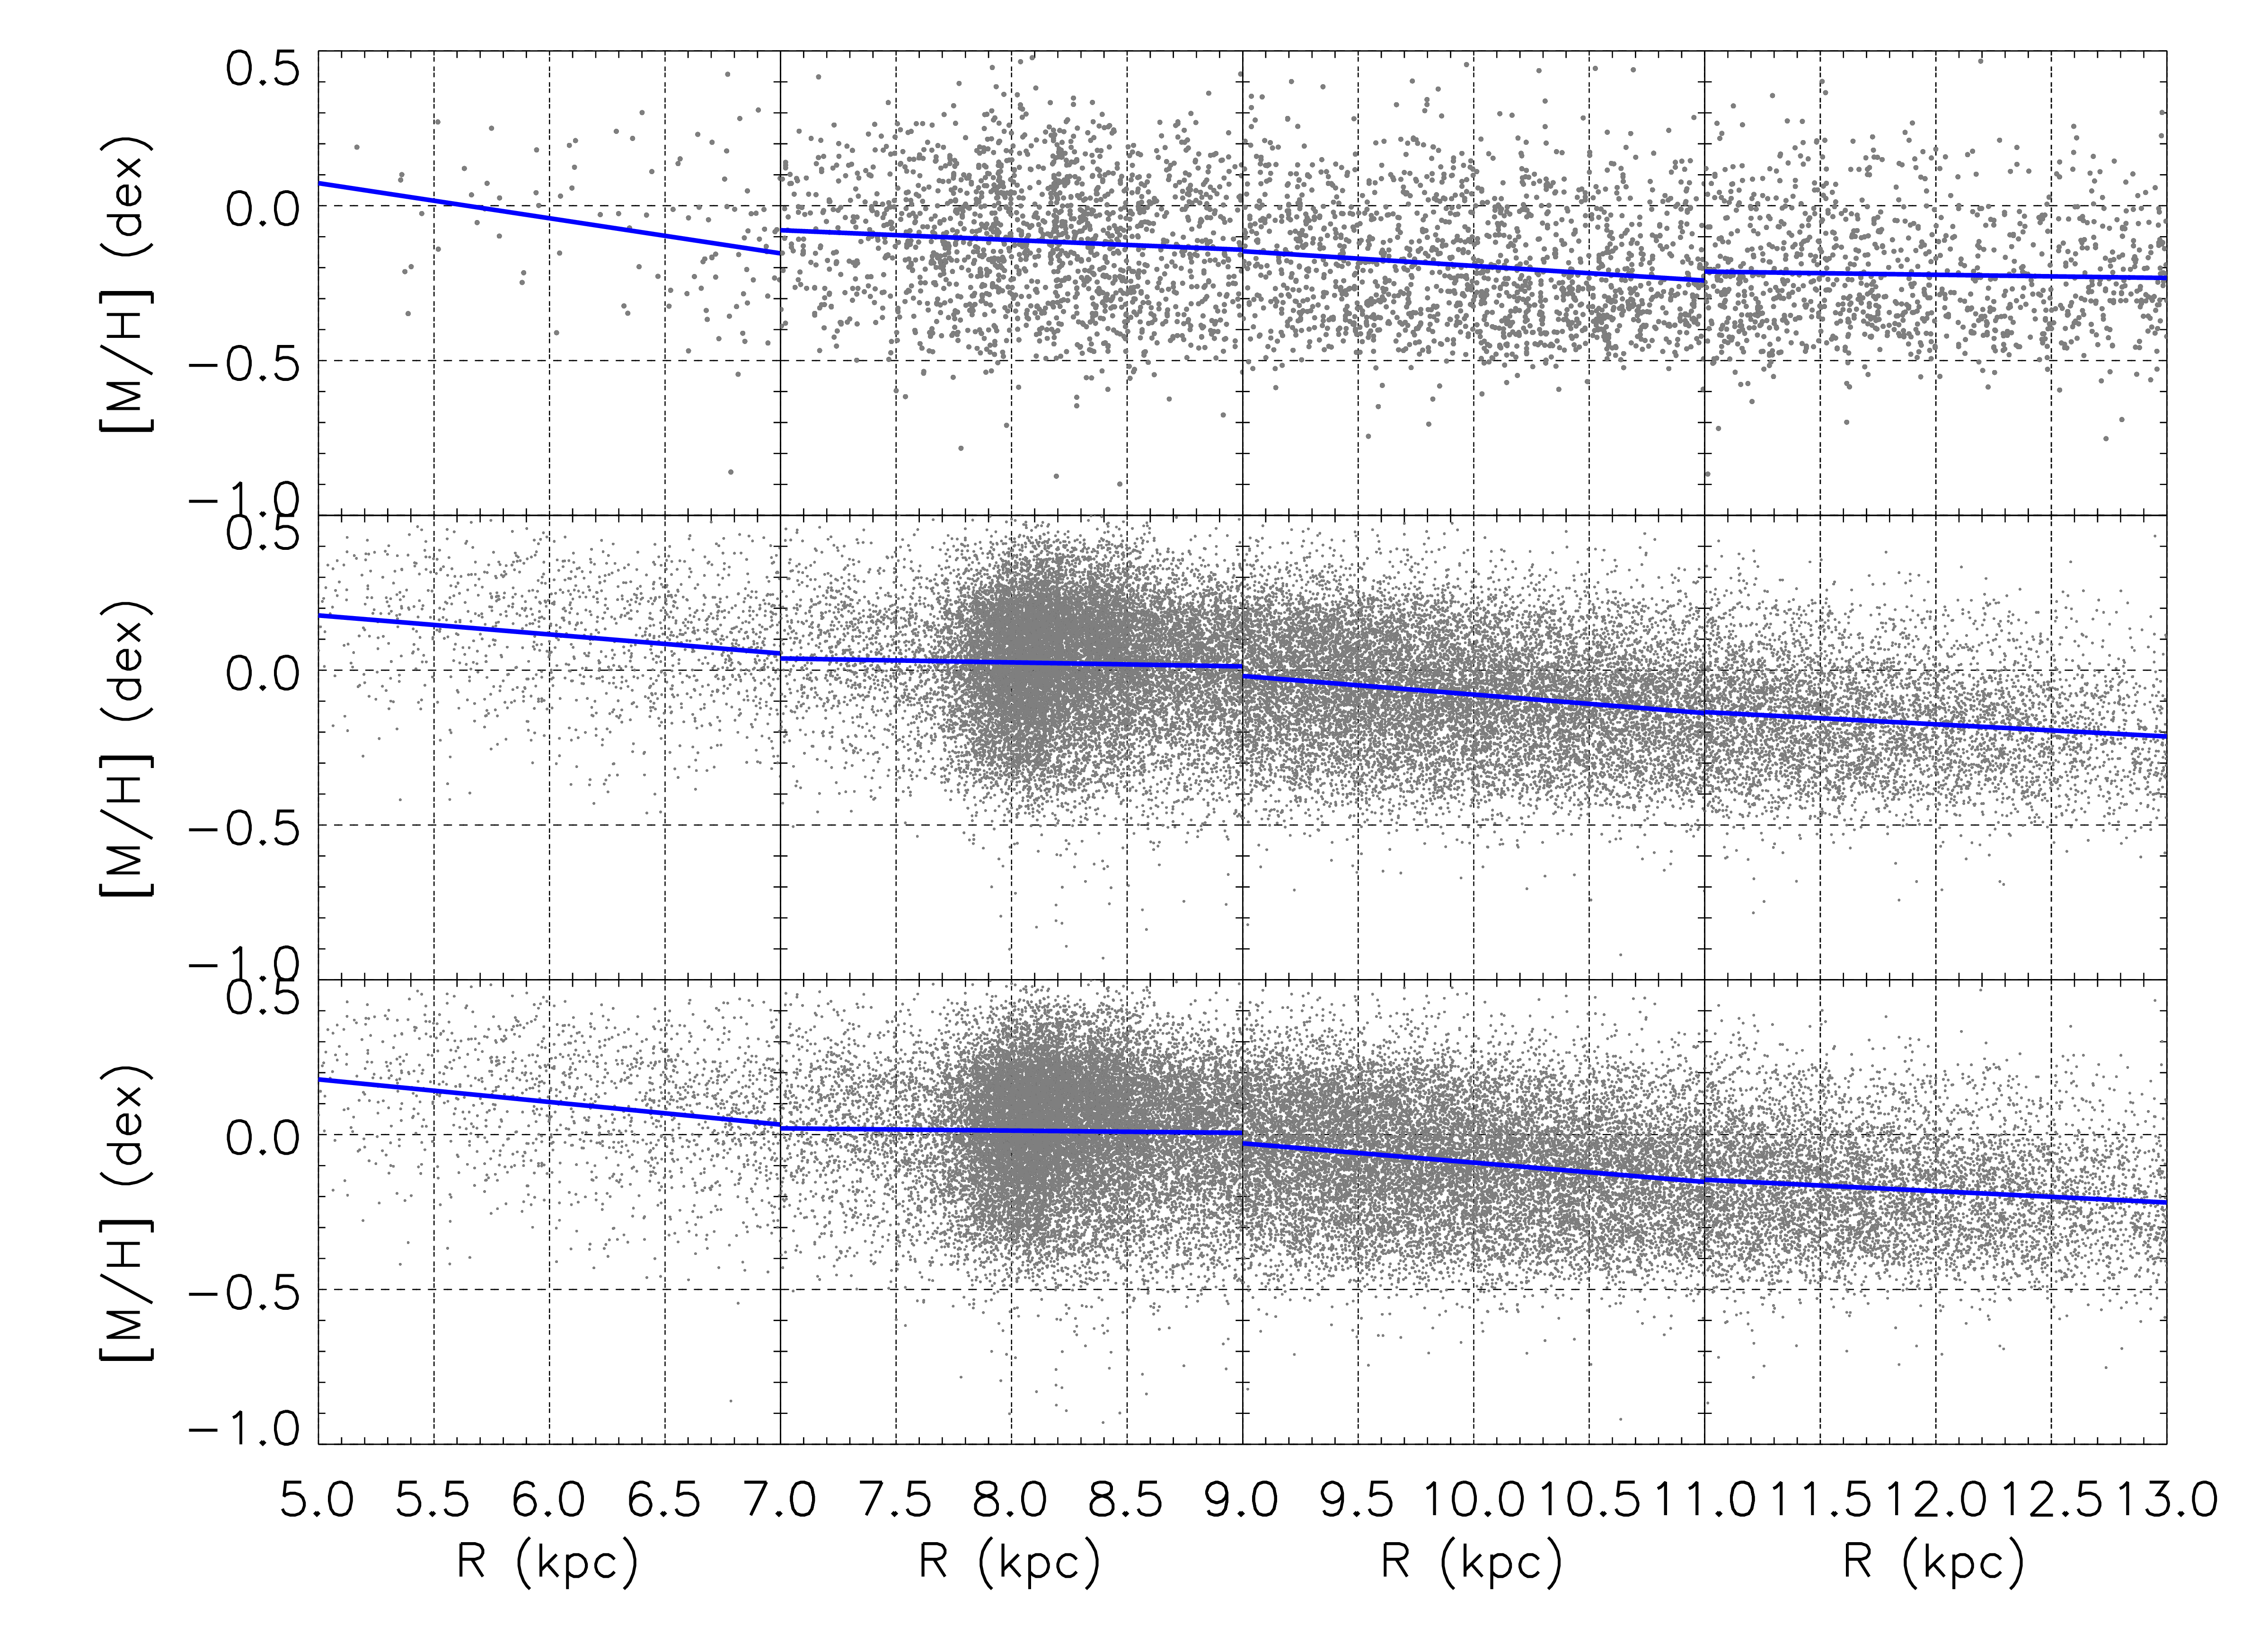
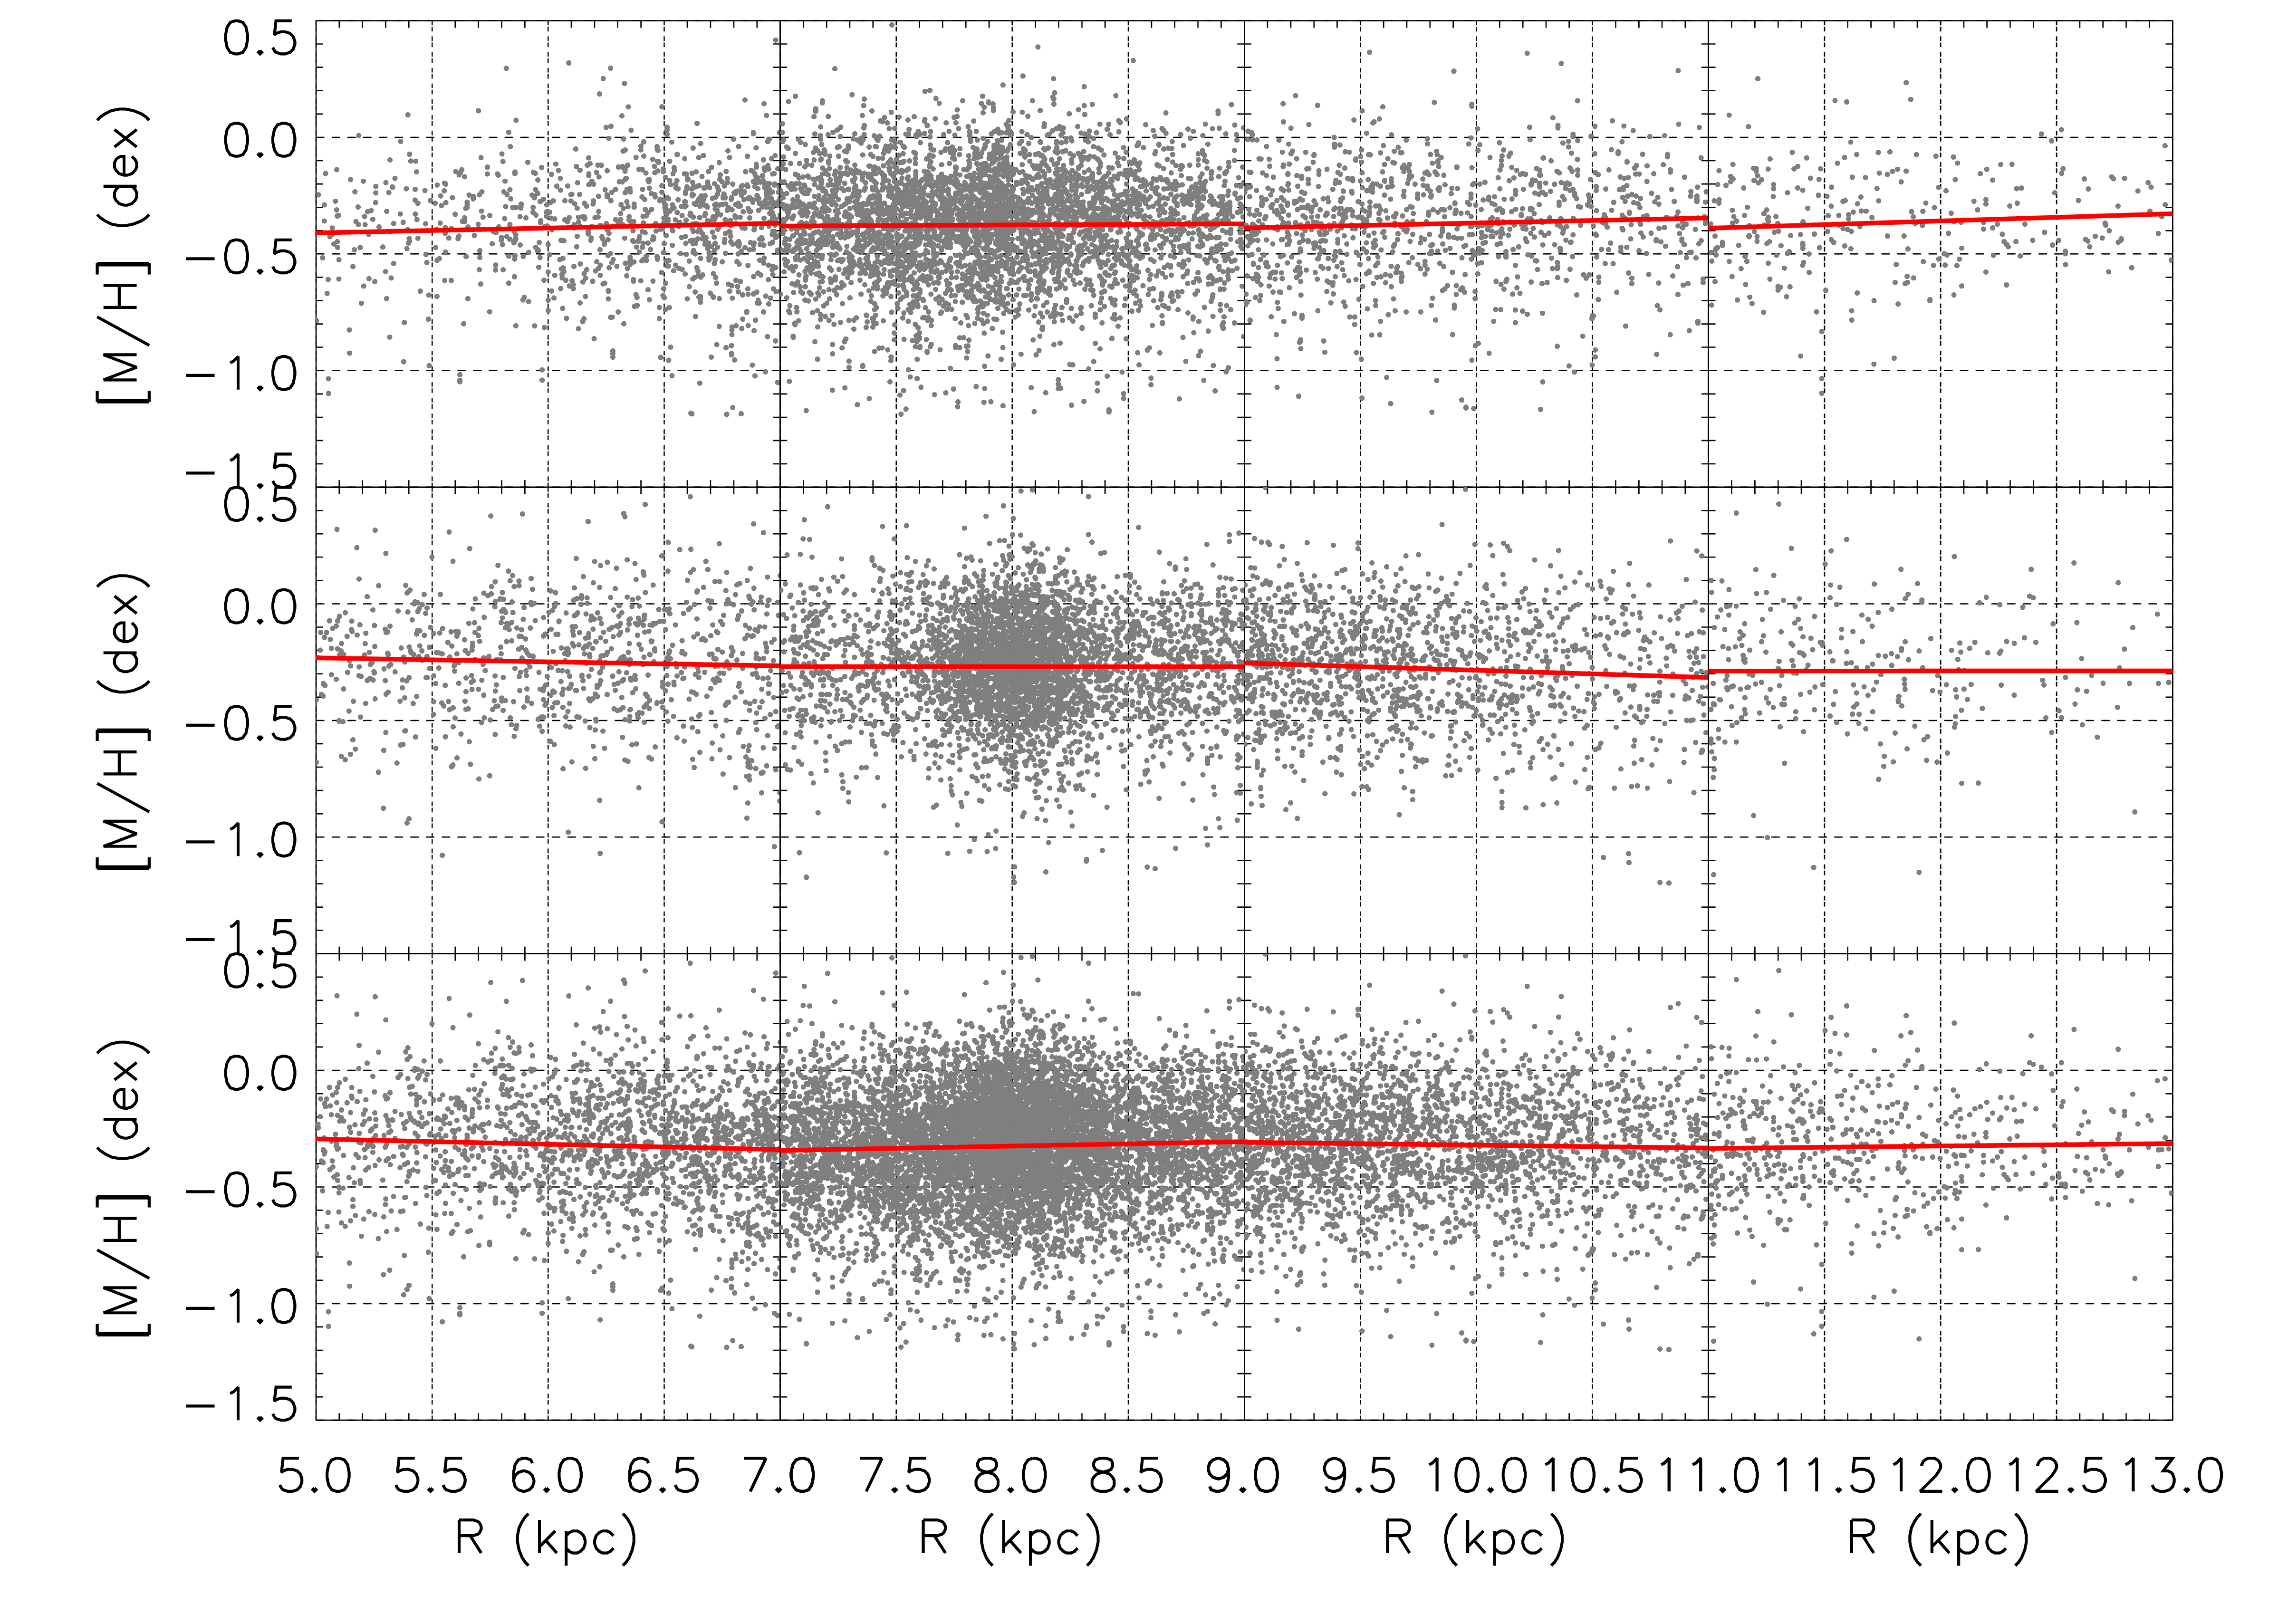
Figs. 3–4 show the distribution of as a function of , and the three intervals above, for thin and thick disk stars, respectively. A linear fit to the data is also shown for each of the Galactocentric rings examined, while the actual fit results are provided in Table 1. At a given range, radial gradients appear consistent with trends expected for the two disk populations irrespective of distance from the Galactic plane. In particular, thick disk stars show rather flat (or mildly positive) gradients throughout the portion of the disk proved. Within the Solar annulus, kpc, we measure for the low- (thin disk) population a radial-metallicity gradient of between kpc, and of below kpc. For the high- population, the fit estimations go from a flat slope of for kpc to a positive slope of below kpc. These gradients are consistent with recent measurements like in, e.g., Anders et al. (2014); Recio-Blanco et al. (2014); Li & Zhao (2017); Peng et al. (2018).
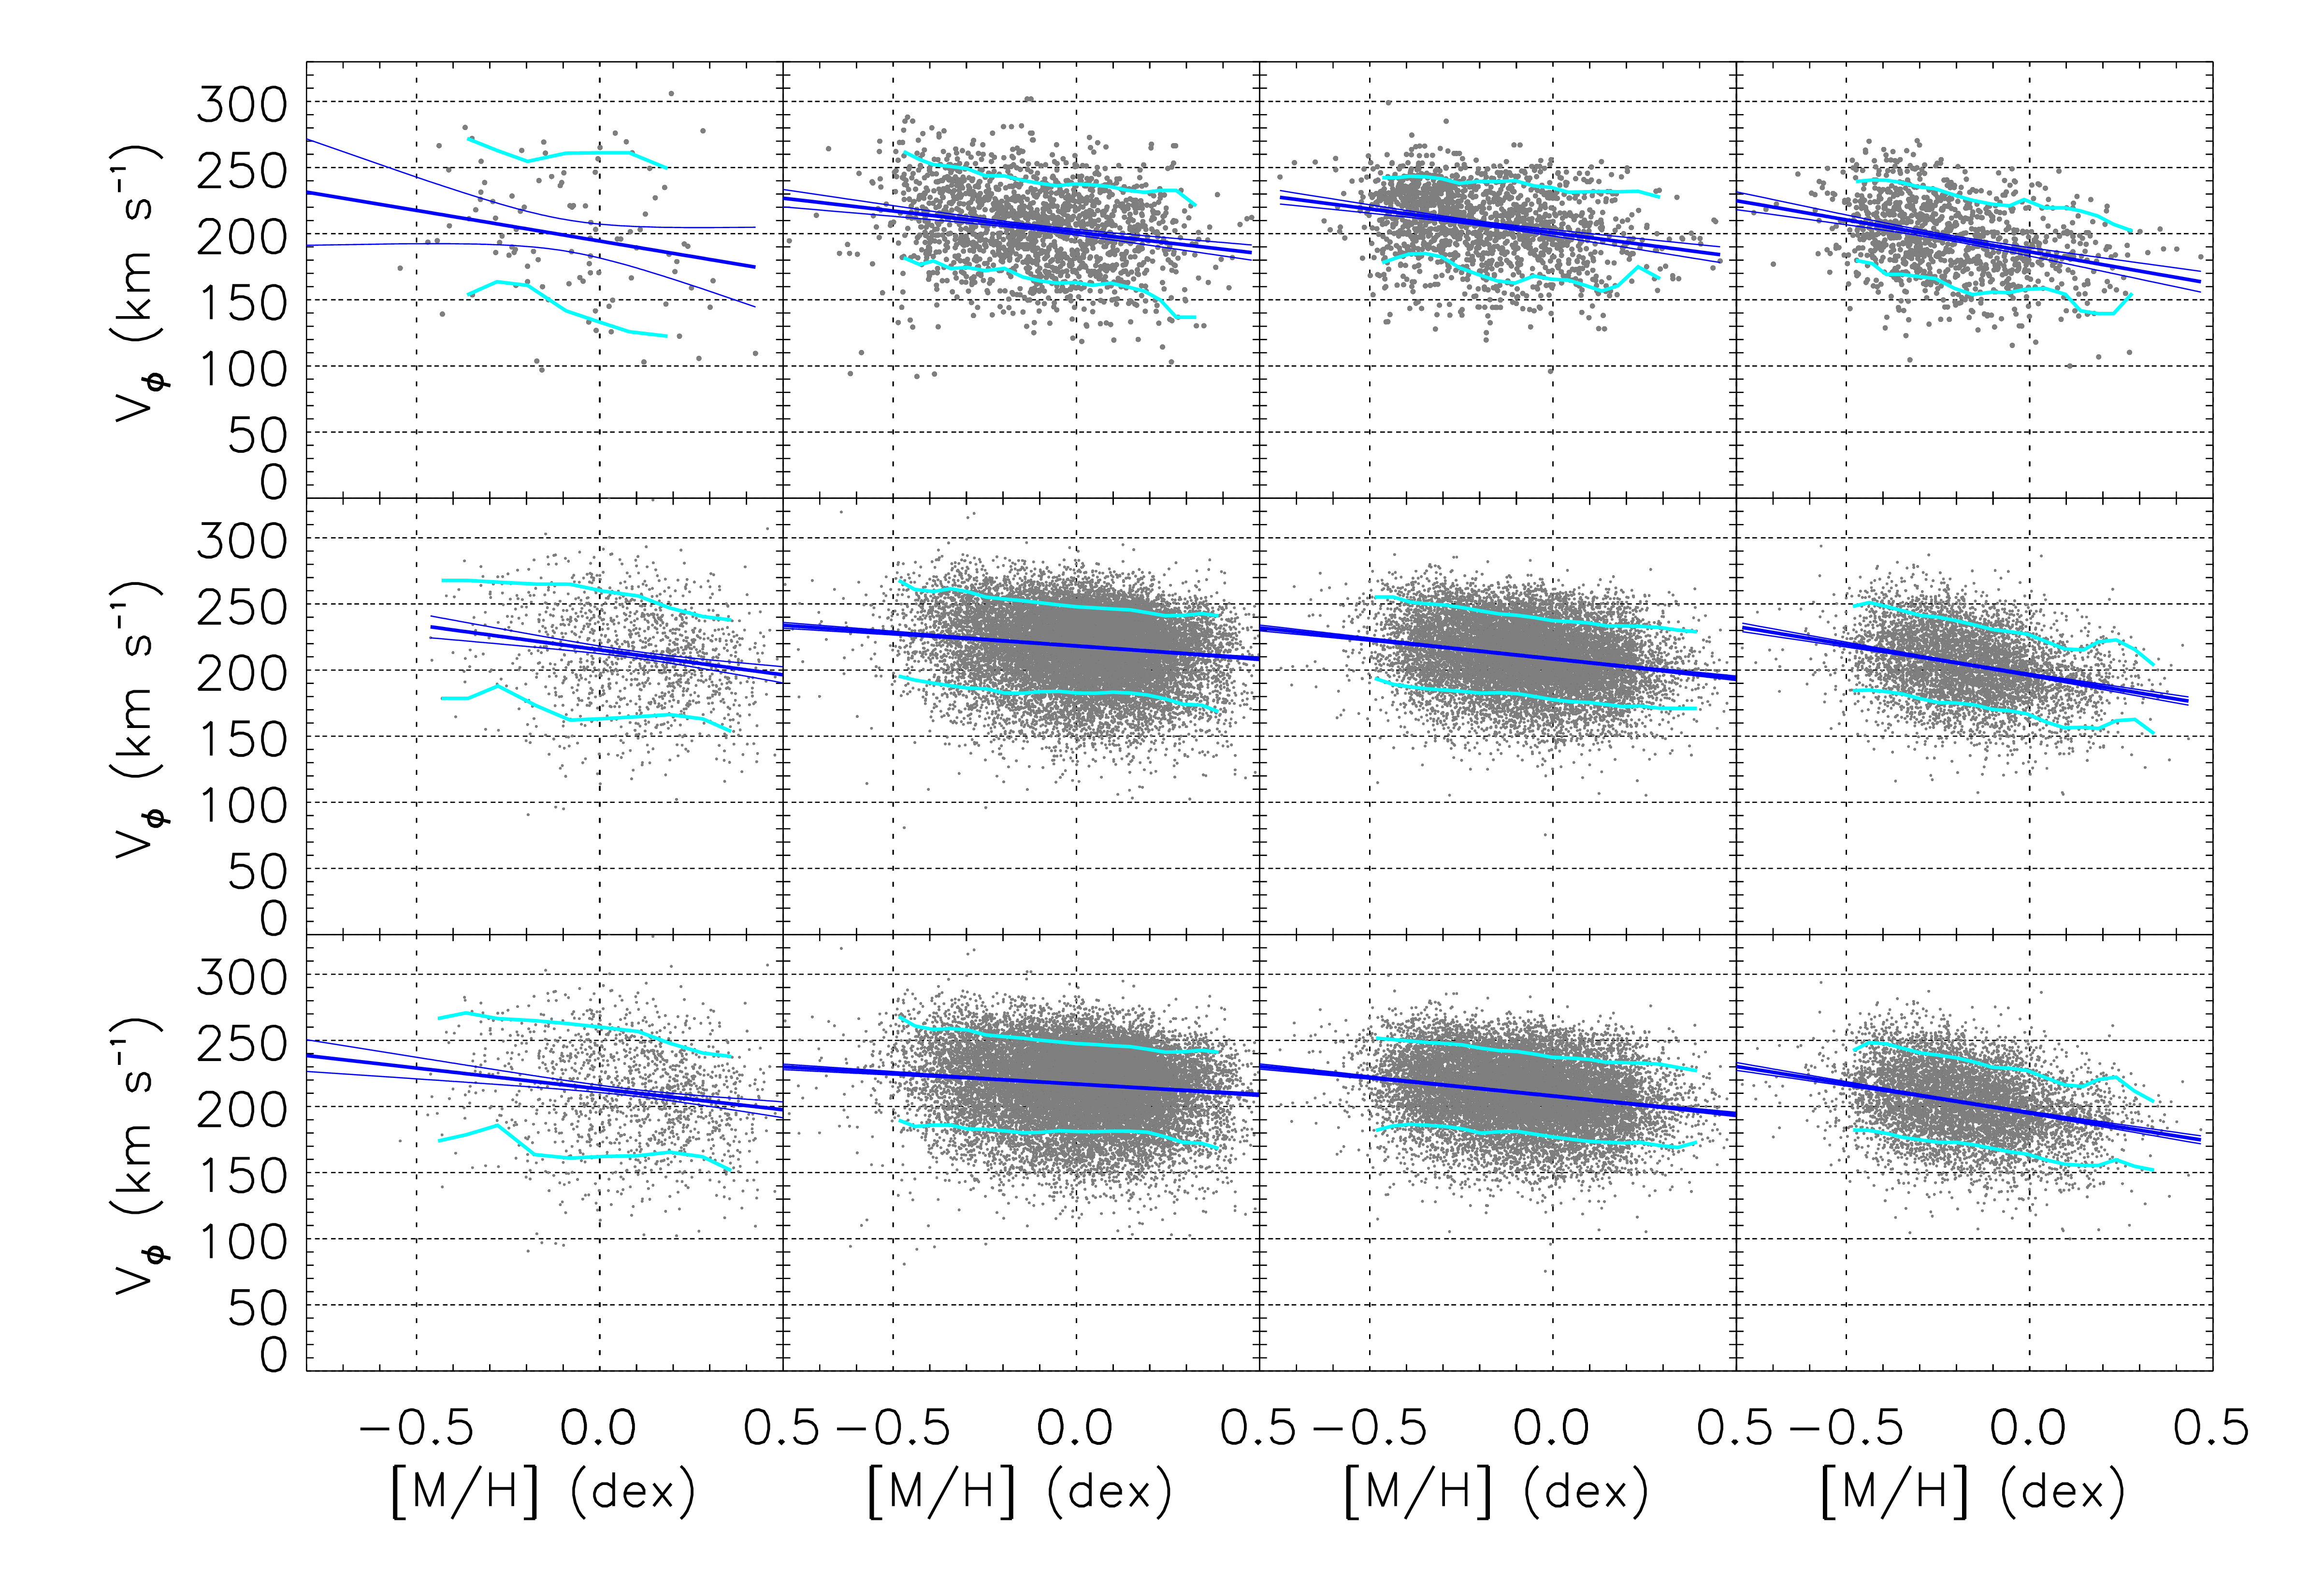
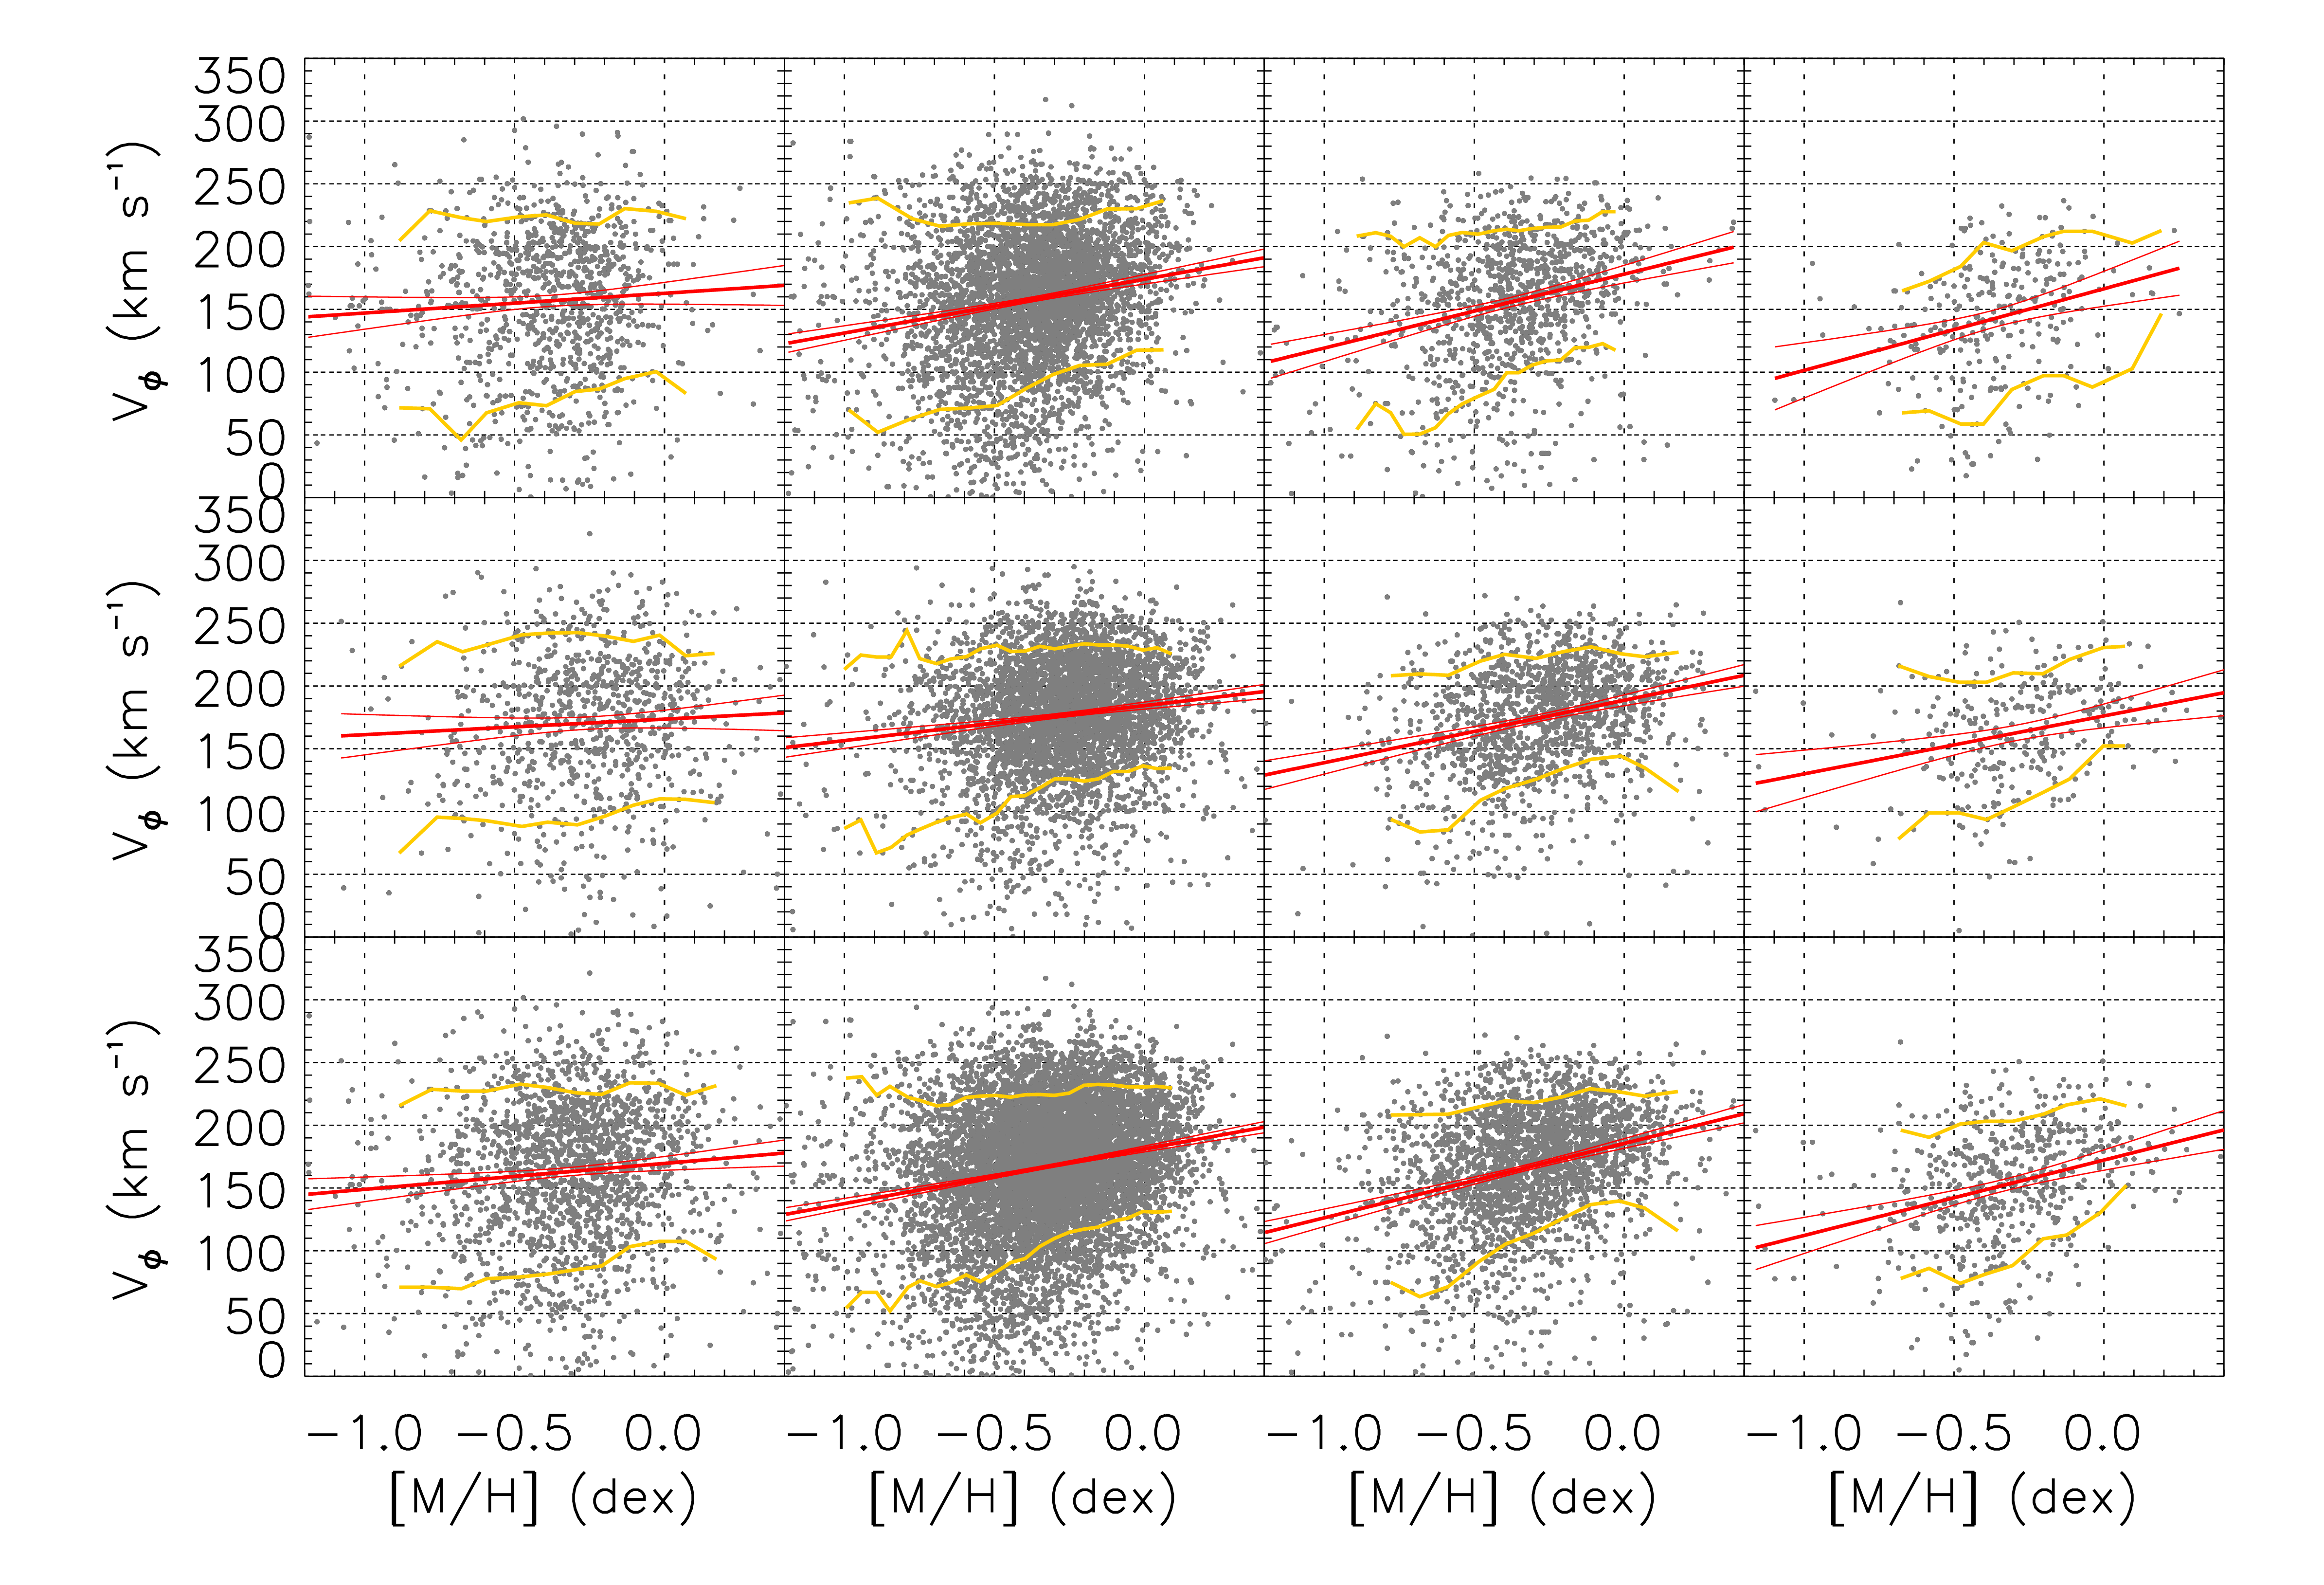
Figs. 5–6 show the distribution of rotational velocity with for thin and thick disk stars, respectively. The slope, , is estimated again via a linear fit to the data for each of the four MW rings and the three Galactic plane strips defined above. Table 2 provides the results of the fits and lists: total number of stars, slope (i.e., the velocity-metallicity gradients), and Spearman’s rank correlation coefficient for each of the bin (in and ) studied. We clearly notice negative velocity-metallicity correlations for thin disk stars at any and throughout the disk; the thick disk population shows quite a similar behaviour but for positive correlations. Moreover, as expected, slows down with increasing for both chemically selected populations.
At the Solar circle, i.e. kpc, a kinematical-metallicity correlation of is estimated for the thick disk between kpc, while a shallower slope is present at kpc (see Fig. 6, second panels from the left). These estimates are quite compatible with the earlier measurements of Spagna et al. (2010), and later confirmed by a number of independent studies (Lee et al., 2011; Kordopatis et al., 2011; Adibekyan et al., 2013; Haywood et al., 2013; Kordopatis et al., 2013; Guiglion et al., 2015; AllendePrieto et al., 2016; Wojno et al., 2016).
Finally, let us briefly address the issue of possible biases related to the known under-sampling of the metal rich tail of the APOGEE Survey (see end of Sect. 2). We tested the robustness of the findings above by repeating all of our linear least-squares fits after applying metallicity cuts , with , to thin and thick disk star samples alike. Within the errors, all the fits appear quite consistent with the results we present in Tables 1 and 2; in other words, we do not find any statistically significant (propagated) bias affecting either the radial metallicity gradients or the rotational-metallicity correlations of both the thin and thick disks.
| Sample | |||||||||
|---|---|---|---|---|---|---|---|---|---|
| N | N | N | N | ||||||
| Thin disk | |||||||||
| Thick disk | |||||||||
| Sample | |||||||||||||
|---|---|---|---|---|---|---|---|---|---|---|---|---|---|
| N | N | N | N | ||||||||||
| Thin | |||||||||||||
| Thick | |||||||||||||
4 Discussion and conclusions
By combining astrometric information from Gaia DR2 with radial velocities and chemical abundances from APOGEE DR14, we measured the radial metallicity gradients and, for the first time, the rotation metallicity correlation of the MW disk populations as function of in a relatively wide radial range spanning from to kpc.
We adopted the usual chemical classification method of thin and thick disk stars based on two main evolutionary sequences in the vs. diagram (Fig. 1). The fact that the chemo-kinematical properties of these two populations are consistent near the Galactic plane and above kpc from it shows the power of the -elements-based classification criterion.
Concerning the radial metallicity gradient, our analysis of the new data confirm the negative slope for the thin disk and the flat (or mildly positive) slope for the thick, as found in previous studies based mainly on spectro-photometric distances (e.g., Carrell et al., 2012; Anders et al., 2014; Recio-Blanco et al., 2014; Li & Zhao, 2017).
As for the velocity-metallicity correlations, , that of the thin disk appears consistently negative throughout the radial range probed. This is in line with expectations given the negative sign of the corresponding chemical gradient exhibited in Fig. 3, and the radial oscillation of the individual stars caused by the epicyclic component due to blurring effects (e.g., Schoenrich & McMillan, 2017; Kawata et al., 2018, and references therein).
The situation appears substantially different for the thick disk.
To the best of our knowledge, Fig. 6 offers for the first time
observational evidence that the circular velocity-metallicity correlation of the thick disk is persistently positive within the
kpc range of Galactocentric distances investigated,
in spite of a quasi-flat metallicity gradient.
This suggests that the chemo-kinematical mechanisms in place for the thin disk are probably replaced, totally or in part,
by other processes (e.g., inside out formation) when dealing with the -enanced population
as discussed by Schoenrich & McMillan (2017) and Kawata et al. (2018).
Their simulations point out that the present-day radial metallicy and rotation-metallicity correlation
of the ancient disk stars reflect the imprints of the cosmological conditions (i.e., the original metallicity gradient of the ISM and inside-out formation),
convolved with the mechanisms of secular dynamical evolution of the MW disk,
and with possible perturbations from satellite mergings.
To this regard, it is quite interesting to compare our Fig. 6 to Fig. in Kawata et al. (2018),
whose first and third rows show a constant positive correlation vs. , which is associated with an almost flat present-day radial metallicity gradient,
as per our Fig. 4.
However, if we look at the two figures in greater detail,
we notice that the observed thick disk rotation-metallicity correlation increases as a function of the galactic radius,
while the simulations show an opposite trend.
Kawata et al. (2018) results derive from N-body MW-like simulations (their C1 and C2-thick1 models)
that assume positive cosmological chemical gradients in the disk, as initially proposed by Curir et al. (2012).
Finally, alternative scenarios, as those suggested by the analytical models of Schoenrich & McMillan (2017),
also deserve further investigations possibly employing fully realistic cosmological simulations of the MW as in Murante et al. (2015).
There is no doubts that the results presented here will help setting crucial constraints on the origin and destiny of the Galactic disk in the context of cosmological models of MW formation.
Acknowledgements
We wish to thank the referee for a careful reading of this manuscript and for the useful comments that helped us improve on the original submission. This work has made use of data from the European Space Agency (ESA) mission Gaia (https://www.cosmos.esa.int/gaia), processed by the Gaia Data Processing and Analysis Consortium (DPAC, https://www.cosmos.esa.int/web/gaia/dpac/consortium). Funding for the DPAC has been provided by national institutions, in particular the institutions participating in the Gaia Multilateral Agreement. This work has been funded in part by the Italian Space Agency (ASI) under contract No. 2014-025-R.1.2015 “Gaia Mission - The Italian Participation to DPAC".
References
- Abadi et al. (2003) Abadi M. G., Navarro J. F., Steinmetz M., Eke V. R., 2003, ApJ, 597, 21
- Abolfathi et al. (2018) Abolfathi B., et al., 2018, ApJS, 235, 42
- AllendePrieto et al. (2016) Allende Prieto C., Kawata D., Cropper M., 2016, A&A, 596, 98
- Adibekyan et al. (2013) Adibekyan V. Z., et al., 2013, A&A, 554, 44
- Anders et al. (2014) Anders F., et al., 2014, A&A, 564, 115
- Brook et al. (2005) Brook C. B., Gibson B. K., Martel H., Kawata D., 2005, ApJ, 630, 298
- Carrell et al. (2012) Carrell K., Chen Y., Zhao G., 2012, AJ, 144, 185
- Curir et al. (2012) Curir A., Lattanzi M. L., Spagna A., Matteucci F., Murante G., Re Fiorentin P., Spitoni E., 2012, A&A, 545, 133
- Gaia Collaboration (2018) Gaia Collaboration: Brown A. G. A., et al., 2018, A&A, 616, A1
- Garcia et al. (2016) Garcia Perez A. E., et al., 2016, AJ, 151, 144
- Gilmore & Reid (1983) Gilmore G., Reid N., 1983, MNRAS, 202, 1025
- Guiglion et al. (2015) Guiglion G., et al., 2015, A&A, 583, 91
- Hayden et al. (2014) Hayden M., et al., 2014, AJ, 147, 116
- Haywood et al. (2013) Haywood M., Di Matteo P., Lehnert M. D., Katz D., Gomez A., 2013, A&A, 560,109
- Haywood et al. (2015) Haywood M., Di Matteo P., Snaith O., Lehnert M. D., 2015 A&A 579 A5
- Holtzman et al. (2015) Holtzman J. A., et al., 2015, AJ, 150, 148
- Kawata et al. (2018) Kawata D., et al., 2018, MNRAS, 473, 867
- Kordopatis et al. (2011) Kordopatis G., et al., 2011, A&A, 535, 107
- Kordopatis et al. (2013) Kordopatis G., et al., 2013, MNRAS, 436, 3231
- Kordopatis et al. (2017) Kordopatis G., Wyse R. F. G., Chiappini C., Minchev I., Anders F., Santiago B., 2017, MNRAS, 467, 469
- Lee et al. (2011) Lee Y. S., et al., 2011, ApJ, 738, 187
- Li & Zhao (2017) Li C., Zhao G., 2017, ApJ, 850, 25
- Lindegren et al. (2018) Lindegren L., et al., 2018, A&A, 616, A2
- Murante et al. (2015) Murante G., Monaco P., Borgani S., Tornatore L., Dolag K., Goz D., 2015, MNRAS, 447, 178
- Peng et al. (2018) Peng X., et al., 2018, PASP, 130, 4102
- Majewski et al. (2017) Majewski S. R., et al., 2017, AJ, 154, 94
- McMillan (2017) McMillan P. J., 2010, MNRAS, 465, 76
- Minchev et al. (2017) Minchev I., Steinmetz M., Chiappini C., Martig M., Anders F., Matijevic G., de Jong R. S., 2017, ApJ, 834, 27
- Recio-Blanco et al. (2014) Recio-Blanco A., et al., 2014, A&A, 567, 5
- Roskar et al. (2008) Roskar R., Debattista V. P., Stinson G. S., Quinn T. R., Kaufmann T., Wadsley J., 2008, ApJ, 675, L65
- Schoenrich & Binney (2009) Schoenrich R., Binney J., 2009, MNRAS, 396, 203
- Schoenrich et al. (2010) Schoenrich R., Binney J., Dehnen W., 2010, MNRAS, 403, 1829
- Schoenrich & McMillan (2017) Schoenrich R., McMillan P. J., 2017, MNRAS, 467, 1154
- Spagna et al. (2010) Spagna A., Lattanzi M. G., Re Fiorentin P., Smart R. L., 2010, A&A, 510, L4
- Villalobos & Helmi (2008) Villalobos A., Helmi A., 2008, MNRAS, 391, 1806
- Wojno et al. (2016) Wojno J., et al., 2016, MNRAS, 461, 4246
- Zamora et al. (2015) Zamora O., et al., 2015, AJ, 149, 181
- Zasowski et al. (2013) Zasowski G., et al., 2013, AJ, 146, 81