Nearly 100% of the sky is covered by Lyman- emission around high redshift galaxies
to be published in Nature
– Preprint, authors’ version
Abstract
Galaxies are surrounded by large reservoirs of gas, mostly hydrogen, fed by inflows from the intergalactic medium and by outflows due to galactic winds. Absorption-line measurements along the sightlines to bright and rare background quasars indicate that this circumgalactic medium pervades far beyond the extent of starlight in galaxies, but very little is known about the spatial distribution of this gas. A new window into circumgalactic environments was recently opened with the discovery of ubiquitous extended Lyman- emission from hydrogen around high-redshift galaxies[1, 2], facilitated by the extraordinary sensitivity of the MUSE instrument at the ESO Very Large Telescope[3]. Due to the faintness of this emission, such measurements were previously limited to especially favourable systems[4, 5, 6] or to massive statistical averaging[7, 8]. Here we demonstrate that low surface brightness Lyman- emission surrounding faint galaxies at redshifts between 3 and 6 adds up to a projected sky coverage of nearly 100%. The corresponding rate of incidence (the mean number of Lyman- emitters penetrated by any arbitrary line of sight) is well above unity and similar to the incidence rate of high column density absorbers frequently detected in the spectra of distant quasars[9, 10, 11, 12]. This similarity suggests that most circumgalactic atomic hydrogen at these redshifts has now been detected also in emission.
Leibniz-Institut für Astrophysik Potsdam (AIP), An der Sternwarte 16, 14482 Potsdam, Germany
Univ Lyon, Univ Lyon1, Ens de Lyon, CNRS, Centre de Recherche Astrophysique de Lyon UMR5574, F-69230, Saint-Genis-Laval, France
Leiden Observatory, Leiden University, PO Box 9513, 2300 RA Leiden, The Netherlands
Instituto de Astrofísica e Ciências do Espaço, Universidade do Porto, CAUP, rua das Estrelas, 4150-762 Porto, Portugal
Department of Physics, ETH Zürich, CH-8093 Zürich, Switzerland
Institut für Physik und Astronomie, Universität Potsdam, 14476 Potsdam, Germany
Institut de Recherche en Astrophysique et Planétologie (IRAP), Université de Toulouse, CNRS, UPS, 31400 Toulouse, France
Department of Astronomy, Stockholm University, AlbaNova University Centre, 10691 Stockholm, Sweden
Instituto de Astrofísica de Canarias (IAC), 38205 La Laguna, Tenerife, Spain
Universidad de La Laguna, Dpto. Astrofísica, 38206 La Laguna, Tenerife, Spain
The Lyman- transition of atomic hydrogen at 121.6 nm (short: Ly) is an important tracer of warm ( K) gas in and around galaxies, especially at cosmological redshifts where the line becomes observable with ground-based observatories. Tracing cosmic hydrogen through its Ly emission has been a long-standing goal of observational astrophysics[13, 14, 15], but the extremely low surface brightness of spatially extended Ly emission is a formidable obstacle in this quest. An important technological step forward in this respect has been afforded by the Multi-Unit Spectroscopic Explorer (MUSE), developed by our team and installed in 2014 at the ESO Very Large Telescope[16, 17]. MUSE was specifically designed for maximum sensitivity to Ly emission in the redshift range 2.9–6.6, a key era in the formation and evolution of galaxies. We performed very long MUSE exposures in two fields that were previously mapped to extreme depths with the Hubble Space Telescope (HST): the Hubble Deep Field South[18] and the Hubble Ultra Deep Field[19]. In our MUSE data we detected 270 Ly emitting galaxies at (Methods), many of which are barely visible with HST. Extended Ly haloes around these galaxies can be traced to distances of several arcseconds from the source centres[1, 2].
In a first approach to estimate the integrated cross-section of extended Ly emission we constructed redshift-integrated Ly maps in the two observed fields as follows (Methods): We extracted pseudo-narrowband Ly subimages around each object from the MUSE data. Co-adding all subimages over the full redshift range followed by some spatial filtering yielded a Ly image for each field. Fig. 1 shows this image for the HUDF. Counting the number of pixels above a given Ly surface brightness yields the fractional sky coverage . For a threshold of erg s-1 cm-2 arcsec-2 – the typical limiting surface brightness in the narrowband images – we find a sky coverage of 46% in the HUDF and 45% in the HDFS (Methods). While this result already suggests that the sky coverage might further increase for even lower thresholds, the approach is hampered by noise and the need to apply spatial filtering.
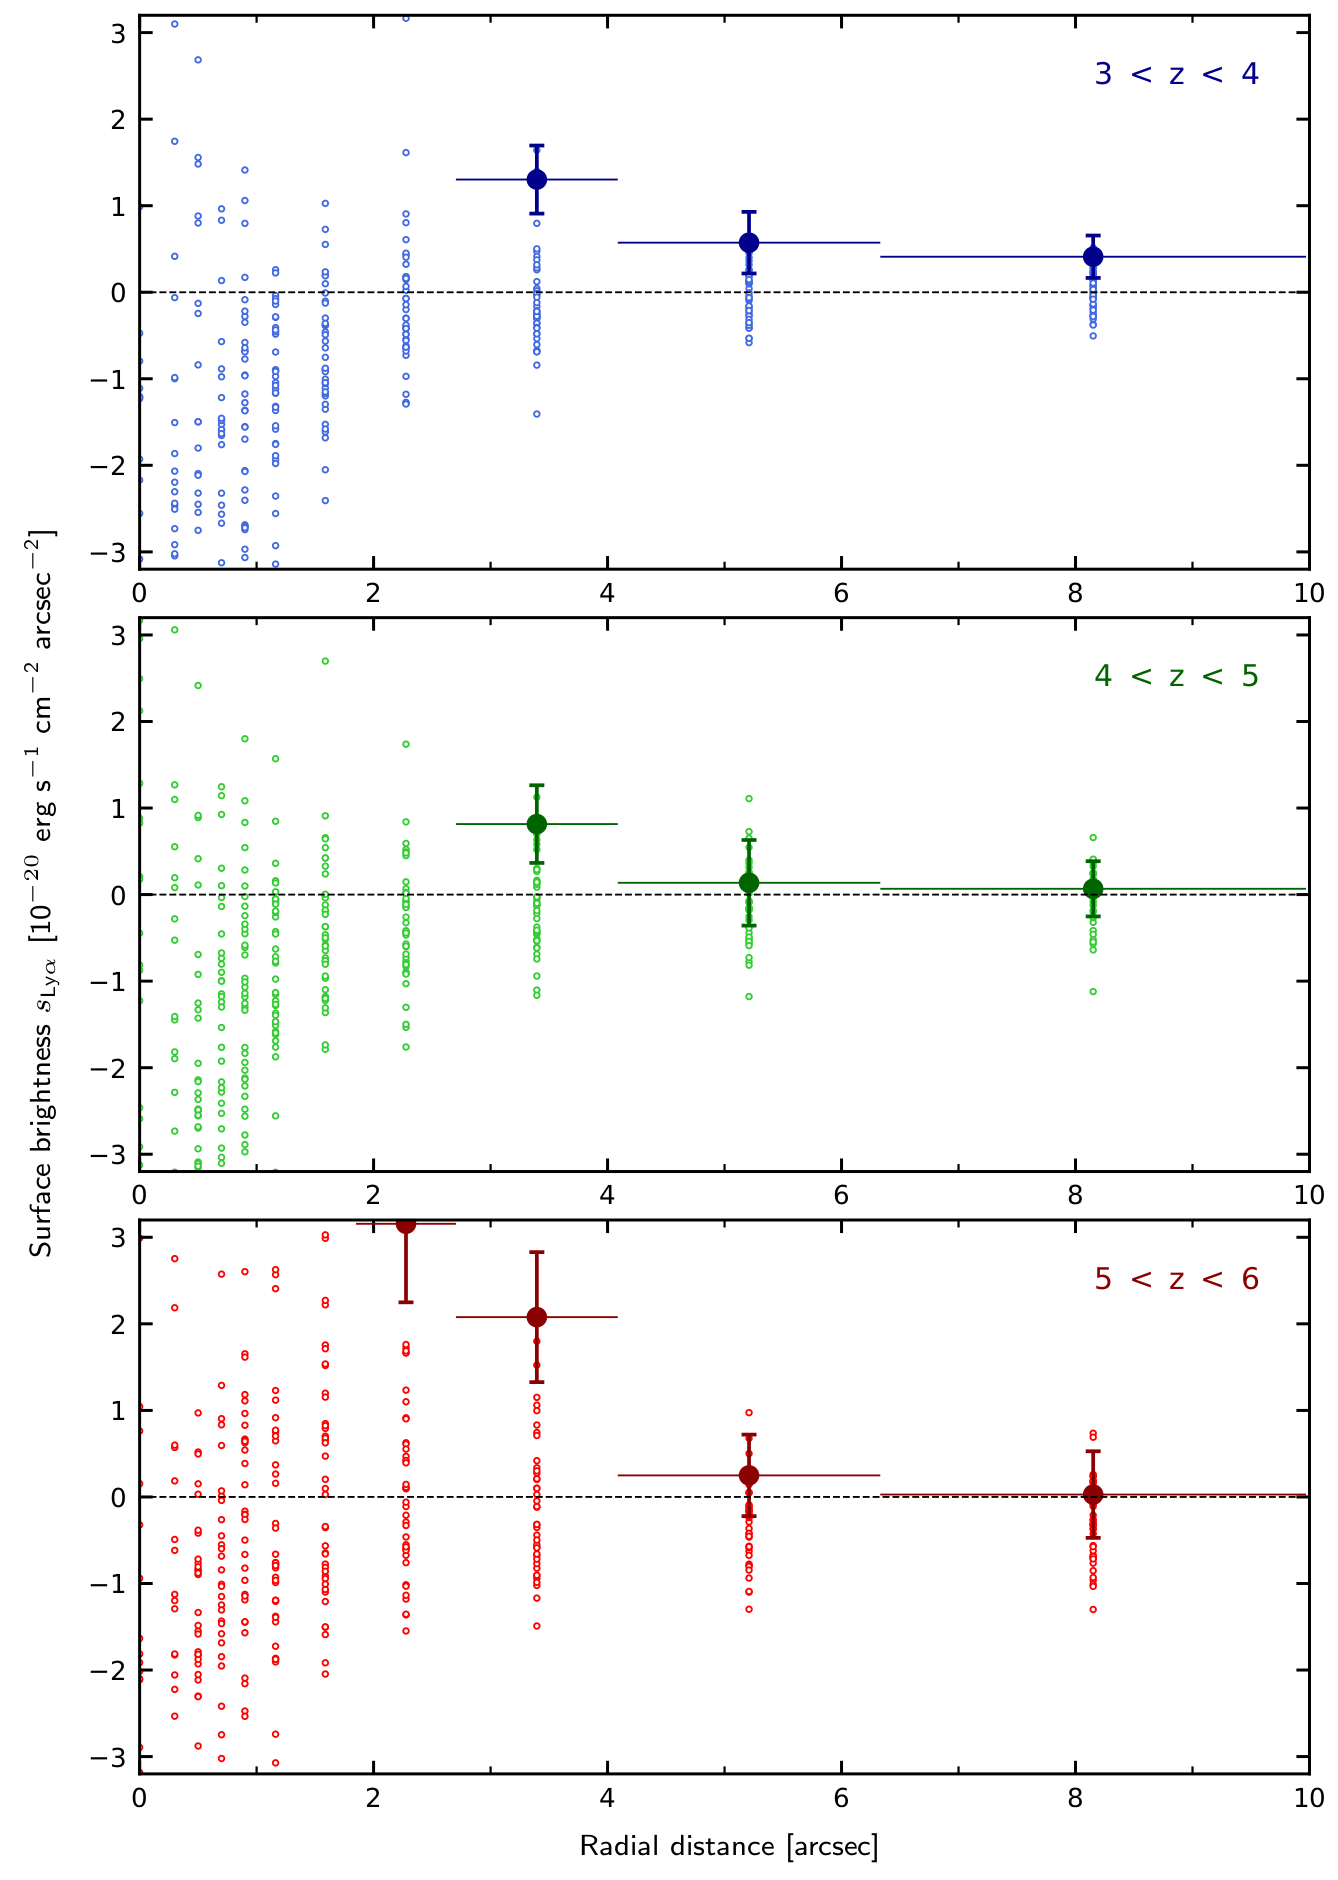
To lower the surface brightness limit beyond the sensitivity of individual sightlines, we employed a combination of azimuthal averaging and image stacking (Methods). We first computed radial Ly surface brightness profiles for each object by averaging over concentric annuli. Motivated by the fact that our Ly halo profiles do not, on average, depend strongly on Ly luminosity[2], we then median-combined the individual images in three redshift bins (3–4, 4–5, 5–6), and approximated the radial profiles of the median images by smooth fitting functions. Fig. 2 illustrates this process. Rescaled to the actual Ly fluxes of our objects, the median-stacked profiles reach surface brightness levels of erg s-1 cm-2 arcsec-2 (), an order of magnitude below the limit achievable for single sightlines.
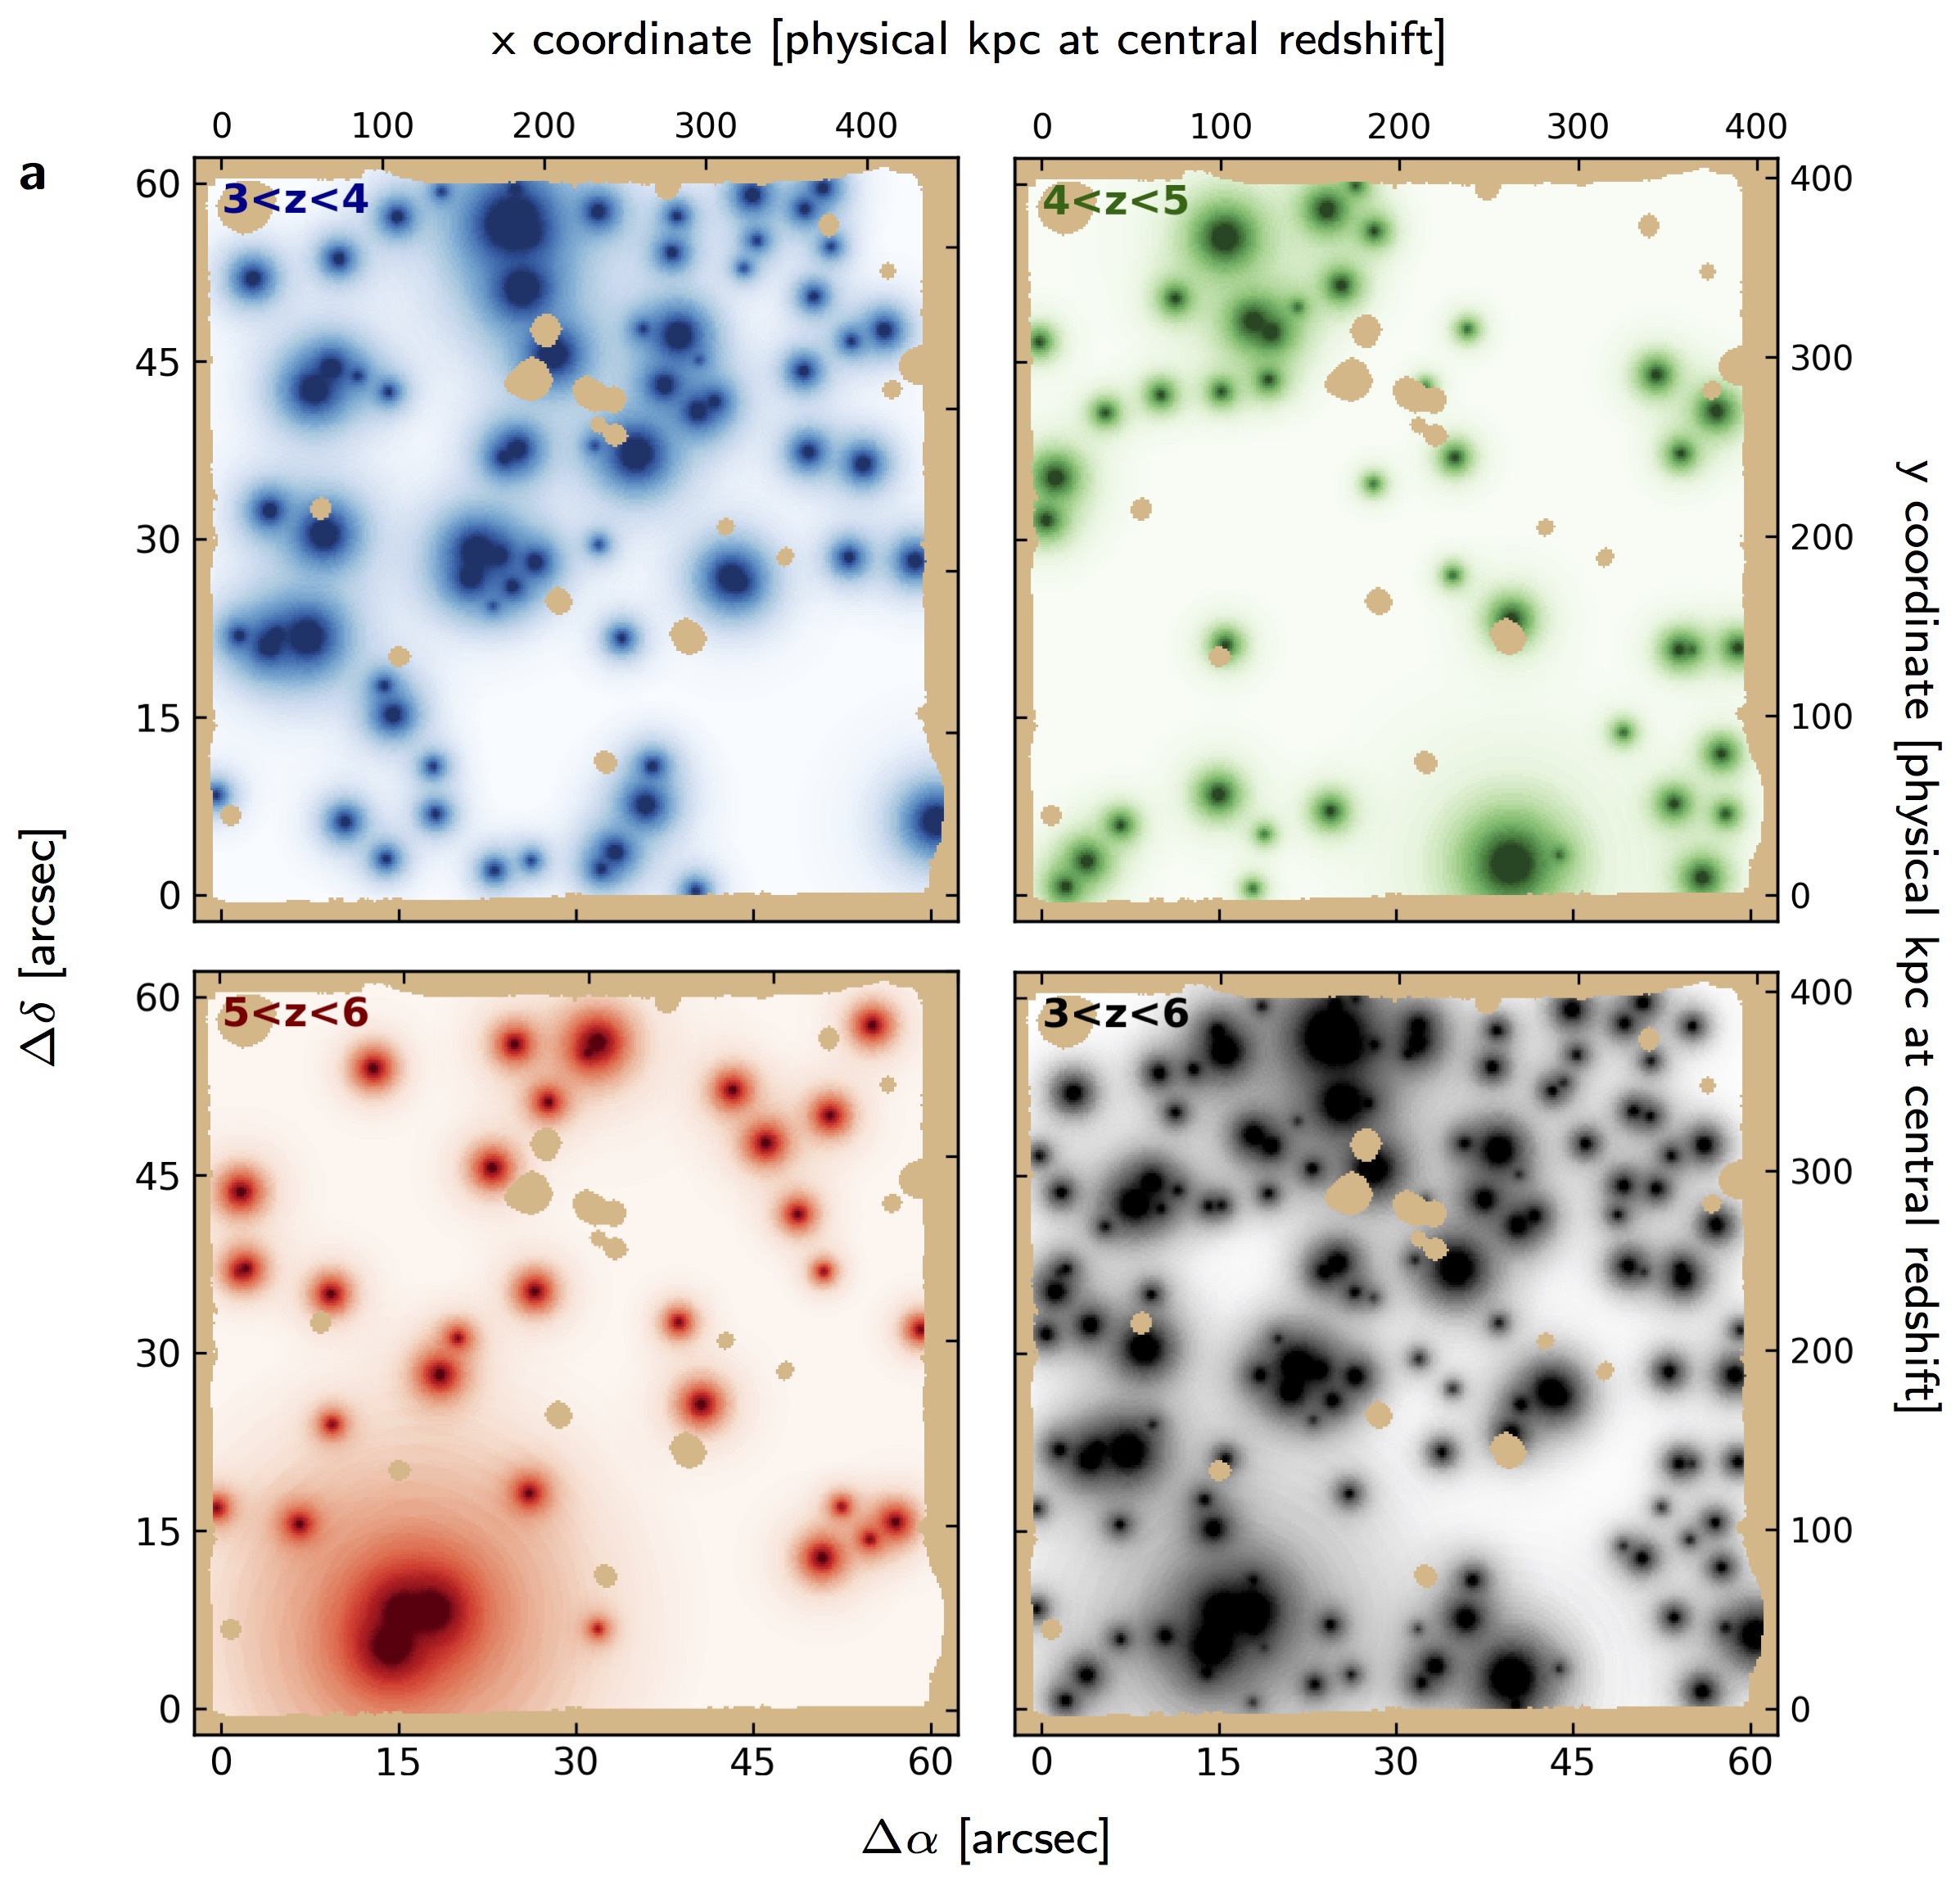
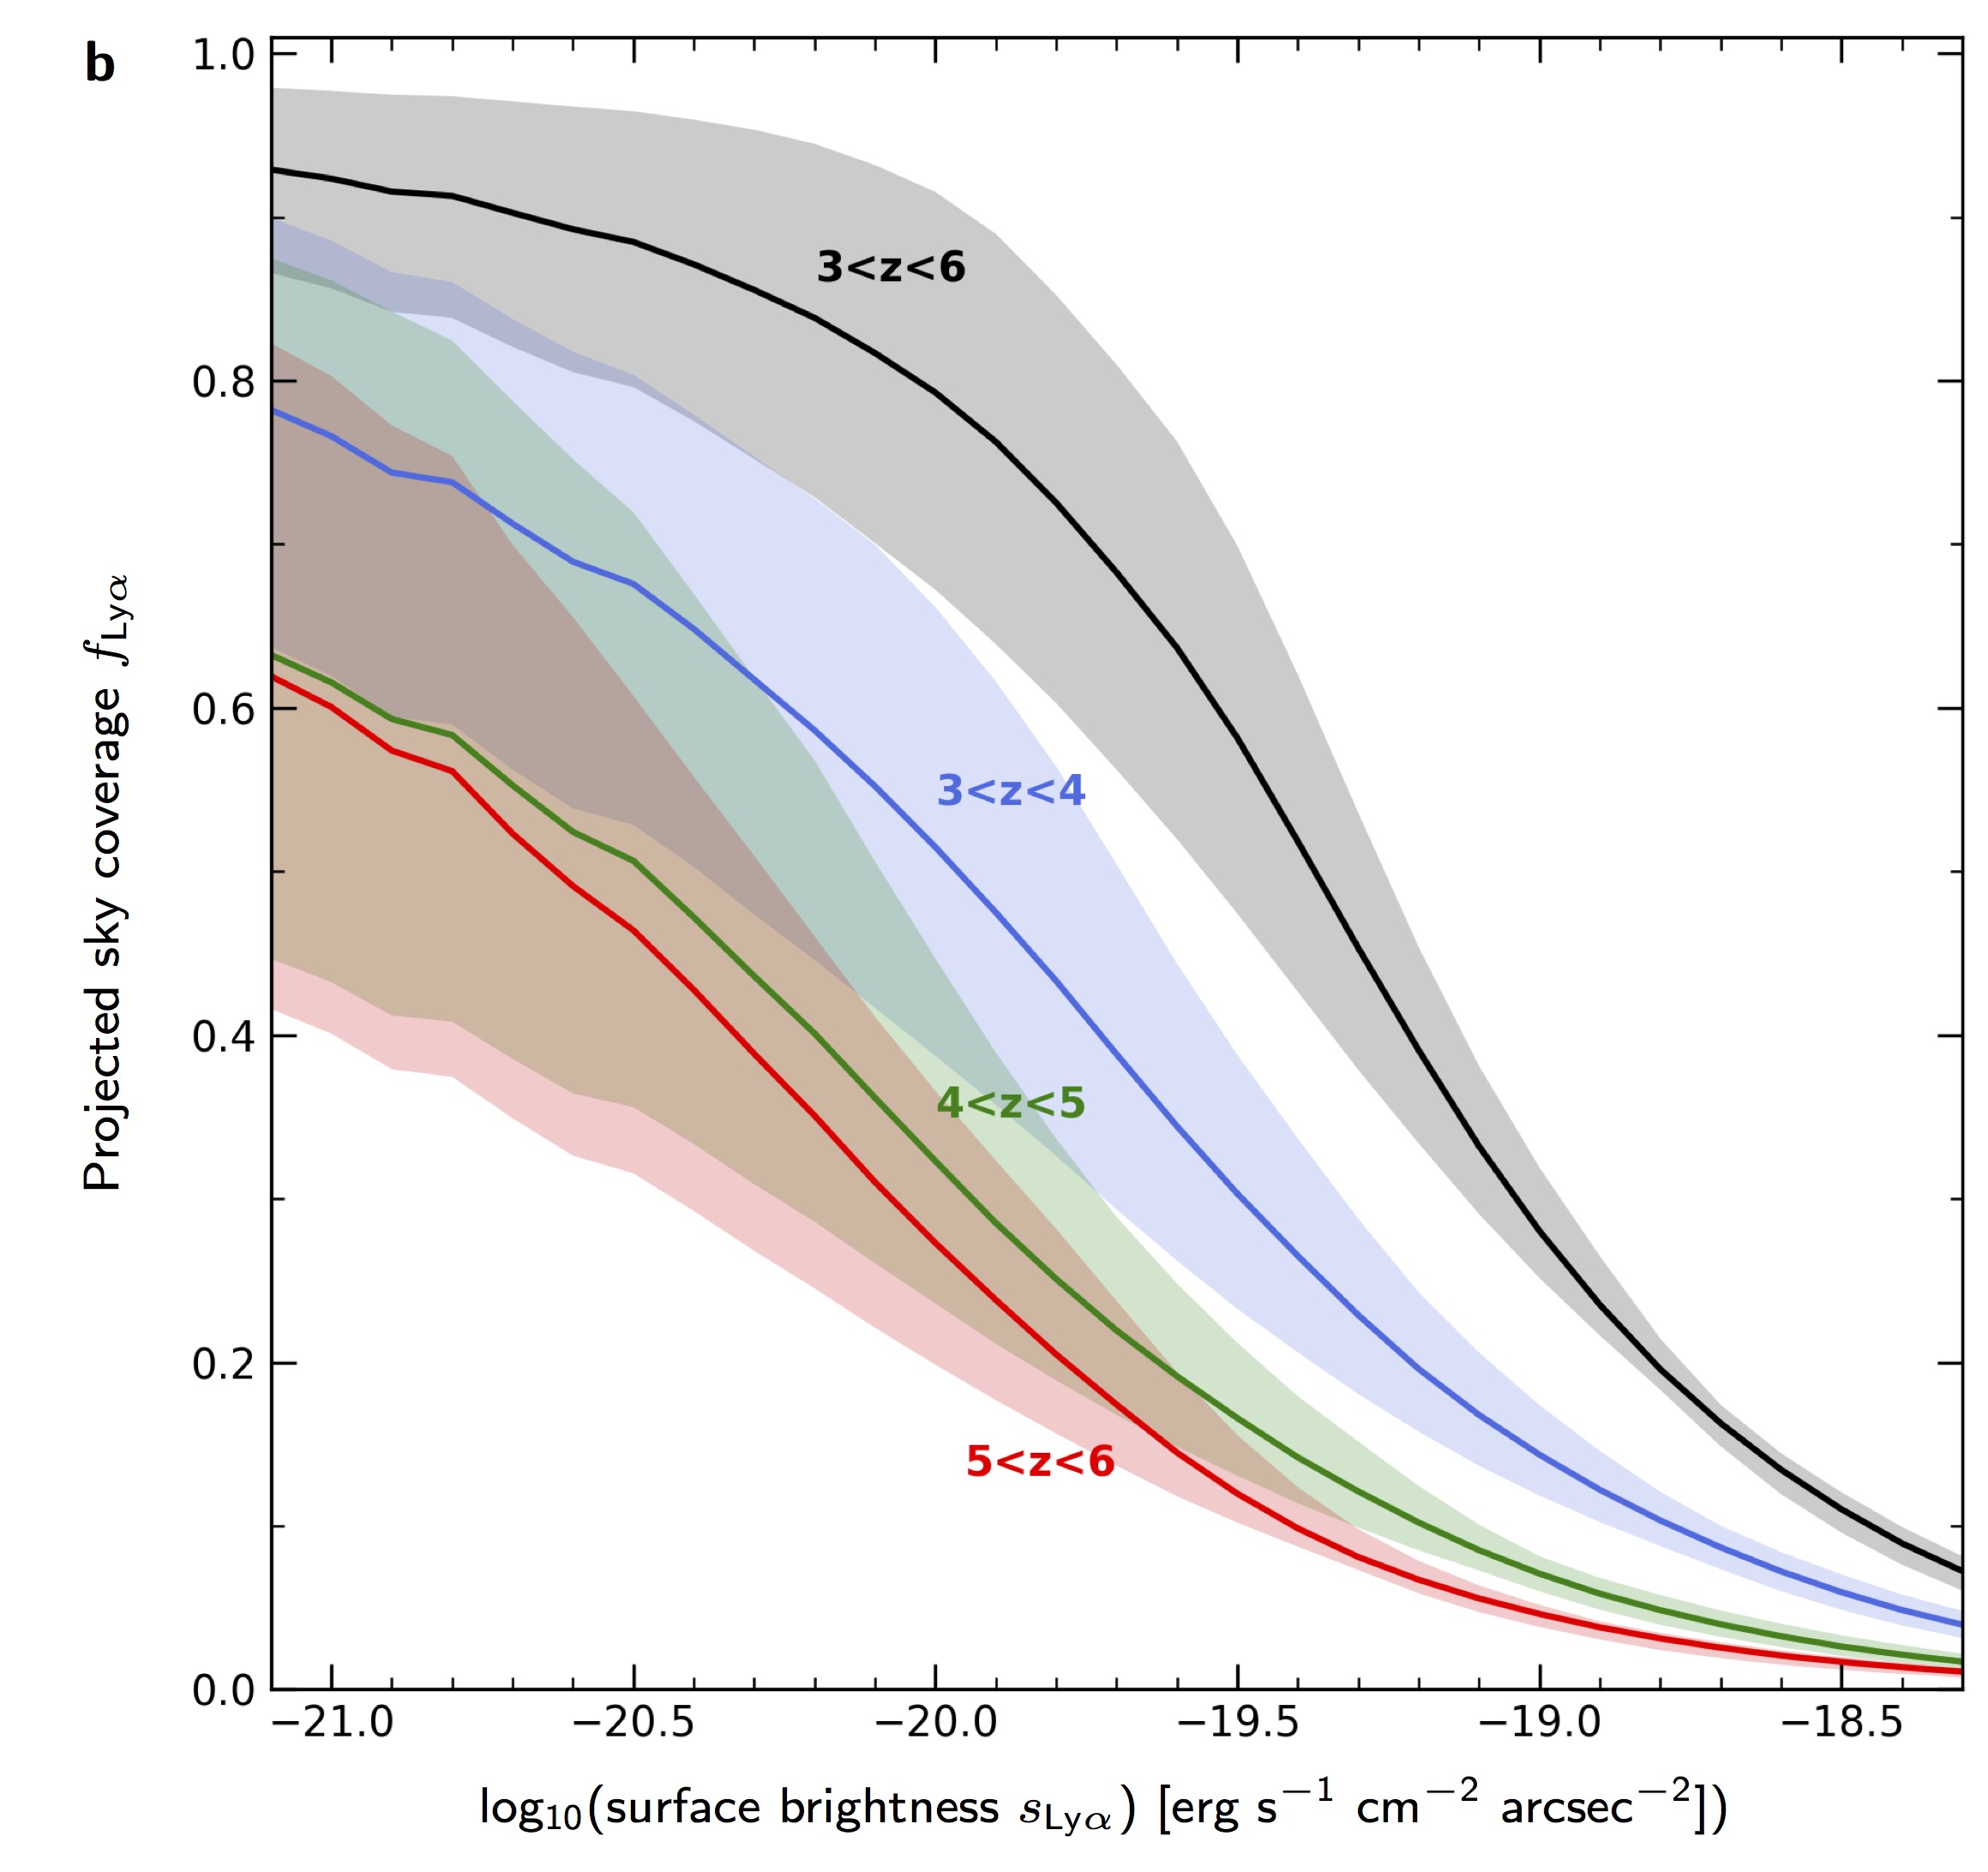
From the scaled median-stacked profiles we created synthetic Ly maps for the three redshift bins and for the full redshift range. These maps, shown in Fig. 3a, represent idealised, noise-free and seeing-corrected models of the Ly distribution in the sky. The resulting cumulative fractional Ly sky coverage is shown in Fig. 3b as a function of the surface brightness threshold. At erg s-1 cm-2 arcsec-2, is already well above 80% and still increasing. At the faintest levels probed by our data, the values of formally add up to more than 100%, a clear sign that Ly emission regions at different redshifts substantially overlap in projection.
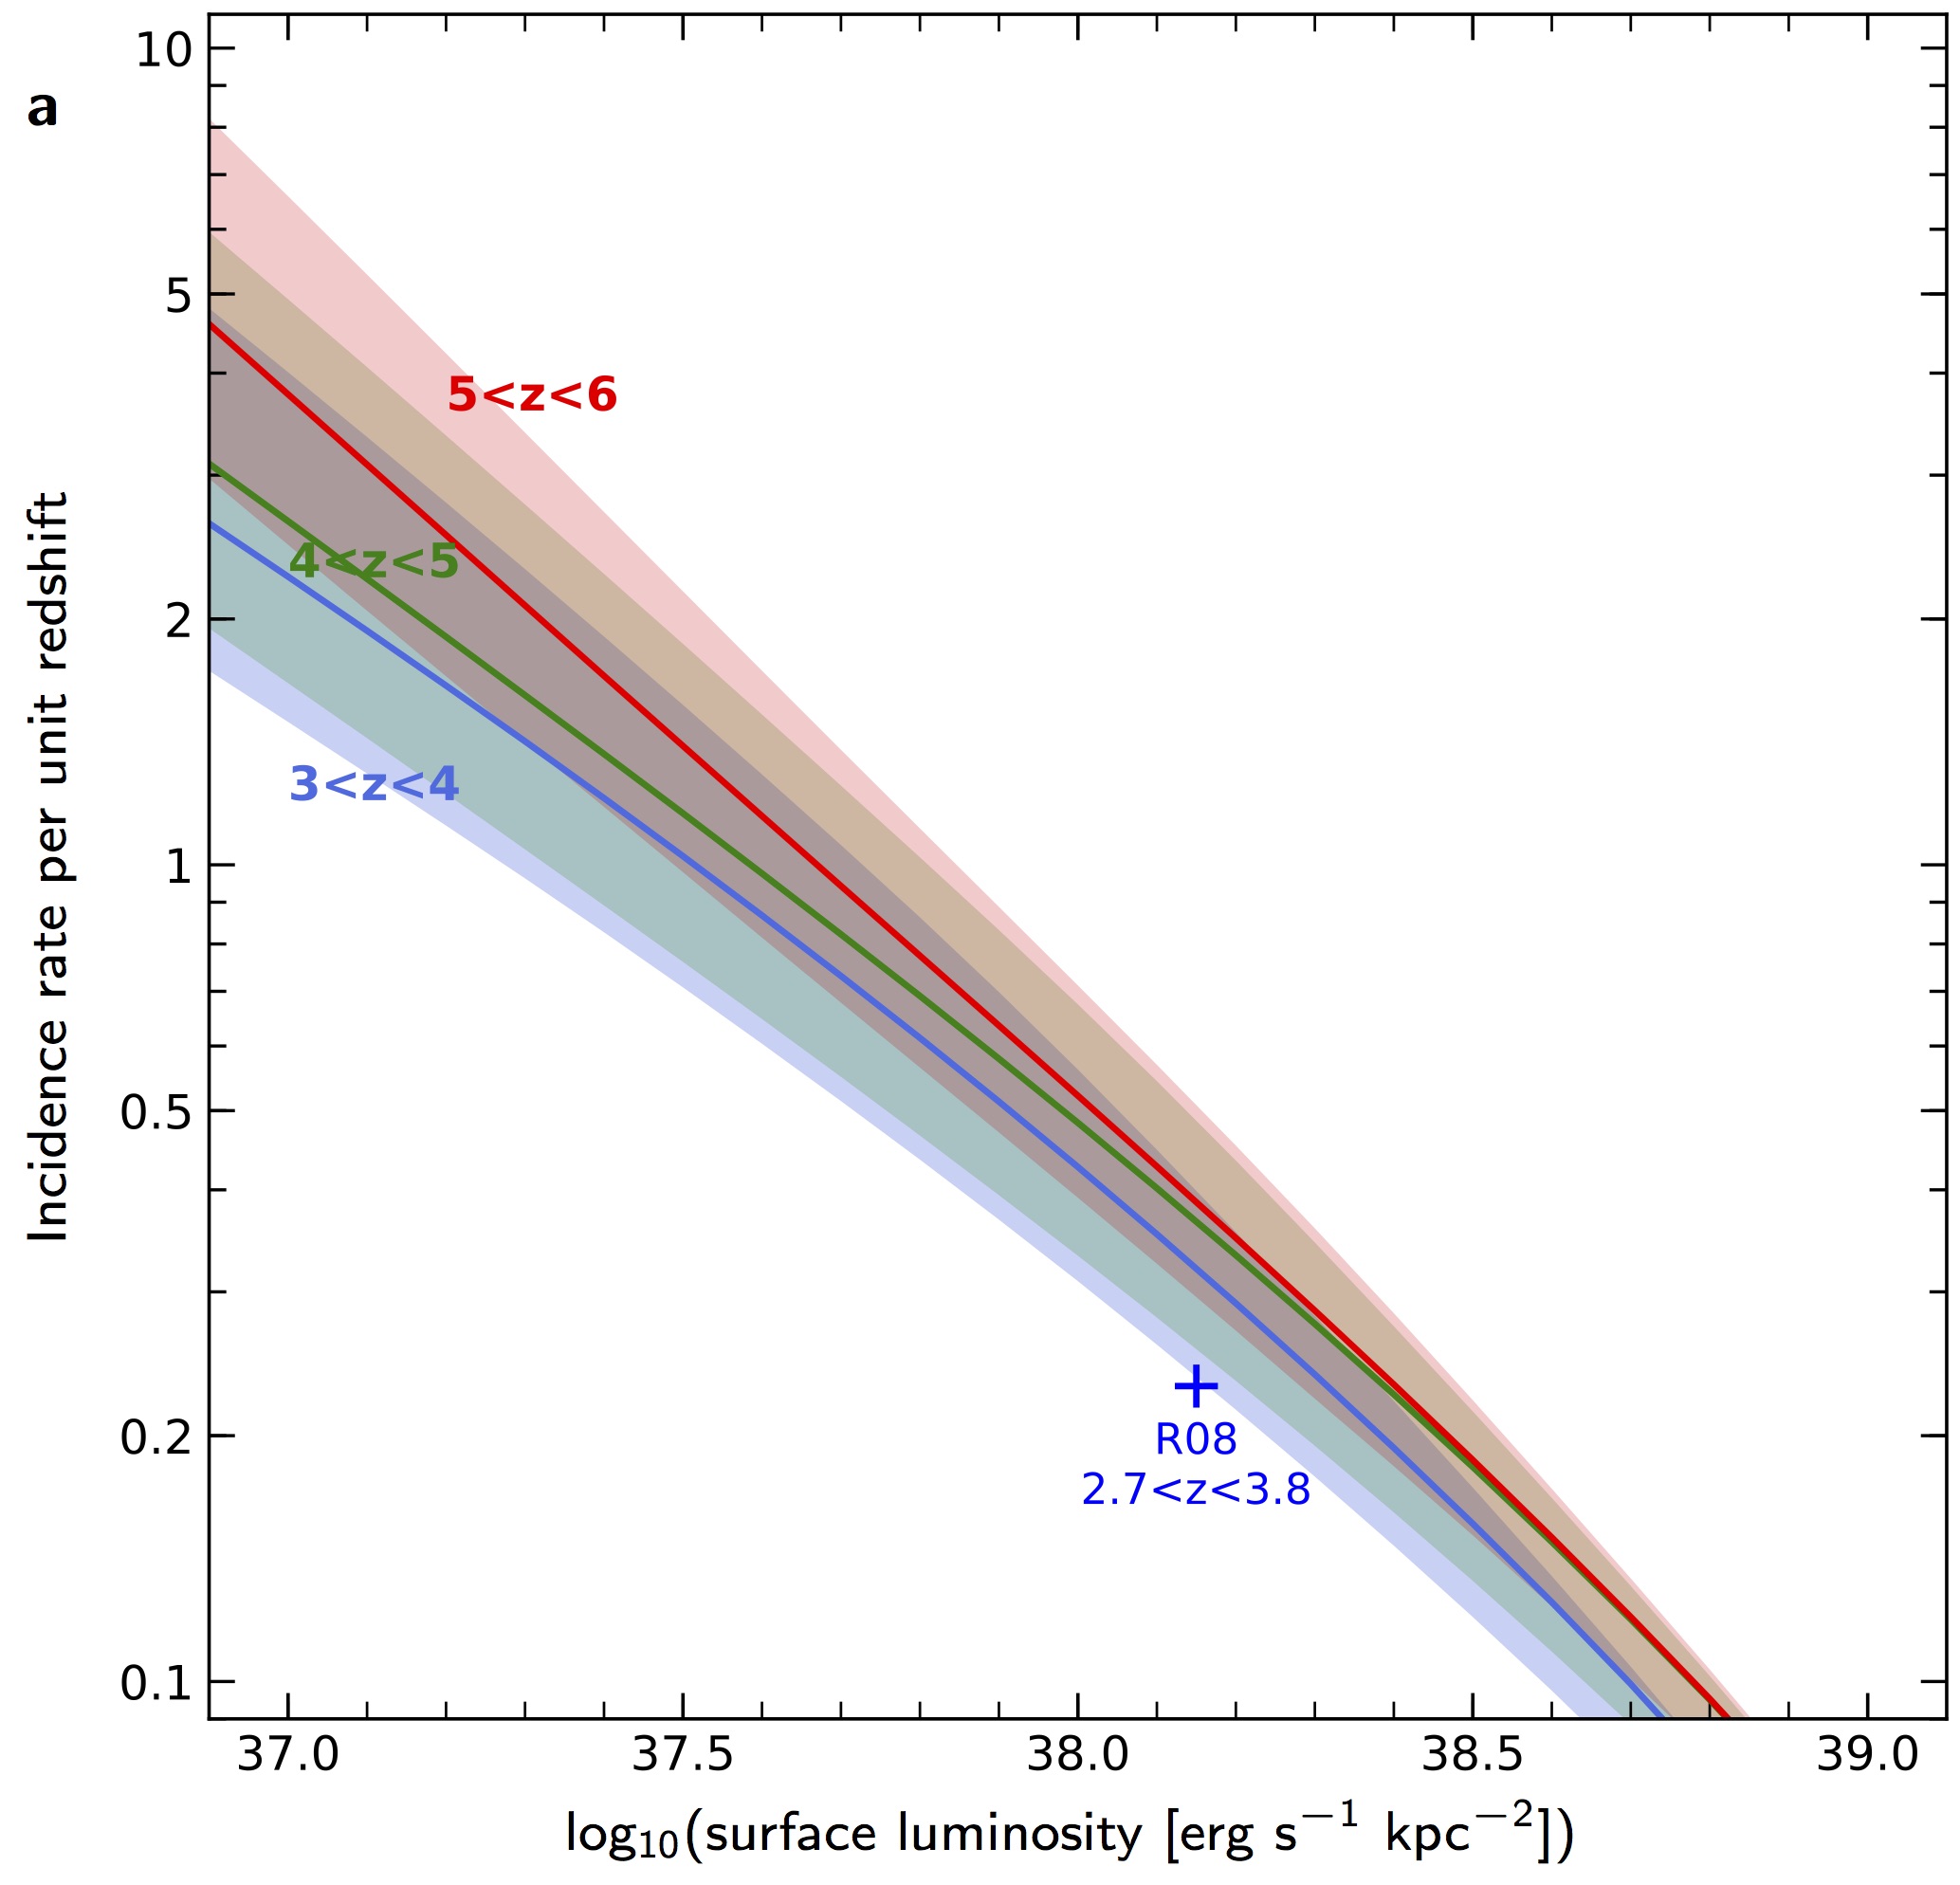
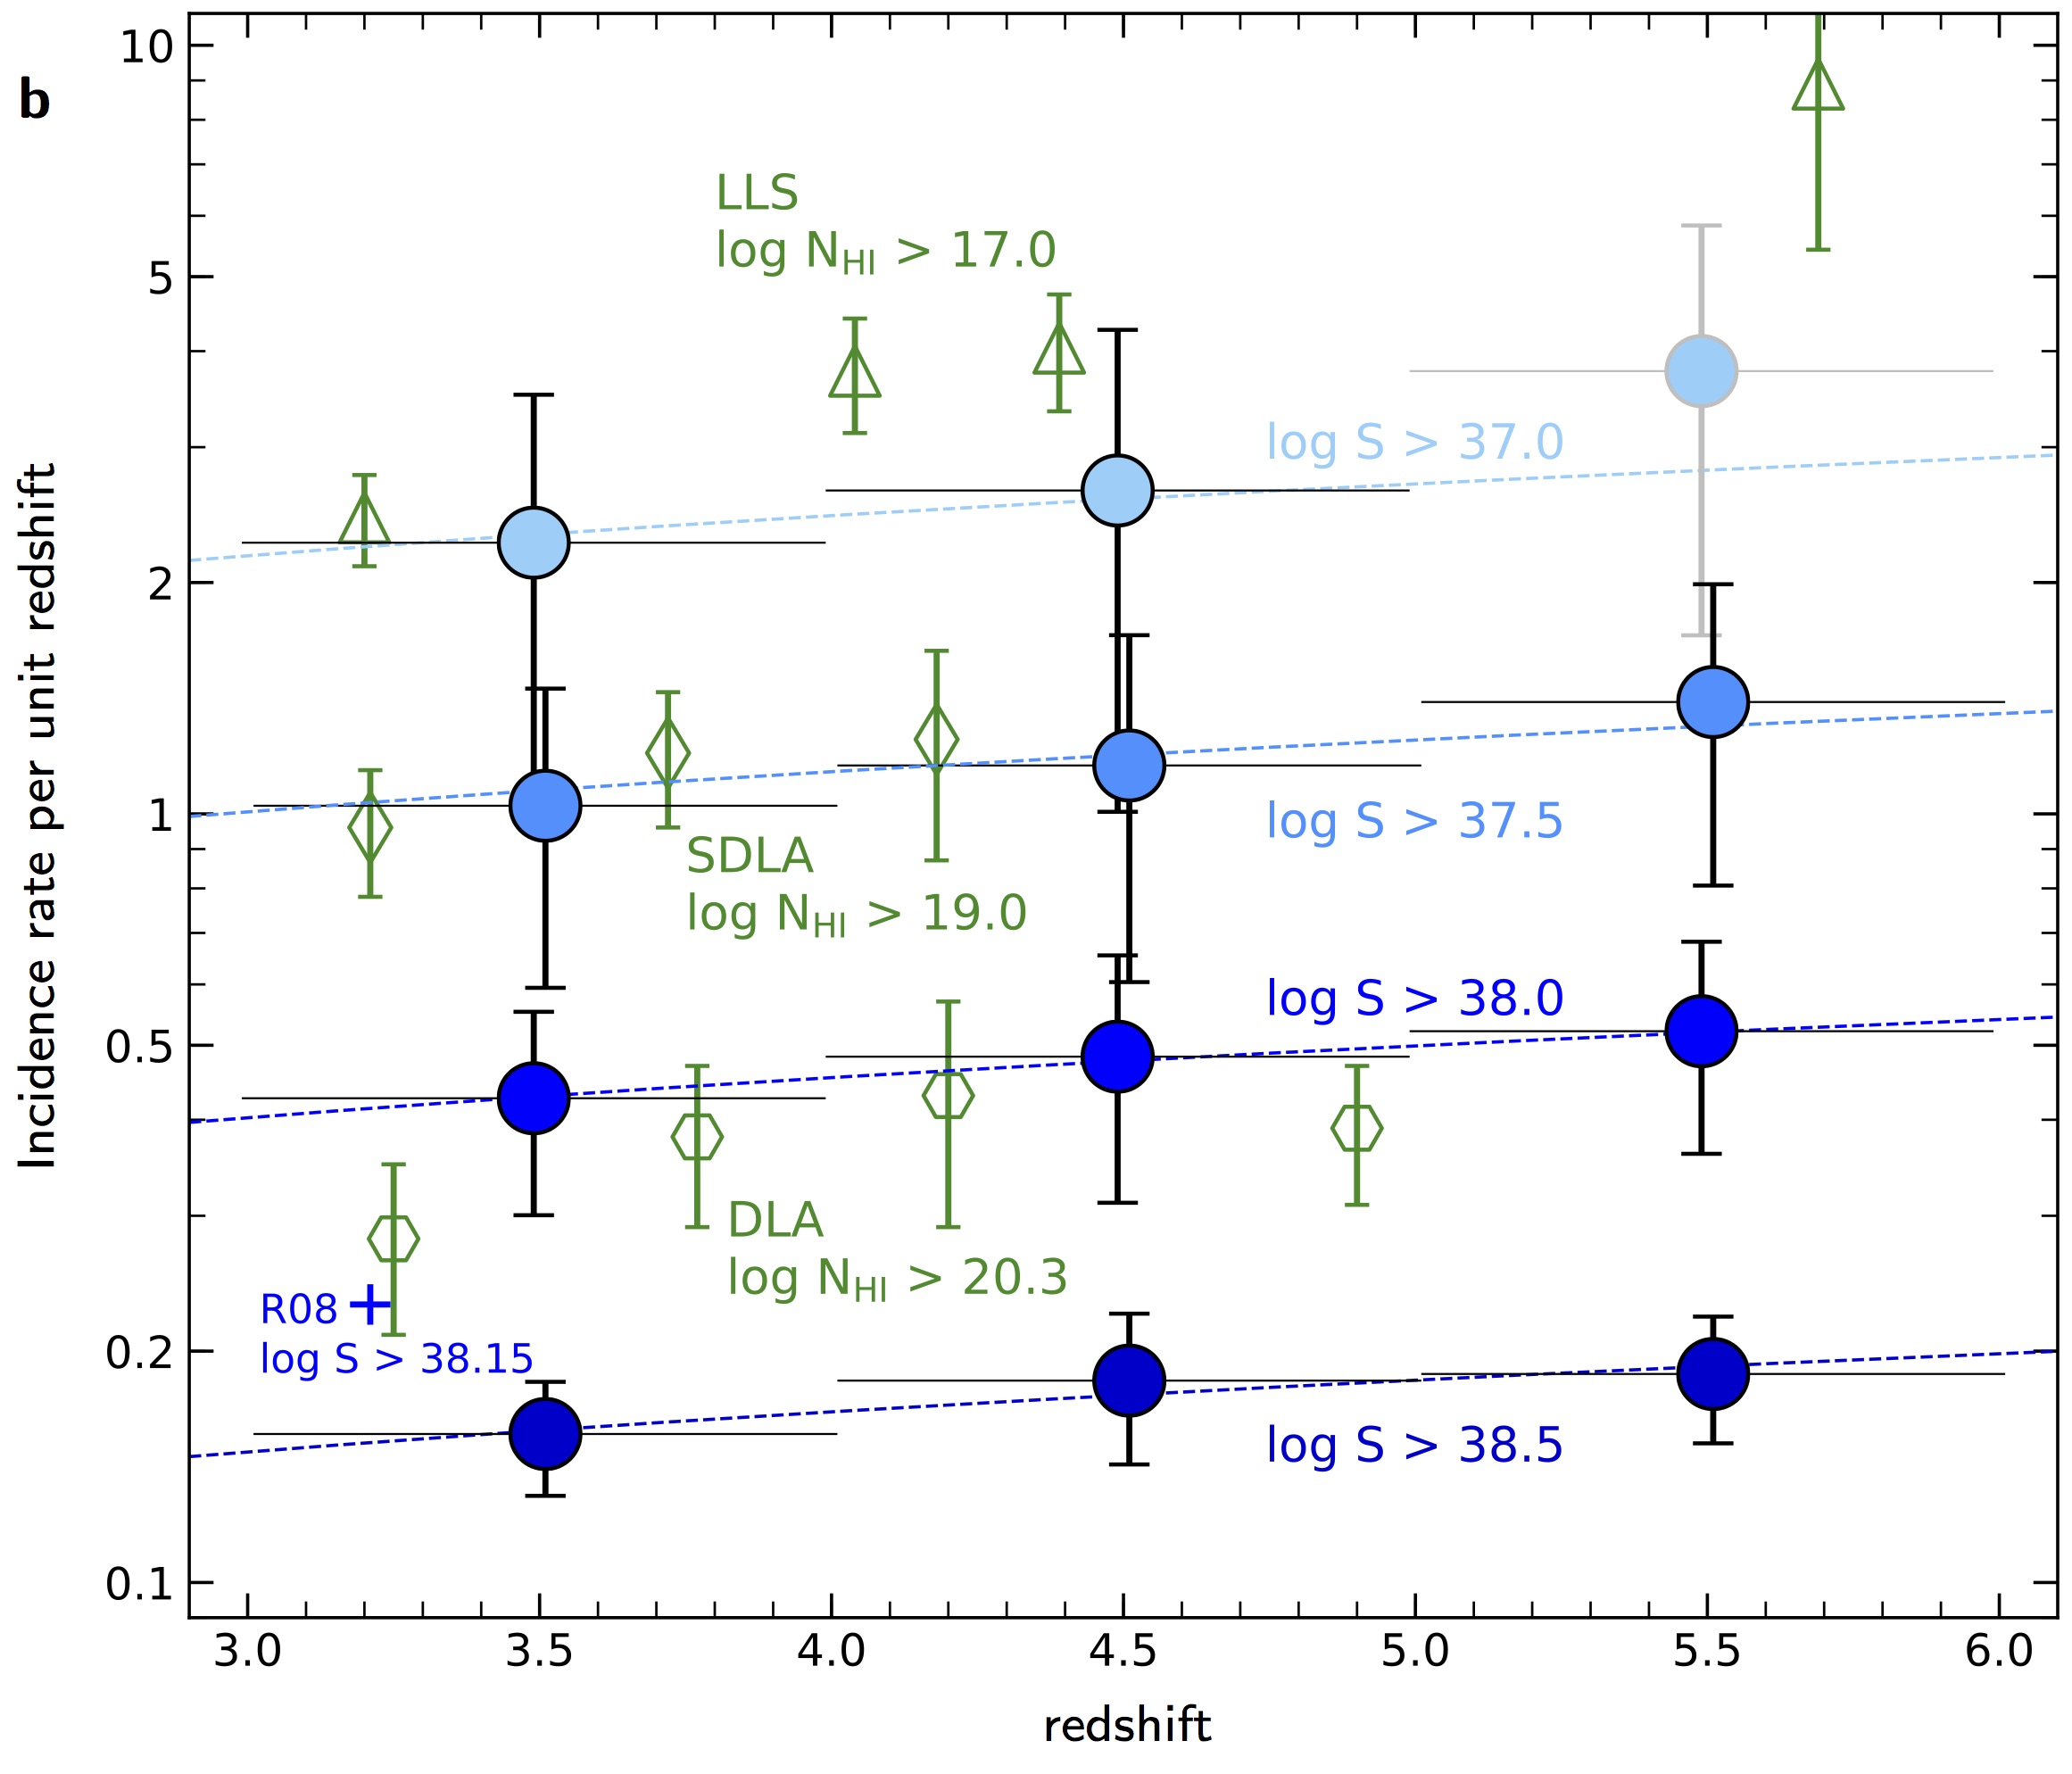
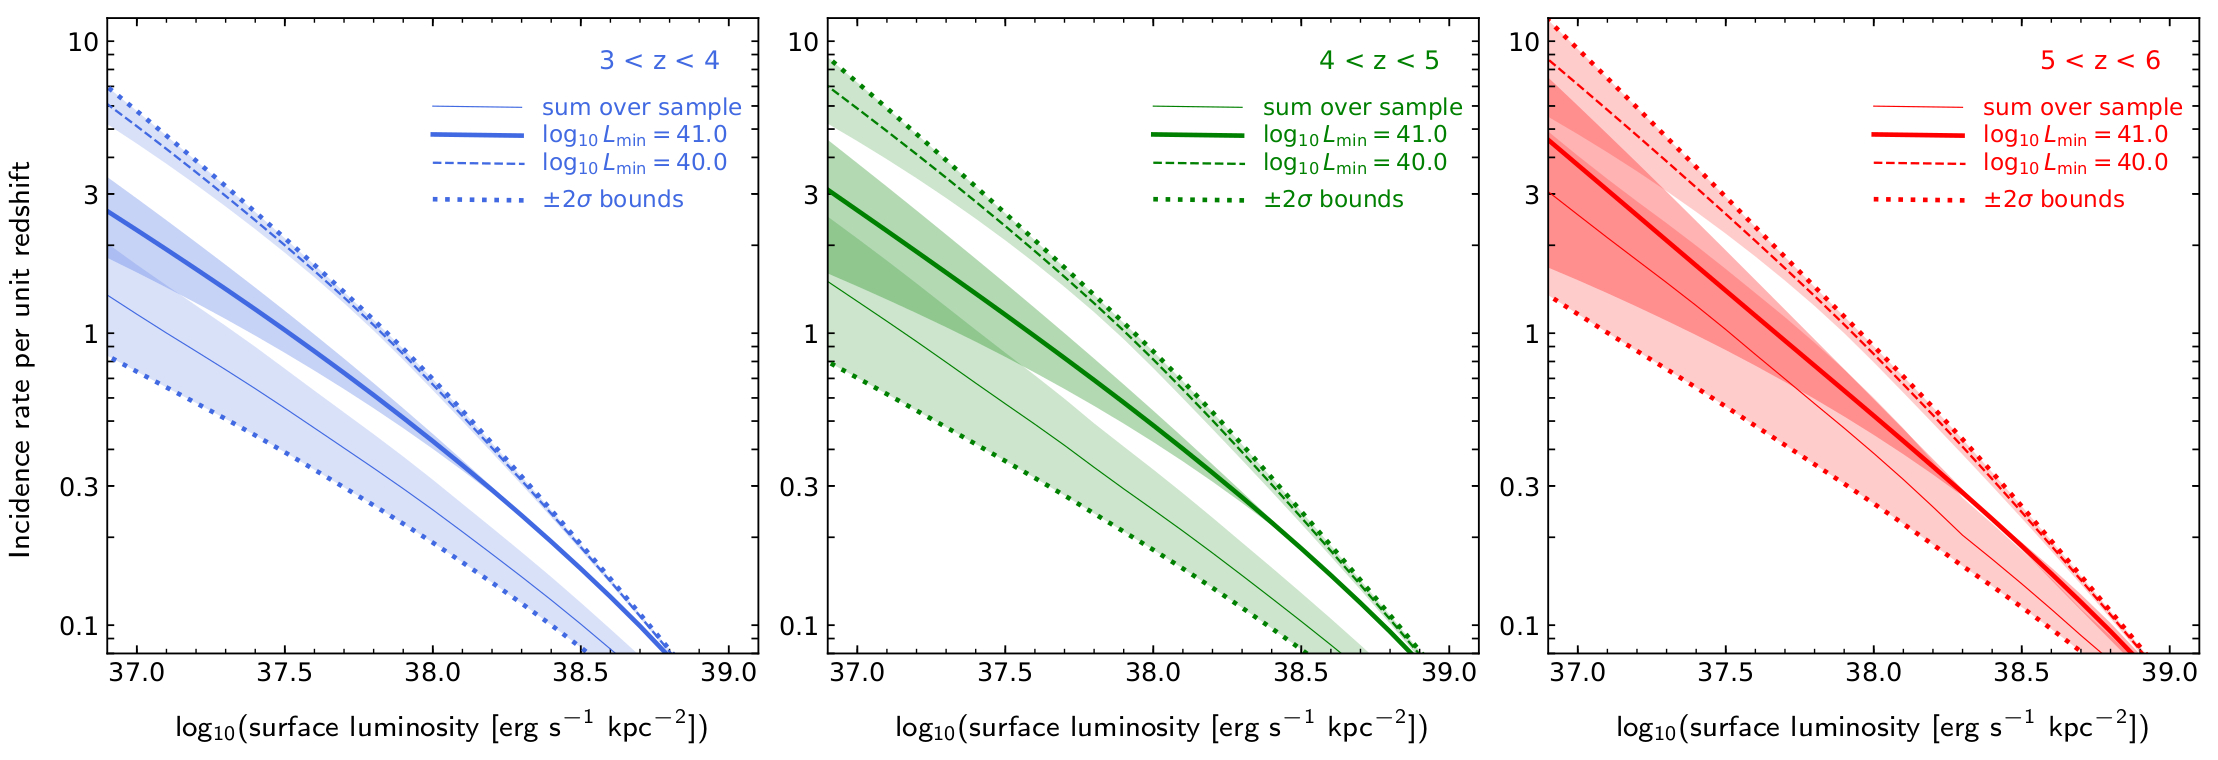
The sky coverage is an intuitively appealing number but of limited use as it saturates at 100%. A closely related but more physically useful quantity is the incidence rate , the average number of Ly emitting regions per unit redshift passed by a typical line of sight, for a given surface brightness level. This quantity can be directly compared to obtained from absorption line statistics, for different absorber column densities. We also corrected for cosmological surface brightness dimming by moving from observed surface brightness to intrinsic ‘surface luminosity’ , expressed in erg s-1 kpc-2. Furthermore, we accounted for the inevitable faint-end incompleteness of the Ly emitter sample by tying the integration to a completeness-corrected population distribution statistic (Methods). The resulting cumulative incidence rates as functions of surface luminosity threshold are presented in Fig. 4a. Values of indicate that a random sightline passes on average through more than one emitter within a redshift interval of . In Fig. 4b we compare our measured incidence rates with the statistics of atomic hydrogen detected in absorption against background quasars[9, 10, 11, 12]. We find that emission and absorption incidence rates em and abs have a similar range of values, which we use to tentatively match surface luminosities to column densities.
Emission regions with (for brevity we omit the units in the following), typically at radial distances , have a em of 0.5 per unit redshift which is comparable to Damped Ly Absorbers[9, 12] (DLAs) with column densities of . At redshifts this result broadly agrees with the findings in ref. [20] (based on long-slit spectroscopy of a much smaller sample), marked by the blue crosses in Fig. 4. Our data also show that the trend of with redshift is very similar for absorbers and emitters. It is thus suggestive to identify DLAs with Ly-emitting regions at levels of , which is also approximately the limit for the detection of individual Ly haloes[1, 2]. These photons likely originate in star-forming regions and are then resonantly scattered outwards[21, 22, 23], possibly enhanced by cooling radiation during the accretion of gas into dark matter haloes[24, 25, 26].
Moving to lower column densities of atomic hydrogen, Fig. 4 shows that systems with (sometimes called Sub-DLAs or SDLAs) and Ly emission regions with both have of order unity. At even lower , Lyman Limit Systems (LLSs) with give rise to several incidences per unit redshift[10], which can be approximately matched in emission by surface luminosities of , a level just detectable in our median stacks. Above column densities of cm-2 hydrogen becomes self-shielded to ionising radiation and thus at least partly atomic[27]. The approximate equality of the incidence rates of high column density H i absorbers and very low surface brightness Ly-emitting regions therefore suggests that in these regions we observe the faint glow of circumgalactic atomic hydrogen. Taking into account systematic errors introduces an uncertainty of a factor 2 (Methods), but these uncertainties do not affect our conclusion that most atomic hydrogen at these redshifts is now detected also in emission.
Our results suggest that em increases mildly with redshift. In Fig. 4b we compare our measurements with the expected redshift dependence for an intrinsically non-evolving population of emitters. Such a population can be described by a constant incidence rate em per comoving path length along the line of sight, a quantity commonly used in quasar absorption line studies. Within the redshift range considered here, a constant translates into a similar to the trend suggested by our data points. Since the Ly luminosity function also shows very little evolution within the redshift range of our sample[28], we conclude that the circumgalactic Ly emission properties do not change much between redshifts 6 and 3. Nevertheless, given the error bars the data are also compatible with a constant , corresponding to a modest decrease of incidence rates per comoving path length.
What powers this low-level Ly emission that we tentatively identify as originating from circumgalactic Lyman limit systems? At large galactocentric distances, Ly fluorescence of optically thick gas excited by the cosmic UV background (UVB) becomes a viable possibility[15]. The expected fluorescent Ly surface brightness of a Lyman Limit System at was calculated in ref. [29] and recently updated for in ref. [30] as erg s-1 cm-2 arcsec-2, just about within the sensitivity range of our stacked data and consistent with the marginal signal at large radii in our lowest redshift bin. This suggests that at least some of the extremely faint Ly emission detected by MUSE may be due to this omnipresent glow, opening a new window into a significant but previously invisible component of the cosmic matter distribution.
All authors wish to thank ESO staff for their support that made these observations possible. L.W., J.K., R.S. and T.U. acknowledge support by the Competitive Fund of the Leibniz Association through grants SAW-2013-AIP-4 and SAW-2015-AIP-2. R.B., H.I., F.L. and M.A. are supported by the ERC advanced grant 339659-MUSICOS. J.B. acknowledges support by FCT grants UID/FIS/04434/2013 and IF/01654/2014/CP1215/CT0003 and by FEDER through COMPETE2020 (POCI-01-0145-FEDER-007672). J.R. acknowledges support from the ERC starting grant 336736-CALENDS. P.M.W. received support through BMBF Verbundforschung, grant 05A17BAA. T.C., N.B. and B.G. acknowledge support by ANR FOGHAR (ANR-13-BS05-0010-02). T.C. and N.B. were also supported by OCEVU Labex (ANR-11-LABX-0060), and by the A*MIDEX project (ANR-11-IDEX-0001-02) funded by the “Investissements d’avenir” French government program. A.M.I. acknowledges support from MINECO through project AYA2015-68217-P. S.C. acknowledges support from Swiss National Science Foundation grant PP00P2_163824.
L.W. conceived the project. R.B. led the data acquisition and data reduction. R.B., J.B., E.C.H, H.I., J.K., K.B.S., T.U. and L.W. developed and performed the sample selection. L.W. analysed the data, with input by R.B., J.B. and P.M.W. S.C., P.R., J.S., M.S. and L.W. worked on the interpretation of the results. L.W. wrote the manuscript and produced the figures, with K.B.S. contributing to their design. All coauthors provided critical feedback to the text and helped shape the manuscript.
Reprints and permissions information is available at www.nature.com/reprints. The authors declare no competing financial interests. Readers are welcome to comment on the online version of the paper. Publisher’s note: Springer Nature remains neutral with regard to jurisdictional claims in published maps and institutional affiliations. Correspondence and requests for materials should be addressed to L.W. (lwisotzki@aip.de).
References
References
- [1] Wisotzki, L. et al. Extended Lyman haloes around individual high-redshift galaxies revealed by MUSE. Astronomy & Astrophysics 587, A98 (2016).
- [2] Leclercq, F. et al. The MUSE Hubble Ultra Deep Field Survey. VIII. Extended Lyman-alpha haloes around high-z star-forming galaxies. Astronomy & Astrophysics 608, A8 (2017).
- [3] Bacon, R. et al. The MUSE 3D view of the Hubble Deep Field South. Astronomy & Astrophysics 575, A75 (2015).
- [4] Hayes, M., Scarlata, C. & Siana, B. Central powering of the largest Lyman-alpha nebula is revealed by polarized radiation. Nature 476, 304–307 (2011).
- [5] Cantalupo, S., Arrigoni-Battaia, F., Prochaska, J. X., Hennawi, J. F. & Madau, P. A cosmic web filament revealed in Lyman- emission around a luminous high-redshift quasar. Nature 506, 63–66 (2014).
- [6] Hennawi, J. F., Prochaska, J. X., Cantalupo, S. & Arrigoni-Battaia, F. Quasar quartet embedded in giant nebula reveals rare massive structure in distant universe. Science 348, 779–783 (2015).
- [7] Steidel, C. C. et al. Diffuse Ly emitting halos: A generic property of high-redshift star-forming galaxies. The Astrophysical Journal 736, 160 (2011).
- [8] Momose, R. et al. Diffuse Ly haloes around galaxies at –6.6: implications for galaxy formation and cosmic reionization. Monthly Notices of the Royal Astronomical Society 442, 110–120 (2014).
- [9] Peroux, C., McMahon, R. G., Storrie-Lombardi, L. J. & Irwin, M. J. The evolution of and the epoch of formation of damped Lyman absorbers. Monthly Notices of the Royal Astronomical Society 346, 1103–1115 (2003).
- [10] Songaila, A. & Cowie, L. L. The evolution of Lyman limit absorption systems to redshift six. The Astrophysical Journal 721, 1448–1466 (2010).
- [11] Zafar, T. et al. The ESO UVES advanced data products quasar sample. Astronomy & Astrophysics 556, A141– (2013).
- [12] Crighton, N. H. M. et al. The neutral hydrogen cosmological mass density at . Monthly Notices of the Royal Astronomical Society 452, 217–234 (2015).
- [13] Partridge, R. B. & Peebles, P. J. E. Are Young Galaxies Visible? The Astrophysical Journal 147, 868 (1967).
- [14] Hogan, C. J. & Weymann, R. J. Lyman-alpha emission from the Lyman-alpha forest. Monthly Notices of the Royal Astronomical Society 225, 1P–5P (1987).
- [15] Gould, A. & Weinberg, D. H. Imaging the Forest of Lyman Limit Systems. The Astrophysical Journal 468, 462 (1996).
- [16] Bacon, R. et al. The MUSE second-generation VLT instrument. In McLean, I. S., Ramsay, S. K. & Takami, H. (eds.) Astronomical Telescopes and Instrumentation, 773508–773508–9 (SPIE, 2010).
- [17] Bacon, R. et al. MUSE Commissioning. The Messenger 157, 13–16 (2014).
- [18] Casertano, S. et al. WFPC2 Observations of the Hubble Deep Field South. The Astronomical Journal 120, 2747–2824 (2000).
- [19] Beckwith, S. V. W. et al. The Hubble Ultra Deep Field. The Astronomical Journal 132, 1729–1755 (2006).
- [20] Rauch, M. et al. A Population of Faint Extended Line Emitters and the Host Galaxies of Optically Thick QSO Absorption Systems. The Astrophysical Journal 681, 856–880 (2008).
- [21] Laursen, P. & Sommer-Larsen, J. Ly Resonant Scattering in Young Galaxies: Predictions from Cosmological Simulations. The Astrophysical Journal 657, L69–L72 (2007).
- [22] Barnes, L. A. & Haehnelt, M. G. Faint extended Ly emission due to star formation at the centre of high column density QSO absorption systems. Monthly Notices of the Royal Astronomical Society 403, 870–885 (2010).
- [23] Verhamme, A. et al. Lyman- emission properties of simulated galaxies: interstellar medium structure and inclination effects. Astronomy & Astrophysics 546, A111 (2012).
- [24] Haiman, Z., Spaans, M. & Quataert, E. Ly Cooling Radiation from High-Redshift Halos. The Astrophysical Journal 537, L5–L8 (2000).
- [25] Fardal, M. A. et al. Cooling Radiation and the Ly Luminosity of Forming Galaxies. The Astrophysical Journal 562, 605–617 (2001).
- [26] Furlanetto, S. R., Schaye, J., Springel, V. & Hernquist, L. Ly Emission from Structure Formation. The Astrophysical Journal 622, 7–27 (2005).
- [27] Altay, G., Theuns, T., Schaye, J., Crighton, N. H. M. & Dalla Vecchia, C. Through thick and thin – H I absorption in cosmological simulations. The Astrophysical Journal 737, L37 (2011).
- [28] Drake, A. B. et al. The MUSE Hubble Ultra Deep Field Survey. VI. The faint-end of the Lyalpha luminosity function at and implications for reionisation. Astronomy & Astrophysics 608, A6 (2017).
- [29] Cantalupo, S., Porciani, C., Lilly, S. J. & Miniati, F. Fluorescent Ly Emission from the High-Redshift Intergalactic Medium. The Astrophysical Journal 628, 61–75 (2005).
- [30] Gallego, S. G. et al. Stacking the Cosmic Web in Fluorescent Lyalpha Emission with MUSE. Monthly Notices of the Royal Astronomical Society 475, 3854–3869 (2018).


0.1 MUSE observations.
MUSE is an integral field spectrograph mounted on Unit Telescope 4 of the ESO Very Large Telescope. In its Wide Field Mode it offers a field of view at a spatial sampling of , producing a datacube with 90 000 spatial pixels. Each spatial pixel contains a 475–935 nm spectrum with 0.25 nm spectral resolution. The first of the two deep field observations used here was obtained in 2014, where we integrated for a total of 27h on a single pointing in the Hubble Deep Field South[18] (HDFS). The data reduction and construction of the first redshift catalogue in this field are summarised in ref. [3]. The second deep MUSE exposure was obtained between 2014 and 2016 as part of a greater effort to perform a contiguous spectroscopic mapping of the Hubble Ultra-Deep Field[19] (HUDF). These observations resulted in a mosaic with a mean integration time of 10h, on top of which 21h of additional exposure time were dedicated to a single MUSE pointing inside the HUDF. The characteristics of the MUSE-HUDF dataset and the reduction process are described in ref. [2]. Here we use only the two ultra-deep 1 arcmin2 MUSE pointings, which for simplicity we refer to as HUDF and HDFS, respectively. The average spatial resolution (FWHM of the best-fitting Moffat[3] function) in the combined coadded datacube, evaluated at 700 nm, is 066 for the HDFS and 063 for the HUDF.
0.2 The sample of Ly emitters.
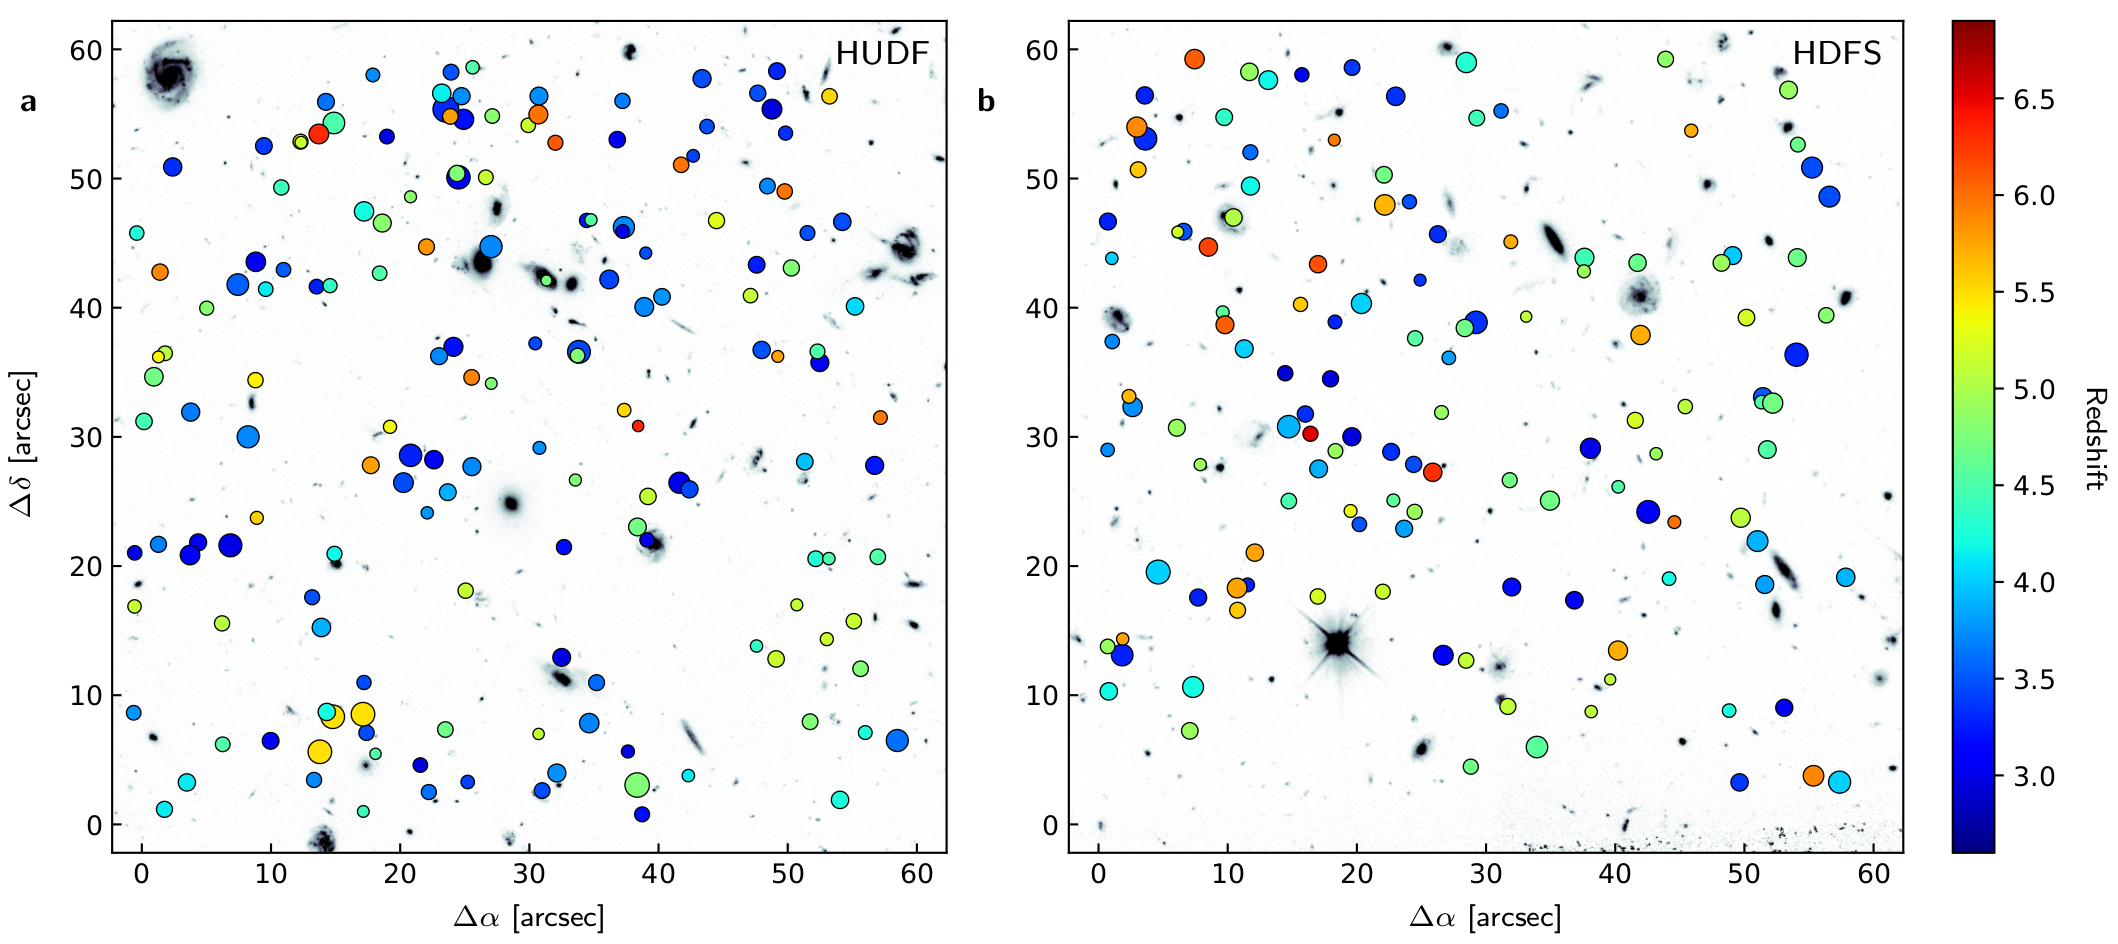
Here we focus on galaxies marked by their Ly emission (Ly emitters, LAEs). Given the MUSE spectral range of 475–935 nm, LAEs can be detected over a redshift interval of . In order to construct a homogeneous Ly-selected sample we ran our dedicated software LSDCat[4] (Line Source Detection and Cataloguing) on both datacubes to produce a list of emission line objects, which we then inspected visually to assign redshifts. This resulted in a sample of 128 LAEs in the HDFS and 169 LAEs in the HUDF, respectively. Because of the strictly Ly-based selection, these samples are not mere subsets of our previously published catalogues[3, 5] but also contain a few additional LAEs. The spatial distribution of the objects is visualised in Extended Data Fig. 1. For each LAE, the LSDCat software measures the spatial and spectral centroids and the integrated Ly fluxes, quantities used in this study. Redshifts were assigned from the measured centroids of the Ly emission line. While these centroids are known to be shifted with respect to the systemic redshifts by up to a few 100 km/s, accurate knowledge of the latter is not required for the present study (and was not available for our sample). Because of the decrease in instrument sensitivity close to the low and high wavelength cutoffs, and because of the crowding of OH night-sky emission lines towards the reddest wavelengths, we limited our sample to the redshift range , which conveniently allowed us to define three broad redshift bins of each. The final sample encompasses 119 LAEs in the HDFS and 151 LAEs in the HUDF, respectively.
0.3 Extraction of narrowband images.
Each LAE enters into the current investigation as a pseudo-narrowband (NB) Ly image, extracted from the datacube at the location of the 3-dimensional Ly centroid coordinates provided by LSDCat. These images were constructed in the following way: We first extracted a provisional Ly spectrum from the continuum-subtracted datacube by summing over an unweighted circular aperture of radius 06. We then modelled the Ly emission line profile as a Gaussian, which provided an improved line centroid as well as an approximate line width. Using this Gaussian approximation as spectral template, we performed a weighted summation of spectral layers of the datacube into a single NB image. While Ly lines usually show some deviations from a single Gaussian, these deviations have negligible effect on the extraction results, except for cases of secondary line peaks (“blue bumps”) which are not captured by our narrowband images. The maximum Gaussian FWHM for the extraction was set to 500 km/s in order to limit the noise. Compared to an unweighted summation over a given bandwidth this scheme provides a better signal-to-noise ratio, and the fractional weights ensure that the bandwidth always matches the actual line width, which matters especially for relatively narrow lines with FWHM 200 km/s. We verified that for broader lines the results are very similar to an unweighted summation. The blank-sky noise level in these NB images varies substantially, depending on the spectral bandwidth and on the wavelength of the Ly line. A typical value of the pixel-to-pixel rms in regions with no detected emission is erg s-1 cm-2 pixel-1, corresponding to a 1 surface brightness limit of erg s-1 cm-2 arcsec-2 when averaged over an aperture of 1′′. This limit varies by a factor of 2 between different objects.
0.4 The Ly sky coverage from direct projection.
We obtained a projected Ly view of each field by coadding all extracted NB images, maintaining the position of each object in the plane of the sky. In order to reduce the noise in the coadded image we introduced a truncation radius of 6′′ around the centroid of each LAE beyond which the NB data were set to zero for the coadding procedure. This was motivated by the fact that beyond this radius we find generally no individually detectable Ly emission around our objects. The projection therefore accounts only for the circumgalactic Ly emission around detected sources, and any putative extended Ly emission at the same redshift as a detected object, but outside the truncation radius, is ignored in the coadding procedure. At the same time the truncation ensures that same-redshift pairs enter only once into the coadded image; if necessary we constructed additional masks by hand to ensure that this was always the case. Masks were also applied in a few cases of contamination by foreground emission lines or by continuum subtraction residuals from bright foreground objects such as stars. Finally, we removed 33 objects where Ly happened to fall close to a bright sky line causing significant sky-subtraction residuals in the narrowband images. Altogether the amount of budgeted Ly flux in this approach should be seen as a strict lower limit to the true emission in the field.
With these provisions we estimated the cumulative fractional sky coverage of Ly emission brighter than , documented in Extended Data Fig. 2. Without spatial filtering the surface brightness is specified for a single pixel of only , resulting in extremely noisy images. We therefore filtered the images with a Gaussian of FWHM = 7 pixels (14) which provided a good compromise between noise suppression, enforcing large-scale spatial coherence, and ensuring that flux redistribution from the central pixels into the outer parts can be neglected. The maximally reachable covering fraction is limited by random fluctuations due to noise, as can be seen very clearly in Extended Data Fig. 2: measured from the unfiltered data converges to considerably lower values than measured from the filtered data – which are of course also affected, but to a lesser degree. We have not attempted to push this approach any further, as for the main results of this paper we employed the stacking-and-insertion modelling approach described below. We did, however, perform a retrospective consistency check between the direct projection and the stacking approach, which worked as follows: We took the idealised noise-free reconstructed model images obtained from the median-stacking analysis (the bottom-right image in Fig. 3a in the case of the HUDF), degraded them by adding realistic noise, and after spatial filtering we measured in the same way as in the real data. For the noise model we filled empty datacubes with normally distributed random numbers scaled to the effective noise in the actual data. From these noise-only cubes we then extracted NB images with the same prescriptions as for the real LAEs, using the same spectral bandpasses and spatial masks, and coadded them to provide a random noise realisation of the projected Ly image, which we then added to the stacking-based model image. The grey curves in Extended Data Fig. 2 show that these very different approaches to measure produce remarkably consistent results when taking the noise into account. The only noteworthy discrepancy between the thick black and the thick grey lines in Extended Data Fig. 2 occurs around , mainly caused by the median-taking in the stacking process which removes the largest and most extended Ly emitters. At these relatively high surface brightnesses, the direct projection approach actually delivers a more realistic estimate of than the stacking approach.
0.5 Stacking analysis and profile modelling.
We excised MUSE-narrowband subimages centred on each source and put these into image stacks, separately for the three redshift intervals , , and . Prior to the analysis, the data were subjected to a rigorous visual screening. In this step, 76 objects were removed from the stacks because their NB images were disturbed by sky subtraction residuals or residual emission from unrelated objects. 194 LAEs remained in the combined stacking sample. Bright foreground objects and the edges of the field of view were masked. We also ensured that when the NB image contained multiple objects at the same redshift, each spatial pixel contributed to the stack only once. Finally, each stack was collapsed into a single image by computing the pixel-by-pixel median of all unmasked input image pixels. We chose the median instead of the mean to avoid that possible faint undetected companions enhance the signal in the outskirts. For each collapsed stack we also obtained a weight image containing in each pixel the number of input images that contributed to it after masking; these weight images are shown in Extended Data Fig. 3.
To detect the low surface brightness Ly emission in the outer regions of our haloes we extracted azimuthally averaged radial profiles from the median stacks (Fig. 2c), by averaging all pixels within each of a set of concentric annuli (Fig. 2b) defined as follows. Let denote the outer radius of annulus with . For we adopted constant annular widths, (1 MUSE spatial pixel), for the outer annuli we constructed a progression of increasing widths with the recursion formula . Thus, the last annulus has an outer radius , just fitting into our images and combining 4660 MUSE spatial pixels into a single surface brightness measurement.
We estimated the uncertainties of these surface brightness profiles in two ways, by formal error propagation and empirically from empty regions in the data. The formal errors originate in the pixel variances of the MUSE datacubes, corrected for resampling effects[2], propagated first into the NB images of individual objects and then into the median-combined stacks. For the latter step we used the property of the median that its variance is approximately times the variance of the mean. For the empirical noise calibration we shifted the whole LAE sample in wavelength while maintaining the spatial positions of all objects, thus defining empty regions by applying small redshift offsets. Offsetting in increments of MUSE spectral pixels or Å yielded 40 complete sets of as many empty regions as LAEs, which were then subjected to the same NB image extraction and median stacking procedure as the Ly data. We estimated the noise from the dispersion of the extracted radial profiles between these 40 sets. The outcome of this experiment is presented in Extended Data Fig. 4. This figure thus provides the significance limits for the detection of very low surface brightness emission in our stacked data.
While the propagated errors can be easily calculated independently of the object content of the datacubes, they do not account for systematics in the background subtraction. On the other hand, the empirically determined errors automatically include such systematics, but are subject to contamination of the supposedly empty regions by unrelated sources and by sky subtraction residuals, and hence they likely overestimate the true errors. In our experiment the median ratios between empirical and propagated errors for the outer profile regions () were (1.02, 1.33, 1.52) for the three redshift ranges, respectively. For this paper we conservatively adopted only the (larger) empirically determined errors for the profiles, and only these are shown in Fig. 2c and Extended Data Fig. 4. The empty regions experiment also revealed that the mean of the empty regions tends to become slightly negative at small radii , implying that we may actually underestimate the surface brightnesses in the inner regions by a very small amount. Since this effect is at the % level relative to the measured signal at these radii, we decided to neglect it.
We used GALFIT[6] to model the median-stacked images with smooth 2-dimensional Ly surface brightness distributions. While in previous work[1, 2] we favoured a double exponential model with a compact core and an extended halo, that model was driven mainly by the high S/N and high surface brightness regions within 10 kpc. In the present study the emphasis is on the outer regions, where Fig. 2 suggests that the surface brightness distribution of the halo may show some flattening relative to a single exponential. Here we adopted a model consisting of a central point source plus a circular Sersic[7] function, convolved with the point-spread function at the relevant wavelengths, which provided good fits to all median-stacked images. To quantify the uncertainties in the fitted profiles we used the formal error estimates of GALFIT, but then increased these until the uncertainties of the fits were consistent with the empirically calibrated error bars of the directly extracted azimuthal profiles. These uncertainties are displayed as the shaded regions around the fitted profiles in Fig. 2. Extended Data Table 1 provides the numerical values of the fit parameters and their uncertainty estimates.
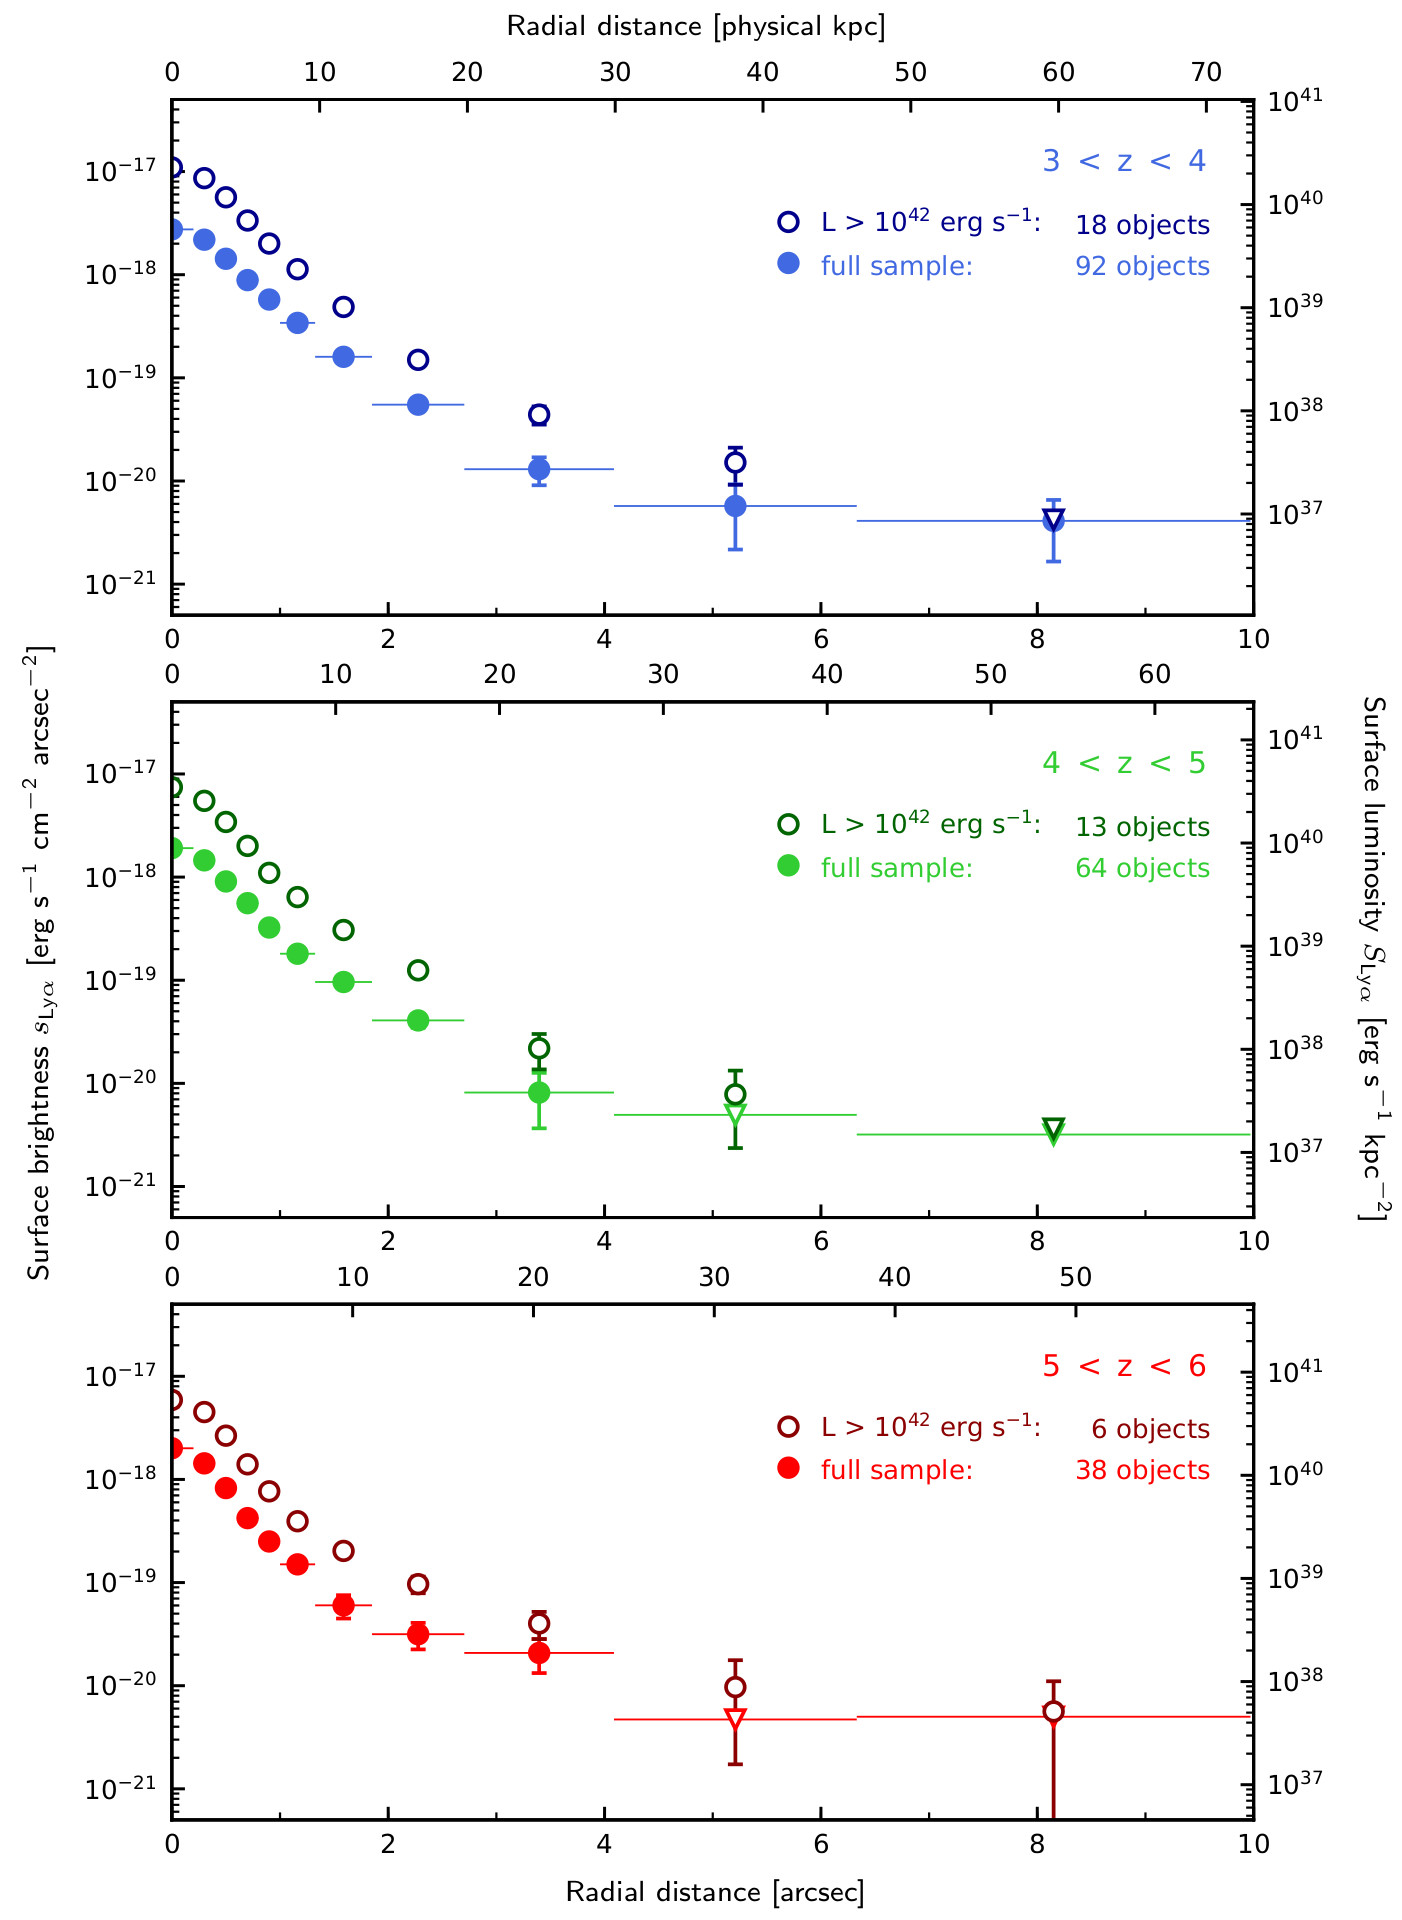
We make the central assumption that the shapes of the Ly haloes of LAEs do not, in the statistical average, depend on their luminosities. While in ref. [2] we found no evidence for such a dependence, most of those objects have Ly-luminosities erg s-1, whereas our current sample has a median of only 41.7. Here we use the median stacks to probe deeper into the validity of the above assumption. In Extended Data Fig. 5 we present a comparison between the radial profiles extracted from the median stack of the full sample and of a subset with Ly luminosities erg s-1. There are (18, 13, 6) objects at = (3–4, 4–5, 5–6) meeting this criterion. The median-stack profiles of the luminous subsets resemble those of the full sample remarkably well. This comparison supports the validity of our self-similarity approximation across the luminosity range of our sample. We plan to revisit this point and related aspects in a follow-up study of Ly halo profile shapes in stacked MUSE data.
We used the analytic profile fits as templates to construct idealised representations of all LAEs in the two fields, including those objects previously removed from the stacking subsample. All model LAEs at a given redshift range were assigned to have the same spatial surface brightness distribution, but rescaled to the actually observed Ly fluxes of each real object. Furthermore, the GALFIT models were approximately corrected for PSF blurring by using a delta function (in fact a very narrow Gaussian) as PSF when reconstructing the 2-dimensional model templates. Since for each object the template was rescaled to match the measured Ly flux, this implies that the modelling of the brightest LAEs involved a certain degree of extrapolation of the profiles. We demonstrate below that the contribution of extrapolated emission to the incidence rates is small (see also Extended Data Fig. 7).
0.6 Determination of incidence rates.
We estimated the Ly emission incidence rates directly from the LAE samples as the sum of circular cross-sections where is the isophotal extent of object at a given surface brightness level, obtained from the GALFIT templates and rescaled to the observed Ly fluxes. The incidence rate is then
| (1) |
where is the area of the field of view, is the redshift path length over which object would be part of the flux-limited sample, and where the summation is carried out over all objects in the redshift range. The normalisation of to a quantity per unit redshift was in our case conveniently provided by the widths of our adopted redshift intervals.
Since decreases with increasing redshift as , we decided to move to distance-independent surface luminosities . While this quantity is not much used in the literature, we prefer working with intrinsic object properties over rescaling observed quantities to some fiducial reference redshift. The transformation is when both and are given in cgs units. The right-hand ordinate of Extended Data Fig. 5 provides a quick-look visual calibration of the conversion.
0.7 Correction for sample incompleteness.
Our LAE sample certainly suffers from incompleteness close to the flux limit, with faint objects getting selected only if their Ly emission is sufficiently pointlike. Selection effects for the detection of LAEs in the MUSE-HUDF survey were investigated in detail in ref. [28], where it was shown that the transition from 80% to 20% detection probability extends over 0.5 dex in line flux. The Ly incidence rates calculated from Eq. 1 are therefore biased low, missing the contributions from undetected but presumably existing objects. In order to correct for this incompleteness we replaced the summation over the observed sample by an integration over the full survey volume, assuming that the intrinsic distribution of Ly luminosities follows the luminosity function determined in ref. [28]. Since the self-similarity approximation of the extended Ly emission implies a unique relation between the total flux of an object and its isophotal radius, , we can predict the emission cross-sections from only the Ly luminosities. The total incidence rate for a given redshift range (, ) follows as
| (2) |
where is the differential comoving volume element at redshift , (in units of erg s-1, with the cosmological luminosity distance ), and is the differential Ly luminosity function at redshift . We parametrised as a redshift-independent Schechter function with , Mpc-3, and , which is a good overall fit to the completeness-corrected LAE sample[28]. While the upper luminosity integration limit does not matter much as approaches zero very quickly for increasing , choosing a value for the lower integration limit is less straightforward: Although faint LAEs have small isophotal radii, they are also numerous and thus contribute non-negligibly to the integrated cross-section. The integral converges only for , but at the expense of including large numbers of hypothetical ultrafaint LAEs into the budget that are well below the current detection limits. As our “best guess” we adopted which is slightly brighter than the faintest detected LAEs in our actual sample. Extended Data Fig. 6 provides a synopsis of the different approaches to estimate from our data. These plots also show that the magnitude of the completeness correction is by far the dominant source of uncertainty for . We therefore adopted as the lowest reasonable limit the values of without any completeness correction (i.e. from Eq. 1) obtained from the somewhat ‘emptier’ HDFS. As an upper limit we took the asymptotic result from integrating Eq. (2) with . For the presentation in Fig. 4 we interpreted these lower and upper bounds as limits, but plotted only the 1 error envelopes in accordance with the usual conventions.
0.8 Discussion of systematic errors.
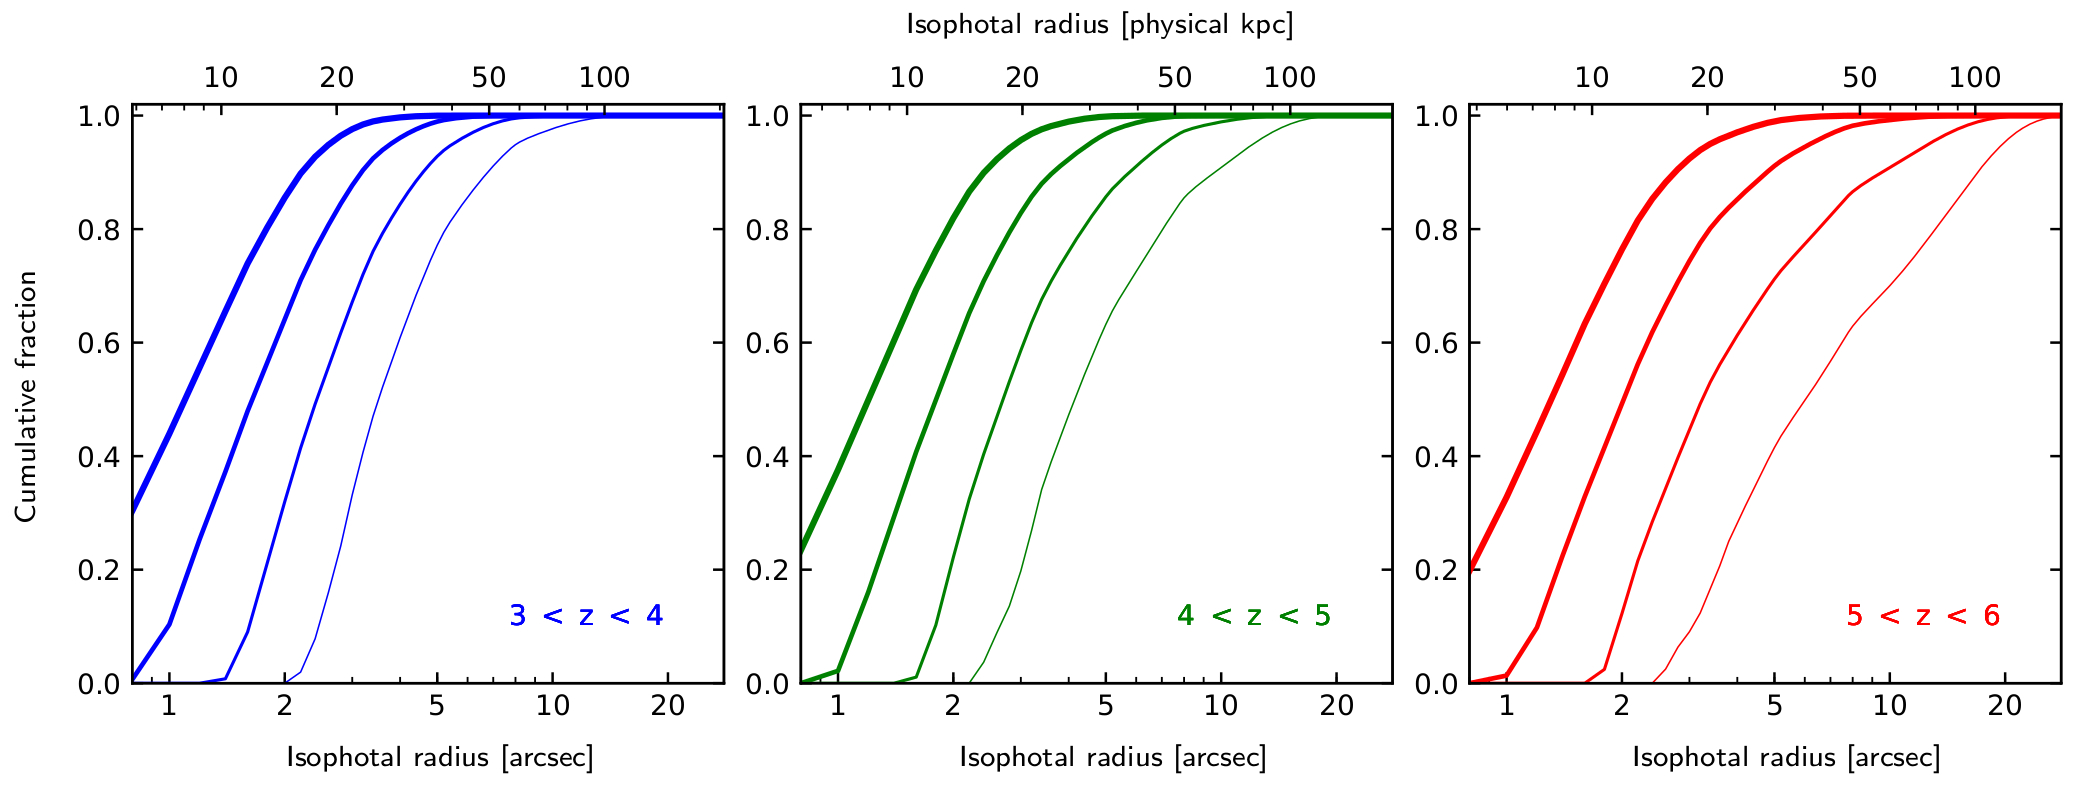
We first consider to what extent the integrated values of depend on extrapolations of the rescaled Ly profiles beyond the radial range over which they were constructed. To address this question we constructed the cumulative distribution of the contributions to the total incidence rate sum or integral as a function of their isophotal radii. The results of the completeness-corrected integration of (Eq. 2) with (our ‘best guess’ approach) are shown in Extended Data Fig. 7. These plots demonstrate that at all redshifts and for all levels of except the lowest, more than 80% of the total incidence rates is contributed by emission from . Only for and there is a substantial extrapolated contribution, which is why we consider this point as uncertain and plotted it in light grey in Fig. 4b.
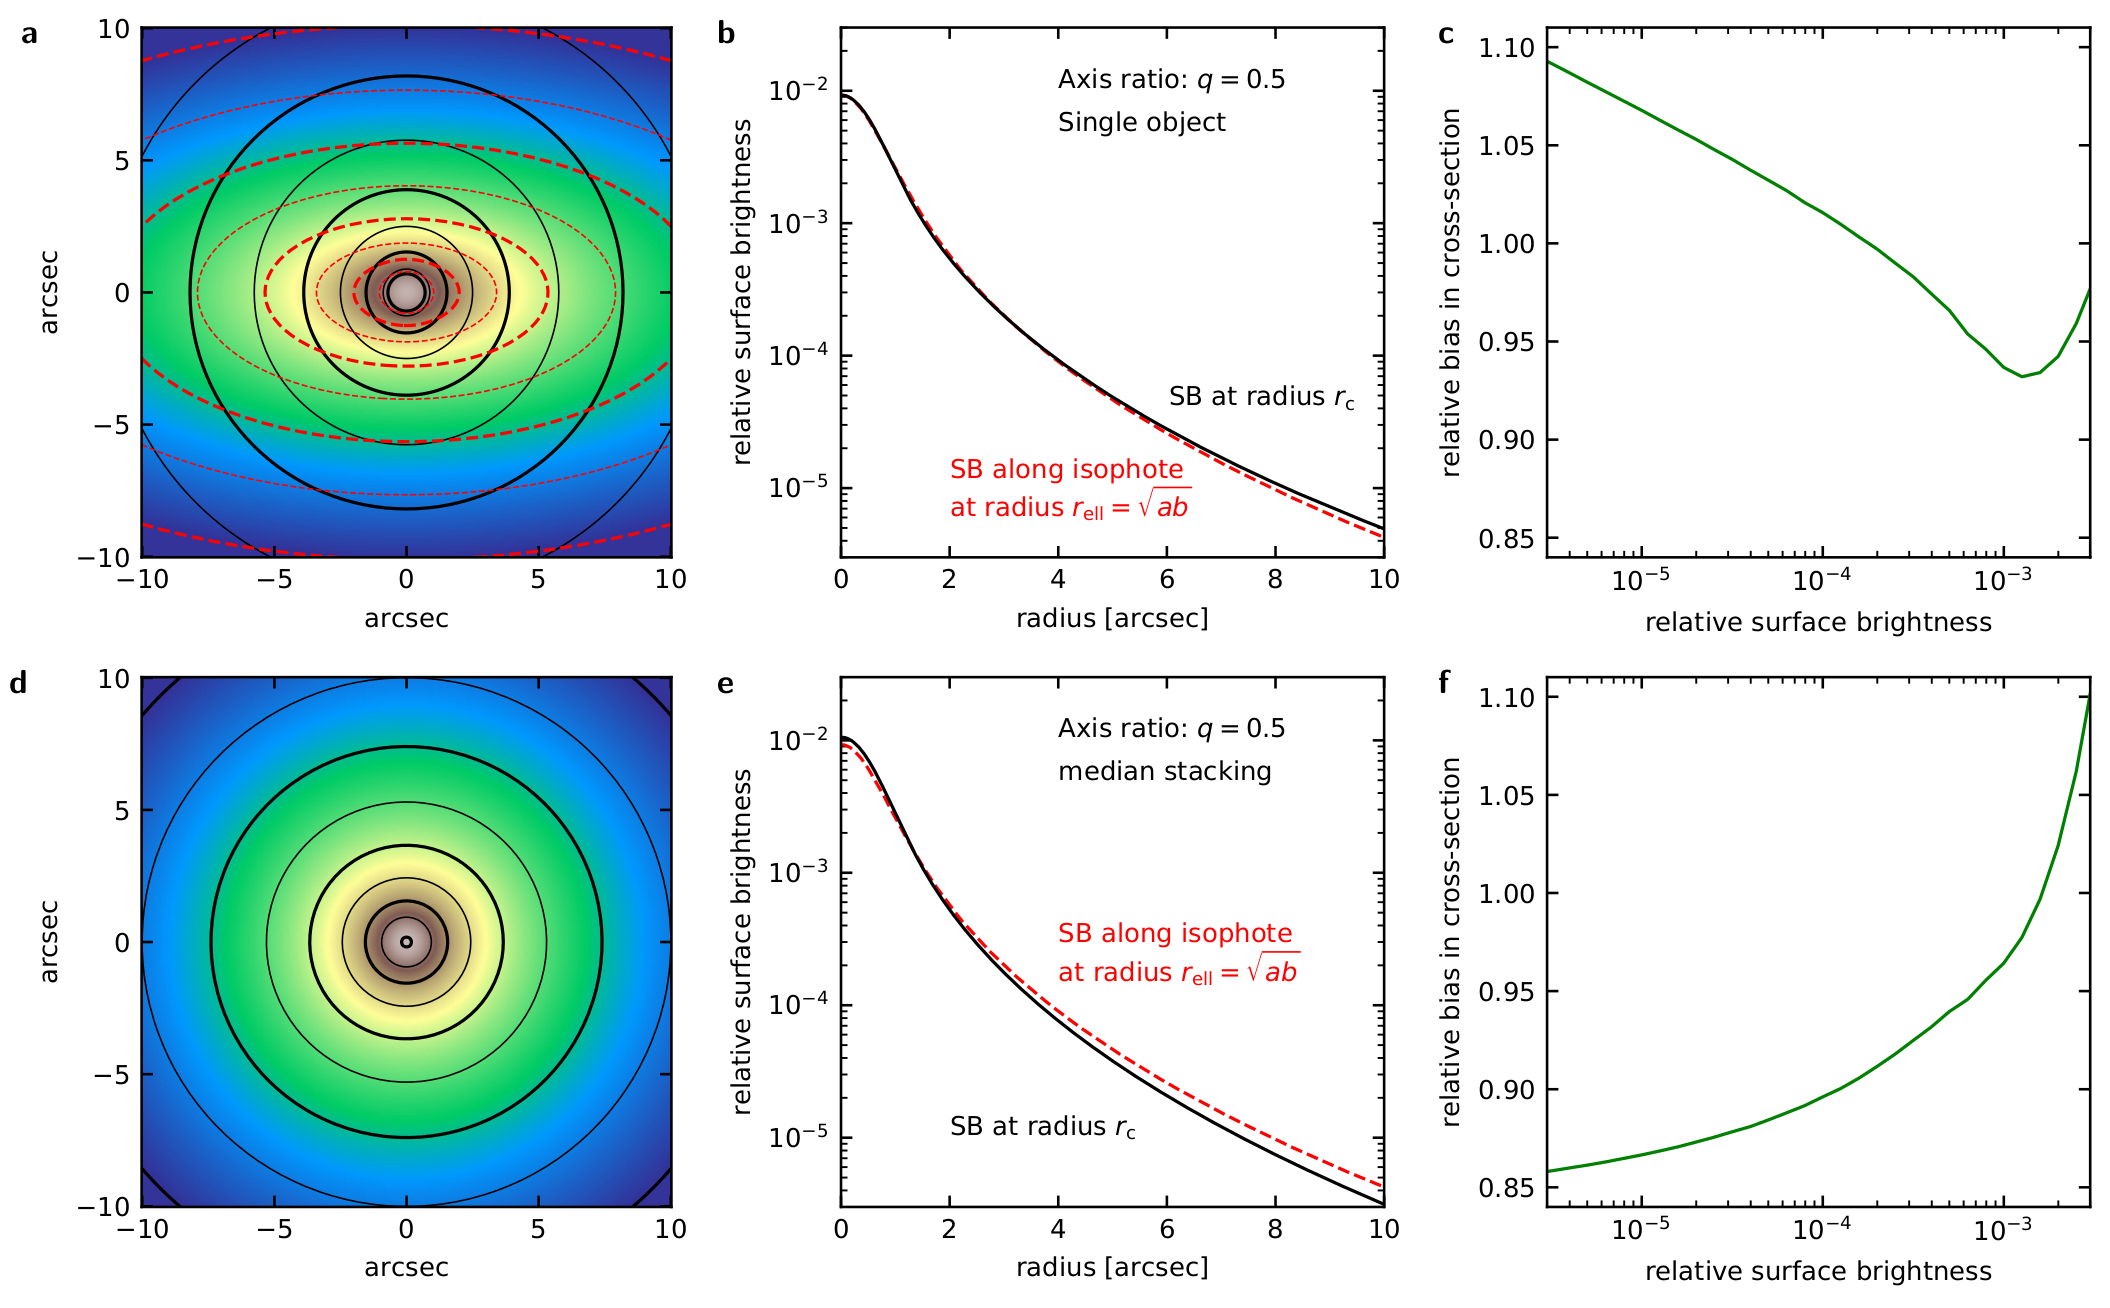
A strong assumption made in our analysis is the azimuthal symmetry of the Ly emission, which is certainly not strictly correct. We now quantify the biases arising from the circularisation of a non-axisymmetric signal through median stacking. Extended Data Fig. 8a–c shows how an elliptical 2-dimensional surface brightness distribution and the corresponding isophotal cross-sections are modified when the cross-sections are estimated from an azimuthally averaged profile. The circularised profile is broadened and the cross-sections at given surface brightnesses are overestimated, but the effect is quite small. More relevant for our analysis, Extended Data Fig. 8d–f demonstrates that median stacking of randomly oriented elongated objects delivers isophotal cross-sections that are systematically smaller than the true values. While the above calculations are based on a rather simple source model, the conclusion can be qualitatively generalised to other non-axisymmetric surface brightness distributions. The median stacking ensures that the derived emission cross-sections, and consequently the inferred Ly sky coverage and incidence rates, are rather under- than overestimated.
While the small scale distribution of Ly emission remains unknown at these surface brightness levels, we have some idea of the projected covering fraction of neutral hydrogen close to galaxies. Ref. [8] used the cosmological EAGLE simulation[9] to show that depends on many parameters: distance to galaxy centre, column density, redshift, halo mass, environment. H i absorption line measurements close to galaxies at [10] give for Lyman Limit Systems within one virial radius (); there are so far no good measurements for . Simulations predict that increases rapidly towards higher redshift[8], and we expect –0.8 for at the redshifts of our sample. The virial radii of our LAEs are unknown, but predicted to be around 30 kpc or less[11]. Consulting again Extended Data Fig. 7 we see that except for and , more than 80% of the integrated Ly emission incidence rates come from radii less than 30 kpc, i.e. from within one virial radius. Unless the Ly-emitting gas has a very different spatial distribution than the general circumgalactic H i, the covering fractions are expected to be sufficiently close to unity that the systematic errors from any non-axisymmetry of our derived incidence rates should be small.
A rather different systematic error arises from the limitation of our sample to galaxies selected by their Ly emission. If not all galaxies are LAEs, then there is circumgalactic H i gas contributing to high-column density absorption systems which is not included in our budget of extended Ly emission. The fraction of galaxies at showing detectable Ly emission depends strongly on the selection criteria. While only some 10%–20% of continuum-bright galaxies at these redshifts are strong LAEs with Ly rest-frame equivalent widths (EW) greater than 50 Å[12], this fraction probably increases to 50% if also weaker emitters are included[7, 13]. There are indications that the fraction of strong emitters may be even considerably larger than 50% for very low luminosity galaxies and/or higher redshifts[12, 14]. It seems thus plausible to estimate that our Ly selection captured roughly half of all galaxies at these redshifts. If the other 50% have a circumgalactic medium similar to the LAEs except for the lack of Ly emission – this is a very uncertain assumption –, the incidence rates of the circumgalactic absorbers in Fig. 4 should be shifted downwards by 0.3 dex to account only for the LAE fraction. Interpolating between the measured values, a surface luminosity level of would then have roughly the same incidence rate as absorbers with , less than the limit for SDLAs but still optically thick to Lyman continuum radiation. On the other hand, there may also be non-LAE galaxies with still undetected faint Ly haloes, similar to those found in ref. [7], which would increase the Ly incidence rates even further.
0.9 Data availability.
The observations of the HUDF discussed in this paper were made using European Southern Observatory (ESO) Telescopes at the La Silla Paranal Observatory under programme IDs 094.A-0289, 095.A-0010, 096.A-0045 and 096.A-0045. The corresponding data are available on the ESO archive at http://archive.eso.org/cms.html. The data of the HDFS were obtained during MUSE commissioning observations and are available at http://muse-vlt.eu/science/hdfs-v1-0/.
Additional references
References
- [1]
- [2] Bacon, R. et al. The MUSE Hubble Ultra Deep Field Survey. I. Survey description, data reduction, and source detection. Astronomy & Astrophysics 608, A1 (2017).
- [3] Moffat, A. F. J. A Theoretical Investigation of Focal Stellar Images in the Photographic Emulsion and Application to Photographic Photometry. Astronomy & Astrophysics 3, 455 (1969).
- [4] Herenz, E. C. & Wisotzki, L. LSDCat: Detection and cataloguing of emission-line sources in integral-field spectroscopy datacubes. Astronomy & Astrophysics 602, A111 (2017).
- [5] Inami, H. et al. The MUSE Hubble Ultra Deep Field Survey. II. Spectroscopic redshifts and comparisons to color selections of high-redshift galaxies. Astronomy & Astrophysics 608, A2 (2017).
- [6] Peng, C. Y., Ho, L. C., Impey, C. D. & Rix, H.-W. Detailed Structural Decomposition of Galaxy Images. The Astronomical Journal 124, 266–293 (2002).
- [7] Sersic, J. L. Atlas de galaxias australes. Cordoba, Argentina: Observatorio Astronomico, 1968 -1 (1968).
- [8] Rahmati, A. et al. The distribution of neutral hydrogen around high-redshift galaxies and quasars in the EAGLE simulation. Monthly Notices of the Royal Astronomical Society 452, 2034–2056 (2015).
- [9] Schaye, J. et al. The EAGLE project: simulating the evolution and assembly of galaxies and their environments. Monthly Notices of the Royal Astronomical Society 446, 521–554 (2015).
- [10] Rudie, G. C. et al. The Gaseous Environment of High-z Galaxies: Precision Measurements of Neutral Hydrogen in the Circumgalactic Medium of –3 Galaxies in the Keck Baryonic Structure Survey. The Astrophysical Journal 750, 67 (2012).
- [11] Garel, T. et al. The UV, Lyman alpha, and dark matter halo properties of high-redshift galaxies. Monthly Notices of the Royal Astronomical Society 450, 1279–1294 (2015).
- [12] Stark, D. P., Ellis, R. S., Chiu, K., Ouchi, M. & Bunker, A. Keck spectroscopy of faint Lyman break galaxies – I. New constraints on cosmic reionization from the luminosity and redshift-dependent fraction of Lyman emission. Monthly Notices of the Royal Astronomical Society 408, 1628–1648 (2010).
- [13] Caruana, J. et al. The MUSE-Wide survey: a measurement of the Ly alpha emitting fraction among z ¿ 3 galaxies. Monthly Notices of the Royal Astronomical Society 473, 30–37 (2018).
- [14] Stark, D. P., Ellis, R. S. & Ouchi, M. Keck spectroscopy of faint Lyman Break galaxies: A high fraction of line emitters at redshift six. The Astrophysical Journal 728, L2 (2011).


| range | FWHMPSF | ||||||||
|---|---|---|---|---|---|---|---|---|---|
| 3–4 | 1488 | 83 | 0.86 | 0.11 | 2.8 | 1.1 | 232 | 50 | 0.703 |
| 4–5 | 931 | 82 | 0.90 | 0.18 | 3.3 | 1.9 | 150 | 40 | 0.654 |
| 5–6 | 1002 | 164 | 1.67 | 0.86 | 6.5 | 5.1 | 167 | 34 | 0.606 |