The Hydra I cluster core - II. Kinematic complexity in a rising velocity dispersion profile around the cD galaxy NGC 3311
Abstract
Context. NGC 3311, the central galaxy of the Hydra I cluster, shows signatures of recent infall of satellite galaxies from the cluster environment. Previous work has shown that the line-of-sight velocity dispersion of the stars and globular clusters in the extended halo of NGC 3311 rises up to the value of the cluster velocity dispersion. In the context of Jeans models, a massive dark halo with a large core is needed to explain this finding. However, position dependent long-slit measurements show that the kinematics are still not understood.
Aims. We aim to find kinematic signatures of sub-structures in the extended halo of NGC 3311.
Methods. We performed multi-object spectroscopic observations of the diffuse stellar halo of NGC 3311 using VLT/FORS2 in MXU mode to mimic a coarse ‘IFU’. The slits of the outermost masks reach out to about 35 kpc of galactocentric distance. We use pPXF to extract the kinematic information of velocities, velocity dispersions and the high-order moments and .
Results. We find a homogeneous velocity field and velocity dispersion field within a radius of about 10 kpc. Beyond this radius, both the velocities and the velocity dispersion start to depend on azimuth angle and show a significant intrinsic scatter. The inner spheroid of NGC 3311 can be described as a slow rotator. Outside 10 kpc the cumulative angular momentum is rising, however, without showing an ordered rotation signal. If the radial dependence alone is considered, the velocity dispersion does not simply rise but fills an increasingly large range of dispersion values with two well defined envelopes. The lower envelope is about constant at 200 km s-1. The upper envelope rises smoothly, joining the velocity dispersion of the outer globular clusters and the cluster galaxies. We interpret this behaviour as the superposition of tracer populations with increasingly shallower radial distributions between the extremes of the inner stellar populations and the cluster galaxies. Simple Jeans models illustrate that a range of of mass profiles can account for all observed velocity dispersions, including radial MOND models.
Conclusions. The rising velocity dispersion of NGC 3311 apparently is a result of averaging over a range of velocity dispersions related to different tracer populations in the sense of different density profiles and anisotropies. Jeans models using one tracer population with a unique density profile are not able to explain the large range of the observed kinematics. Previous claims about the cored dark halo of NGC 3311 are therefore probably not valid. This may in general apply to central cluster galaxies with rising velocity dispersion profiles, where infall processes are important.
Key Words.:
galaxies: clusters: individual: Hydra I – galaxies: individual: NGC 3311 – galaxies: halos – Galaxies: elliptical and lenticular, cD – galaxies: formation – galaxies: kinematics and dynamics1 Introduction
The structure of galaxies can be strongly altered by environmental processes, like major and minor mergers, accretion of satellite galaxies, ram pressure stripping and other interactions between galaxies and with the intra-cluster medium. A striking phenomenon in this respect is the existence of very extended stellar halos around bright central galaxies in galaxy clusters (e.g. Schombert 1987, 1988). Early classification efforts assigned the term ‘cD’ to those galaxies (Matthews et al. 1964; Morgan & Lesh 1965) whose halos can in extreme cases embrace the entire host galaxy cluster as in the case of Abell 1413 (Oemler 1976; Castagné et al. 2012) frequently also presenting double or multiple nuclei of central galaxies (see Kormendy & Djorgovski 1989, for a discussion of the early literature). In the following, we use the term ‘cD’ in this simple sense, irrespective of whether the halo can photometrically identified as a separate entity or not, see Bender et al. (2015) for a more profound discussion.
The cluster environment is clearly important for the build-up of such a large halo, either by coalescence of larger galaxies or by the infall of smaller galaxies or tidal debris of cluster material. This is plausibly also the reason for the immense richness of the globular cluster systems (GCSs) of central galaxies (e.g., Harris et al. 2017) and, in the case of this study, the rich GCS of NGC 3311, the central galaxy of the Hydra I galaxy cluster (Wehner et al. 2008).
Given that the halos of massive ellipticals in general grow by a factor of about 4 in mass since (van Dokkum et al. 2010), one expects an even higher growth rate in the centres of galaxy clusters, where the galaxy number density is highest. The more recent mass growth is dominated by the accretion of low mass systems (minor mergers) which may leave kinematical signatures in the phase space of the outer stellar population of central cluster galaxies. These extreme environments, therefore, are suitable to study the main physical processes that cause the destruction of infalling galaxies as well as the build-up of the intra cluster light and the central dark matter halo of a galaxy cluster.
The extended envelopes make it possible to probe the kinematical properties of the galaxy light out to large radii. A rise of the velocity dispersion of the galaxy light is not unusual for the most massive early-type galaxies (Newman et al. 2013; Veale et al. 2017). The first measured rising velocity dispersion profile was reported by Dressler (1979) for the cD galaxy IC 1101 in the cluster Abell 2029. In the second known and well studied case of NGC 6166, the velocity dispersion stays constant at a value of 200 km/s until a radius of 10 kpc and then steeply rises to high values above 800 km/s at large radii, reaching the velocity dispersion of galaxies in the cluster (Carter et al. 1999; Kelson et al. 2002; Bender et al. 2015).
One of the nearest cD-galaxies is NGC 3311, the central galaxy in the Hydra I galaxy cluster. Recent publications on NGC 3311 are mainly from our group (Ventimiglia et al. 2008, 2010, 2011; Coccato et al. 2011; Misgeld et al. 2011; Richtler et al. 2011; Arnaboldi et al. 2012; Barbosa et al. 2016, 2018). Photometric and kinematical studies using the galaxy light, planetary nebulae (PNe) and globular clusters (GCs) clearly demonstrate the close connection of the inner galaxy with its host cluster. Asymmetric light distribution and tidal tails are evidences of recent infall processes (Arnaboldi et al. 2012). Planetary nebulae show a non-Gaussian velocity distribution with peaks that are offset from the systemic velocity (Ventimiglia et al. 2011). The central velocity dispersion of the galaxy light is only 150 km/s (but fits to its low surface brightness) and rises up to almost 400 km/s within 10 kpc. The more distant globular clusters reach an even higher velocity dispersion, equal to that of the cluster galaxies (Misgeld et al. 2011; Richtler et al. 2011) . To explain this rise with a simple Jeans model, one needs a large core of dark matter. The population composition of NGC 3311 indicates a distinction between the original elliptical galaxy and the later accreted material: the inner galaxy is old and metal-rich, while at larger radii the scatter in metallicity becomes considerably larger (Barbosa et al. 2016).
Apparent discrepancies of kinematical values, in particular the velocity dispersion, measured with long-slits of different azimuthal orientations have been reported by Richtler et al. (2011). In this paper we demonstrate that indeed the velocity and velocity dispersion show a two-dimensional irregular pattern and that the kinematics at radii larger than 10 kpc cannot be described by a radial coordinate only. This continues the trend already seen in the high surface brightness parts of the galaxy, where the dynamical analysis of MUSE observation has revealed an asymmetric velocity and velocity dispersion field with azimuthal variations (Barbosa et al. 2018). The present work emphasizes that it is important to investigate the entire velocity field of the galaxy light and its kinematic properties out to large radii. The database of the present paper has already been used in Barbosa et al. (2016, Paper I) to analyse the stellar population properties of NGC 3311.
The present paper is structured as follows. In Section 2 we present the detailed observational properties and data reduction. The kinematical analysis is described in Section 3. The measurement of stellar kinematics and main results are presented and discussed in Sections 4 and 5, with the final summary and conclusion in Section 6. Throughout this paper, we adopt the distance to the Hydra I cluster core as 50.7 Mpc.
2 Observations and data reduction
2.1 Observations
For our study of NGC 3311’s halo we used data from ESO programme 088.B-0448 (PI: Richtler). The spectroscopic science data were taken in seven different nights between January 17th and March 29th, 2012, with FORS2 (in multi-object mode, using the Mask eXchange Unit (MXU)) mounted on UT1 at Paranal Observatory. We used the 1400V grism, which covers the wavelength range 4600-5800Å. With a slit width of 1″and a dispersion of 0.31Å/pixel we reach a spectral resolution of 2100 at 5200Å, which translates into a velocity resolution of 140 km/s. Six different MXU masks were necessary to cover the halo around NGC 3311. For each mask twilight skyflats were taken, mostly in the same nights as the science exposures. Those flats are important to calibrate the relative responses between object and sky slits.
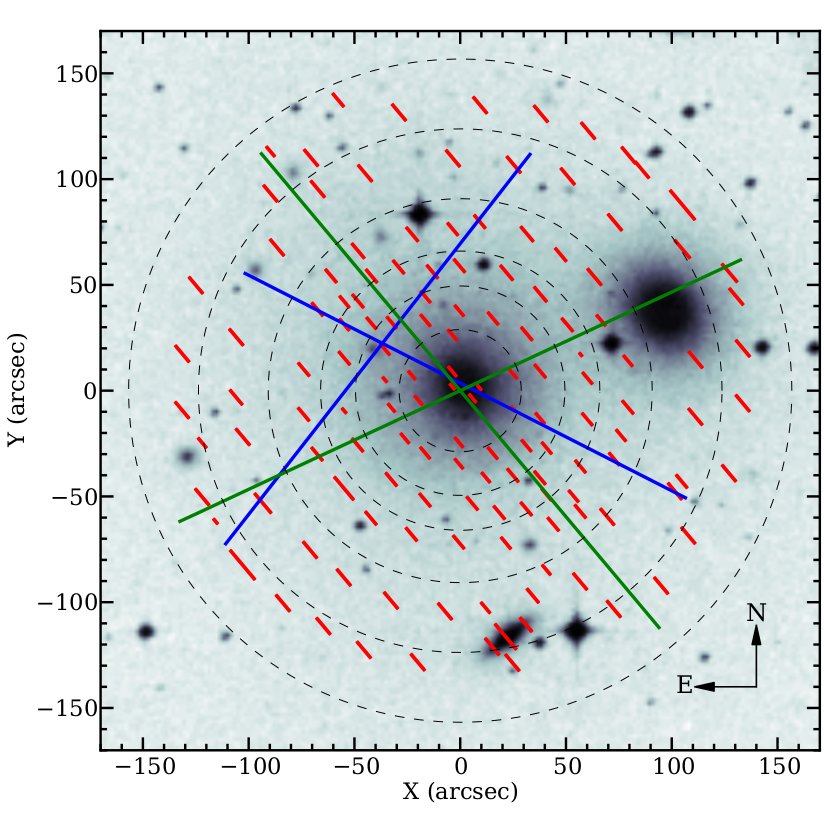
The mask design follows an ’onion-shell’ approach. Each mask consists of a half-ring of halo slits, all positioned at about the same galactocentric distance from NGC 3311. The typical dimensions of the slits are 15″. The combination of 23 masks with half-rings of slits at different galactocentric distances on each side of NGC 3311 complete the full onion-shell of halo slits. This is shown in Figure 16. The outermost halo slits reach distances of 150″( kpc) from the galaxy centre. The onion-shell approach allows us to study the stellar population properties at several radii as well as at different azimuthal angles in the halo of NGC 3311. It kind of mimics a coarse IFU. The advantage of such an approach is that an ‘effective IFU field-of-view’ of about arcmin is homogeneously covered, which is larger than the so far largest single IFU Multi-Unit Spectroscopic Explorer (MUSE) at the VLT.
The halo slits avoid point sources and galaxies, except the lenticular galaxy HCC 007 south of NGC 3311. The position angle of the masks and thus slits was chosen such that we have free sky regions close to the borders of the 7.8′field-of-view in spatial direction of the slits. This is the case north-east and south-west of NGC 3311, as can be seen in Figure 16. We distributed the sky slits such that they are located at the same x-positions (in CCD coordinates) as the halo slits. This guarantees that we always have a sky spectrum that covers the same wavelength range as the corresponding halo spectrum. We named the slits in the different half-shells with the prefixes ’cen1’, ’cen2’, ’inn1’, ’inn2’, ’out1’ and ’out2’ from inwards out, and numbered them with increasing spatial position on the y-axis of the CCD chip (see Figure 16).
The exposure times of the two innermost shells (cen1 and cen2 and inn1 and inn2) were 21400 seconds. The masks of the outer shells (out1 and out2) were exposed 61400 seconds. Between the individual exposures a dither along the slit of up to ″was applied.
Figure 1 shows our onion-shell halo slits (in red) in the context of previous long-slit observations. The blue and green slits belong to data presented in Ventimiglia et al. (2010) and Richtler et al. (2011), respectively. Our slit design resulted in 135 slits dedicated to the halo of NGC 3311 and NGC 3309. Not all of them could be used because the 1400V grism causes a tilt of the light beam which shifts the spectrum on the detector in Y direction by 28″. In this way three spectra, one in each of the masks ’cen1’, ’cen2’ and ’inn1’, were lost because they ended up in the chip gap of the two FORS2 CCDs. And in the other masks six slits, two in each mask, were shorter than expected because of the gap, and thus the spectra of those slits have a slightly lower S/N than other spectra at similar surface brightnesses.
2.2 Data reduction
The reduction was carried out with custom scripts based on IRAF tasks, mainly taken from the twodspec, longslit, apextract and onedspec packages (e.g. Tody 1993). All science, twilight skyflat and arc lamp exposures were first bias and flatfield corrected. Individual twilight skyflats of the same mask were combined. The science exposures were cleaned from cosmics using the lacos_spec routine from van Dokkum (2001). We determined the spatial distortion of the spectra by identifying and tracing the slit gaps in the normalized flatfield as ‘absorption features’ (using the IRAF tasks identify, reidentify and fitcoords). The science exposures, twilight flats and arc lamp exposures were then straightened by applying the derived coordinate transformation. The spectral regions of all individual slits were cut out in all rectified frames. An illumination correction of the science exposures and twilight skyflats along the slits was applied, which was derived from the twilight skyflats. Next, a 2-dimensional wavelength calibration was performed on the arc lamp exposures of each slit and applied to the science exposures. The position of the 5577.3Å[O I] sky line was used to correct for residual zeropoint shifts in the wavelength calibrations, which were of the order of 0.1-0.4Å. The individual calibrated science exposures of each mask were then averaged. We interactively used the IRAF task apall to define the aperture to be extracted in the individual slits, avoiding edge effects. The same extraction was applied to the twilight skyflats. The very central slits of NGC 3311 as well as the three slits in HCC 007 have a very high S/N, and we have split them into 2 (central) and 3 and 5 (HCC 007 outer and inner) sub-apertures, respectively.
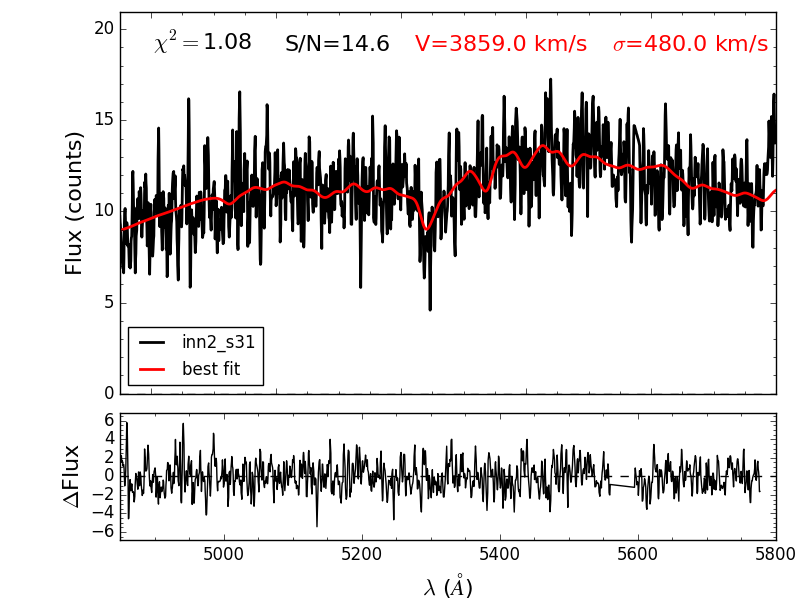
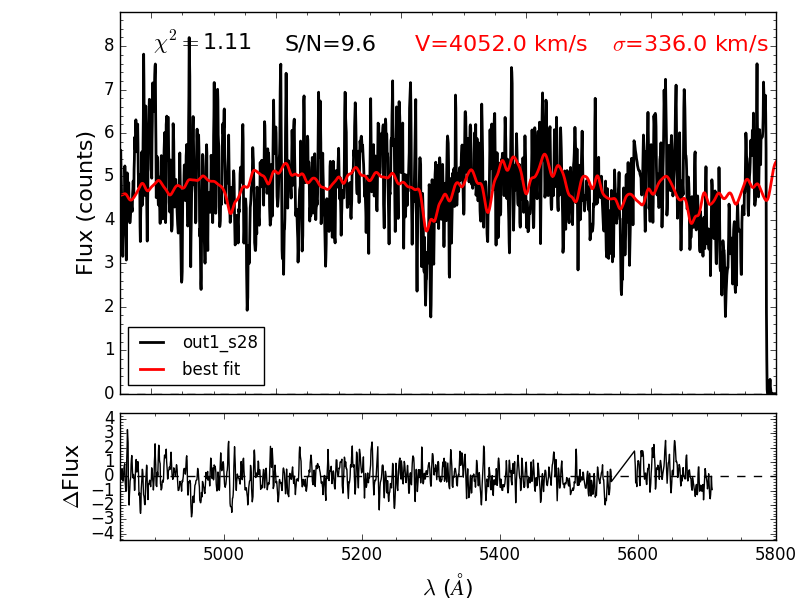
The last, most important step was to subtract the sky from the galaxy spectra, taking into account the different sizes and sensitivities of the galaxy-sky slit pairs. For that we collapsed for each slit the 2-dimensional twilight skyflats of the galaxy and sky slits by averaging all lines along the spatial direction. The 1-dimensional twilight spectra of galaxy and sky were divided by each other to derive the relative response between galaxy and sky slit. We fitted a spline of 7th order to the response spectrum, and used this fit to bring the sky spectrum to the same sensitivity as the galaxy spectrum. Only then, we subtracted the sensitivity corrected sky spectrum from the galaxy spectrum. Remaining sky residuals of the 5577.3Å[O I] sky line were masked out in the final 1-dimensional galaxy spectra. Finally, all spectra were corrected for having their wavelength scale in heliocentric velocities, that is the motion of the Sun with respect to the observed direction as calculated from the header parameters was taken out.
We did not perform flux calibration because this is not straightforward for FORS2/MXU spectra. The standard star is taken in the middle of the CCD, whereas the MXU slits are distributed all over the CCD. Since the response function depends on the x-position on the CCD and all slits cover different wavelength ranges, most of the extracted spectra would get a slightly wrong and incomplete flux calibrations. In any case, for the purpose of this paper, that is to derive the kinematics of NGC 3311’s halo, a flux calibration is not needed.
3 Stellar kinematics
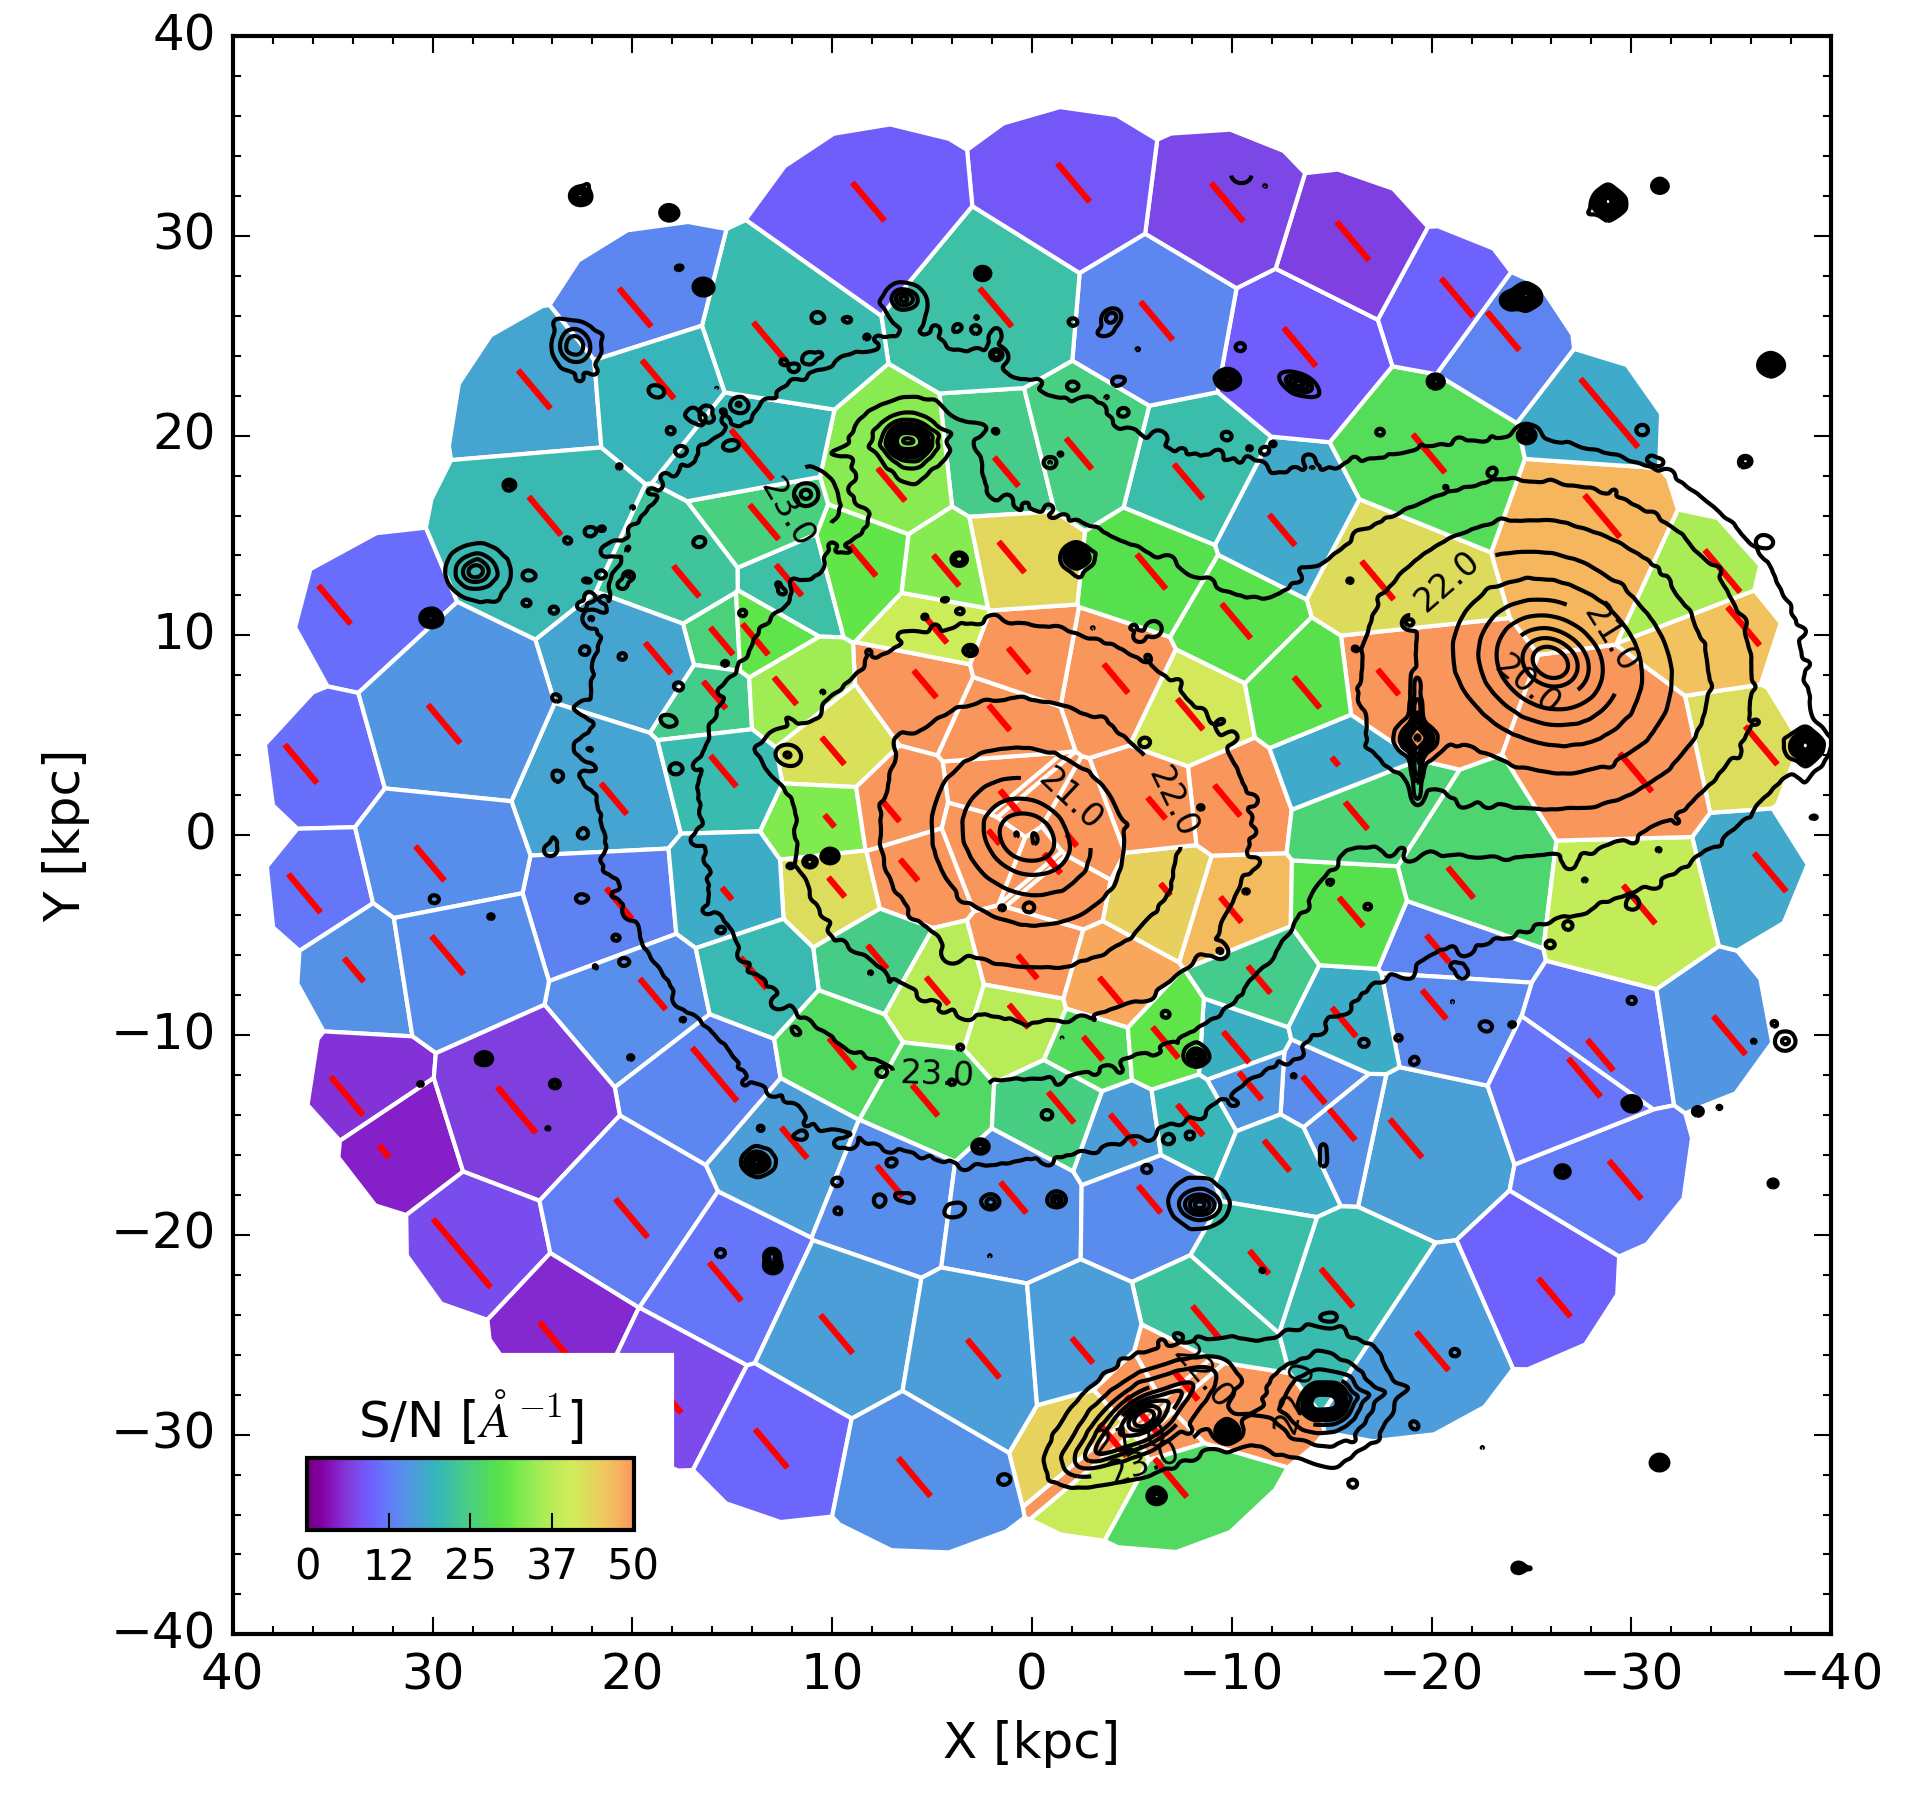
We measured the line-of-sight (LOS) stellar kinematics of our dataset using the penalized pixel-fitting code (pPXF, Cappellari & Emsellem 2004), which allows the simultaneous fitting of a linear combination of stellar templates with a line-of-sight velocity distribution (LOSVD). We carefully selected the fitting ranges for each slit individually by eye to avoid continuum discontinuities, sky lines and strong noise. The overall maximum wavelength range for all spectra is 4510Å5850Å, but the selected fitting regions vary depending on the slit positions on the chip, and thus the wavelength region covered. The common minimum range of fitting regions for all spectra is 4900Å5520Å. For consistency, we calculated the S/N per Åfor all spectra in the wavelength range 5200Å5500Å. We measured the S/N by comparing the integrated light in the observed spectrum with the standard deviation of the residuals between the observed spectrum and the best fit template from pPXF. A map of the S/N values per spectrum is shown in Figure 2.
As templates for the spectral fitting we took single stellar population spectra from Vazdekis et al. (2010), which uses spectra from the MILES stellar library (Sánchez-Blázquez et al. 2006), computed with a resolution of 2.5Å, a Salpeter initial mass function (IMF) with logarithmic slope of , ages from 0.1 to 15 Gyr and metallicities in the range [Z/H] dex. We convolved our observed spectra with a Gaussian filter to bring the instrumental resolution of FWHM2.1Åto the resolution of the MILES template spectra of FWHM2.5Å.
For the fitting, we used a velocity distribution characterised by the velocity (), the velocity dispersion () and the two high order Gauss-Hermite moments and , which measure deviations from the simple Gaussian profile. describes the skewness of the Gaussian, in other words negative values indicate a distribution with an extended tail towards low velocities, and positive values vice versa. describes the kurtosis of the Gaussian, that is positive values describe a distribution more ’peaked’ than a Gaussian, and negative values indicate a more flat-topped distribution. There is no simple relation between and the anisotropy. Apart from the anisotropy, depends on the potential and the density profile of the tracer population. An exact Gaussian is produced by an isotropic population that generates an isothermal potential.
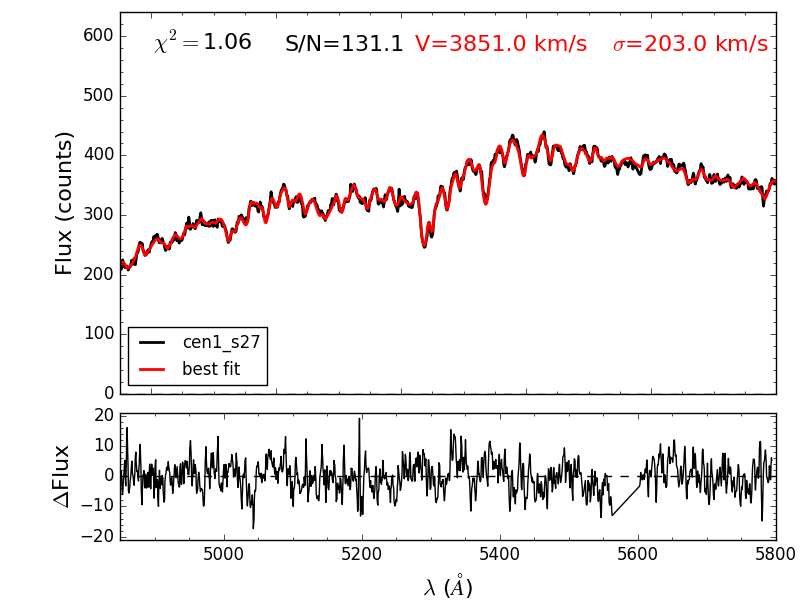
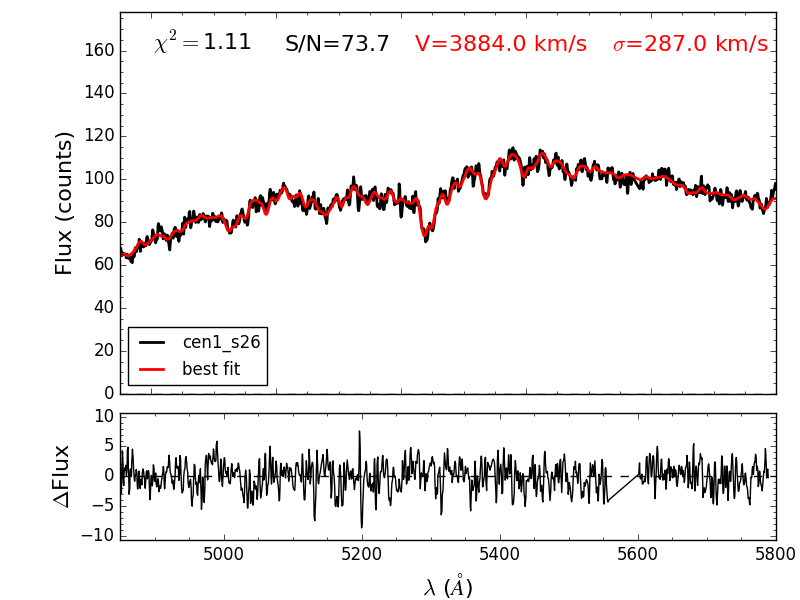
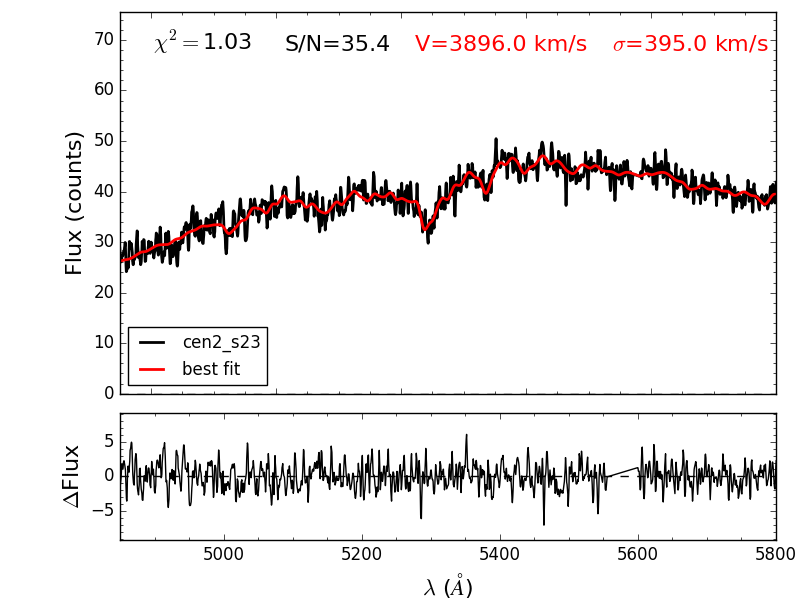
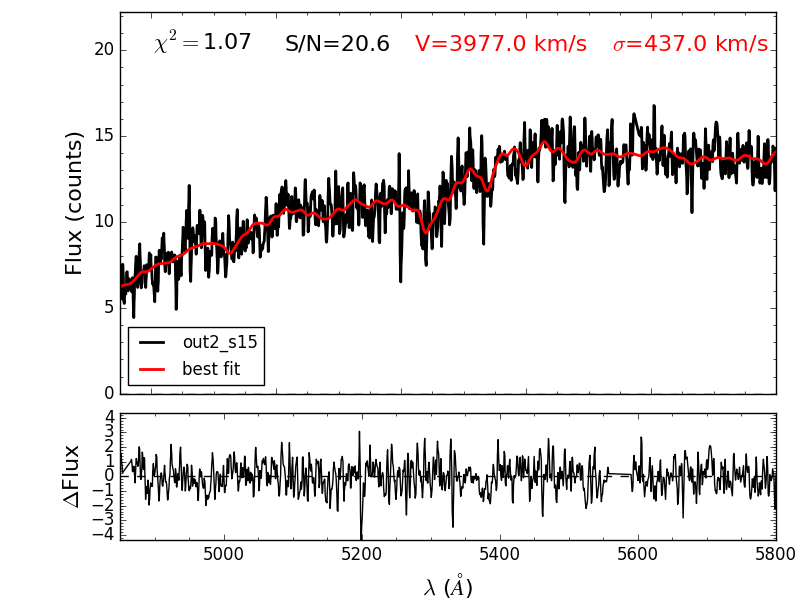
Besides the best fitting parameters, pPXF also provides a noiseless best fit spectrum, and the residual difference between the observed and best fit spectrum gives a good estimation of the observation noise. Uncertainties for the four parameters were calculated via Monte Carlo simulations based on the S/N for each spectrum. However, pPXF makes a global minimization in the parameter space with a single figure-of-merit function (), and in some cases the ‘best’ parameters are not a good description of the overall shape of the spectra. This issue, the so-called template mismatch, can be avoided in most cases by careful visual inspection of the fitting results. We, therefore, thoroughly tested, in an interactive manner, which combination of additive and multiplicative polynomials for the continuum fit in pPXF ( and , respectively) gave the most reliable results. We chose and for most of the spectra, and and for some exceptions. The results of kinematic measurements with pPXF are presented in Table LABEL:tab:kinematics in the appendix, and six example spectra with different S/N values are shown in Figure 3 together with their best pPXF fits and residuals.
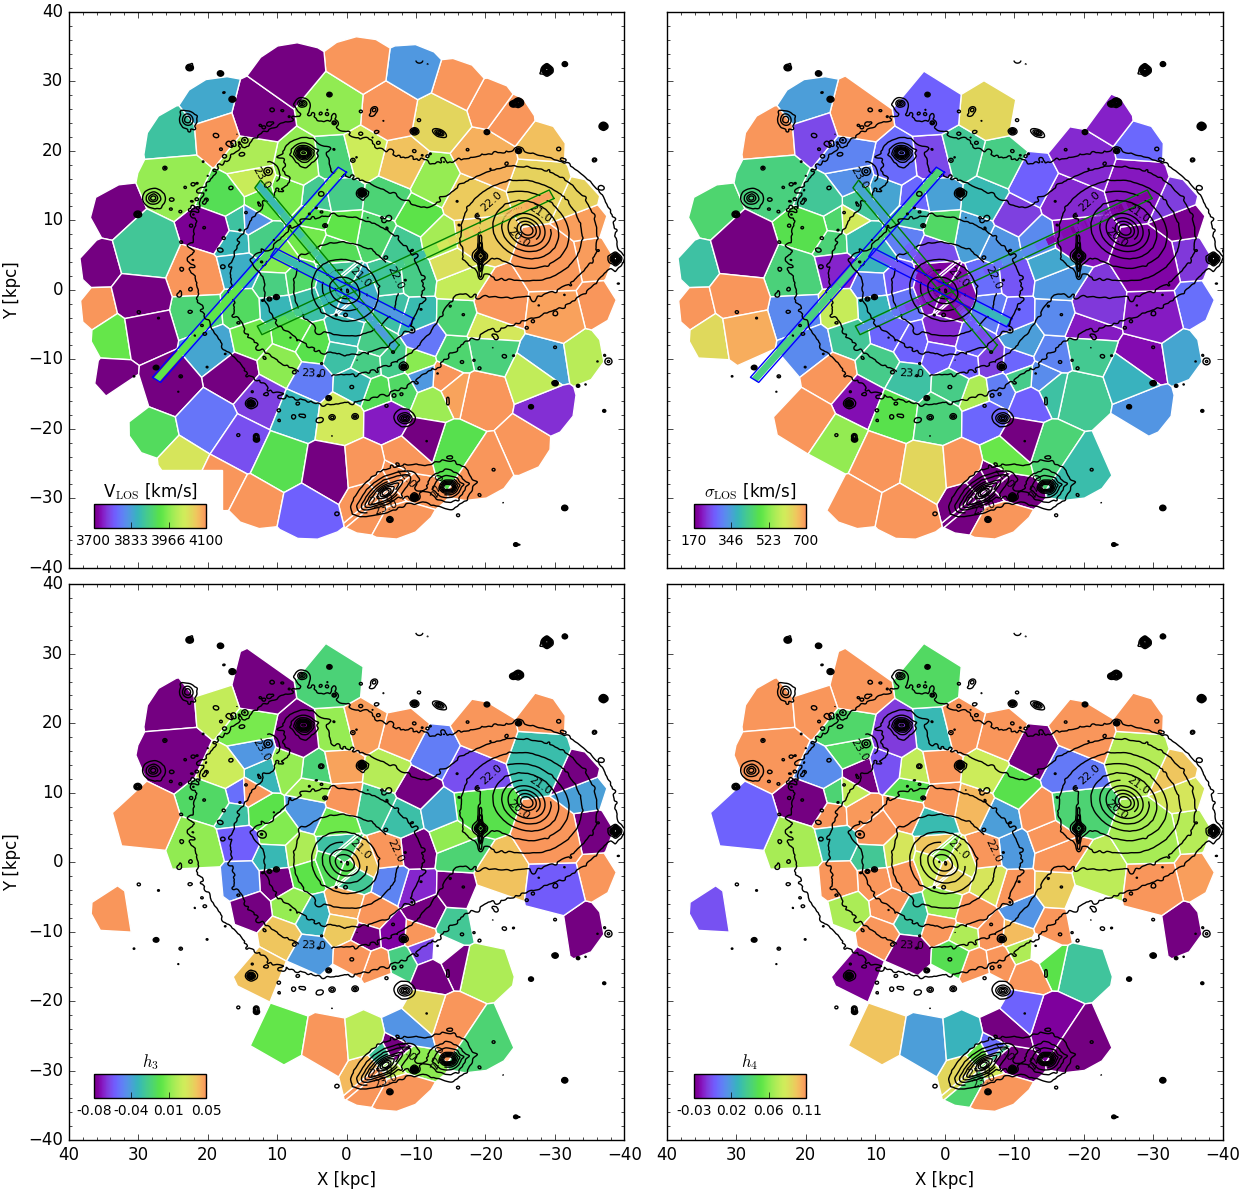
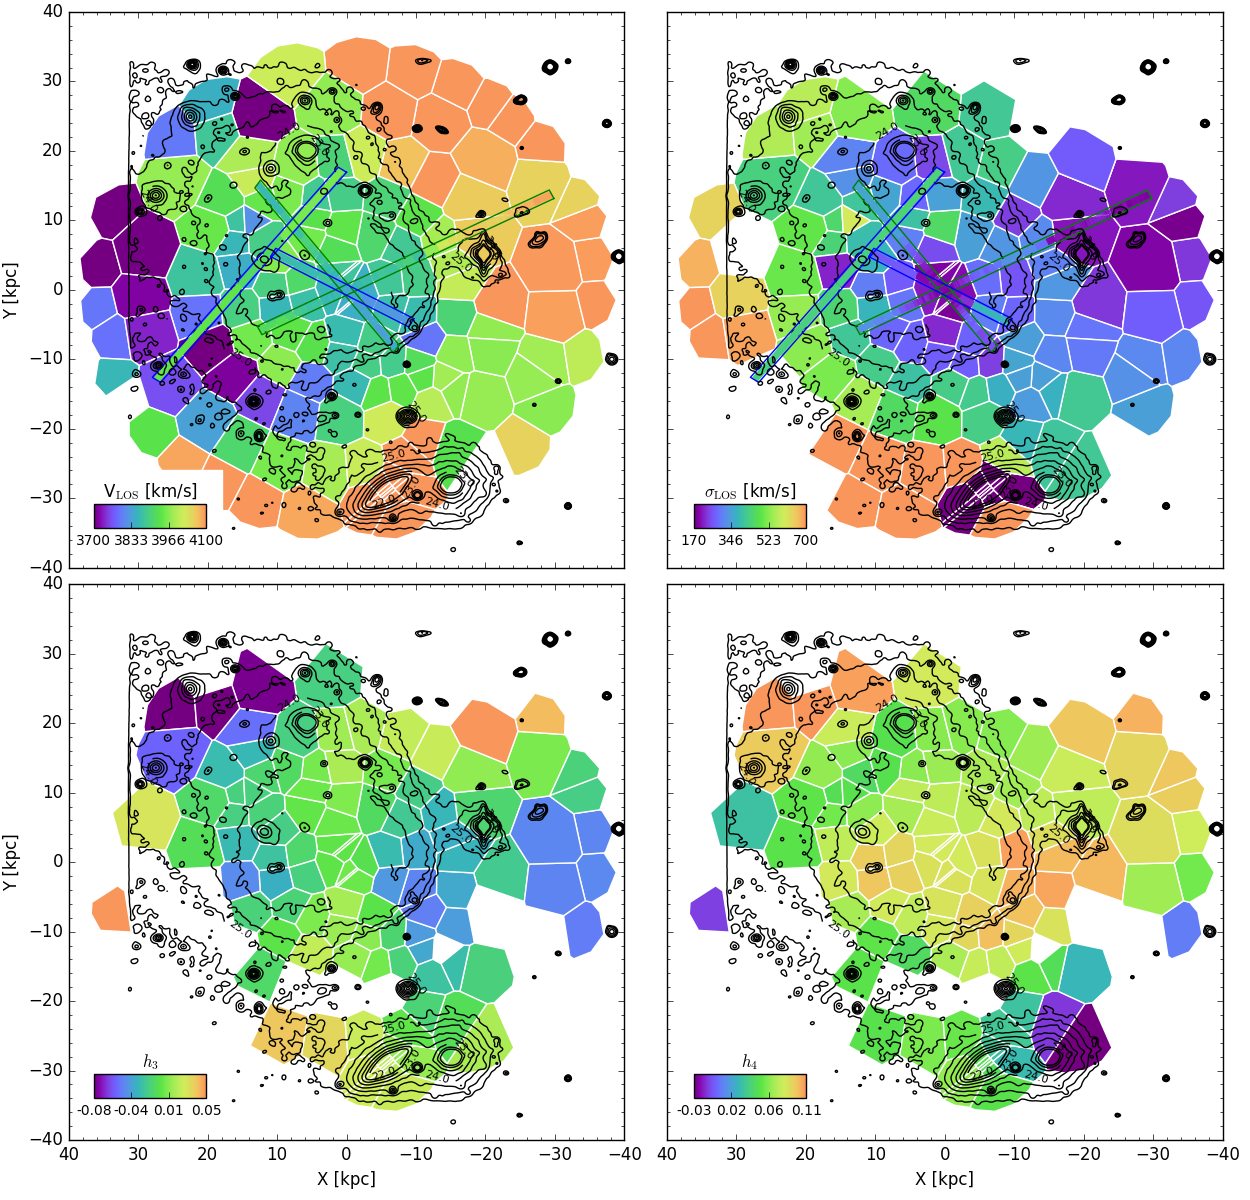
We produced 2D maps of the kinematic parameters extrapolating the slits using a Voronoi tesselation (see Figure 4). In all maps the same polygons as shown in the S/N map (Fig. 2) are used. We applied different minimum S/N cuts to the four parameters, which are S/N5 for , S/N10 for , and S/N15 for the higher moments and . Those cuts were motivated by visual inspection of the fitting results. Below these cuts the derived values were considered unreliable.
In order to improve the visualization of the main trends in the maps and to provide a kind of binned 2D map with higher S/N, we also produced filtered maps obtained with a locally weighted scatterplot smoothing (LOESS) algorithm (Cleveland 1979) calculated with the Python implementation of Cappellari et al. (2013). This non-parametric method is suitable for the reconstruction of functions on noise data, and has a single free parameter, the fraction of data points to be considered around each data point. We set this fraction to 0.3 for all our maps. For the and maps only regions with S/N¡20 were smoothed, whereas higher S/N polygons show their original values because their and values are highly reliable due to small relative errors. For the and maps all polygons were smoothed, thus increasing the signal of structures in adjacent polygon cells of the 2D maps and overcoming the large relative errors of h3 and h4. The smoothed maps illustrate that the small scale variations in the kinematic values do not only depend on the scatter of low S/N bins.
Finally, for the analysis of our results, we overplotted on these maps two sets of surface brightness contours. The first set was produced from a -band image in surface brightness intervals ranging from 20 to 23.5 mag arcsec-2 in steps of 0.5 mag arcsec-2 (see Figure 4). The second set was produced from the residual -band image after maximum symmetric models were subtracted from the two central galaxies NGC 3311 and NGC 3309 (Arnaboldi et al. 2012). The contours range from 22 to 26 mag arcsec-2 in steps of 0.5 mag arcsec-2 (see Figure 5). This residual image clearly shows the non-symmetrical excess of light in the north-east region of NGC 3311, as well as some excess of light close to the lenticular galaxy HCC 007 at the bottom of the image. As one can see in Figure 2, also the S/N of our spectra is enhanced in these excess regions.
4 Results
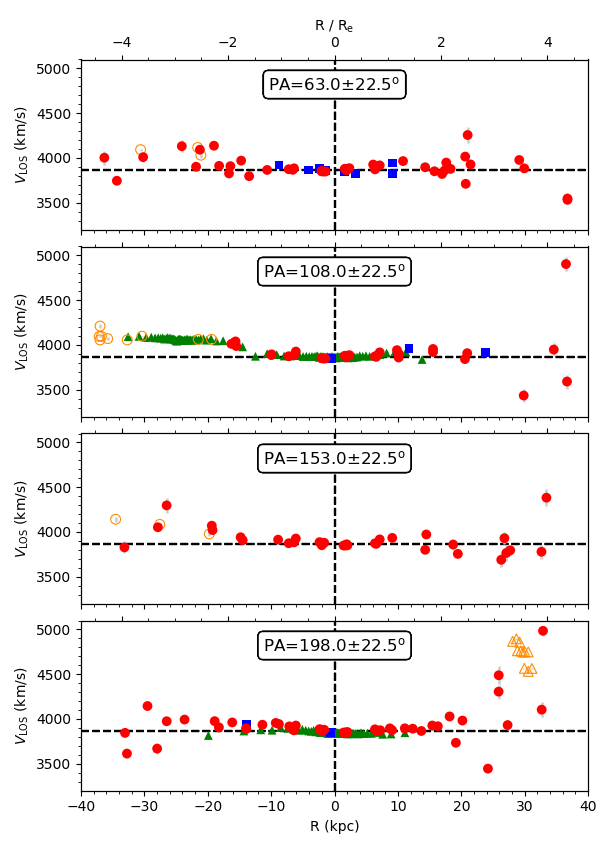
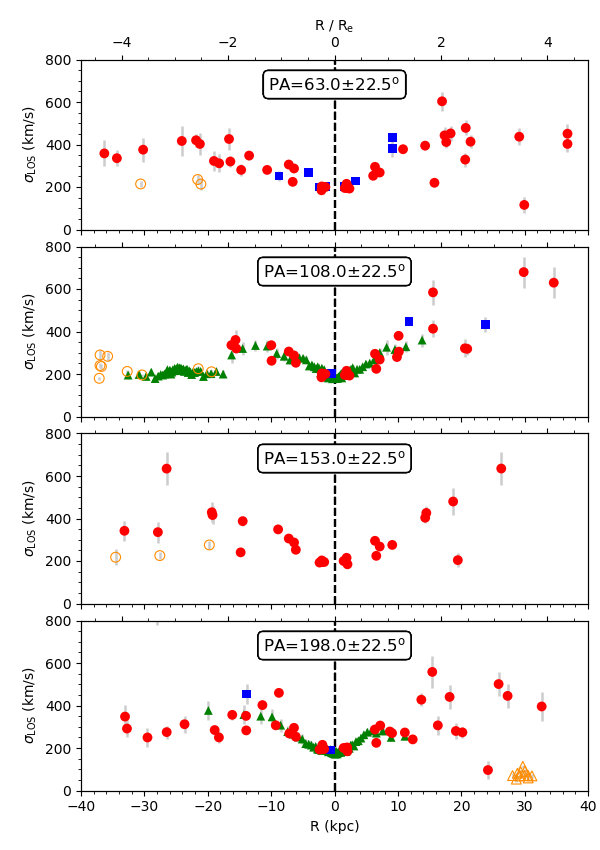
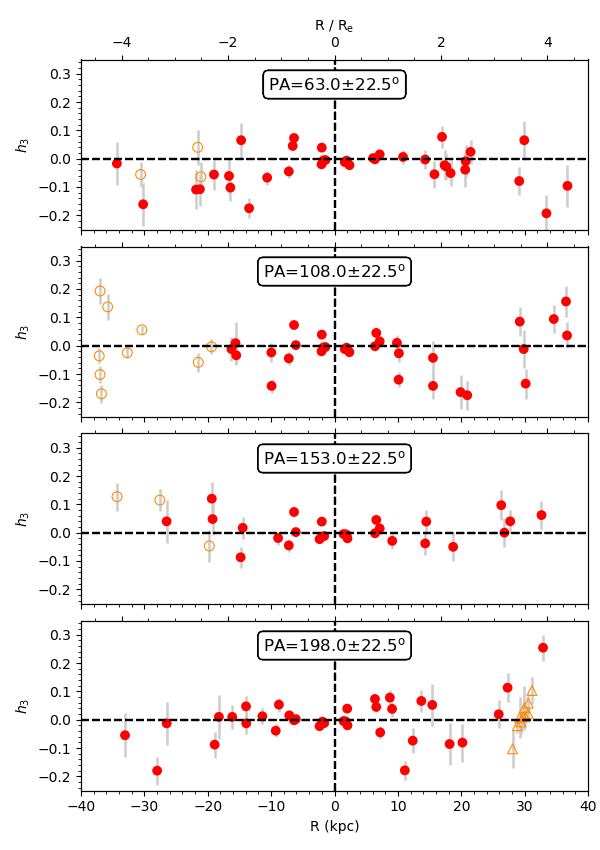
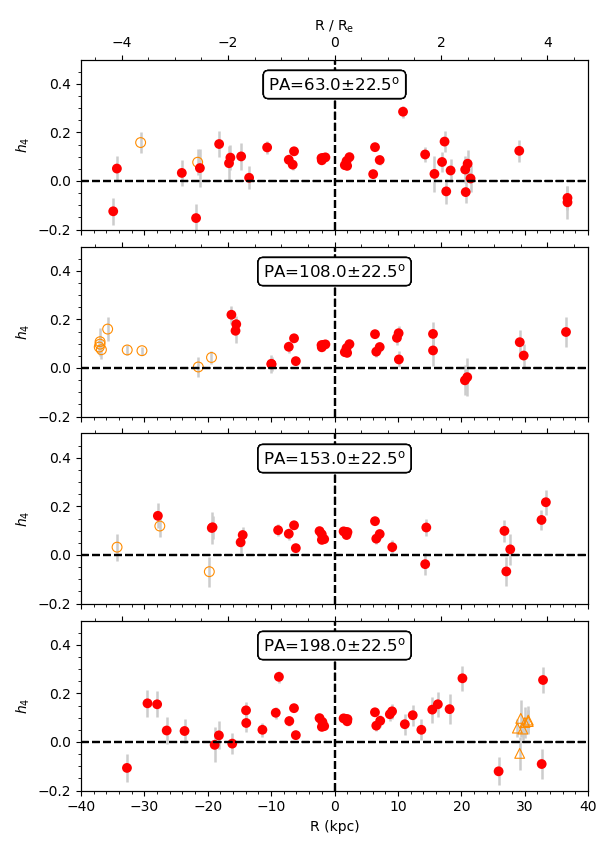
The final kinematic maps are presented in Figures 4 and 5. Colour bars in the legend indicate the parameter range displayed in the individual maps. In order to analyse kinematic trends with galactocentric distance from NGC 3311 and position angle around it we created position- and position- diagrams in four different segments of 45 degree width, see Figure 6. The position angle, PA, is defined as North and East. The four PA values are chosen such that they coincide with the galaxy’s major axis (, Arnaboldi et al. 2012), its minor axis () and the two orientations of the long-slits at and from Richtler et al. (2011), see left panels in Figure 6. Radial bins are also given in units of effective radii (top labels), with kpc for NGC 3311 (Arnaboldi et al. 2012). We corrected for systematic velocity offsets between the long-slit and our results, as discussed below. We also produced similar plots for the Gauss-Hermite coefficients and , see Figure 7. In all these plots we only show data (Voronoi tesselation cells) that fulfil the following error selection for the respective quantity (, , and ): km s-1, km s-1, and .


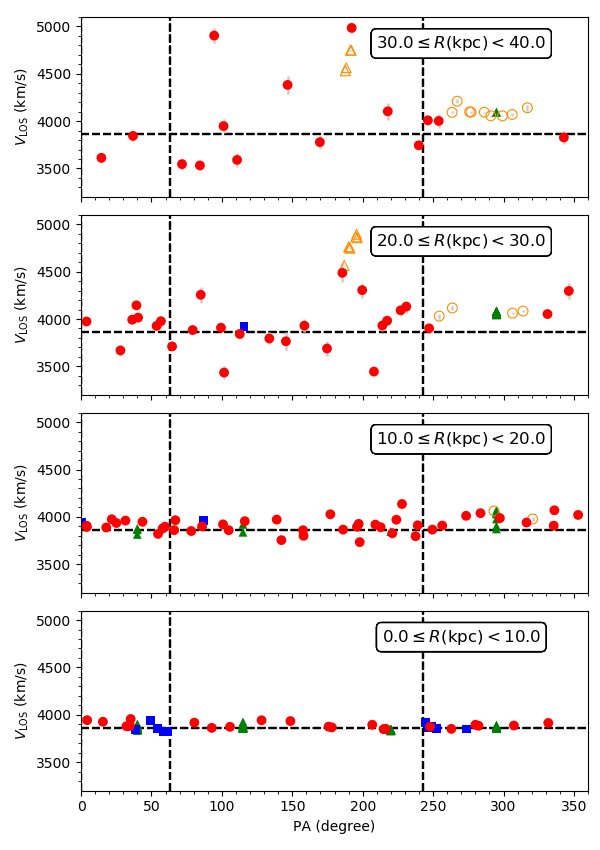
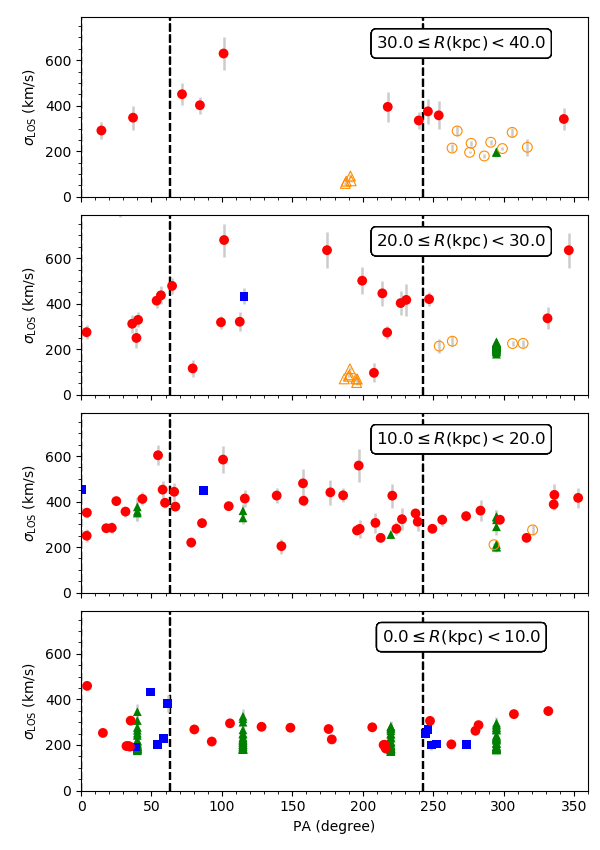
Moreover, we present in Figure 8 and as function of position angle around NGC 3311 in four radial bins of 10 kpc width from the centre out to 40 kpc. The distributions show the degree of symmetry and scatter of the LOSVD moments as function of distance to the galaxy centre out to 5 effective radii. In Figures 6 to 8, those slits that are dominated by light from the giant elliptical NGC 3309 and the lenticular galaxy HCC 007 are indicated by open orange symbols (circles and triangles, respectively). The selection of those slits was guided by the surface brightness contours shown in Figure 2. In Table LABEL:tab:kinematics the spectra that belong to the halo of NGC 3311, NGC 3309 and HCC 007 are identified by the flags 1, 2, and 3, respectively, in column (13).
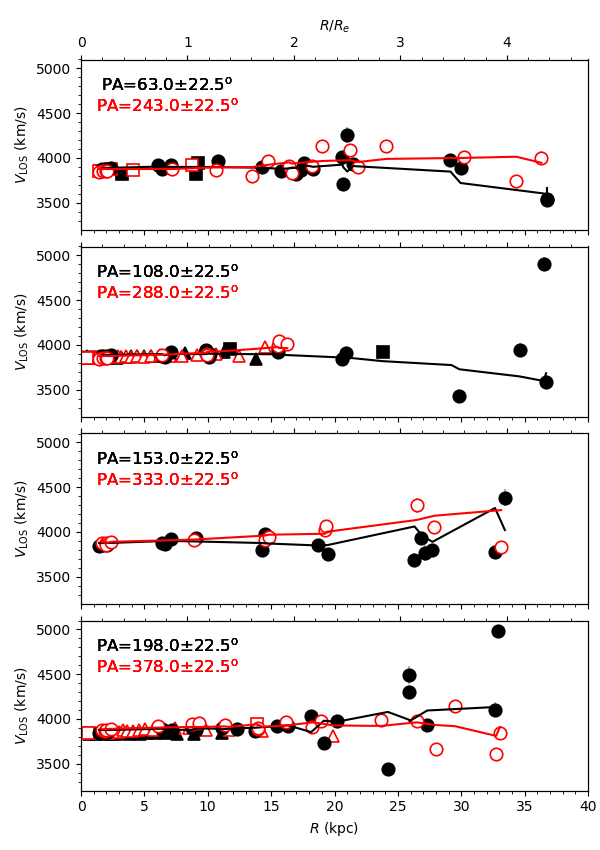
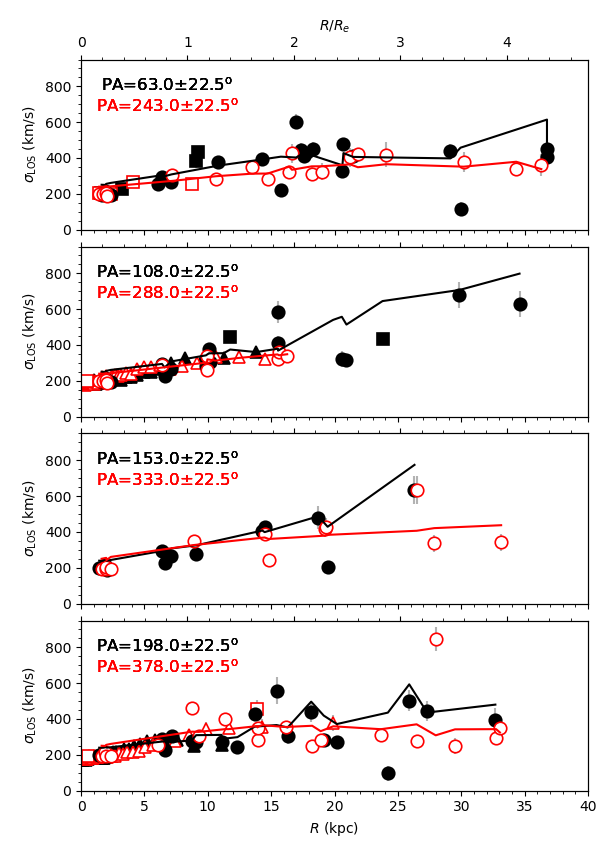
Additionally, in order to highlight the asymmetric distribution of the velocity and velocity dispersion, we plot in Figures 9 and 10 folded values for four position angles, overplotting the results for the positive major-axis on top of the results from the negative major-axis. We exclude from this plot the data points around NGC 3309 and HCC 007, both for our data and the longslit data, to only show the profiles of NGC 3311’s halo population.
Finally, we analysed the root mean square velocity, rotation measure and angular momentum parameter as function of galactocentric radius in Figure 12. For that, as well as for the dynamical modelling (Section 5) we apply a more stringent velocity error selection, km s-1, to get a high quality data sample. Data points close to NGC 3309 and HCC 007 are excluded here as well.

4.1 Line-of-sight velocity
The velocity () map can be characterized by several main (bulk motion) regions, but also considerable velocity variations on small scales. The velocity field within 10 kpc of NGC 3311 is rather smooth with indications of a slight ’asymmetry’ in the sense that is shifted to higher velocities in the North-East than in the South-West (see lower left panel in Fig. 6). There is, however no sign of ordered rotation around NGC 3311. The system seems to be pressure supported, the velocity dispersion dominates any potential rotation signal at all radii (see also Section 4.5).
The radial velocities measured in the six most central slits (cen1_s27, cen1_s29, cen2_s30 and cen2_s32) are between 3848 and 3879 km s-1, consistent within the errors with previous measurements of NGC 3311’s systemic velocity (e.g. Richtler et al. 2011, but NED: 3825 km s-1). We adopt a central velocity of 3863 km s-1 for our work, which is the average value of the six central measurements.
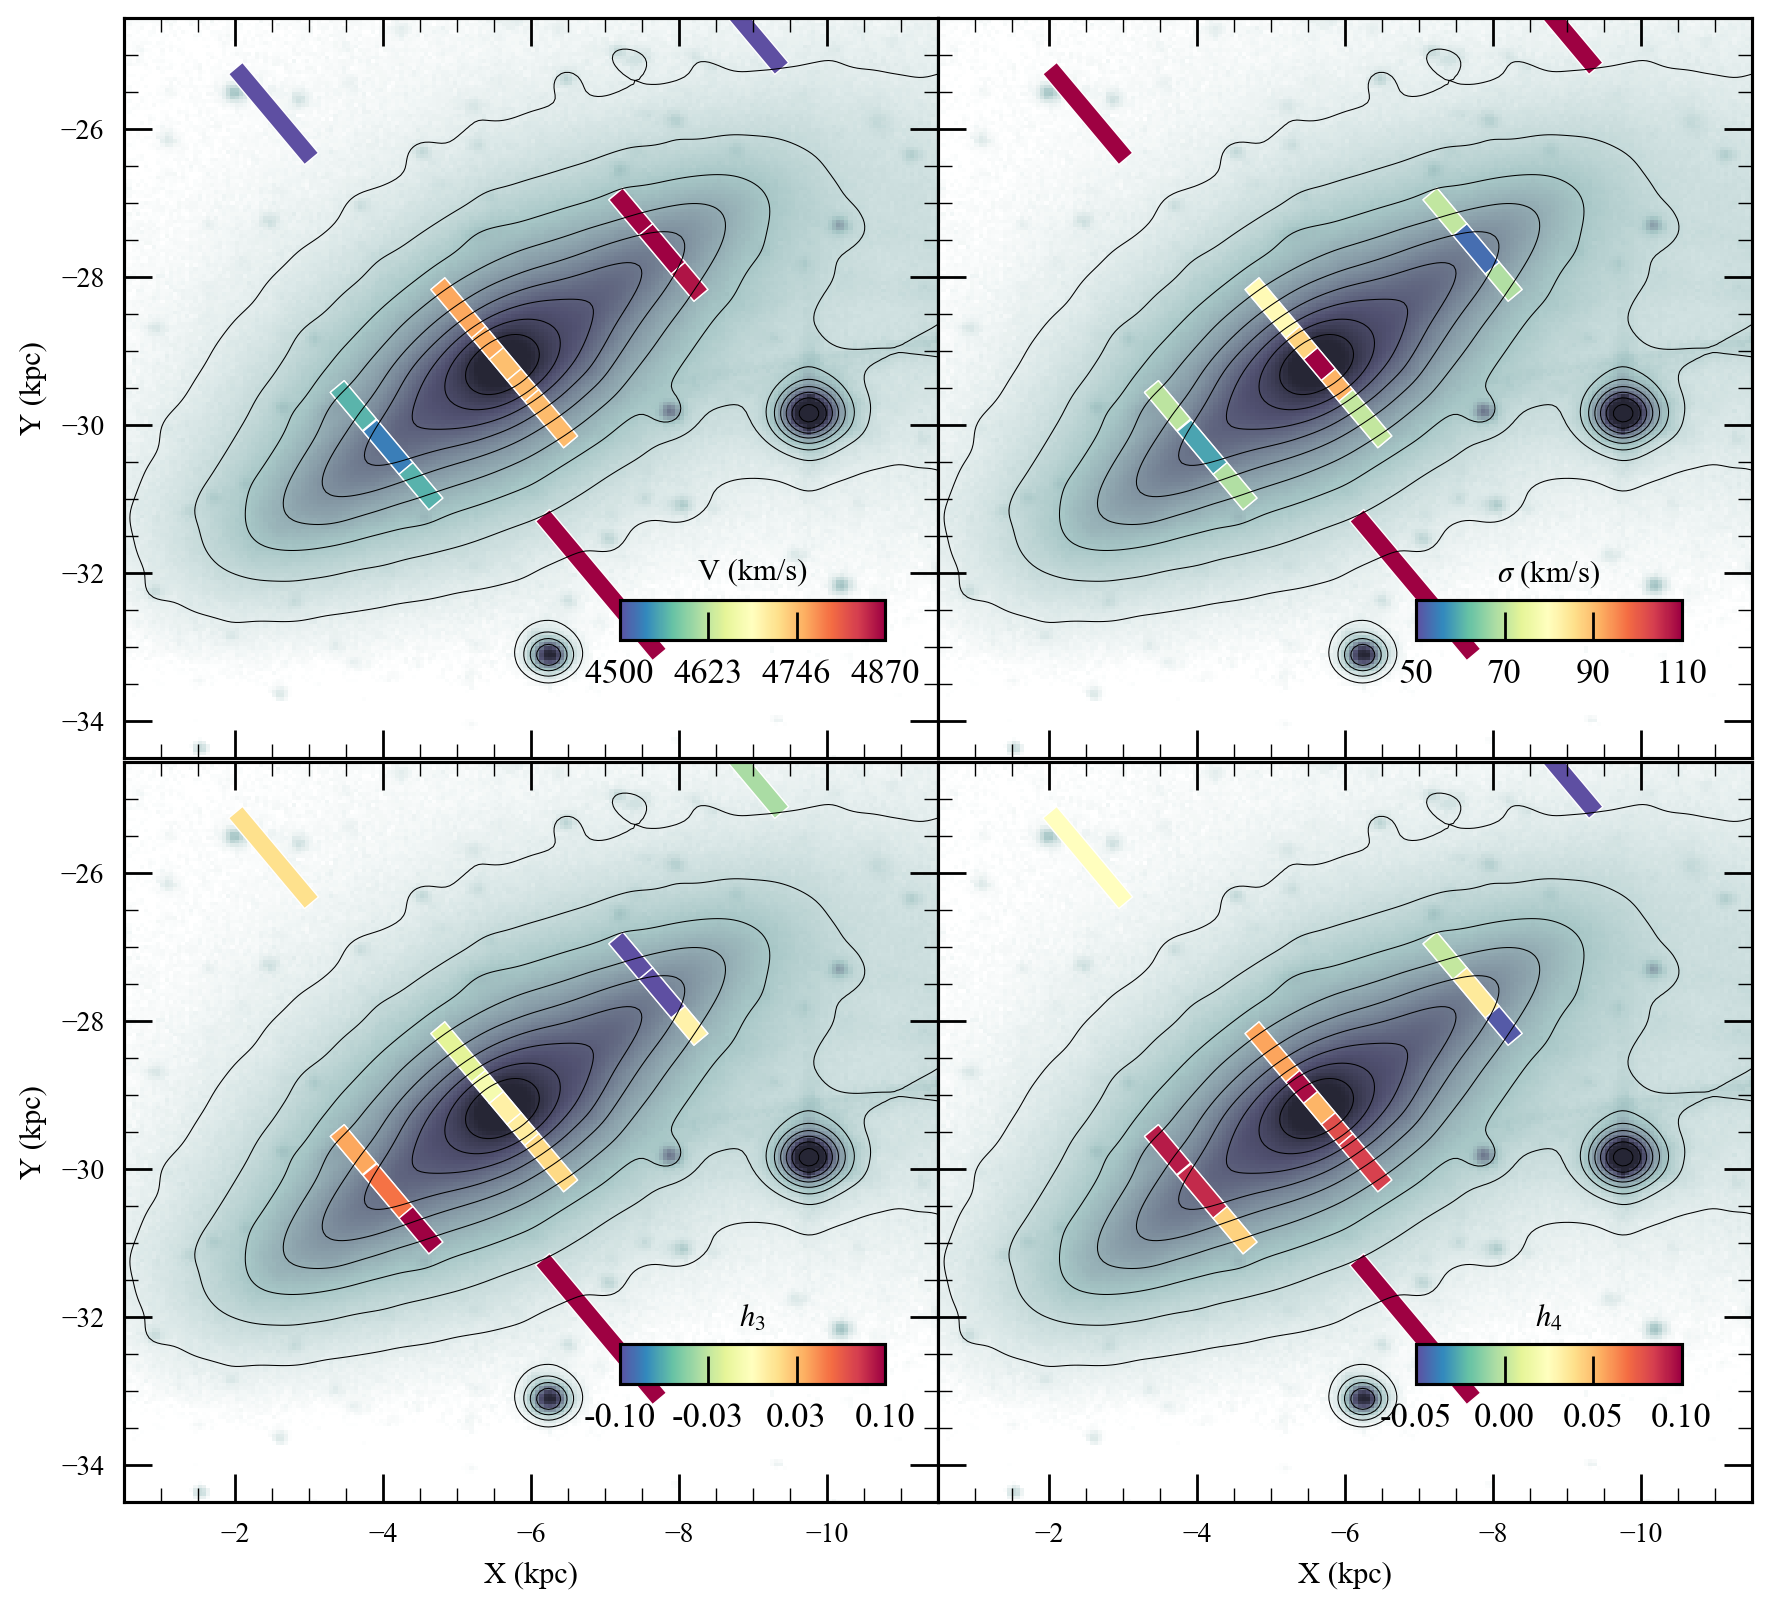
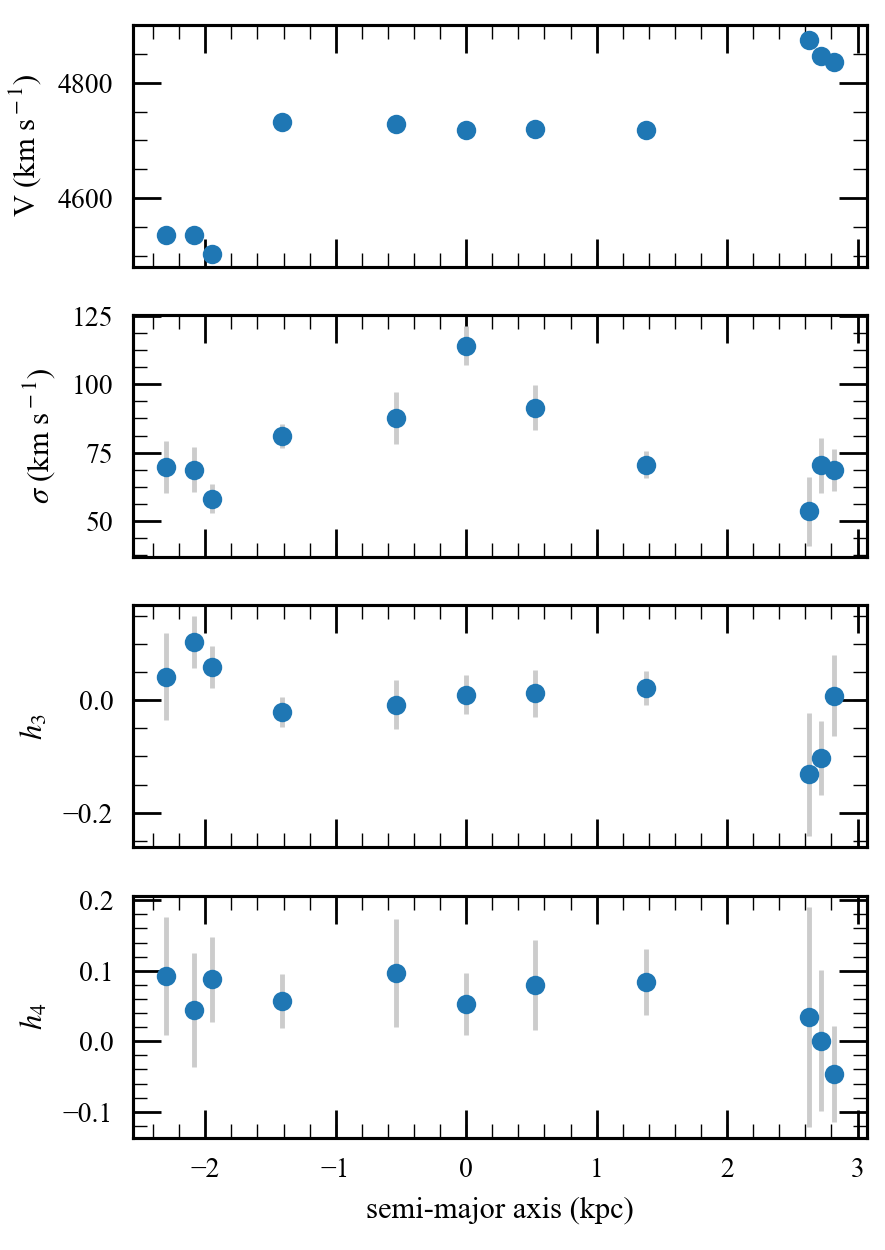
Beyond a galactocentric distance of 10 kpc from NGC 3311 the velocity field gets inhomogeneous, that is it varies with position angle. Regions of high values are found around NGC 3309 (4095 km s-1) and HCC 007 (4760 km s-1), which is expected due to their higher systemic velocities (see open orange symbols in Fig. 6). It is interesting to note that around HCC 007 there seems to exist a velocity gradient with lower velocities towards NGC 3311 and larger ones away from it (see black line bottom panel of Fig. 9). The galaxy HCC 007 itself shows a clear rotation signal with receding velocities on its east side and approaching velocities on the West (see Figures 17 and 18).
The (south-)eastern halo (70PA180o) of NGC 3311 is dominated by low radial velocities (see left middle panels in Fig. 6 and black dots in the middle panels of Fig.9). Towards the North-East, in the region of the excess halo light, velocities scatter quite a lot from slit to slit around NGC 3311’s systemic velocity (see the left top and bottom panels of Fig. 6). In general, the velocities derived from previous long-slit work agree very well with our velocity map, once systematic offsets to the systemic velocity are corrected for (see left panels of Figs. 6 and 8). Indeed, the long-slit results at PA from Ventimiglia et al. (2010) show a systematic offset of 72 km s-1 (3778 km s-1 close to the centre) with respect to our measurements, whereas the central velocity of 3864 km s-1 measured by Richtler et al. (2011) is close to our measured value. For Figures 4, 5, 6, 8 and 9 we applied offsets of 72 km s-1 and 14 km s-1 to the long-slit velocities of Ventimiglia et al. and Richtler et al., respectively.
4.2 Line-of-sight velocity dispersion
The velocity dispersion () of NGC 3311 rapidly increases with galactocentric distance from 185 km s-1 at the centre (slit cen2_s32) to 500 km s-1 at 18 kpc (see Fig. 6). This was already noted by several previous works (e.g. Loubser et al. 2008; Ventimiglia et al. 2010; Richtler et al. 2011). However, the rising profile varies for different position angles (see Figures 6 and 10), meaning that there exist small scale variations of the local velocity dispersion. This also explains the apparent discrepancies in the profiles obtained from the previous long-slit works (see Figure 4 in Richtler et al. 2011). These differences vanish when looking at the complete 2-dimensional distribution. The long-slit results from Ventimiglia et al. and Richtler et al. are both consistent with our work.
The regions of highest velocity dispersions are towards the North-East and east of NGC 3311 and in the South next to the lenticular galaxy HCC 007 (at PA, see bottom right panel of Fig. 6). These regions coincide with the offset envelope and sub-structure from disrupting dwarf galaxies in the Hydra I cluster core, as reported by Arnaboldi et al. (2012). This is also seen in Fig. 10, where outside a radius of 10 kpc the average velocity dispersion is higher on the semi-major axis towards North-East (PA108o) than towards South-West (PA288o). The same is true for the directions East and South-East, although the opposite directions are dominated by the low-velocity dispersion light of NGC 3309 (see orange circles in the right panels of Figures 6 and 8). The high velocity dispersion east of HCC 007 is probably caused by the superposition of the galaxy’s stellar population at high radial velocity (see Fig. 17) with that of NGC 3311’s stellar halo at lower radial velocities.
Low velocity dispersion regions are those around the giant elliptical NGC 3309 (200 km s-1) and HCC 007 (80 km s-1), which dominate the light in those slits. Curiously, also towards the North-East (0PA45o) there exists a region of relatively low velocity dispersions with 250-280 km s-1 (see Figs. 4 and 5. One might speculate whether the light in those slits is dominated by the pure stellar halo of NGC 3311 or rather cold sub-structure in the displaced halo region.
We also calculate the second order moment of velocity as the root mean square velocity:
| (1) |
where is defined as . Velocity dispersion and are shown in comparison in Fig. 12 (upper panel). The differences are negligible below 25 kpc and still small beyond that radius because is generally low. We also note that, In the case of NGC 3311, cannot be interpreted as a measure of angular momentum (rotation) but describes a velocity bias, since the galaxy itself is displaced in space and velocity from the core of the galaxy cluster (e.g. Barbosa et al. 2018). Thus cannot be applied to our simple dynamical modelling. We, therefore, take the velocity dispersion values for our dynamical analysis in Sect. 5.3.
4.3 Significance of velocity and dispersion scatter
In the sections before we claim to see evidence for an intrinsic scatter in the radial velocities and velocity dispersions distributions for galactocentric radii kpc. In order to evaluate the significance of this intrinsic scatter we statistically compare the distribution of and values in the radial range kpc with those of five million Monte Carlo realisations that are based on measurement uncertainties only. For this analysis, we use our error selected sample from Figures 6 to 10 and exclude data points near NGC 3309 and HCC 007.
We use the Anderson-Darling test implemented in the python package scipy.stats based on Scholz & Stephens (1987) for the comparison. This test has been shown to perform better than the usually widely used Kolmogorov-Smirnov test (e.g Razali & Wahi 2011) since it is more sensitive to the differences in the wings of the distributions. We test the null hypothesis that the distribution and scatter of points is purely caused by measurement errors via this procedure:
Firstly, we define the observed distribution of points as function of radius as our ‘reference sample’. Then, the null hypothesis sample, called ‘comparison sample’, is created from the reference sample by assigning a de-trended mean value to each measurement and adding to it randomly generated gaussian scatter based on its measured uncertainty. The de-trending is done by an error weighted least square fit to the data.
Secondly, the two distributions are compared via the Anderson-Darling test. If the observed distribution is caused purely by uncertainties then the comparison sample should be statistically the same as the reference sample. To get the likelihood of how often the comparison sample resembles the observed distribution we generate the comparison sample five million times and obtain -value distribution of the Anderson-Darling tests. We compute the probability of the -value being smaller or equal to , which is significance level that is usually assumed as a statistically significant difference between two distributions. This takes into account the small number statistics and the observation uncertainties.
Finally, we compute the significance of the deviation in terms of sigma, assuming a gaussian distribution.
In Fig. 11 we show the results of our tests for the distribution of velocity dispersions in the radial range 10 to 40 kpc from NGC 3311. The left plot shows the distribution of the de-trended reference (observed) sample and the average distribution of five million realisations of the (simulated) comparison sample, The right plot shows the distribution of five million -values from the Anderson-Darling test, with the vertical line indicating the significance level. The low probabilities that both distributions are equal translate into a significance of 5.1 that the observed scatter of the distribution is intrinsic and cannot be explained by the observational errors alone. Restricting the radial range to 10-20, 10-30 or 15-40 kpc also results in significant intrinsic velocity dispersion scatter with -values of 3.4, 4.6 and 3.3, respectively.

Analogous tests for the distribution of radial velocities lead to a 4.8 significance of an intrinsic scatter in the velocity distribution. Restricting the velocity sample to the east side of NGC 3311, the region that is not influenced by NGC 3309 and HCC 007, still results in a significance of 3.1 , despite a lower number statistics of data points.
4.4 Higher moments of the line-of-sight velocity distribution
The higher moments (skewness) and (kurtosis) of the line-of-sight velocity distribution are useful quantities in the case of a relaxed dynamical system. In a pressure supported system with negligible rotation and no orbital anisotropies both moments should have values around zero.
As can be seen in Figures 5 and 7 scatters mostly around zero, in particular in the central 10 kpc around NGC 3311. In the north-east region of the displaced halo tends to scatter to negative values (see left top and bottom panels of Fig. 7 for 20 kpc and 20 kpc, respectively). It is also mostly negative around NGC 3309 (see left second panel from top in Fig. 7, negative spatial axis). That means that the LOSVD has an extended tail towards lower velocities. In the case of NGC 3309 this is probably due to a contribution of NGC 3311’s halo light to the dominating stellar populations of NGC 3309 itself, which has a higher radial LOS velocity than NGC 3311. In the displaced halo region and east of NGC 3311, radial velocities scatter towards lower values than the systemic velocity of NGC 3311 (see Fig. 6), in agreement with a negative value. Part of the displaced halo light and dwarf galaxy tidal tails seem to be dominated by low-radial velocity stellar populations.
The moment is, with a few exceptions, always positive (see Figures 5 and 7). At face value this points to radially biased orbits all around NGC 3311. However, this interpretation is most probably not correct, since there is a lot of sub-structure in the stellar halo of NGC 3311. Thus, we might rather see the superposition of LOSVDs from these different sub-structures, as we have also argued in Barbosa et al. (2018).
The and values around HCC 007 are interesting. They show the typical pattern of negative to positive values on both sides of a rotating galaxy (see Fig. 17). Even in the wider environment seems to show a gradient from negative to positive values with increasing distance from NGC 3311 (see lower left panel in Fig. 7).
4.5 Rotation measure and angular momentum parameter
The rotation measure and the projected specific angular momentum parameter (Emsellem et al. 2007) are useful quantities to examine the dynamical status of a galaxy and to kinematically classify early-type galaxies (e.g. Cappellari et al. 2007).
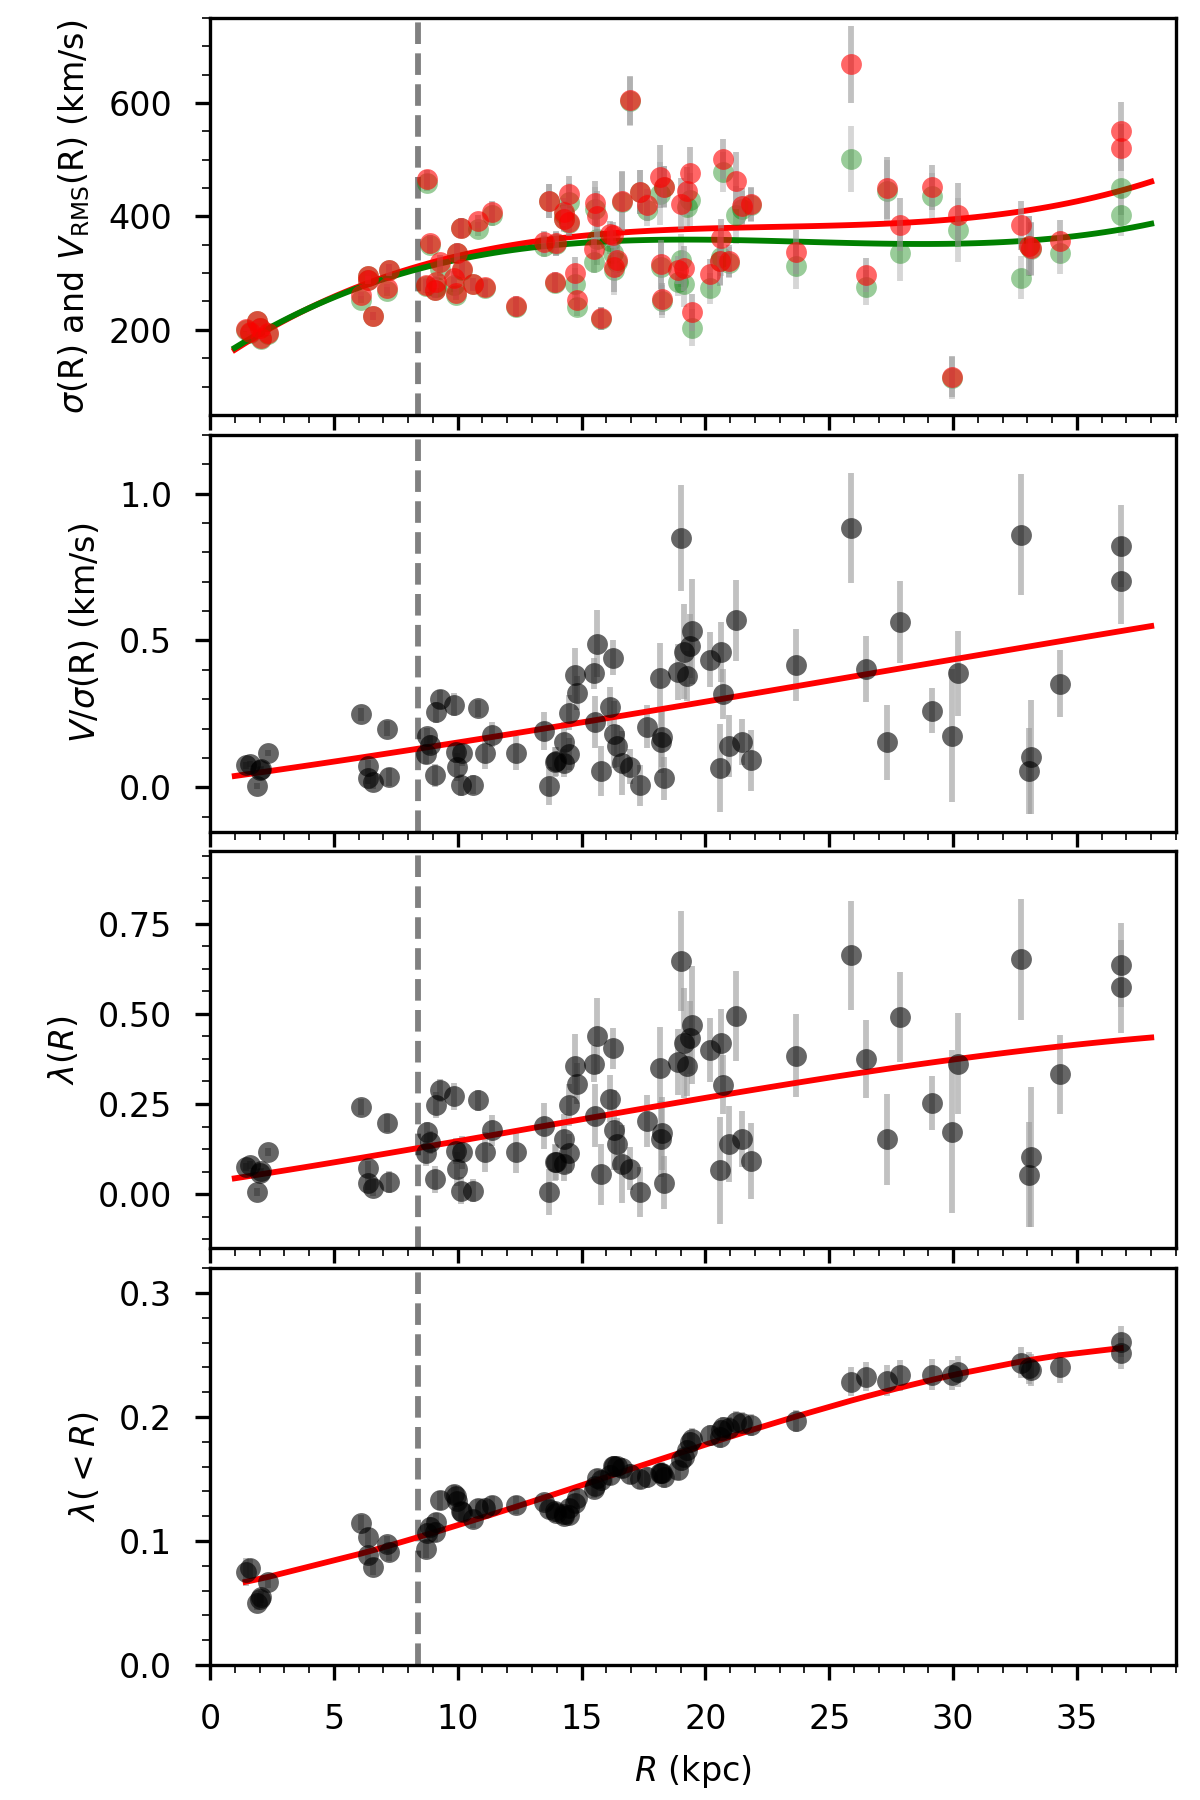
In our case, we calculate for each Voronoi bin/slit individually and evaluate its trend with galactocentric distance to NGC 3311. is defined as and is the average of the line-of-sight velocity dispersion in the respective bin.
For , we calculate the local angular momentum parameter as
| (2) |
and the cumulative angular momentum parameter within a certain radius around NGC 3311 as
| (3) |
where the data are ordered with increasing projected distance to NGC 3311 and the flux is approximated by the value of the spectrum in the corresponding slit (see Table LABEL:tab:kinematics).
The results are shown in Fig. 12 where we plot , and (from top to bottom) as function of galactocentric distance from NGC 3311. We excluded from this plot (and the calculation of ) the slits around NGC 3309 and those of HCC 007 (open orange symbols in Fig. 6), since we are only interested in the dynamical properties of the central galaxy. Also, we restricted our dataset to measurements with a velocity dispersion error lower than 60 km s-1.
At basically all radii the stellar halo of NGC 3311 is dispersion dominated (). Within the effective radius of 8.4 kpc (vertical dashed line), , beyond this point it shows a larger scatter and its average value (red curve) increases to , on average, at 35 kpc distance. Pota et al. (2013) reported for NGC 3311, derived from the kinematics of 116 ultra-compact dwarf galaxies and bright globular clusters from Misgeld et al. (2011). This low value is in general agreement with the stellar halo data, although the small sample of very massive GCs (some of them probably being UCDs) might give a rather biased view of the typical halo population around NGC 3311.
shows a similar behaviour as , with an increasing scatter at larger distances. The cumulative global angular momentum is very low within the effective radius. At it reaches a value of . This is in the regime of slow rotators (Emsellem et al. 2007) and typical for central cluster galaxies with a small ellipticity ( Arnaboldi et al. 2012). The steady increase of to 0.26 at 35 kpc shows that there might be some angular momentum present in the outskirts of NGC 3311. We will discuss this in the following section.
4.6 Comparison with other central cluster galaxies
Searching the literature for similarities with NGC 3311, one searches for a nearby and rather low-mass central galaxy with two-dimensional velocity field which shows a strongly rising velocity dispersion profile. While some mild counterparts may be identified, very similar objects are rare.
The MASSIVE survey targets the 100 most massive early-type galaxies () within a distance of 108 Mpc with IFU spectroscopy (Ma et al. 2014). 65 of them are brightest group galaxies (BGGs) and a few are brightest cluster galaxies (BCGs). Veale et al. (2017) presented the kinematics of 41 galaxies from the MASSIVE survey. 80% of them are slow or non-rotators. The 12 most luminous galaxies in that sample are BGGs. Out to 20-25 kpc (or 2-3 effective radii), they show rising or nearly flat velocity dispersion profiles from central values of km s-1 to km s-1, similar to the values of NGC 3311 at the same distance. But it is is not clear what is their kinematical behaviour outside 2-3 effective radii, where the velocity dispersion profile of NGC 3331 is rising to the level of 500 km s-1 in its outer halo. Galaxies with a mildly rising velocity dispersion profiles are NGC 1129 and NGC 7242. However, it is striking that some galaxies show a large scatter in their dispersion profile (NGC 3158, NGC 507, NGC 1016), indicating that Jeans models with one Jeans equation only (unique density profile, anisotropy, etc.) may not be appropriate.
Also other kinematical studies of massive galaxies are consistent with the occurrence of flat and rising velocity dispersion profiles (Carter et al. 1999; Kelson et al. 2002; Loubser et al. 2008; Coccato et al. 2009; Pota et al. 2013; Forbes et al. 2016). Loubser et al. (2008) presented radial profiles for the line-of-sight velocity and velocity dispersion from long-slit observations of 41 BCGs, most of which they classify as dispersion supported, and which also show a variety of dispersion profile shapes, with a fair fraction of galaxies with flat or rising dispersion profiles, although not with the same amplitude of 600 km s-1 as for NGC 3311.
Newman et al. (2011) find the BCG in A383 to exhibit a steeply rising dispersion profile that climbs from 270 km s-1 at the centre of the galaxy to 500 km s-1 22 kpc, a similar behaviour as for NGC 3311. Forbes et al. (2016) compared 24 early-type galaxies from the SLUGGS survey to the assembly classes of galaxy simulations by Naab et al. (2014, see also Sect. 4.7). They assign 6 galaxies to the classes C, E and F, which are the most appropriate to describe a massive, central slow rotating galaxy. In therms of the high-order moments and , the kinematic properties of NGC 5846, a central group galaxy, seems to show most similarity to NGC 3311, followed by NGC 4374 and 4365, although their velocity dispersion profiles are not rising but are rather flat.
Positive values at all radii have also been found for the three BCGs NGC 6166, 6173 and 6086 in the study of Carter et al. (1999) . Also most galaxies in the MASSIVE survey show positive average values (Veale et al. 2017). Positive values generally indicate a bias towards radial orbits (Gerhard 1993; Rix et al. 1997; Gerhard et al. 1998). Since stays nearly constant at a value of at all radii, the increase in velocity dispersion is not associated with a change in velocity anisotropy towards tangential orbits. It rather reflects an increasing mass-to-light ratio, and thus a massive dark halo.
The lack of a significant rotation signal for NGC 3311 is consistent with the view that most BCGs are slow rotators, mostly due to their build-up from multiple (dry) mergers. In a VIMOS IFU study of 10 BCGs at redshift with masses Jimmy et al. (2013) found that 70% are slow rotators, and above all BCGs are slow rotators. The steadily increasing cumulative angular momentum profile of NGC 3311 lies above most radial profiles of BCGs from the MASSIVE survey (Veale et al. 2017).
The probably two best studied cases of central galaxies with rising velocity dispersion profiles in their outer halo that are similar to NGC 3311 are M87 in the Virgo cluster and NGC 6166 in Abell 2199. Murphy et al. (2014) measured the line-of-sight velocity distribution from integrated stellar light at two points in the outer halo of M87. They found a rising velocity dispersion up to 577 km s-1, but argue that there is evidence for two kinematically distinct stellar components. They conclude that the asymmetry seen in the velocity profiles suggests that the stellar halo of M87 is not in a relaxed state and complicates a clean dynamical interpretation. For NGC 6166 we predict a similar complex velocity dispersion field as found for NGC 3311.
4.7 Results in context of cosmological simulations
The growth of massive early-type galaxies appears to happen in two main phases. The early mass assembly (26) is dominated by significant gas inflows (e.g. Kereš et al. 2005; Dekel et al. 2009) and the in situ formation of stars. The late evolution is dominated by the assembly of stars which have formed in other galaxies and have then been accreted via interactions or mergers on to the central galaxy at lower redshifts (01) (e.g. Meza et al. 2003; Naab et al. 2007).
The cosmological simulations of this two-phase galaxy formation process by Oser et al. (2010) predict that the present day masses of very massive galaxies is dominated at the level of 80% by accretion and merging since redshift . Also Rodriguez-Gomez et al. (2016) showed, using the Illustris simulations, that 80% of the stars in very massive galaxies () are born ex situ and then were accreted onto the galaxies via mergers. This means that the outer stellar dynamics of a central massive galaxy are dominated by the orbits of accreted material. In particular, minor mergers of galaxies embedded in massive dark matter halos provide a mechanism for explaining radially biased velocity dispersions at large radii (Hilz et al. 2012). Also cosmic zoom simulations of massive galaxies (Wu et al. 2014) show that massive galaxies with a large fraction of accreted stars have radially anisotropic velocity distributions outside the effective radius.
Naab et al. (2014) presented a two-dimensional dynamical analysis of a sample of 44 cosmological hydrodynamical simulations of individual central galaxies up to 610. They defined the classes A-F to characterise the different assembly histories. NGC 3311 is different than most types. If any, type C or F is closest to the properties of NGC 3311 (see Table 2 of Naab et al.): map feature is a dispersion dip, no correlation of with .
Groenewald et al. (2017) investigated the mass growth of BCGs since redshift . They found an increasing pair fraction, with decreasing redshift, which they interpret as an increasing merger fraction. The mass growth via accretion from close pairs is % since . Most of this mass is deposited into the intracluster light. NGC 3311 has the close pair NGC 3309. Although no direct interaction signs are seen in our data, it is plausible that some outer material of NGC 3309 has already been stripped off in the cluster potential and might contribute to the central cD halo in the future.
Ye et al. (2017) used the Illustris simulations to investigate the displacement and velocity bias of central galaxies with respect to their dark matter haloes. The central galaxy velocity bias can be explained by the close interactions between the central and satellite galaxies. A central velocity bias naturally leads to a small offset between the position of the central galaxy and the halo potential minimum (Guo et al. 2015). This scenario might explain the offset halo we see around NGC 3311.
5 Discussion
In Paper I, where we analysed the metallicity, [/Fe] abundances and ages of the stellar halo light around NGC 3311, we concluded that our findings can be explained by a two-phase galaxy formation scenario (e.g. Oser et al. 2010). The inner spheroid component (within 10 kpc) was probably formed in-situ in a rapid collapse very early-on, whereas the outer halo was accreted over a long timescale, a process that is still ongoing. Do we also see this in the kinematical features of the galaxy? Another important question is whether Jeans models are appropriate for constraining the mass profile when phase space is clumpy.
5.1 The velocity dispersion profile from stars to galaxies
Richtler et al. (2011) presented velocity dispersions of bright globular clusters around NGC 3311 and, in conjunction with long-slit data of the central galaxy population, constructed spherical Jeans models. Fig. 4 in Richtler et al. indicates a rising velocity dispersion, which may be understood as a class attribute of central cluster galaxies. A spherical Jeans model in conjunction with a unique tracer population demands a massive dark halo with a large core in order to explain the rising dispersion profile.
| Pop. | Distance | Ngal | ||
|---|---|---|---|---|
| (kpc) | (km s-1) | (km s-1) | ||
| (1) | (2) | (3) | (4) | (5) |
| s | 4.04 | 267 | 20 | |
| s | 5.12 | 288 | 20 | |
| s | 7.52 | 335 | 20 | |
| s | 10.50 | 380 | 20 | |
| s | 11.61 | 407 | 20 | |
| s | 12.90 | 416 | 20 | |
| s | 14.30 | 436 | 20 | |
| s | 16.90 | 454 | 20 | |
| s | 18.50 | 470 | 20 | |
| s | 20.20 | 484 | 20 | |
| s | 21.50 | 495 | 20 | |
| s | 23.80 | 515 | 20 | |
| s | 25.67 | 524 | 20 | |
| s | 28.07 | 540 | 20 | |
| s | 30.12 | 551 | 20 | |
| s | 31.92 | 554 | 20 | |
| gc | 13.900 | 535 | 70 | |
| gc | 31.3 | 567 | 71 | |
| gc | 38.30 | 650 | 77 | |
| gc | 52.20 | 732 | 97 | |
| gc | 55.70 | 707 | 89 | |
| gc | 97.50 | 807 | 107 | |
| gc | 195.00 | 703 | 94 | |
| gal | 150.00 | 697 | 79 | 39 |
| gal | 250.00 | 798 | 122 | 27 |
| gal | 350.00 | 664 | 73 | 41 |
| gal | 450.00 | 699 | 90 | 30 |
| gal | 550.00 | 725 | 82 | 43 |
| gal | 650.00 | 603 | 83 | 27 |
| gal | 750.00 | 1050 | 200 | 15 |
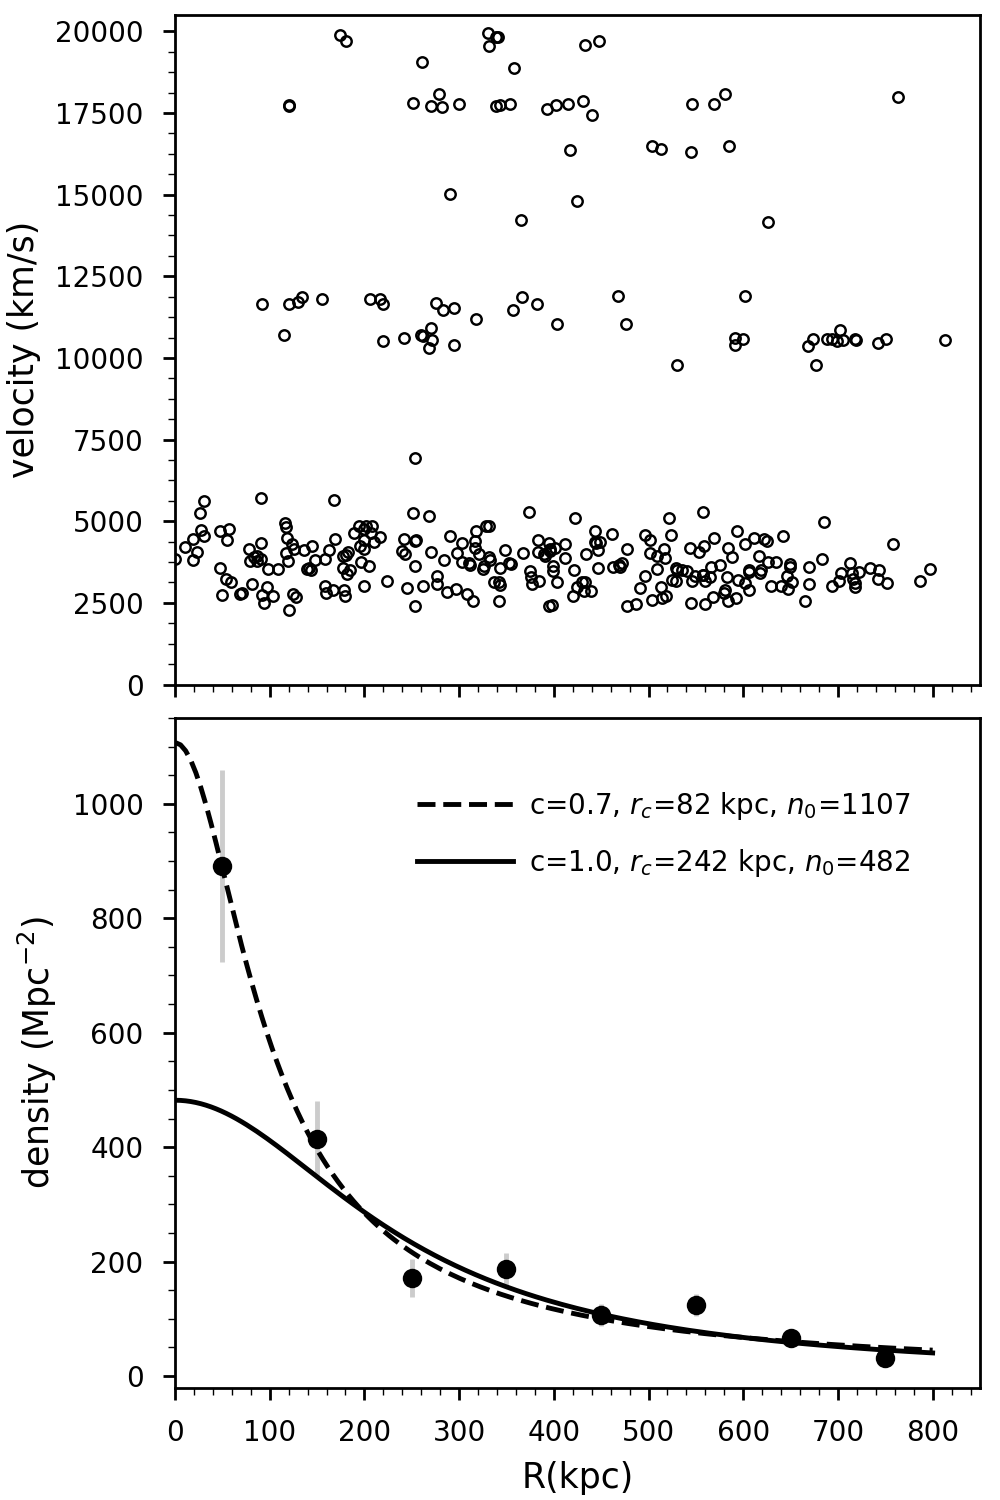
Because we want to discuss our results in the context of the entire cluster, including the galaxy population, Table 1 lists the relevant velocity dispersion values for the inner stellar population, the globular clusters, and the cluster galaxies. The first column indicates the population, the second the cluster-centric distance, the third and forth the velocity dispersion and its uncertainty, and the fifth column with the number of galaxies in the bin, as detailed below.
The quoted values for stars and globular clusters come from Richtler et al. (2011). The values for the galaxies have been derived in the following manner: we selected from the NASA Extragalactic Database all objects classified as galaxies within a radius of one degree around NGC 3311, corresponding to 885 kpc (there are hardly any objects outside), and end up with 638 galaxies. These galaxies are nicely stratified in redshift. The Hydra I members stand out clearly as the upper panel of Fig.13 shows (for readability only until 20000 km s-1 as the maximal radial velocity). We select Hydra I members as having radial velocities less than 6000 km s-1. This sample comprises 251 galaxies. We build 8 bins of widths 100 km s-1 and calculate the surface number density as shown in the lower panel of Fig. 13.
The surface number densities are fit by the modified Hubble profile
| (4) |
with as the core radius. Two fits, one skipping the innermost bin, are indicated. The important point is that the core radius is not well constrained. At larger cluster-centric distance it may assume values even above 300 kpc. This must be remembered when constructing Jeans models, because the core radius is related to the difference in the gravitational potential experienced by a tracer population: a small core radius means a small potential difference, a large core radius a large potential difference. For each bin we calculate the velocity dispersion applying the maximum likelihood velocity dispersion estimator and its uncertainty given by Djorgovski & Meylan (1993).
5.2 A MONDian model
The mass profiles of galaxy clusters argue for the existence of cluster dark matter even with the validity of Modified Newtonian Dynamics (MOND) (e.g. Milgrom 2015) and it is clear that a rising velocity dispersion in NGC 3311 strongly contradicts MONDian predictions at first sight. However, we find it interesting where MOND appears in our context. Therefore we briefly summarise how we calculate the MONDian circular velocity. Our technique is described, for example, for the case of NGC 4636 by Schuberth et al. (2006, 2012) and we refer the interested reader to these works.
Significant MONDian effects are expected, when the acceleration, , is smaller than the constant ( is the circular velocity and the galactocentric radius). The recipe for calculating the MONDian circular velocity from the Newtonian circular velocity in case of sphericity is
| (5) |
where the function interpolates between the Newtonian and the MONDian regime. We chose the ‘simple’ formula, , with .
We consider the baryonic mass profile as the sum of the stellar NGC 3311 mass profile and the X-ray mass after Hayakawa et al. (2006) which we compute as
| (6) |
with and 102 kpc. The MONDian circular velocity then follows as
| (7) |
The difference between the purely baryonic mass and the MONDian mass is called the ‘MONDian ghost halo’. The projected velocity dispersions are then calculated as in any Jeans model.
5.3 The velocity dispersions and comparison with models
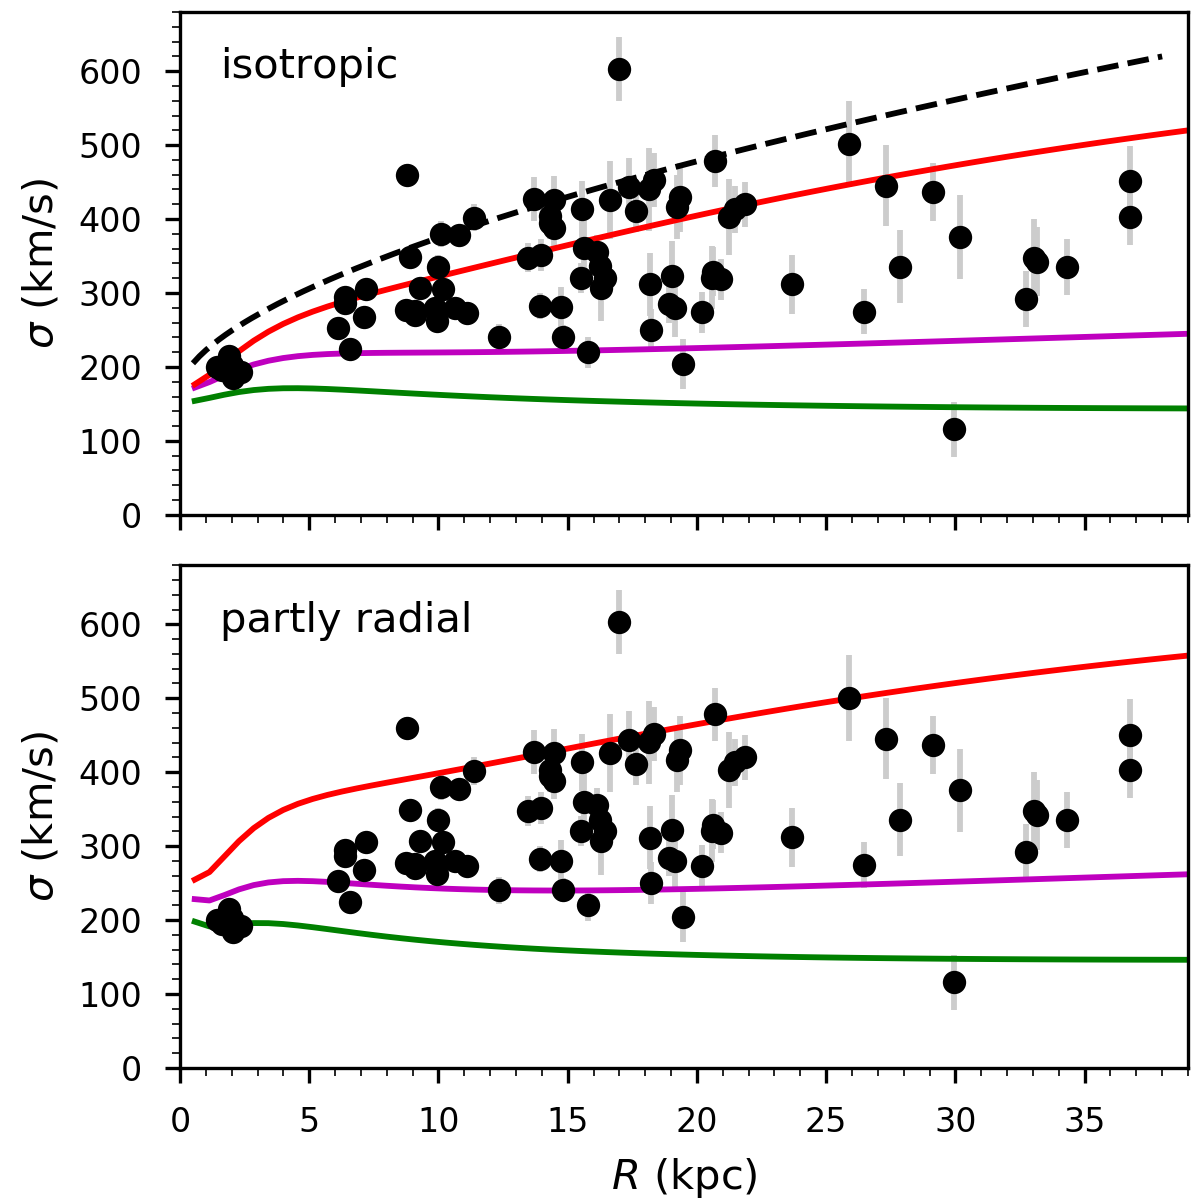
We want to argue with the help of Fig. 14 that the inference of a cored dark matter profile may provide only a partial description of the dynamical state of the system. The velocity field clearly depends on position angle, but the one-dimensional presentation of the profile shows a pattern that is easily overlooked in two-dimensional maps. The description of our measurements (including Richtler et al. 2011) is: within the inner 5 kpc, the dispersion rises from a central value of 170 km s-1 to 250 km s-1. That can be explained by the baryonic mass profile in conjunction with a small radial anisotropy. At radii larger than 5 kpc, the velocity dispersion is no longer a unique function of radius, but spreads out in some dispersion interval whose size increases with radius. This feature is already insinuated in Fig. 4 of Richtler et al. (2011). One notes that the upper and lower envelopes of this distribution are quite well defined. The lower envelope is constant at a velocity dispersion of 200 km s-1 and it traces remarkably well the MONDian prediction (see magenta curve in Fig. 14), with few exceptions. The upper envelope follows ( in kpc), [km s-1], with kpc (dashed line in Fig. 14). This also fits well the globular cluster velocity dispersions out to 100 kpc (see Fig. 15), which reaches maximum values of 800 km s-1. In both Figures (14 and 15) only data points with a velocity dispersion error smaller than 60 km s-1 have been considered.
Our central claim is that this scattered distribution of the velocity dispersion values can be explained by a large range of mass profiles, depending on the properties of the tracer populations. Fig. 14 (small scale) and Fig. 15 (large scale) illustrate this claim by showing two extreme models. Plotted are Jeans models using the stellar mass profile from Richtler et al. (2011). The surface brightness profile is
| (8) |
with, = 2.60210-8, = 1.76810-9, = 5″, = 50″, = . This has to be multiplied with the stellar ratio. Here we adopt 5.0 instead of 6.0 which better represents the central velocity dispersion. In the upper panel isotropic models are included while in the lower panel radially biased models are shown, where we adopt the anisotropy to be
| (9) |
(formula (60) of Mamon & Łokas 2005) with some small so that practically over the entire radius range.
Model 1 (red curve) is the sum of the stellar mass and the Burkert-halo of dark matter whose density profile is
| (10) |
with being the central density and a characteristic radius.
As a second reference model, we choose a model for MOdified Newtonian Dynamics (MOND) (magenta curve) (e.g. Milgrom 1984, 2014). The favoured mass model for NGC 3311 in Richtler et al. (2011) is clearly non-MONDian, but the new view onto the phenomenon on a rising velocity dispersion may not longer permit to see NGC 3311 as a clear-cut example for a galaxy that needs dark matter beyond the MONDian ghost halo.
Model 3 (green curve) is the stellar mass only, which we give for comparison.
5.4 Meaning of the velocity dispersion pattern
Within a spherical Jeans model, each coordinate communicates with all other coordinates by an infinite number of tracers following a uniform density profile. Here we have a different situation in that we obviously observe the transition from a small scale to a large scale potential that means different populations with different dynamical histories, their superposition and their projection. This transition will not be sudden, but smoothed out during the entire history of infall processes (e.g. see the properties of the phase space for BCGs in the simulations by Dolag et al. 2010).
At a given radius, the minimum velocity dispersion must describe an in situ population whose dynamics is not influenced by the cluster potential, but by the local distribution of mass, where contributions come from orbits within about 10-20 kpc. Quickly overlapping and becoming visible outwards of radius 10 kpc, one finds populations whose dynamical histories are progressively stronger linked to the large-scale cluster potential. The highest dispersion values must be caused by the largest potential differences and naturally elongated orbits. Because of the projection of radially varying fractions of different sub-populations (e.g. galactic stars, cD halo stars, intra-cluster stars) one also finds velocity dispersion values in between the minimum and the maximum dispersion values.
From these considerations, one would conclude that mass determinations based on Jeans-models with a single tracer population are in our case not appropriate. The actually observed projected line-of-sight velocity distribution is a superposition of several, maybe many, populations with different samplings of the galaxy and cluster potential, disturbing a ‘clean Jeans-world’.
5.5 An illustration for the scatter of velocity dispersions
Given the considerations above, the dark matter halo of Richtler et al. (2011) is an ingredient to fullfil the Jeans-equation for one given population.
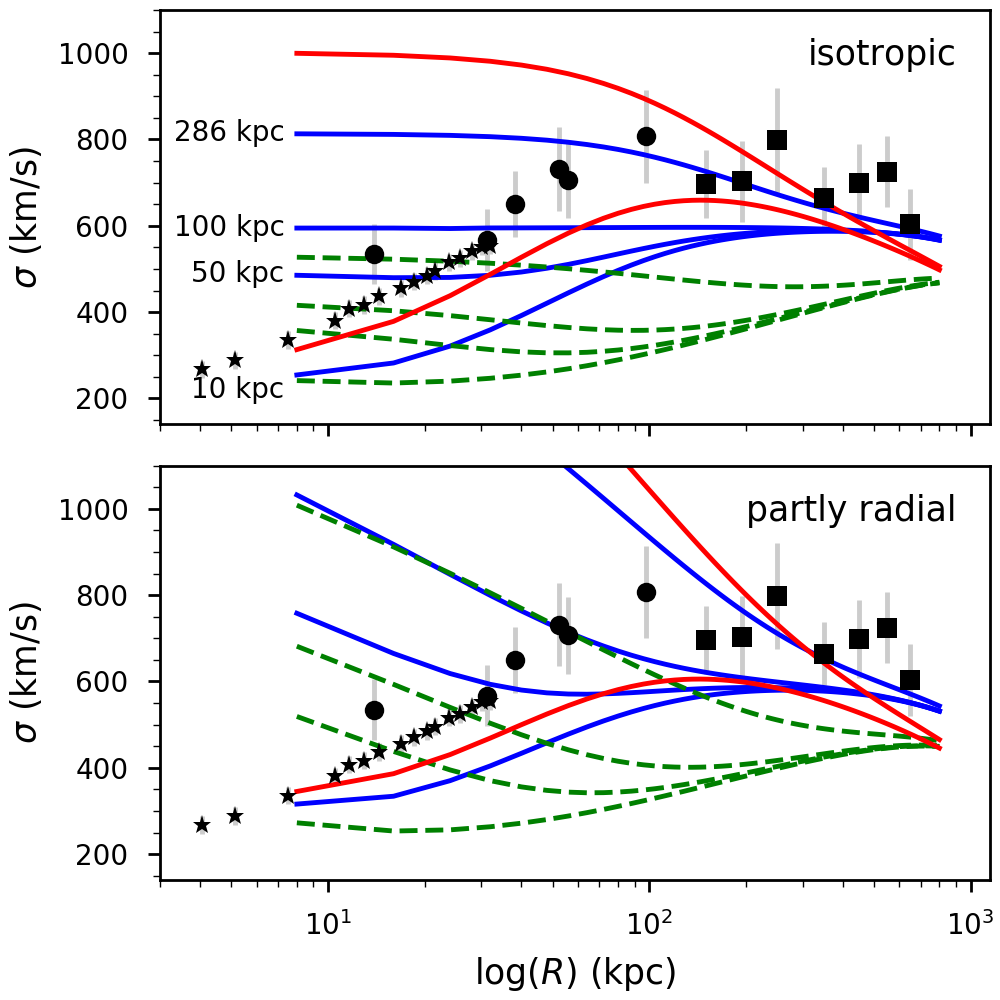
We assume that the projected density profiles of the inner stellar population and the cluster galaxies as the extreme populations can both be described by , where is the core radius. The size of then indicates the different potentials the populations are living in: a large core radius means that many objects with orbits with large ‘apocluster’ distances are sampled, a small core radius means that mainly the ‘local’ population is contributing. The core radius for the stellar population is 1.1 kpc. On the other hand, for the cluster galaxies a fit to the sample of Christlein & Zabludoff (2003) yields 286 kpc. Any other tracer population assumes values in between these extremes.
Fig. 15 illustrates this scenario by displaying the measurements from the centre to the cluster regime. We plot all available velocity dispersion measurements: asterisks are the upper envelope from Fig. 14, filled circles represent globular clusters from Richtler et al. (2011) and Misgeld et al. (2011), filled squares represent the galaxy sample from Christlein & Zabludoff (2003). We evaluated the velocity dispersions of the galaxies employing the dispersion estimator from Djorgovski & Meylan (1993).
One can see in Fig. 15 that beyond 40 kpc the upper envelope of the velocity dispersion of the stellar light smoothly blends into the rising velocity dispersion profile of globular clusters, reaching maximum values of 800 km s-1 at 100 kpc. Outside this radius, the velocity dispersion profile of cluster galaxies stays flat with high values between 600 and 800 km s-1 out to 700 kpc from the cluster centre. The upper panel in this figure shows isotropic models, the lower panel the same radial bias as in Fig. 14. The solid (blue) lines are models assuming as a mass profile the sum of the hydrodynamic X-ray mass profile and the stellar mass in order to have a good approximation for small radii, where the X-ray mass fails. The dashed (green) lines are MOND models. The four values in parsecs to the left of the upper panel correspond sequentially to the core radii. The red lines in both panels are the cored Burkert halos from Richtler et al. (2011) for the extreme core radii.
Even a mass profile like the one suggested by MOND may produce the full range of observed velocity dispersions, depending on the properties of the tracer population, which observationally are not directly accessible. The cored dark halo of Richtler et al. (2011) may owe its existence only to the assumption of a uniform density profile of the tracer population.
However, the cluster galaxy sample is not well described by the MOND models. A thorough discussion is beyond the scope of our paper, but we note that the classical assertion that galaxy clusters need dark matter even with the validity of MOND may merit further investigation. Galaxy clusters are anyway not in the deep MOND regime, but in the transition region where some arbitrariness regarding the exact behaviour exists (with the mass of Fig.15, the acceleration at 100 kpc is , at 1 Mpc ), with being the acceleration threshold in the MOND prescription (cm s-2).
Furthermore, we probably oversimplify the MONDian model by assuming a continuous mass distribution and neglecting galaxy interactions. In addition, we assume that the X-ray gas constitutes the entire baryon content. Finally, galaxy infall into a cluster does not start from zero velocity, but already with velocities corresponding to the large scale structure, that in turn must be studied under MOND conditions (Candlish 2016).
6 Conclusions and summary
NGC 3311 is the central galaxy in the Hydra I galaxy cluster. Previous work revealed much evidence for matter infall from the cluster environment from galactocentric radii of about 5-10 kpc outwards. As for other central galaxies, a globally photometrically distinct halo is not discernible, but the velocity dispersion of the stellar population, and at larger radii the velocity dispersion of globular clusters, rise from the central value of about 180 km s-1 to about 800 km s-1 characterising the cluster’s galaxy population. In the framework of Jeans models this behaviour is best explained by a large cored halo of dark matter. Seemingly conflicting long-slit measurements of the velocity dispersion caused the wish for a more complete measurements of the velocity field.
In order to find kinematic signatures of sub-structures around NGC 3311 we used FORS2 in MXU mode to mimic a coarse ‘IFU’. Our novel approach of placing short slits in an onion shell-like pattern around NGC 3311 allowed us to measure its 2D large-scale kinematics out to 4-5 effective radii (38 kpc). This is the first time that kinematic maps for a central galaxy are measured out to that radius.
These data show that the velocity field becomes inhomogeneous at about 10 kpc, slightly outside the effective radius of NGC 3311. The inner spheroid of NGC 3311 can be considered as a slow rotator. Only at larger radii the cumulative angular momentum is rising, however, without showing an ordered rotation signal. The increased angular momentum is probably due to the superposition of different kinematic components that constitute the system inner spheroid-galaxy halo-intracluster light (‘cD halo’) (Barbosa et al. 2018). Also the velocity dispersion field loses its inner homogeneity and varies as a function of radius and azimuthal angle, violating strict point symmetry.
Our results show that this complete spatial coverage is needed to avoid biases of radial kinematic profiles from long-slit data and to draw conclusions about the dynamical state of NGC 3311 and the mass of its dark matter halo. The conflict with earlier discrepant measurements finds its natural solution in the inhomogeneity of the kinematics as a function of the azimuth.
Folding all measurements into a radial coordinate, the velocity dispersion values lose their strict radial dependence at about 5-10 kpc. Instead they start to fill an area characterised by two well defined envelopes. The lower envelope is a constant value of 200 km s-1, fitting well to the MONDian expectation. The upper envelope can be written as, [km s-1] ( in kpc), which quite precisely connects the stars with the globular cluster population.
Given the infall processes, we interpret this behaviour as the superposition of various tracer populations. Tracer populations can probe strongly varying potential differences within the cluster depending on their spatial distribution. We explain the fact of a minimum and a maximum velocity dispersion at a given radius by a minimally concentrated population (the cluster galaxies) and a maximally concentrated population (the stars of NGC 3311’s inner spheroid). Between these extremes, all dispersion values are possible. In the transition zone we sample with increasing radius more and more radially biased populations with a shallow distribution. A long-slit average over all populations thus results in a rising velocity dispersion.
Under these circumstances, the potential cannot be precisely constrained except for the very inner region (where baryons dominate) and for the large scale galaxy potential. Previous statements about dark halos are probably not valid. We show with Jeans models that a range of mass profiles can generate all observed projected velocity dispersions depending on the core radius of their distribution. The MOND mass profile is also capable of producing the inner dispersion values, but fails in case of the cluster wide potential. We caution, however, that a more trustworthy test needs to be done in order to probe the formation of the galaxy cluster under MOND conditions.
With the increasing availability of large field IFUs more galaxies will be observed. We predict that the increasing scatter of dispersion values will emerge as a characteristic for those central galaxies with rising velocity dispersion profiles. The cored dark halo of Richtler et al. (2011) may owe its existence only to the assumption of a uniform density profile of the tracer population.
Acknowledgements.
We would like to thank the anonymous referee for his/her very valuable comments. Based on observations collected at the European Organisation for Astronomical Research in the Southern Hemisphere under ESO programme 088.B-0448(B). This research has made use of the NASA/IPAC Extragalactic Database (NED) which is operated by the Jet Propulsion Laboratory, California Institute of Technology, under contract with the National Aeronautics and Space Administration. T.R. acknowledges support from the BASAL Centro de Astrofísica y Tecnologias Afines (CATA) projects PFB-06/2007 and AFB-170002, and from FONDECYT project Nr. 1100620. T.R. thanks ESO/Garching for a science visitorship during May-September 2016. C.E.B and C.M.dO. thank the São Paulo Research Foundation (FAPESP) funding (grants 2011/21325-0, 2011/51680-6, 2012/22676-3 and 2016/12331-0).References
- Arnaboldi et al. (2012) Arnaboldi, M., Ventimiglia, G., Iodice, E., Gerhard, O., & Coccato, L. 2012, A&A, 545, A37
- Barbosa et al. (2018) Barbosa, C. E., Arnaboldi, M., Coccato, L., et al. 2018, A&A, 609, A78
- Barbosa et al. (2016) Barbosa, C. E., Arnaboldi, M., Coccato, L., et al. 2016, A&A, 589, A139
- Bender et al. (2015) Bender, R., Kormendy, J., Cornell, M. E., & Fisher, D. B. 2015, ApJ, 807, 56
- Candlish (2016) Candlish, G. N. 2016, MNRAS, 460, 2571
- Cappellari & Emsellem (2004) Cappellari, M. & Emsellem, E. 2004, PASP, 116, 138
- Cappellari et al. (2007) Cappellari, M., Emsellem, E., Bacon, R., et al. 2007, MNRAS, 379, 418
- Cappellari et al. (2013) Cappellari, M., McDermid, R. M., Alatalo, K., et al. 2013, MNRAS, 432, 1862
- Carter et al. (1999) Carter, D., Bridges, T. J., & Hau, G. K. T. 1999, MNRAS, 307, 131
- Castagné et al. (2012) Castagné, D., Soucail, G., Pointecouteau, E., et al. 2012, A&A, 548, A18
- Christlein & Zabludoff (2003) Christlein, D. & Zabludoff, A. I. 2003, ApJ, 591, 764
- Cleveland (1979) Cleveland, W. S. 1979, Journal of the American Statistical Association, 74, 829
- Coccato et al. (2009) Coccato, L., Gerhard, O., Arnaboldi, M., et al. 2009, MNRAS, 394, 1249
- Coccato et al. (2011) Coccato, L., Gerhard, O., Arnaboldi, M., & Ventimiglia, G. 2011, A&A, 533, A138
- Dekel et al. (2009) Dekel, A., Birnboim, Y., Engel, G., et al. 2009, Nature, 457, 451
- Djorgovski & Meylan (1993) Djorgovski, S. G. & Meylan, G., eds. 1993, Astronomical Society of the Pacific Conference Series, Vol. 50, Structure and dynamics of globular clusters
- Dolag et al. (2010) Dolag, K., Murante, G., & Borgani, S. 2010, MNRAS, 405, 1544
- Dressler (1979) Dressler, A. 1979, ApJ, 231, 659
- Emsellem et al. (2007) Emsellem, E., Cappellari, M., Krajnović, D., et al. 2007, MNRAS, 379, 401
- Forbes et al. (2016) Forbes, D. A., Romanowsky, A. J., Pastorello, N., et al. 2016, MNRAS, 457, 1242
- Gerhard et al. (1998) Gerhard, O., Jeske, G., Saglia, R. P., & Bender, R. 1998, MNRAS, 295, 197
- Gerhard (1993) Gerhard, O. E. 1993, MNRAS, 265, 213
- Groenewald et al. (2017) Groenewald, D. N., Skelton, R. E., Gilbank, D. G., & Loubser, S. I. 2017, MNRAS, 467, 4101
- Guo et al. (2015) Guo, H., Zheng, Z., Zehavi, I., et al. 2015, MNRAS, 446, 578
- Harris et al. (2017) Harris, W. E., Ciccone, S. M., Eadie, G. M., et al. 2017, ApJ, 835, 101
- Hayakawa et al. (2006) Hayakawa, A., Hoshino, A., Ishida, M., et al. 2006, PASJ, 58, 695
- Hilz et al. (2012) Hilz, M., Naab, T., Ostriker, J. P., et al. 2012, MNRAS, 425, 3119
- Jimmy et al. (2013) Jimmy, Tran, K.-V., Brough, S., et al. 2013, ApJ, 778, 171
- Kelson et al. (2002) Kelson, D. D., Zabludoff, A. I., Williams, K. A., et al. 2002, ApJ, 576, 720
- Kereš et al. (2005) Kereš, D., Katz, N., Weinberg, D. H., & Davé, R. 2005, MNRAS, 363, 2
- Kormendy & Djorgovski (1989) Kormendy, J. & Djorgovski, S. 1989, ARA&A, 27, 235
- Loubser et al. (2008) Loubser, S. I., Sansom, A. E., Sánchez-Blázquez, P., Soechting, I. K., & Bromage, G. E. 2008, MNRAS, 391, 1009
- Ma et al. (2014) Ma, C.-P., Greene, J. E., McConnell, N., et al. 2014, ApJ, 795, 158
- Mamon & Łokas (2005) Mamon, G. A. & Łokas, E. L. 2005, MNRAS, 363, 705
- Matthews et al. (1964) Matthews, T. A., Morgan, W. W., & Schmidt, M. 1964, ApJ, 140, 35
- Meza et al. (2003) Meza, A., Navarro, J. F., Steinmetz, M., & Eke, V. R. 2003, ApJ, 590, 619
- Milgrom (1984) Milgrom, M. 1984, ApJ, 287, 571
- Milgrom (2014) Milgrom, M. 2014, MNRAS, 437, 2531
- Milgrom (2015) Milgrom, M. 2015, MNRAS, 454, 3810
- Misgeld et al. (2011) Misgeld, I., Mieske, S., Hilker, M., et al. 2011, A&A, 531, A4
- Morgan & Lesh (1965) Morgan, W. W. & Lesh, J. R. 1965, ApJ, 142, 1364
- Murphy et al. (2014) Murphy, J. D., Gebhardt, K., & Cradit, M. 2014, ApJ, 785, 143
- Naab et al. (2007) Naab, T., Johansson, P. H., Ostriker, J. P., & Efstathiou, G. 2007, ApJ, 658, 710
- Naab et al. (2014) Naab, T., Oser, L., Emsellem, E., et al. 2014, MNRAS, 444, 3357
- Newman et al. (2011) Newman, A. B., Treu, T., Ellis, R. S., & Sand, D. J. 2011, ApJ, 728, L39
- Newman et al. (2013) Newman, A. B., Treu, T., Ellis, R. S., et al. 2013, ApJ, 765, 24
- Oemler (1976) Oemler, Jr., A. 1976, ApJ, 209, 693
- Oser et al. (2010) Oser, L., Ostriker, J. P., Naab, T., Johansson, P. H., & Burkert, A. 2010, ApJ, 725, 2312
- Pota et al. (2013) Pota, V., Forbes, D. A., Romanowsky, A. J., et al. 2013, MNRAS, 428, 389
- Razali & Wahi (2011) Razali, M. & Wahi, Y. 2011, Power Comparisons of Shapiro-Wilk, Kolmogorov-Smirnov, Lilliefors and Anderson-Darling Tests, Vol. 2 (SAGE journals), 21–33
- Richtler et al. (2011) Richtler, T., Salinas, R., Misgeld, I., et al. 2011, A&A, 531, A119
- Rix et al. (1997) Rix, H.-W., de Zeeuw, P. T., Cretton, N., van der Marel, R. P., & Carollo, C. M. 1997, ApJ, 488, 702
- Rodriguez-Gomez et al. (2016) Rodriguez-Gomez, V., Pillepich, A., Sales, L. V., et al. 2016, MNRAS, 458, 2371
- Sánchez-Blázquez et al. (2006) Sánchez-Blázquez, P., Peletier, R. F., Jiménez-Vicente, J., et al. 2006, MNRAS, 371, 703
- Scholz & Stephens (1987) Scholz, F. W. & Stephens, M. A. 1987, Journal of the American Statistical Association, 82, 918
- Schombert (1987) Schombert, J. M. 1987, ApJS, 64, 643
- Schombert (1988) Schombert, J. M. 1988, ApJ, 328, 475
- Schuberth et al. (2006) Schuberth, Y., Richtler, T., Dirsch, B., et al. 2006, A&A, 459, 391
- Schuberth et al. (2012) Schuberth, Y., Richtler, T., Hilker, M., et al. 2012, A&A, 544, A115
- Tody (1993) Tody, D. 1993, in Astronomical Society of the Pacific Conference Series, Vol. 52, Astronomical Data Analysis Software and Systems II, ed. R. J. Hanisch, R. J. V. Brissenden, & J. Barnes, 173
- van Dokkum (2001) van Dokkum, P. G. 2001, PASP, 113, 1420
- van Dokkum et al. (2010) van Dokkum, P. G., Whitaker, K. E., Brammer, G., et al. 2010, ApJ, 709, 1018
- Vazdekis et al. (2010) Vazdekis, A., Sánchez-Blázquez, P., Falcón-Barroso, J., et al. 2010, MNRAS, 404, 1639
- Veale et al. (2017) Veale, M., Ma, C.-P., Thomas, J., et al. 2017, MNRAS, 464, 356
- Ventimiglia et al. (2008) Ventimiglia, G., Arnaboldi, M., & Gerhard, O. 2008, Astronomische Nachrichten, 329, 1057
- Ventimiglia et al. (2011) Ventimiglia, G., Arnaboldi, M., & Gerhard, O. 2011, A&A, 528, A24
- Ventimiglia et al. (2010) Ventimiglia, G., Gerhard, O., Arnaboldi, M., & Coccato, L. 2010, A&A, 520, L9
- Wehner et al. (2008) Wehner, E. M. H., Harris, W. E., Whitmore, B. C., Rothberg, B., & Woodley, K. A. 2008, ApJ, 681, 1233
- Wu et al. (2014) Wu, X., Gerhard, O., Naab, T., et al. 2014, MNRAS, 438, 2701
- Ye et al. (2017) Ye, J.-N., Guo, H., Zheng, Z., & Zehavi, I. 2017, ApJ, 841, 45
Appendix A Results table
landscape
| ID | RA | DEC | R | PA | S/N | adeg | mdeg | flag | ||||
|---|---|---|---|---|---|---|---|---|---|---|---|---|
| (J2000) | (J2000) | (kpc) | (o) | (km s-1) | (km s-1) | (Å-1) | ||||||
| (1) | (2) | (3) | (4) | (5) | (6) | (7) | (8) | (9) | (10) | (11) | (12) | (13) |
| cen1_s14a | 159h10m08.4s | -27d33m34.2s | 28.8 | 130.4 | 92.5 | 6 | 4 | 3 | ||||
| cen1_s14b | 159h10m04.8s | -27d33m36.4s | 29.6 | 130.9 | 54.7 | 6 | 4 | 3 | ||||
| cen1_s14c | 159h10m12.0s | -27d33m32.0s | 28.0 | 129.8 | 55.2 | 6 | 4 | 3 | ||||
| cen1_s18 | 159h09m43.2s | -27d32m33.4s | 19.2 | 111.3 | 14.3 | 6 | 4 | 1 | ||||
| cen1_s19 | 159h09m18.0s | -27d32m04.6s | 21.4 | 99.7 | 13.4 | 6 | 4 | 2 | ||||
| cen1_s20 | 159h10m01.2s | -27d32m24.7s | 14.5 | 108.0 | 19.1 | 6 | 4 | 1 | ||||
| cen1_s21 | 159h09m57.6s | -27d32m10.7s | 13.0 | 102.3 | 24.0 | 6 | 4 | 1 | ||||
| cen1_s23 | 159h10m01.2s | -27d31m56.6s | 10.6 | 96.3 | 46.9 | 6 | 4 | 1 | ||||
| cen1_s24 | 159h10m15.6s | -27d31m52.3s | 6.9 | 94.5 | 44.6 | 6 | 4 | 1 | ||||
| cen1_s25 | 159h10m01.2s | -27d31m34.3s | 10.2 | 86.7 | 52.1 | 6 | 4 | 1 | ||||
| cen1_s26 | 159h10m15.6s | -27d31m35.8s | 6.6 | 87.3 | 73.7 | 6 | 4 | 1 | ||||
| cen1_s27 | 159h10m33.6s | -27d31m42.2s | 2.0 | 90.1 | 131.1 | 6 | 4 | 1 | ||||
| cen1_s28 | 159h10m08.4s | -27d31m16.7s | 10.3 | 79.1 | 41.2 | 6 | 4 | 1 | ||||
| cen1_s29 | 159h10m48.0s | -27d31m34.7s | 2.3 | 86.8 | 120.6 | 6 | 4 | 1 | ||||
| cen1_s29a | 159h10m46.9s | -27d31m35.6s | 2.0 | 87.2 | 121.1 | 6 | 4 | 1 | ||||
| cen1_s29b | 159h10m49.1s | -27d31m33.7s | 2.7 | 86.4 | 113.3 | 6 | 4 | 1 | ||||
| cen1_s30 | 159h10m26.4s | -27d31m09.5s | 8.9 | 76.2 | 62.3 | 6 | 4 | 1 | ||||
| cen1_s31 | 159h10m48.0s | -27d31m17.4s | 6.2 | 79.4 | 63.2 | 6 | 4 | 1 | ||||
| cen1_s32 | 159h10m44.4s | -27d31m05.9s | 8.9 | 74.7 | 54.0 | 6 | 4 | 1 | ||||
| cen1_s33 | 159h11m02.4s | -27d31m10.6s | 9.2 | 76.6 | 63.5 | 6 | 4 | 1 | ||||
| cen1_s34 | 159h11m02.4s | -27d30m59.4s | 11.6 | 72.1 | 40.0 | 6 | 4 | 1 | ||||
| cen1_s35 | 159h10m58.8s | -27d30m47.5s | 14.0 | 67.6 | 33.4 | 6 | 4 | 1 | ||||
| cen1_s36 | 159h10m48.0s | -27d30m27.4s | 18.4 | 60.5 | 24.1 | 8 | 2 | 1 | ||||
| cen1_s37 | 159h11m31.2s | -27d30m49.7s | 17.7 | 68.4 | 21.7 | 6 | 4 | 1 | ||||
| cen2_s21 | 159h11m45.6s | -27d31m01.9s | 18.5 | 73.1 | 25.5 | 6 | 4 | 1 | ||||
| cen2_s22 | 159h11m45.6s | -27d31m12.7s | 17.2 | 77.5 | 24.0 | 6 | 4 | 1 | ||||
| cen2_s23 | 159h11m31.2s | -27d31m12.0s | 14.2 | 77.2 | 35.4 | 6 | 4 | 1 | ||||
| cen2_s25 | 159h11m24.0s | -27d31m24.2s | 11.2 | 82.3 | 42.3 | 6 | 4 | 1 | ||||
| cen2_s26 | 159h11m24.0s | -27d31m38.6s | 10.4 | 88.5 | 32.8 | 6 | 4 | 1 | ||||
| cen2_s27 | 159h11m09.6s | -27d31m36.5s | 6.9 | 87.6 | 67.8 | 6 | 4 | 1 | ||||
| cen2_s28 | 159h11m20.4s | -27d31m52.0s | 9.8 | 94.3 | 42.8 | 6 | 4 | 1 | ||||
| cen2_s29 | 159h11m06.0s | -27d31m48.4s | 6.1 | 92.8 | 68.8 | 6 | 4 | 1 | ||||
| cen2_s30 | 159h10m48.0s | -27d31m41.9s | 1.5 | 90.0 | 109.8 | 6 | 4 | 1 | ||||
| cen2_s31 | 159h11m13.2s | -27d32m06.4s | 9.8 | 100.5 | 24.4 | 6 | 4 | 1 | ||||
| cen2_s32 | 159h10m37.2s | -27d31m47.3s | 1.7 | 92.3 | 114.7 | 6 | 4 | 1 | ||||
| cen2_s32a | 159h10m36.2s | -27d31m48.1s | 2.0 | 92.6 | 113.8 | 6 | 4 | 1 | ||||
| cen2_s32b | 159h10m38.2s | -27d31m46.5s | 1.4 | 91.9 | 115.5 | 6 | 4 | 1 | ||||
| cen2_s33 | 159h11m02.4s | -27d32m13.2s | 9.2 | 103.3 | 37.6 | 6 | 4 | 1 | ||||
| cen2_s34 | 159h10m44.4s | -27d32m08.2s | 6.5 | 101.2 | 66.1 | 6 | 4 | 1 | ||||
| cen2_s35 | 159h10m44.4s | -27d32m18.2s | 8.9 | 105.4 | 37.7 | 6 | 4 | 1 | ||||
| cen2_s36 | 159h10m26.4s | -27d32m13.2s | 8.6 | 103.3 | 48.5 | 6 | 4 | 1 | ||||
| cen2_s37 | 159h10m30.0s | -27d32m24.7s | 10.9 | 108.0 | 27.8 | 6 | 4 | 1 | ||||
| cen2_s38 | 159h10m15.6s | -27d32m23.6s | 12.1 | 107.5 | 30.4 | 6 | 4 | 1 | ||||
| cen2_s39 | 159h10m22.8s | -27d32m41.3s | 15.3 | 114.2 | 16.6 | 6 | 4 | 1 | ||||
| cen2_s40 | 159h09m57.6s | -27d32m32.6s | 16.5 | 111.0 | 16.0 | 8 | 2 | 1 | ||||
| cen2_s45a | 159h10m26.4s | -27d33m45.0s | 30.5 | 133.0 | 86.5 | 6 | 4 | 3 | ||||
| cen2_s45b | 159h10m22.8s | -27d33m47.5s | 31.2 | 133.6 | 39.4 | 6 | 4 | 3 | ||||
| cen2_s45c | 159h10m30.0s | -27d33m42.5s | 29.8 | 132.4 | 44.4 | 6 | 4 | 3 | ||||
| inn1_s15 | 159h08m45.6s | -27d32m26.2s | 30.6 | 108.5 | – | – | 12.5 | 8 | 2 | 1 | ||
| inn1_s16 | 159h09m25.2s | -27d32m43.1s | 24.1 | 114.9 | 16.8 | 6 | 4 | 1 | ||||
| inn1_s17 | 159h09m39.6s | -27d32m40.6s | 21.0 | 113.9 | 15.0 | 6 | 4 | 1 | ||||
| inn1_s18 | 159h09m21.6s | -27d32m15.7s | 21.4 | 104.3 | 14.2 | 6 | 4 | 1 | ||||
| inn1_s19 | 159h09m39.6s | -27d32m19.3s | 17.8 | 105.8 | 18.7 | 6 | 4 | 1 | ||||
| inn1_s20 | 159h09m14.4s | -27d31m51.2s | 21.6 | 94.0 | 26.4 | 6 | 4 | 2 | ||||
| inn1_s21 | 159h09m36.0s | -27d31m57.0s | 16.6 | 96.5 | 29.1 | 6 | 4 | 1 | ||||
| inn1_s23 | 159h09m36.0s | -27d31m37.6s | 16.2 | 88.1 | 25.8 | 6 | 4 | 1 | ||||
| inn1_s24 | 159h09m39.6s | -27d31m26.4s | 15.8 | 83.3 | 18.2 | 6 | 4 | 1 | ||||
| inn1_s25 | 159h09m28.8s | -27d31m10.2s | 19.6 | 76.4 | 62.2 | 6 | 4 | 2 | ||||
| inn1_s26 | 159h09m46.8s | -27d31m12.4s | 15.4 | 77.3 | 29.1 | 6 | 4 | 1 | ||||
| inn1_s27 | 159h09m32.4s | -27d30m49.7s | 21.4 | 68.4 | 43.1 | 6 | 4 | 2 | ||||
| inn1_s28 | 159h10m01.2s | -27d30m58.0s | 14.7 | 71.5 | 29.2 | 6 | 4 | 1 | ||||
| inn1_s29 | 159h09m50.4s | -27d30m39.2s | 20.0 | 64.6 | 18.1 | 6 | 4 | 2 | ||||
| inn1_s30 | 159h10m19.2s | -27d30m47.9s | 14.4 | 67.7 | 29.0 | 6 | 4 | 1 | ||||
| inn1_s31 | 159h10m08.4s | -27d30m29.5s | 19.6 | 61.2 | 21.1 | 6 | 4 | 1 | ||||
| inn1_s32 | 159h10m44.4s | -27d30m44.6s | 14.1 | 66.5 | 43.9 | 6 | 4 | 1 | ||||
| inn1_s33 | 159h10m33.6s | -27d30m23.8s | 19.3 | 59.3 | 25.0 | 6 | 4 | 1 | ||||
| inn1_s34 | 159h11m16.8s | -27d30m45.4s | 16.4 | 66.8 | 30.5 | 6 | 4 | 1 | ||||
| inn1_s35 | 159h11m09.6s | -27d30m29.9s | 19.0 | 61.3 | 33.7 | 6 | 4 | 1 | ||||
| inn1_s36 | 159h11m38.4s | -27d30m37.8s | 21.0 | 64.1 | 25.2 | 6 | 4 | 1 | ||||
| inn1_s37 | 159h11m38.4s | -27d30m23.8s | 23.7 | 59.3 | 20.3 | 6 | 4 | 1 | ||||
| inn1_s39 | 159h12m00.0s | -27d30m08.6s | 29.9 | 54.7 | 19.9 | 6 | 4 | 1 | ||||
| inn2_s18 | 159h11m52.8s | -27d30m49.7s | 21.7 | 68.4 | 22.6 | 6 | 4 | 1 | ||||
| inn2_s19 | 159h12m00.0s | -27d31m05.5s | 21.2 | 74.5 | 17.7 | 8 | 2 | 1 | ||||
| inn2_s20 | 159h11m38.4s | -27d31m01.6s | 17.1 | 73.0 | 30.3 | 6 | 4 | 1 | ||||
| inn2_s21 | 159h12m07.2s | -27d31m34.0s | 21.1 | 86.5 | 17.5 | 6 | 4 | 1 | ||||
| inn2_s22 | 159h11m45.6s | -27d31m28.6s | 16.0 | 84.2 | 20.8 | 6 | 4 | 1 | ||||
| inn2_s23 | 159h12m07.2s | -27d31m55.2s | 21.2 | 95.7 | 13.3 | 6 | 4 | 1 | ||||
| inn2_s24 | 159h11m45.6s | -27d31m53.4s | 15.9 | 94.9 | 18.6 | 8 | 2 | 1 | ||||
| inn2_s25 | 159h12m00.0s | -27d32m13.9s | 20.7 | 103.6 | 14.8 | 6 | 4 | 1 | ||||
| inn2_s26 | 159h11m38.4s | -27d32m09.6s | 15.5 | 101.8 | 20.7 | 6 | 4 | 1 | ||||
| inn2_s27 | 159h11m45.6s | -27d32m30.1s | 19.6 | 110.0 | – | 13.8 | 6 | 4 | 1 | |||
| inn2_s28 | 159h11m20.4s | -27d32m25.8s | 14.3 | 108.4 | 27.6 | 6 | 4 | 1 | ||||
| inn2_s29 | 159h11m31.2s | -27d32m44.2s | 19.5 | 115.2 | 16.6 | 6 | 4 | 1 | ||||
| inn2_s30 | 159h11m02.4s | -27d32m35.5s | 14.1 | 112.1 | 27.3 | 6 | 4 | 1 | ||||
| inn2_s31 | 159h11m09.6s | -27d32m51.7s | 18.4 | 117.9 | 14.6 | 6 | 4 | 1 | ||||
| inn2_s32 | 159h10m37.2s | -27d32m37.0s | 13.6 | 112.6 | 24.7 | 6 | 4 | 1 | ||||
| inn2_s33 | 159h10m44.4s | -27d32m55.3s | 18.0 | 119.1 | 14.9 | 6 | 4 | 1 | ||||
| inn2_s34 | 159h10m08.4s | -27d32m39.5s | 16.4 | 113.6 | 20.0 | 6 | 4 | 1 | ||||
| inn2_s35 | 159h10m19.2s | -27d32m55.7s | 19.0 | 119.2 | 14.4 | 6 | 4 | 1 | ||||
| inn2_s36 | 159h09m54.0s | -27d32m46.7s | 19.8 | 116.1 | 18.7 | 6 | 4 | 1 | ||||
| inn2_s37 | 159h10m30.0s | -27d33m26.3s | 25.8 | 128.3 | – | 16.7 | 6 | 4 | 1 | |||
| inn2_s38 | 159h09m57.6s | -27d33m08.3s | 23.8 | 123.2 | – | – | 21.4 | 6 | 4 | 1 | ||
| inn2_s39a | 159h10m19.2s | -27d33m41.0s | 29.8 | 132.1 | 146.1 | 6 | 4 | 3 | ||||
| inn2_s39b | 159h10m15.6s | -27d33m42.1s | 30.2 | 132.3 | 175.8 | 6 | 4 | 3 | ||||
| inn2_s39c | 159h10m19.2s | -27d33m39.6s | 29.4 | 131.7 | 171.1 | 6 | 4 | 3 | ||||
| inn2_s39d | 159h10m15.6s | -27d33m44.3s | 30.7 | 132.8 | 110.5 | 6 | 4 | 3 | ||||
| inn2_s39e | 159h10m22.8s | -27d33m36.7s | 28.6 | 131.0 | 100.6 | 6 | 4 | 3 | ||||
| out1_s13 | 159h08m56.4s | -27d33m15.5s | 34.6 | 125.3 | 10.0 | 6 | 4 | 1 | ||||
| out1_s14 | 159h08m42.0s | -27d32m51.7s | 34.1 | 117.9 | 12.5 | 6 | 4 | 1 | ||||
| out1_s15 | 159h08m20.4s | -27d32m22.2s | 36.2 | 107.0 | 15.5 | 6 | 4 | 1 | ||||
| out1_s16 | 159h08m49.2s | -27d32m30.8s | 30.2 | 110.3 | 11.8 | 6 | 4 | 1 | ||||
| out1_s17 | 159h08m13.2s | -27d31m49.1s | 36.6 | 93.1 | 18.1 | 6 | 4 | 2 | ||||
| out1_s18 | 159h08m38.4s | -27d31m55.6s | 30.5 | 95.9 | 38.7 | 6 | 4 | 2 | ||||
| out1_s19 | 159h08m13.2s | -27d31m23.2s | 36.8 | 81.9 | 42.9 | 6 | 4 | 2 | ||||
| out1_s20 | 159h08m38.4s | -27d31m28.6s | 30.5 | 84.2 | 77.4 | 6 | 4 | 2 | ||||
| out1_s21 | 159h08m16.8s | -27d30m58.7s | 37.2 | 71.8 | 46.2 | 6 | 4 | 2 | ||||
| out1_s22 | 159h08m20.4s | -27d30m47.5s | 37.3 | 67.6 | 36.2 | 6 | 4 | 2 | ||||
| out1_s23 | 159h08m45.6s | -27d30m36.4s | 32.8 | 63.5 | 47.4 | 6 | 4 | 2 | ||||
| out1_s24 | 159h08m45.6s | -27d30m15.5s | 35.6 | 56.7 | 18.3 | 6 | 4 | 2 | ||||
| out1_s25 | 159h09m21.6s | -27d30m23.8s | 27.6 | 59.3 | 28.1 | 6 | 4 | 2 | ||||
| out1_s26 | 159h09m07.2s | -27d29m58.9s | 34.4 | 52.0 | 13.4 | 6 | 4 | 2 | ||||
| out1_s27 | 159h09m14.4s | -27d29m52.1s | 34.5 | 50.2 | – | 10.0 | 6 | 4 | 2 | |||
| out1_s28 | 159h09m46.8s | -27d30m02.2s | 28.0 | 52.9 | 9.6 | 6 | 4 | 1 | ||||
| out1_s29 | 159h09m36.0s | -27d29m40.6s | 34.0 | 47.4 | 6.8 | 8 | 2 | 1 | ||||
| out1_s30 | 159h10m15.6s | -27d29m56.8s | 26.7 | 51.4 | 13.8 | 6 | 4 | 1 | ||||
| out1_s31 | 159h10m01.2s | -27d29m32.6s | 33.3 | 45.6 | 7.4 | 6 | 4 | 1 | ||||
| out1_s32 | 159h10m48.0s | -27d29m53.9s | 26.6 | 50.7 | 21.7 | 6 | 4 | 1 | ||||
| out1_s33 | 159h10m33.6s | -27d29m28.7s | 32.8 | 44.7 | 8.9 | 8 | 2 | 1 | ||||
| out1_s34 | 159h11m34.8s | -27d30m01.1s | 28.0 | 52.6 | 20.9 | 6 | 4 | 1 | ||||
| out1_s35 | 159h11m16.8s | -27d29m32.3s | 33.0 | 45.5 | 9.7 | 6 | 4 | 1 | ||||
| out1_s36 | 159h12m03.6s | -27d29m53.9s | 33.3 | 50.7 | 13.7 | 6 | 4 | 1 | ||||
| out2_s13 | 159h12m25.2s | -27d30m10.8s | 33.9 | 55.3 | 17.7 | 6 | 4 | 1 | ||||
| out2_s14 | 159h13m04.8s | -27d30m54.4s | 37.0 | 70.1 | 11.0 | 6 | 4 | 1 | ||||
| out2_s15 | 159h12m21.6s | -27d30m36.4s | 29.3 | 63.5 | 20.6 | 6 | 4 | 1 | ||||
| out2_s16 | 159h13m12.0s | -27d31m26.8s | 37.1 | 83.4 | 11.3 | 6 | 4 | 1 | ||||
| out2_s17 | 159h12m43.2s | -27d31m18.8s | 30.4 | 80.0 | 15.5 | 6 | 4 | 1 | ||||
| out2_s18 | 159h13m12.0s | -27d31m53.4s | 37.0 | 94.9 | – | 12.0 | 6 | 4 | 1 | |||
| out2_s19 | 159h12m43.2s | -27d31m47.3s | 29.8 | 92.3 | – | 14.5 | 6 | 4 | 1 | |||
| out2_s20 | 159h13m01.2s | -27d32m08.9s | 34.9 | 101.5 | 15.2 | 8 | 2 | 1 | ||||
| out2_s21 | 159h12m39.6s | -27d32m06.0s | 29.5 | 100.3 | 14.5 | 6 | 4 | 1 | ||||
| out2_s22 | 159h13m01.2s | -27d32m34.4s | 36.6 | 111.7 | – | 5.7 | 6 | 4 | 1 | |||
| out2_s23 | 159h12m54.0s | -27d32m46.0s | 36.1 | 115.9 | – | 4.6 | 6 | 4 | 1 | |||
| out2_s24 | 159h12m28.8s | -27d32m37.3s | 29.6 | 112.8 | – | 6.6 | 6 | 4 | 1 | |||
| out2_s25 | 159h12m39.6s | -27d33m06.5s | 35.6 | 122.6 | – | – | – | 7.8 | 6 | 4 | 1 | |
| out2_s26 | 159h12m03.6s | -27d32m59.3s | 27.6 | 120.4 | – | 12.8 | 8 | 2 | 1 | |||
| out2_s27 | 159h12m18.0s | -27d33m24.5s | 34.5 | 127.8 | – | – | – | 5.2 | 6 | 4 | 1 | |
| out2_s28 | 159h11m45.6s | -27d33m12.2s | 27.2 | 124.4 | 12.0 | 6 | 4 | 1 | ||||
| out2_s29 | 159h11m56.4s | -27d33m35.3s | 33.3 | 130.7 | 7.7 | 6 | 4 | 1 | ||||
| out2_s30 | 159h11m20.4s | -27d33m23.0s | 26.6 | 127.5 | – | 16.7 | 6 | 4 | 1 | |||
| out2_s31 | 159h11m34.8s | -27d33m46.4s | 33.2 | 133.3 | – | 10.5 | 6 | 4 | 1 | |||
| out2_s32 | 159h10m51.6s | -27d33m28.1s | 26.2 | 128.8 | 16.7 | 6 | 4 | 1 | ||||
| out2_s33 | 159h11m06.0s | -27d33m52.2s | 32.6 | 134.6 | – | 15.0 | 6 | 4 | 1 | |||
| out2_s34 | 159h10m04.8s | -27d33m20.5s | 25.9 | 126.8 | 22.3 | 8 | 2 | 1 | ||||
| out2_s35 | 159h09m39.6s | -27d33m13.7s | 27.2 | 124.8 | 20.9 | 6 | 4 | 1 | ||||
| out2_s36 | 159h10m15.6s | -27d33m52.2s | 32.7 | 134.6 | – | 27.5 | 6 | 4 | 1 | |||
| out2_s37 | 159h09m21.6s | -27d33m26.6s | 32.4 | 128.4 | 16.4 | 6 | 4 | 1 |
Appendix B Additional figures
The first additional Figure (Fig. 16) highlights the adopted onion shell observing strategy with six different mask sets of half-rings (three on each side of the galaxy). The slit numbers are given, and the mask names colour-coded, to ease the identification of spectra in the text and Table LABEL:tab:kinematics.
Figures 17 and 18 show the velocity field and LOSVD higher moments of and around the Hydra I cluster lenticular galaxy HCC 007, which seems to interact with NGC 3311 as judged from a wide tidal tail feature east of the galaxy.

