A Suzaku X-ray study of the mixed-morphology supernova remnant Kes 69 and searching for its gamma-ray counterpart
Abstract
Kes 69 is a mixed-morphology (MM) supernova remnant (SNR) that is known to be interacting with molecular clouds based on 1720 MHz hydroxyl (OH) maser emission observations in the northeastern and southeastern regions. We present an investigation of Kes 69 using 67 ks Suzaku observation. The X-ray spectrum of the whole SNR is well fitted by a non-equilibrium ionization model with an electron temperature of 2.5 keV, ionization time-scale of 4.1 cm-3 s and absorbing column density of 3.1 cm-2. We clearly detected the Fe-K line at 6.5 keV in the spectra. The plasma shows slightly enhanced abundances of Mg, Si, S and Fe indicating that the plasma is likely to be of ejecta origin. We find no significant feature of a recombining plasma in this SNR. In order to characterize radial variations in the X-ray spectral parameters, we also analyze annular regions in the remnant. We investigate the explosive origin of Kes 69 and favor the core-collapse origin. Additionally, we report a lack of significant gamma-ray emission from Kes 69, after analyzing the GeV gamma-ray data taken for about 9 years by the Large Area Telescope on board Fermi. Finally, we discuss the properties of Kes 69 in the context of other interacting MM SNRs.
keywords:
ISM: individual objects: Kesteven 69 (G21.80.6) ISM: supernova remnants X-rays: ISM gamma-rays: ISM.1 Introduction
Galactic supernova remnant (SNR) Kesteven 69 (also known as G21.80.6, hereafter Kes 69) has an extended incomplete radio shell with an angular diameter of 20 arcmin (e.g. Shaver & Goss 1970). ROSAT and Einstein observations showed that this SNR has an irregular X-ray morphology, which shows correlation with an incomplete radio shell (Seward, 1990; Yusef-Zadeh et al., 2003). Based on the bright X-ray emission from the interior of the radio shell and a possible thermal X-ray spectrum, this remnant was classified as a mixed-morphology (MM) SNR (Yusef-Zadeh et al., 2003). Green et al. (1997) detected a compact OH maser at velocity of 69.3 km s-1 in the northeastern part of the remnant using the Very Large Array (VLA) and Australia Telescope Compact Array (ATCA) observations. At 85 km s-1 velocity, Hewitt, Yusef-Zadeh & Wardle (2008) detected extended OH maser emission toward the southern bright radio shell in the Green Bank Telescope OH maser survey. Millimeter band observations of CO and HCO+ lines toward Kes 69 provided strong evidence of an association between SNR and the 85 km s-1 component of molecular gas (Zhou et al., 2009). Spitzer observations of the remnant revealed the bright molecular emission lines of OH, CO and H2, excited by a shock (Reach et al., 2006; Hewitt et al., 2009a).
X-ray observations of Kes 69 were carried out by Einstein, ROSAT, ASCA and XMM-Newton (Seward, 1990; Yusef-Zadeh et al., 2003; Bocchino et al., 2012; Seo & Hui, 2013). Yusef-Zadeh et al. (2003) used ROSAT Position Sensitive Proportional Counter data and found that the thermal X-ray spectrum is well fitted by VMEKAL model with an absorbing column density of 2.4 cm-2 and an electron temperature of 1.6 keV. Bocchino et al. (2012) searched for compact hard X-ray sources in the field of Kes 69 using XMM-Newton data and reported on the detection of 18 hard X-ray sources in the 3.010.0 keV. Seo & Hui (2013) analyzed XMM-Newton data and showed that the plasma of Kes 69 has a collisional ionization equilibrium (CIE) condition and yielded a plasma temperature of 0.62 keV and a column absorption of 2.85 cm-2.
The kinematic distance to Kes 69 is estimated as 11.2 kpc (Green et al., 1997) from the OH maser velocity, 5.5 kpc from H i and 13CO spectra (Tian & Leahy, 2008), and 5.2 kpc from the SNR/molecular cloud (MC) association (Zhou et al., 2009). Assuming the Sedov stage solution, Bocchino et al. (2012) estimated an age of the SNR about 10, 000 yr from XMM-Newton data. Seo & Hui (2013) derived the age of the remnant to be yr assuming a distance of 5.5 kpc.
Kes 69 was searched in TeV and GeV gamma-ray bands by H.E.S.S. and the Large Area Telescope detector on board Fermi Gamma-Ray Space Telescope (Fermi-LAT), respectively. In the 1st Fermi-LAT Supernova Remnant Catalog (Acero et al., 2016), the upper limits on the flux of this SNR were reported on Table 3, i.e. among the not-detected SNRs, and H.E.S.S. missed Kes 69 in TeV gamma rays (Bochow, 2011). Recently, although a preliminary analysis of Fermi-LAT data showed the detection of GeV gamma rays from Kes 69, Ergin et al. (2016) cautioned that there are many bright gamma-ray sources in the close neighborhood of Kes 69 that could be contributing to this result.
Several SNRs are known as MM SNRs, which are identified by shell emission in the radio and centrally brightened thermal emission in the X-ray band with little or no shell brightening (Rho & Petre, 1998; Lazendic & Slane, 2006; Vink, 2012). However, the nature of the centrally brightened X-ray emission is poorly understood. The overionized/recombining plasma (RP) was observed in many MM SNRs (e.g. Yamaguchi et al. 2009; Ozawa et al. 2009; Ergin et al. 2017; Suzuki et al. 2018). In these SNRs, the ionization temperature () has been found to be significantly higher than the electron temperature (). Most MM SNRs exhibit the GeV/TeV gamma-ray emission (e.g., Abdo et al. 2009, 2010a; Castro & Slane 2010). They are associated with MCs as indicated by CO line emission and/or OH (1720 MHz) masers. There is a strong association between maser-emitting (ME) and MM SNRs, which implies that MM SNRs require dense molecular gas in their environment to show the unusual centrally filled X-ray morphology (e.g., Slavin et al. 2017; Yusef-Zadeh et al. 2003; White & Long 1991). Kes 69 has a bright X-ray emission from the interior of the radio shell and interacting with MC based on 1720 MHz OH maser emission observations; thus, Kes 69 is considered to be a member of ME-MM SNRs (Yusef-Zadeh et al., 2003).
In this paper, we study the high spectral resolution Suzaku observation of Kes 69 to investigate the nature of the X-ray emission and address the observed spectral characteristics. Additionally, we search for the gamma-ray counterpart of Kes 69 using archival Fermi-LAT data. The rest of the paper is organized as follows: We first summarize observations and data reduction in Section 2. In Section 3, we describe our analysis. Then, in Section 4, we discuss the nature of the thermal X-ray emission with a comparison to previous X-ray studies (Section 4.1), gamma-ray results (Section 4.2), its properties in the context of other interacting MM SNRs (Section 4.3) and explosion origin of Kes 69 (Section 4.4). The conclusions are summarized in Section 5.
2 Observations and Data Reduction
2.1 X-ray Data
Kes 69 was observed with the Suzaku X-ray Imaging Spectrometer (XIS: Koyama et al. 2007a) on 2014 September 27-29 (ObsID: 509037010). The net exposure of the cleaned event data was 67.2 ks. The XIS consists of four charge-coupled device (CCD) cameras placed at the focus of the X-Ray Telescope (XRT: Serlemitsos et al. 2007), covering the 0.212 keV energy range. Each XIS sensor has 10241024 pixels and covers a 17.817.8 arcmin2 field of view (FoV). The XIS 0, 2, and 3 are front side illuminated CCDs, whereas XIS1 is a back-side illuminated CCD. Since 2006 November 9, the XIS2 has not been available for observations. We retrieved Suzaku archival data of Kes 69 from the Data Archives and Transmission System (DARTS)111http://www.darts.isas.jaxa.jp/astro/suzaku/. Data reduction and analysis were made with Headas software version 6.20222https://heasarc.nasa.gov/lheasoft/ and xspec version 12.9.1 (Arnaud, 1996) with AtomDB v3.0.9333http://www.atomdb.org (Smith et al., 2001; Foster et al., 2012). We used a cleaned event file created by the Suzaku team, combined the 55 and 33 editing mode event files using xselect v2.4d and generated the Redistribution Matrix Files and Ancillary Response Files using xisrmfgen and xissimarfgen tools (Ishisaki et al., 2007). All spectra are binned to a minimum of 25 counts per bin to allow use of the statistic using the ftool grppha.
2.2 Gamma-ray Data
Fermi-LAT data obtained between 2008-08-04 and 2017-03-07 were used in this analysis. We selected the Fermi-LAT Pass 8 ‘Source’ class and frontback type events coming from zenith angles smaller than 90∘ and from a circular region of interest (ROI) with a radius of 30∘ centred at the SNR’s radio position using gtselect of Fermi Science Tools (FST).
The exposure map produced by the likelihood calculations gives the total exposure (in terms of effective area multiplied by time) for a given position on the sky producing counts inside the ROI. The time that Fermi-LAT observed at a given position on the sky at a given off-axis angle is called the livetime and it is used to calculate the exposure map. The FST gtltcube tool produces an array of livetimes at all points on the sky and saves it into a livetime cube. Then the gtexpcube2 tool of FST can be used to apply the livetime cube to the ROI to generate a binned exposure map. In our analysis, the livetime calculated over the whole sky ranged between 26 mins and 388 hours and 14 exposure maps were produced for the analysis region of 15∘ 15∘, where each of the maps corresponds to a different logarithmic energy bin assigned between 200 MeV and 300 GeV.
3 Analysis
3.1 X-ray Spectral Analysis
In Figure 1, we present the XIS1 image of Kes 69 in the 0.310.0 keV energy band. The radio data from National Radio Astronomy Observations (NRAO) Very Large Array (VLA) Sky Survey (NVSS: Condon et al. 1998) are overlaid for comparison. The cross shows the position of maser emission at velocity 69.3 km s-1 (Green et al., 1997). The spectral extraction regions are shown with the circles, while the eliminated hard point-like sources detected by XMM-Newton (Bocchino et al., 2012) are shown with magenta circles (radius 0.33 arcmin). The calibration sources at the corner of the CCD chips are excluded from the image.
3.1.1 Background Estimation
For the background analysis of XMM-Newton data, Bocchino et al. (2012) used an empty area in the northeastern part of the FoV as a background region. We extracted the background spectra from the FoV of the XIS, shown by the dashed area in Figure 1, excluding the calibration sources at the corners of the FoV, the point-like sources, and the emission from the remnant.
Recent studies have demonstrated that an accurate estimation of the X-ray background is particularly important to generate the X-ray spectrum of extended sources such as SNRs (e.g., G346.60.2: Yamauchi et al. 2013; G32.80.1: Bamba et al. 2016a). For example, the flux of the Galactic ridge X-ray emission (GRXE) strongly depends on the location of the SNRs (e.g., Uchiyama et al. 2013; Yamauchi et al. 2016). We therefore consider the following background components: the non-X-ray background (NXB) as an instrumental background component and the GRXE and cosmic X-ray background (CXB) components as the X-ray background. We generated the NXB using xisnxbgen (Tawa et al., 2008) and subtracted it from the extracted spectrum. Then, we fitted the NXB-subtracted background spectra with the following model:
| (1) |
where the apec is a CIE plasma model in the xspec. The second term is the GRXE component. We assumed the CXB spectrum as a power-law of photon index 1.4 and CXB having a surface brightness of 5.410-15 erg s-1 cm-2 arcmin-2 in the 210 keV energy band (Kushino et al., 2002). The X-ray background spectrum was simulated by using the fakeit command in xspec and then it was subtracted from the observed spectrum.
3.1.2 Spectral Fits

In order to characterize the X-ray emitting plasma of the whole SNR, we first extracted the XIS spectra from the circular region with a radius of 6.1 arcmin, which is shown in Figure 1. To search for spectral variations in the temperature, ionization state and elemental abundances of Kes 69, we also extracted spectra from three annular regions of 02, 24 and 46 arcmin centred around , , which are regions 1, 2 and 3, respectively, as shown in Figure 1.
The previous observations suggested that the X-ray spectrum of Kes 69 is characterized by a thermal plasma in CIE (Yusef-Zadeh et al., 2003; Bocchino et al., 2012; Seo & Hui, 2013). Therefore, we first applied an absorbed (TBABS: Wilms et al. 2000) single-component variable-abundance CIE model (VMEKAL model in xspec). The absorbing column density , electron temperature , abundances of Mg, Si, S and Fe, and normalization were allowed to vary freely during the fitting. The other metal abundances were fixed to the solar values (Wilms et al., 2000). In this case, the electron temperature was obtained to be 1.2 keV, but this model was statistically unacceptable (with a reduced- 1.4).
As a next step, we employed an absorbed non-equilibrium ionization (NEI) plasma model (VNEI model in xspec), where the free parameters were the interstellar absorption, , electron temperature, , ionization time-scale, , where and represent the electron density and the time after the shock heating, respectively. The abundances of Mg, Si, S and Fe were also free parameters, while the other abundances were fixed to the solar values. We obtained a statistically acceptable fit (with a reduced- value of 1.19) for the whole region. To confirm the spectral parameters, we fitted the spectra with a single-component plane-parallel shock model with variable abundances (xspec model VPSHOCK; Borkowski et al. 2001) modified by interstellar absorption. We obtained an equally good fit with similar parameters to VNEI.
In order to check whether a cool component is needed across the remnant, we applied the two-component thermal plasma model (VNEI+VMEKAL) to the spectrum. For VNEI component, abundances of Mg, Si, S and Fe were free parameters. The abundances of all elements were assumed to the solar values for VMEKAL component. This model slightly improved the fit (/dof=1.13/1539), but it did not give well-constrained spectral parameters. We therefore employed one-temperature NEI plasma model to fit the spectra of our spectral regions and concluded that the VNEI model represents the spectra. The background-subtracted 0.98.0 keV spectra are presented in Figure 2. For the annulus regions, we fixed the absorption to that obtained for the whole SNR and then fitted each spectrum to a VNEI model. We obtain statistically acceptable fits (with reduced- values of 1.041.13). In Table 1, we present the best-fitting parameters with 90 per cent confidence ranges for all regions.
We also tried an absorbed RP model (VRNEI444https://heasarc.gsfc.nasa.gov/xanadu/xspec/manual/node210.html in xspec) to search for the RP. This model is characterized by final electron temperature () and initial electron temperature (), elemental abundances and a single ionization time-scale (). We find that an initial plasma temperature (0.57 keV) much smaller than the current plasma temperature (2.59 keV) indicating that the plasma of this SNR is under-ionized. We also obtain for our annular regions indicating that the plasma is still ionizing.
| Component | Parameters | Whole | Region 1 | Region 2 | Region 3 |
|---|---|---|---|---|---|
| TBABS | ( cm | 3.1 (fixed) | 3.1 (fixed) | 3.1 (fixed) | |
| VNEI | (keV) | ||||
| Mg | |||||
| Si | |||||
| S | |||||
| Fe | |||||
| = ( cm-3 s) | |||||
| Norm (10-3 cm-5) | |||||
| reduced- (dof) | 1.19 (1541) | 1.04 (309) | 1.09 (793) | 1.13 (1056) |
-
•
Notes. The normalization of the VNEI, norm=/() (cm-5), where , , and are the electron and hydrogen densities (cm-3), emitting volume (cm3) and distance to the source (cm), respectively. Abundances are given relative to the solar values of Wilms et al. (2000).

3.2 Gamma-ray Analysis
We used fermipy555http://fermipy.readthedocs.io/en/latest/index.html analysis toolkit to apply the maximum likelihood fitting method (Mattox et al., 1996) on spatially and spectrally binned data for 0.2 300 GeV by taking P8R2-SOURCEV6 as the instrument response function. The analysis yields the test statistics (TS) value, which is the square root of the detection significance. A large TS value shows that the maximum likelihood value for a model without an additional source (the null hypothesis) is not valid.
The background model of the analysis region consists of the diffuse background sources and all the point-like and extended sources from the 3rd Fermi-LAT Source Catalog (Acero et al., 2015) located within 15∘ 15∘ region centred on the ROI centre. All parameters of the diffuse Galactic emission (gll-iem-v6.fits) and the isotropic component (iso-P8R2-SOURCEV6v06.txt) were freed. The normalization parameters of all sources within 3∘ are set free. In addition, we freed all sources with TS 10 and fixed all sources with TS 10.
4 Results and Discussion
4.1 X-ray Properties of Kes 69
The X-ray spectra of the SNR were previously studied by Yusef-Zadeh et al. (2003) with ROSAT and ASCA, by Bocchino et al. (2012) and by Seo & Hui (2013) with XMM-Newton. Although their spectral fits indicate that the X-ray-emitting gas is characterized by a CIE model, we find that the plasma is well represented by a NEI plasma model. Our estimated absorption is slightly higher than ROSAT and XMM-Newton results. The CIE plasma temperatures found are 1.6 keV (Yusef-Zadeh et al., 2003), 0.8 keV (Bocchino et al., 2012) and 0.62 keV (Seo & Hui, 2013), which are significantly lower than our result. These inconsistencies may be related to the detection of Fe-K line in the Suzaku spectra, which produces significantly higher compared with previous studies. Also, in our analysis we use different background regions, different background estimation method, the different spectral capabilities of the X-ray satellites, the elemental abundances by Wilms et al. (2000) and the recently updated AtomDB database.
The X-ray spectra of the annular regions surrounding the X-ray centre of Kes 69 show no strong evidence of spectral variability. A characteristic feature of MM SNRs is a flat electron temperature profile (Rho & Petre, 1998). Kes 69 shows a flat temperature of 2.3 keV across its centre, which is consistent with MM SNRs. The ionization time-scales for all regions indicate that the X-ray emitting plasma across the whole remnant is in an NEI condition. We find enhanced abundances of Mg, Si, S and Fe in all regions indicating that the X-ray emitting plasma has an ejecta origin. However, this result is not conclusive when the error bars are taken into account (see Table 1).
The density of the X-ray emitting gas was estimated from the normalization, norm=/(). Assuming that the emitting region to be a sphere of radius 6.1 arcmin, the SNR is at a distance of 5.2 kpc and , we estimated the emission volume to be , where is the volume filling factor and is the distance scaled to 5.2 kpc. Consequently, we found an ambient gas density of 0.14 and age of yr. Our estimated age of the remnant is comparable to the derived by Bocchino et al. (2012) and lower than that derived by Seo & Hui (2013) in their XMM-Newton analysis. We then derived the total X-ray-emitting mass, using =1.4. This result indicated that the X-ray-emitting plasma is dominated by ejecta material of a core-collapse (CC) supernova (SN), because the X-ray-emitting mass is much larger than the Chandrasekhar mass.
Assuming the Sedov (1959) model, we calculated the SNR radius of 18.6 pc and the swept-up interstellar medium (ISM) mass of using the initial ISM density =0.14 cm-3, SNR age yr and explosion energy erg. The swept-up ISM mass of Kes 69 is reasonably explained if the X-ray-emitting plasma is dominated by the shocked ambient medium. We note that a large swept-up ISM mass may be expected for MM SNRs, which appear to be interacting with MCs.
We also calculated the total thermal energy of erg by assuming =56 and ion temperature =2.5 keV. We therefore cannot rule out the ISM origin if =. However, the relaxation time-scale due to the Coulomb interaction between and is about sec (/0.1 cm-3)-1, which is much larger than expected age of the SNR. So, we may expect and the ISM model requires explosion energies much larger than erg. In this case, the X-ray emitting plasma would be more like ejecta in origin.
4.2 Gamma-ray Results
In the energy range of 0.2 - 300 GeV no excess gamma-ray emission was found from the direction of Kes 69. The upper limit at 95 per cent confidence level (CL) on the flux and energy flux were found to be 3.1 10-6 MeV cm-2 s-1 and 2.1 10-9 cm-2 s-1, respectively. The flux upper limit is comparable to the upper limit given in the 1st Fermi-LAT Supernova Remnant Catalog (Acero et al., 2016), which is 1.8 10-9 cm-2 s-1 for a spectral index of 2.5 and 95 per cent upper limit. Assuming the distance of 5.5 kpc to the SNR, the upper limit of the gamma-ray luminosity is 1.8 1034 erg s-1, which is slightly smaller than the reported gamma-ray luminosities for interacting SNRs (Acero et al., 2016).
Kes 69 is an MM SNR in Sedov phase and shows signs of interaction with MC thorough the detection of OH (1720 MHz) masers. However, due to narrow physical conditions needed to excite the OH (1720 MHz) masers, the lack of them would not give any information about hadronic gamma rays being emitted from this SNR or not (Frail, 2011). Besides, although the cosmic rays may be responsible for the local enhancement in SNRs, which is sufficient to produce OH abundance in the post shock gas, the ionization rate from the interior X-ray emission is comparable to the one from cosmic rays. The dominant emission mechanism might depend on the gas location with respect to the interior X-ray emitting plasma and cosmic ray acceleration site (Hewitt et al., 2009b).
Hewitt, Yusef-Zadeh & Wardle (2008) reported extended OH (1720 MHz) maser emission from Kes 69 using GBT data, which was previously not detected by VLA (summarized in Table 3 of Hewitt, Yusef-Zadeh & Wardle (2008)). They reported a single compact maser emission at +69 km s-1, which was also detected during the VLA observations (Green et al., 1997). However, faint OH (1720 MHz) emission is present at +85 km s-1 that appears across the southern ridge of the SNR, which has broader line widths and a velocity gradient. Since both the extended maser emission and molecular material are found at around +85 km s-1, it raises suspicion about the Kes 69 origin of the maser found at +69 km s-1. If +69 km s-1 maser is not associated with Kes 69, then the OH (1720 MHz) maser emission arising from Kes 69 is only extended in nature. These extended masers are about 20 times lower in brightness than compact masers and they may be produced by the interior X-ray emission of the SNR. Zhou et al. (2009) showed that a molecular arc is present at 77-86 km s-1 at the southeast part of the shell of Kes 69, which overlaps with the 1.4 GHz radio continuum and mid-infrared (IR) observations at the same region of the shell. They also found HCO+ emission at 85 km s-1 on the shell. Both the molecular arc and the HCO+ emission at 85 km s-1 were reported to be consistent with the presence of the extended 1720 MHz OH emission along the southeastern boundary of Kes 69.
According to Zhou et al. (2009), the multi-wavelength emissions along the southeastern shell of Kes 69 were caused by the impact of the SNR shock on a dense, clumpy patch of molecular gas, which pre-existed and is possibly the cooled and clumpy left-over debris of the interstellar molecular gas swept up by the progenitors stellar wind. Therefore, a possible explanation of the lack of GeV gamma-ray emission from Kes 69 is that the extended maser emission is produced by the interior X-ray emitting plasma rather than by cosmic rays accelerated at regions away from the molecular gas clumps.
4.3 Kes 69: A Maser Emitting Mixed-morphology SNR
Kes 69 is a middle-aged SNR, its centre-filling X-ray emission surrounded by a shell-like radio structure suggests that Kes 69 belongs to the category of MM SNRs. There are two main models to explain the centrally filled X-ray emission in the MM SNRs. One is the evaporating cloudlet model (e.g., White & Long 1991) and the other is the thermal conduction model (e.g., Cox et al. 1999). But, the true origin of the centre-filled thermal X-ray emission from middle-aged MM SNRs is still unknown. It is unclear what leads to their centre-filled morphology and whether these SNRs are dominated by the ejecta or by the shocked ISM. The origin of emission from ejecta-dominated MM SNRs also remains unknown. Our XIS analysis shows that Kes 69 is likely to be of ejecta origin.
Recently, Slavin et al. (2017) performed multi-dimensional hydrodynamics simulations to discuss the origin of centrally peaked X-ray profile. They do not include any piston ejecta but put thermal energy in their simulations. Then the central diffuse gas expands due to large thermal pressure, pushing ISM to form the shock. According to Slavin et al. (2017) the origin of the hot gas is the ISM and not the ejecta. In addition, Slavin et al. (2017) suggest that the SNR’s centre-filled morphology is due to the expansion into a cloudy medium and ejecta is not a dominant factor in the formation of this morphology. As mentioned in Section 4.1, X-ray properties of Kes 69 show that the detected hot gas in Kes 69 is likely ejecta in origin rather than ISM.
Here, we discuss Kes 69 in comparison with other MM SNRs known to be interacting with MCs. We list the SNRs identified as interacting MM SNRs type and summarize their properties, such as detection of RP and gamma-ray in Table 2. As seen in Table 2, all of the SNRs that have detected RP emission, show also gamma-ray emission except for G346.60.2. Other interacting MM SNRs, like W51C and G298.60.0 in Table 2, show gamma-ray emission, but no RP emission. There has been no published analysis results about RP in Sgr A East and Kes 41, but they present gamma-ray emission. However, Kes 69 is the only candidate in the list for which no gamma-rays nor RP emission is detected.
| SNR | Other | -ray | RP | MC | Aged | References | ||
|---|---|---|---|---|---|---|---|---|
| name | detection | detection | interactiona | (keV) | (keV) | (kyr) | ||
| G0.0+0.0 | Sgr A East | GeV/TeV | ? | Y | - | , | 1.210 | [1, 2, 3, 4] |
| G6.40.1 | W28 | GeV/TeV | Y | Y | 3 (fixed) | 3336 | [5, 6, 7] | |
| G21.80.6 | Kes 69 | N | N | Y | 525 | This work | ||
| G31.9+0.0 | 3C 391 | GeV | Y | Y | 0.4950.015 | 3.74.4 | [8, 9] | |
| G34.70.4 | W44 | GeV | Y | Y | 0.480.02 | 2028 | [10, 11] | |
| G49.20.7 | W51C | GeV/TeV | N | Y | - | 1830 | [12, 13, 14] | |
| G89.0+4.7 | HB21 | GeV | Y | Yb | 4.815 | [15, 16] | ||
| G189.1+3.0 | IC 443 | GeV/TeV | Y | Y | 10 (fixed) | 0.650.04 | 330 | [17, 18, 19, 20] |
| G298.60.0 | GeV | N | Yc | - | - | [21] | ||
| G337.80.1 | Kes 41 | GeV | ? | Y | - | 1216 | [22, 23] | |
| G346.60.2 | N | Y | Y | 5 (fixed) | 4.216 | [24, 25] | ||
| G348.5+0.1 | CTB 37A | GeV | Y | Y | 5 (fixed) | 1030 | [26, 27] | |
| G359.10.5 | GeV/TeV | Y | Y | 0.290.02 | 10 | [28, 29, 30] |
- •
-
•
References. [1] Aharonian et al. (2006); [2] Acero et al. (2016); [3] Ajello et al. (2017); [4] Koyama et al. (2007b); [5] Aharonian et al. (2008a); [6] Abdo et al. (2010c); [7] Sawada & Koyama (2012); [8] Ergin et al. (2014); [9] Sato et al. (2014); [10] Abdo et al. (2010b); [11] Uchida et al. (2012); [12] Abdo et al. (2009); [13] Aleksic et al. (2012); [14] Hanabata et al. (2013); [15] Pivato et al. (2013); [16] Suzuki et al. (2018); [17] Abdo et al. (2010a); [18] Albert et al. (2007); [19] Yamaguchi et al. (2009); [20] Ohnishi et al. (2014); [21] Bamba et al. (2016b); [22] Liu et al. (2015); [23] Zhang et al. (2015); [24] Ergin & Ercan (2012); [25] Yamauchi et al. (2013); [26] Castro & Slane (2010); [27] Yamauchi et al. (2014); [28] Aharonian et al. (2008b); [29] Hui et al. (2011); [30] Ohnishi et al. (2011).
| Type Ia Models | CC Models∗ | ||||||||||
|---|---|---|---|---|---|---|---|---|---|---|---|
| Ratio | Kes 69 | W7 | WDD2 | PDDe | DDTe | 11 | 12 | 15 | 20 | 25 | 30 |
| Mg/Si | 0.06 | 0.02 | 0.0017⋆ | 0.025⋆ | 0.57 | 0.12 | 0.70 | 0.16 | 0.45 | 1.79 | |
| S/Si | 1.07 | 1.17 | 1.5 | 1.4 | 0.87 | 1.53 | 0.62 | 1.28 | 0.96 | 0.24 | |
| Fe/Si | 1.56 | 0.85 | 0.89 | 0.91 | 1.37 | 0.23 | 0.70 | 0.88 | 0.13 | 0.15 | |
- •
4.4 The explosion origin of Kes 69
As mentioned before, Kes 69 is an ME SNR and Spitzer detection of spectral lines associated with shocked H2, which are strong evidences of CC origin. We consider other methods to estimate the progenitor for this SNR. There are several methods to determine the origin of SNRs; (i) X-ray morphology: Using high-resolution Chandra images of SNRs, Lopez et al. (2009, 2011) found that the CC SNRs are more spatially asymmetric than the Type Ia SNRs; (ii) Fe-K line: Yamaguchi et al. (2014) concluded that Fe-K centroid energies for Type Ia SNRs are lower (6.55 keV) than those of CC SNRs; (iii) Abundance of ejecta; (iv) Presence of compact object or pulsar wind nebulae (PWN); (v) Environment.
To determine the Fe-K centroid energy, we fitted the 5.08.0 keV spectrum with an absorbed power-law plus a Gaussian model. We note that the Gaussian line width parameter was fixed to zero. For comparison with the results of Yamaguchi et al. (2014), we estimated the centroid energy of Fe-K as , , and keV for whole, Regions 1, 2 and 3, respectively, which agree on a Type Ia origin.
The GRXE also emits K-shell lines from neutral iron (at 6.4 keV), helium-like iron (at 6.7 keV) and hydrogen-like iron (at 7.0 keV) (e.g. Uchiyama et al. 2013). Therefore, we compare the flux of Fe-K line from Kes 69 and GRXE. The Gaussian line at 6.5 keV of the remnant has a surface brightness of 0.810-7 photons cm-2 s-1 arcmin-2, while that of the background is very faint (less than 1 per cent of the 6.5 keV line flux detected in the remnant). This result indicates that 6.5 keV Fe-K line is not a contamination of the Fe K-shell line in the GRXE and the detection of the 6.5 keV line feature is robust.
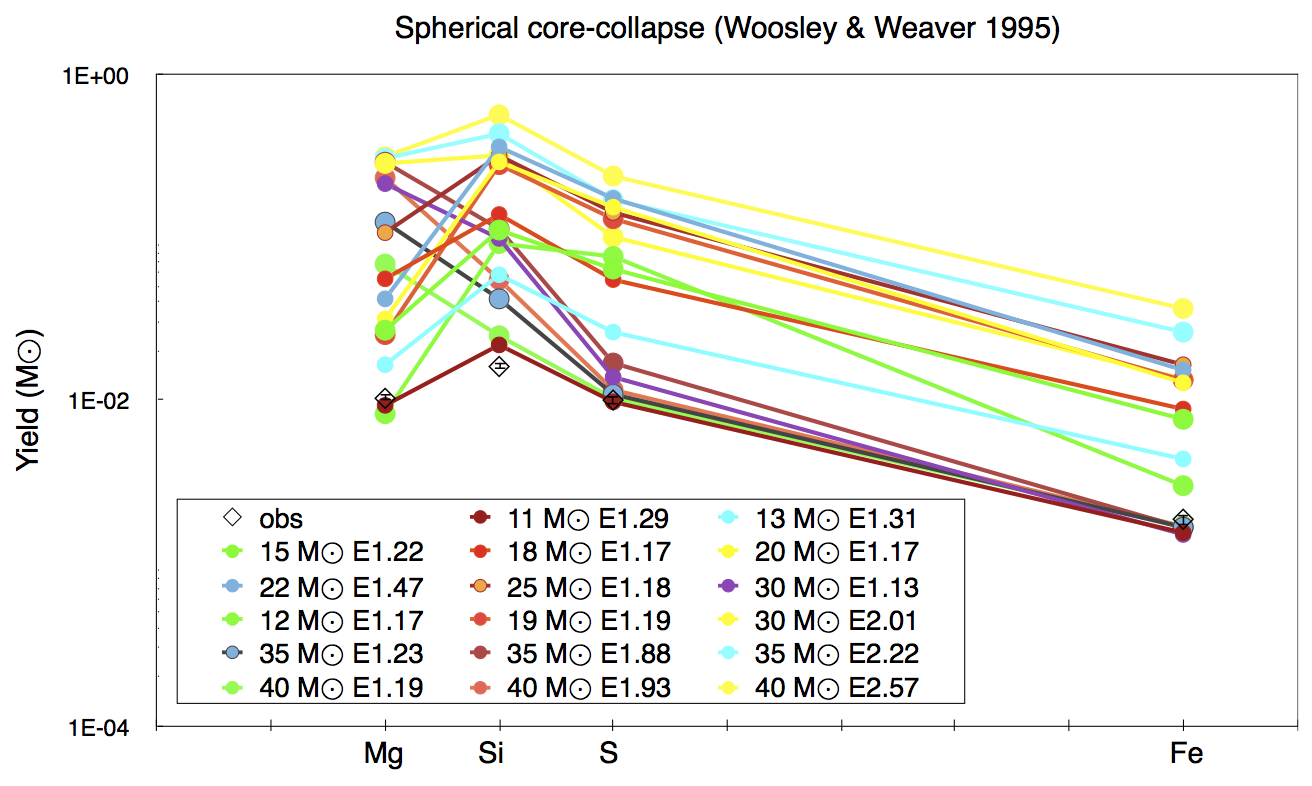
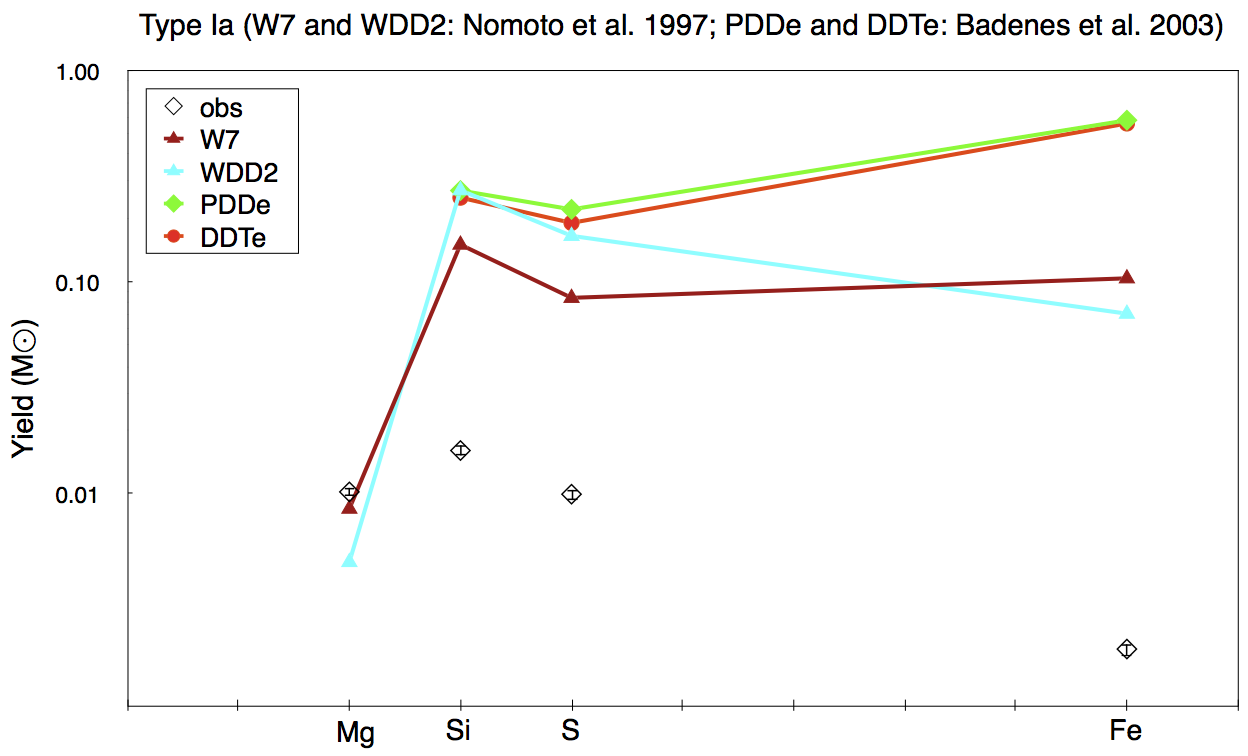
Table 3 presents the best-fitting abundances of the whole region relative to Si, the abundance ratios expected for CC SN with different progenitor masses CC (Woosley & Weaver, 1995) and Type Ia models (Nomoto et al., 1997; Badenes et al., 2003). Mg/Si ratios are taken from Rakowski et al. (2006), since they were not given in Badenes et al. (2003). As seen from Table 3, we find that the CC model with 11 is feasible.
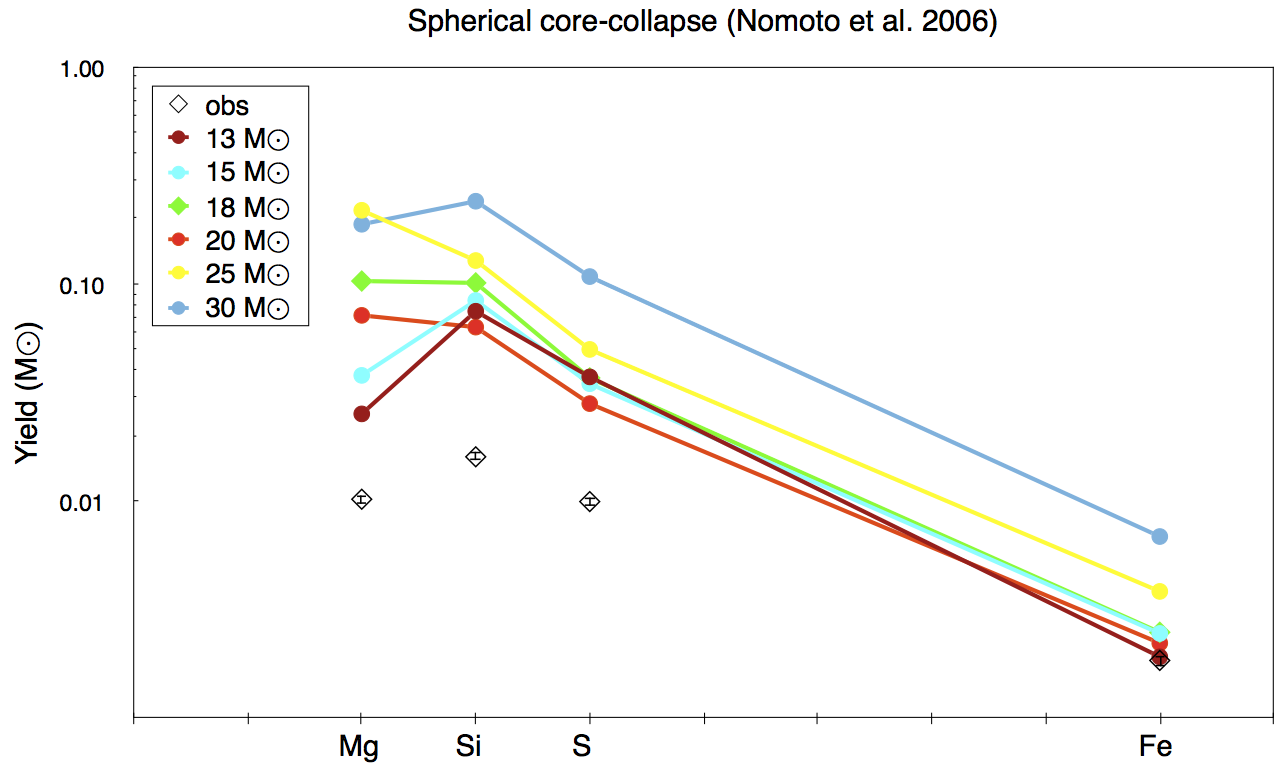
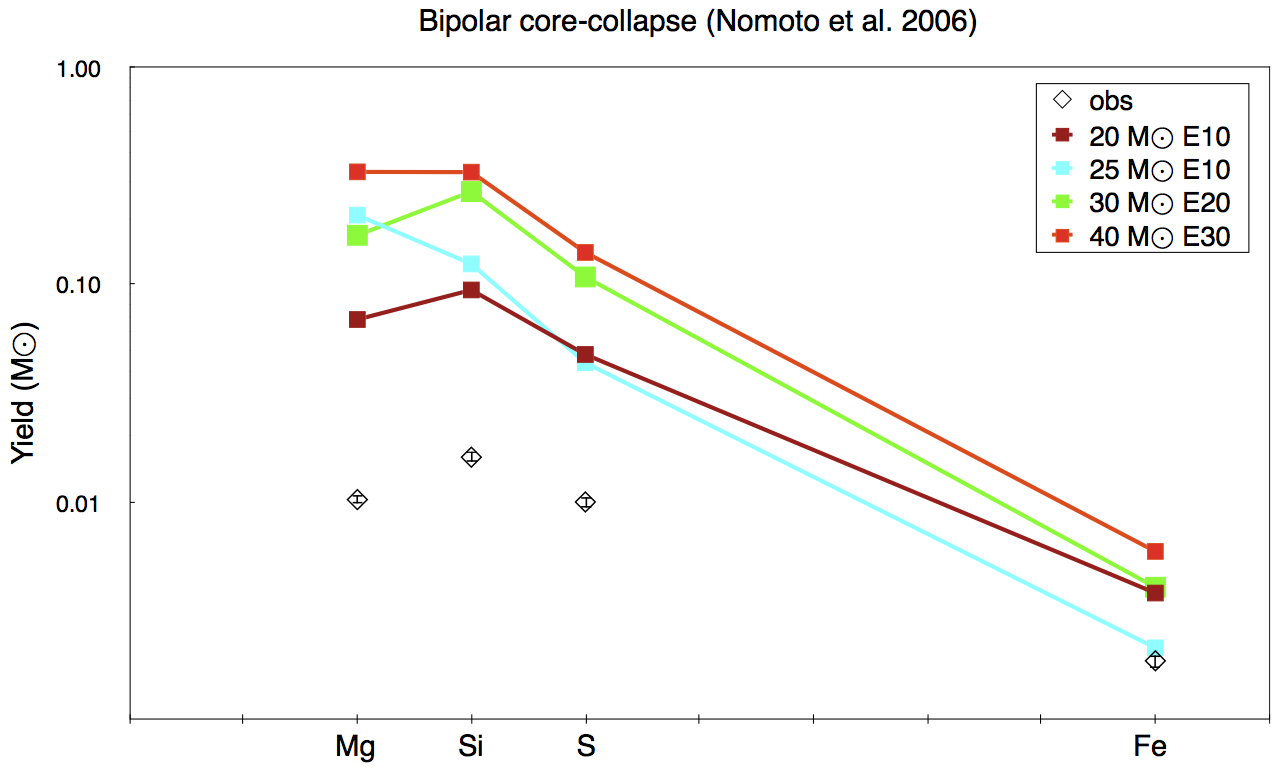
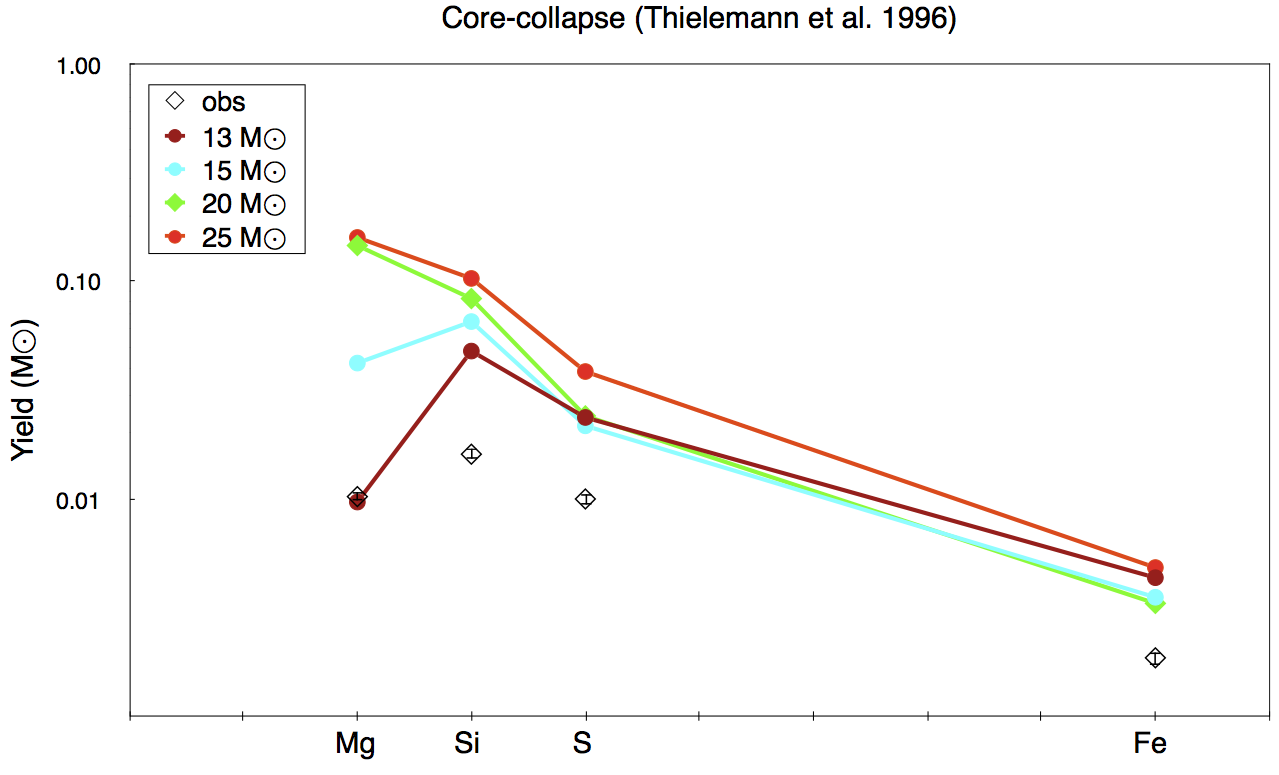
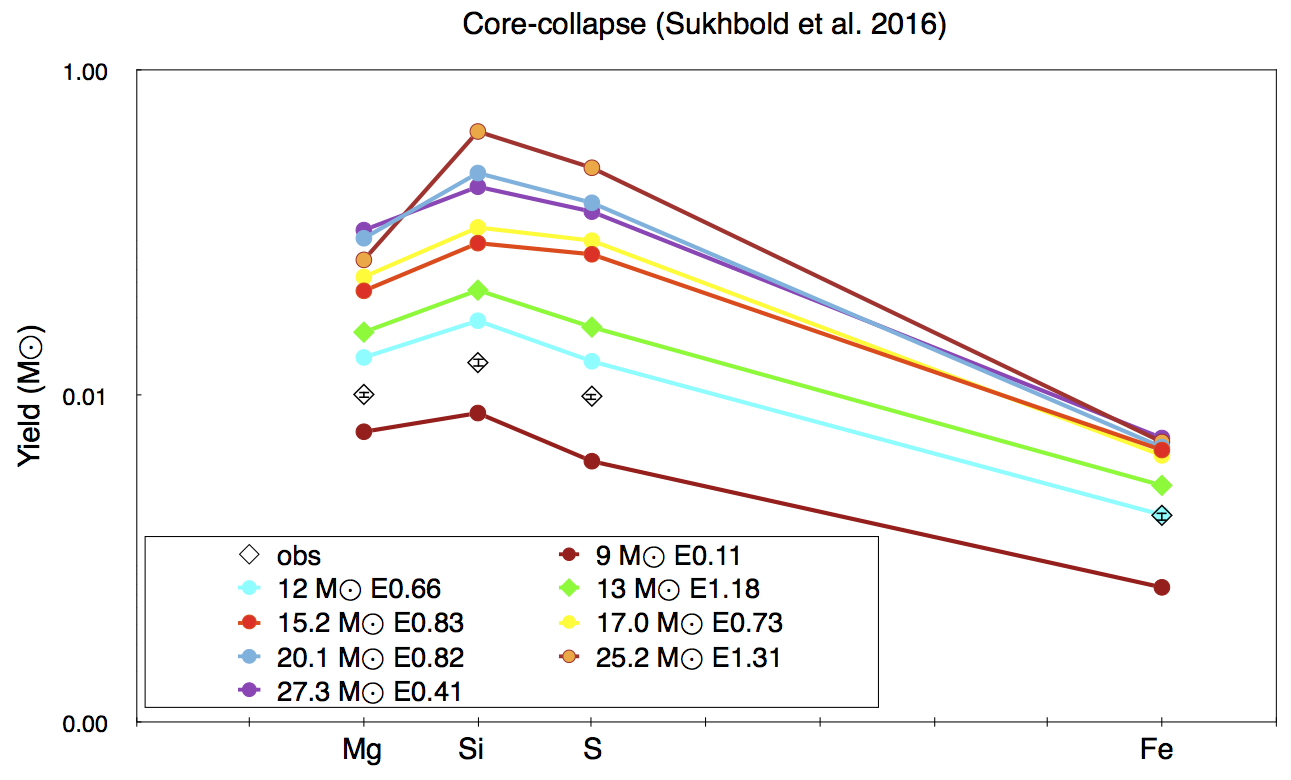
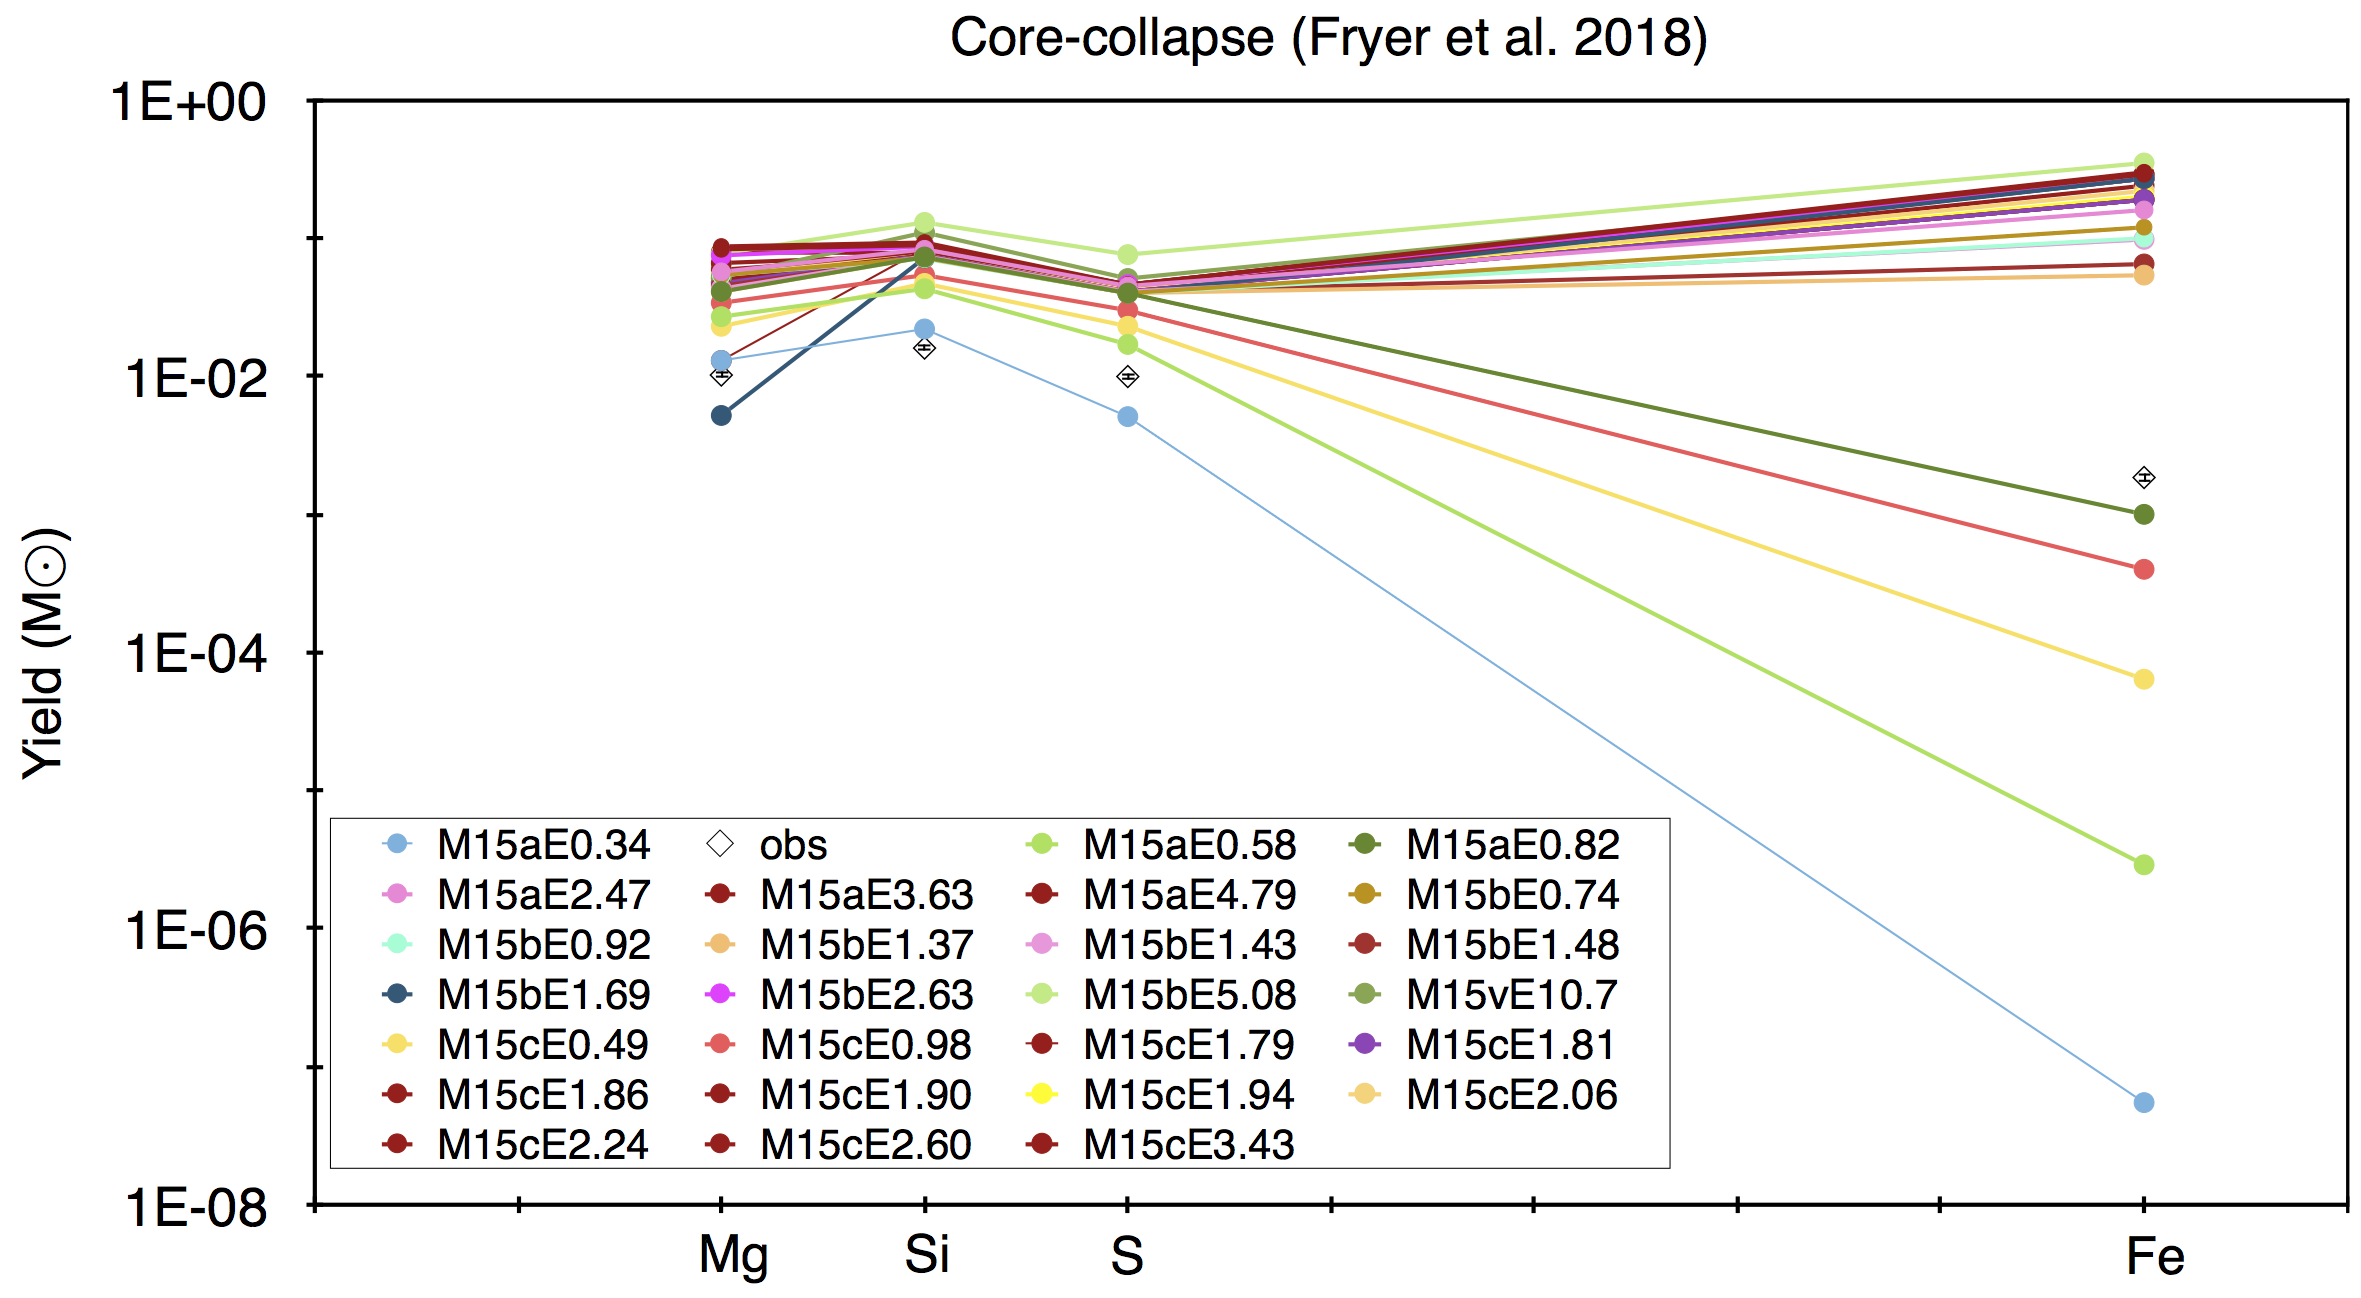
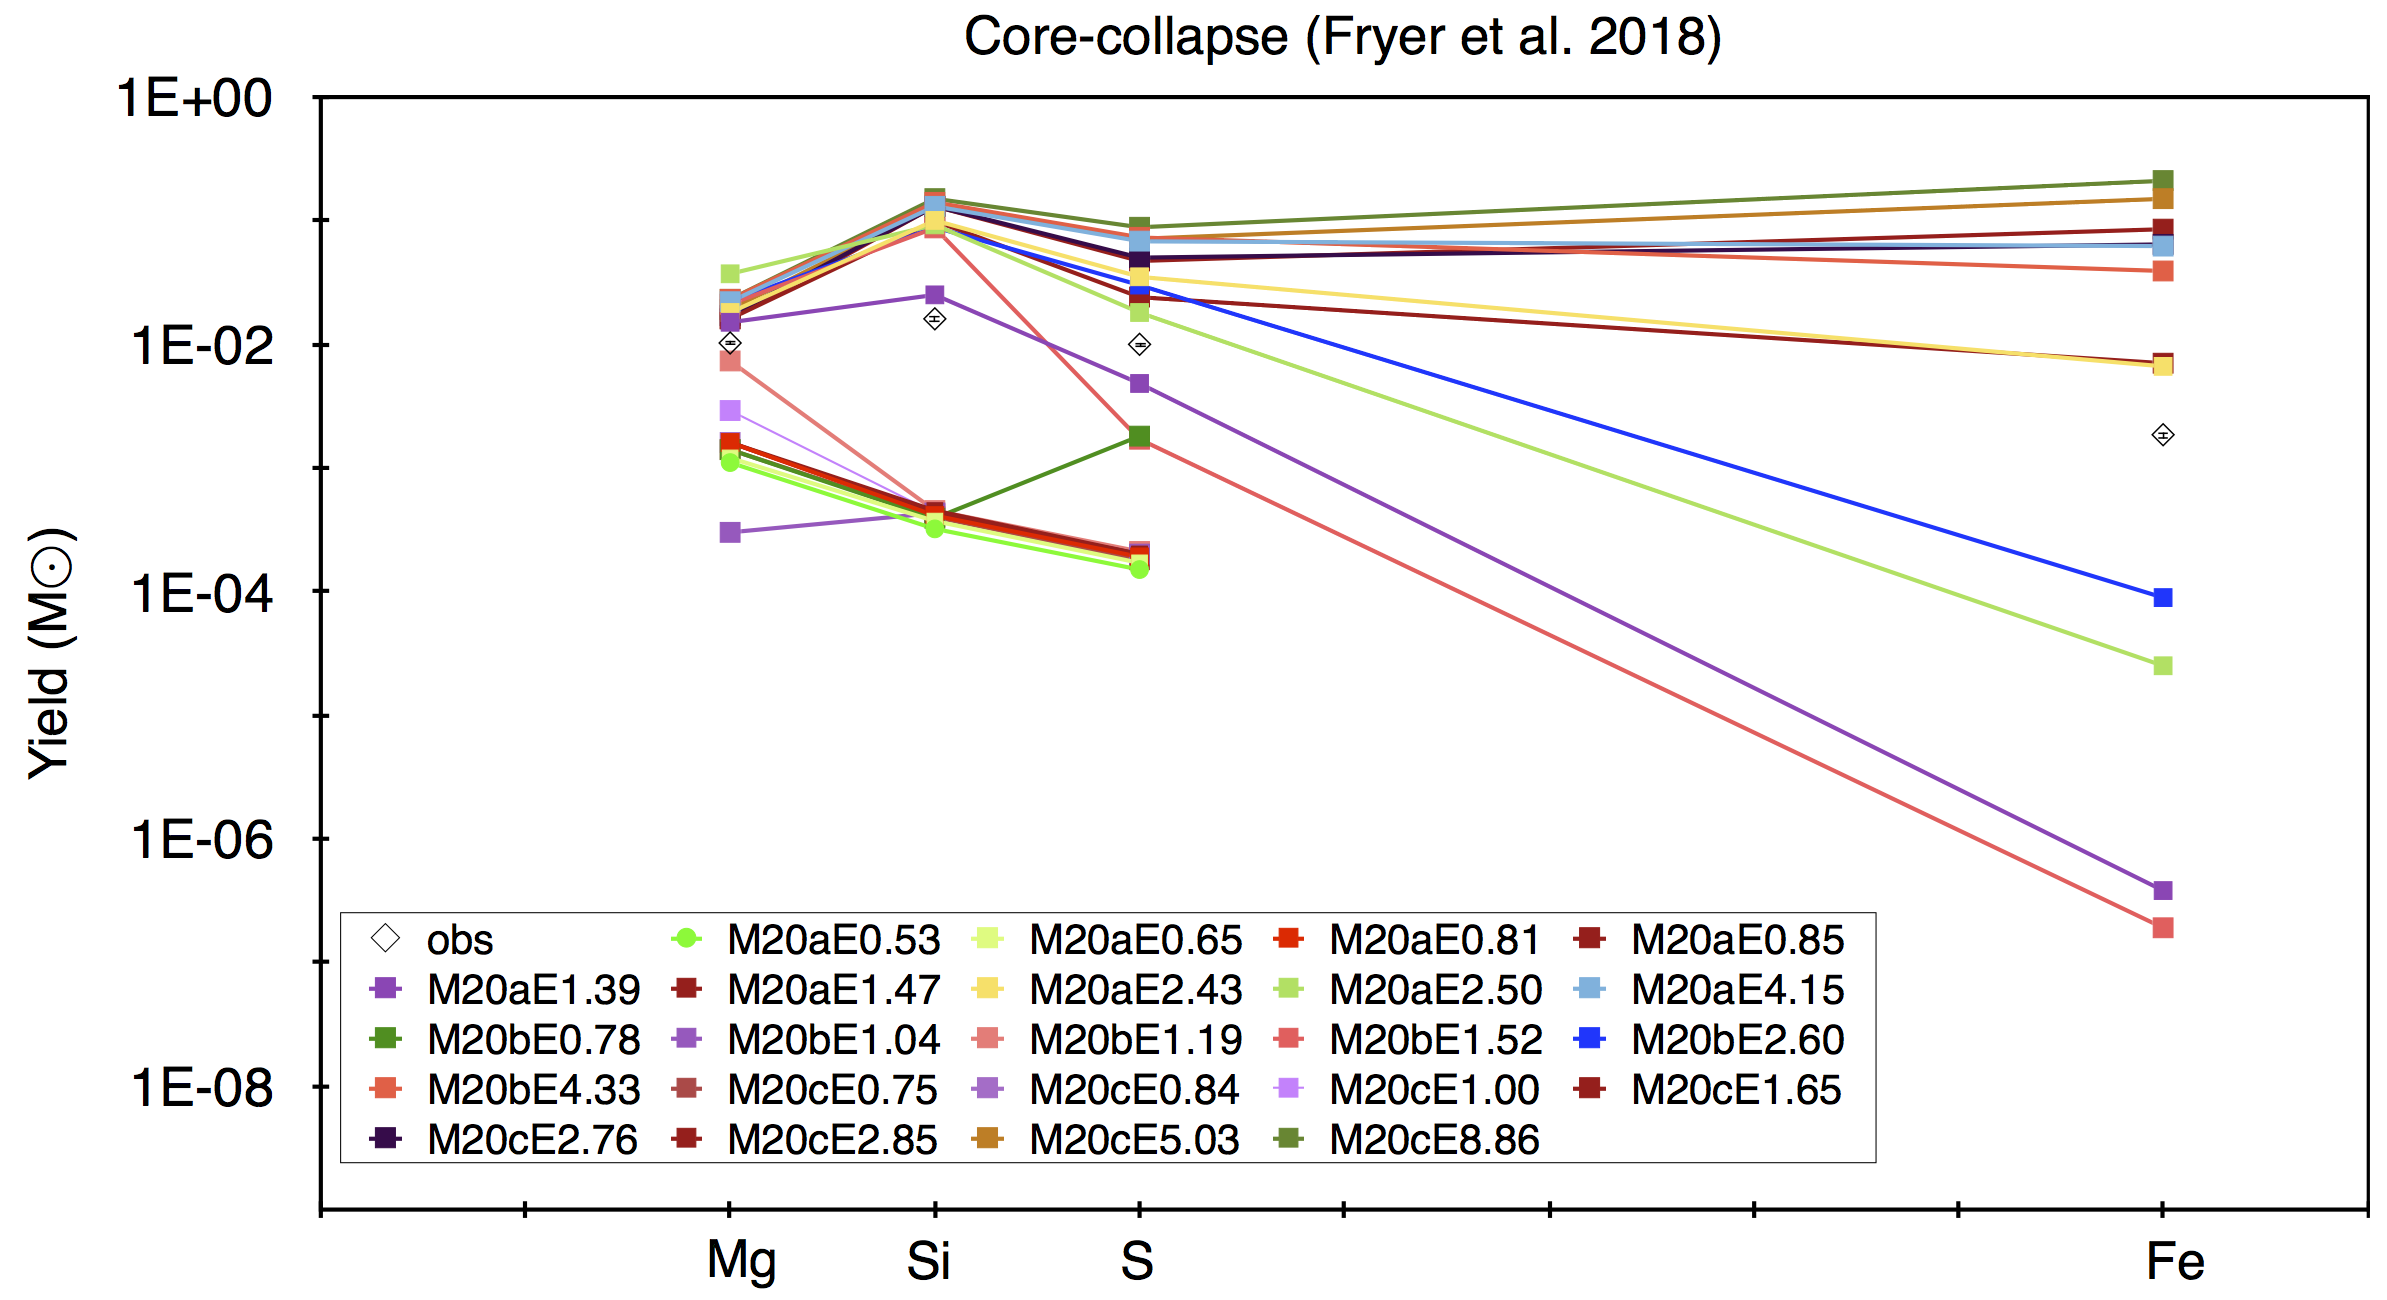
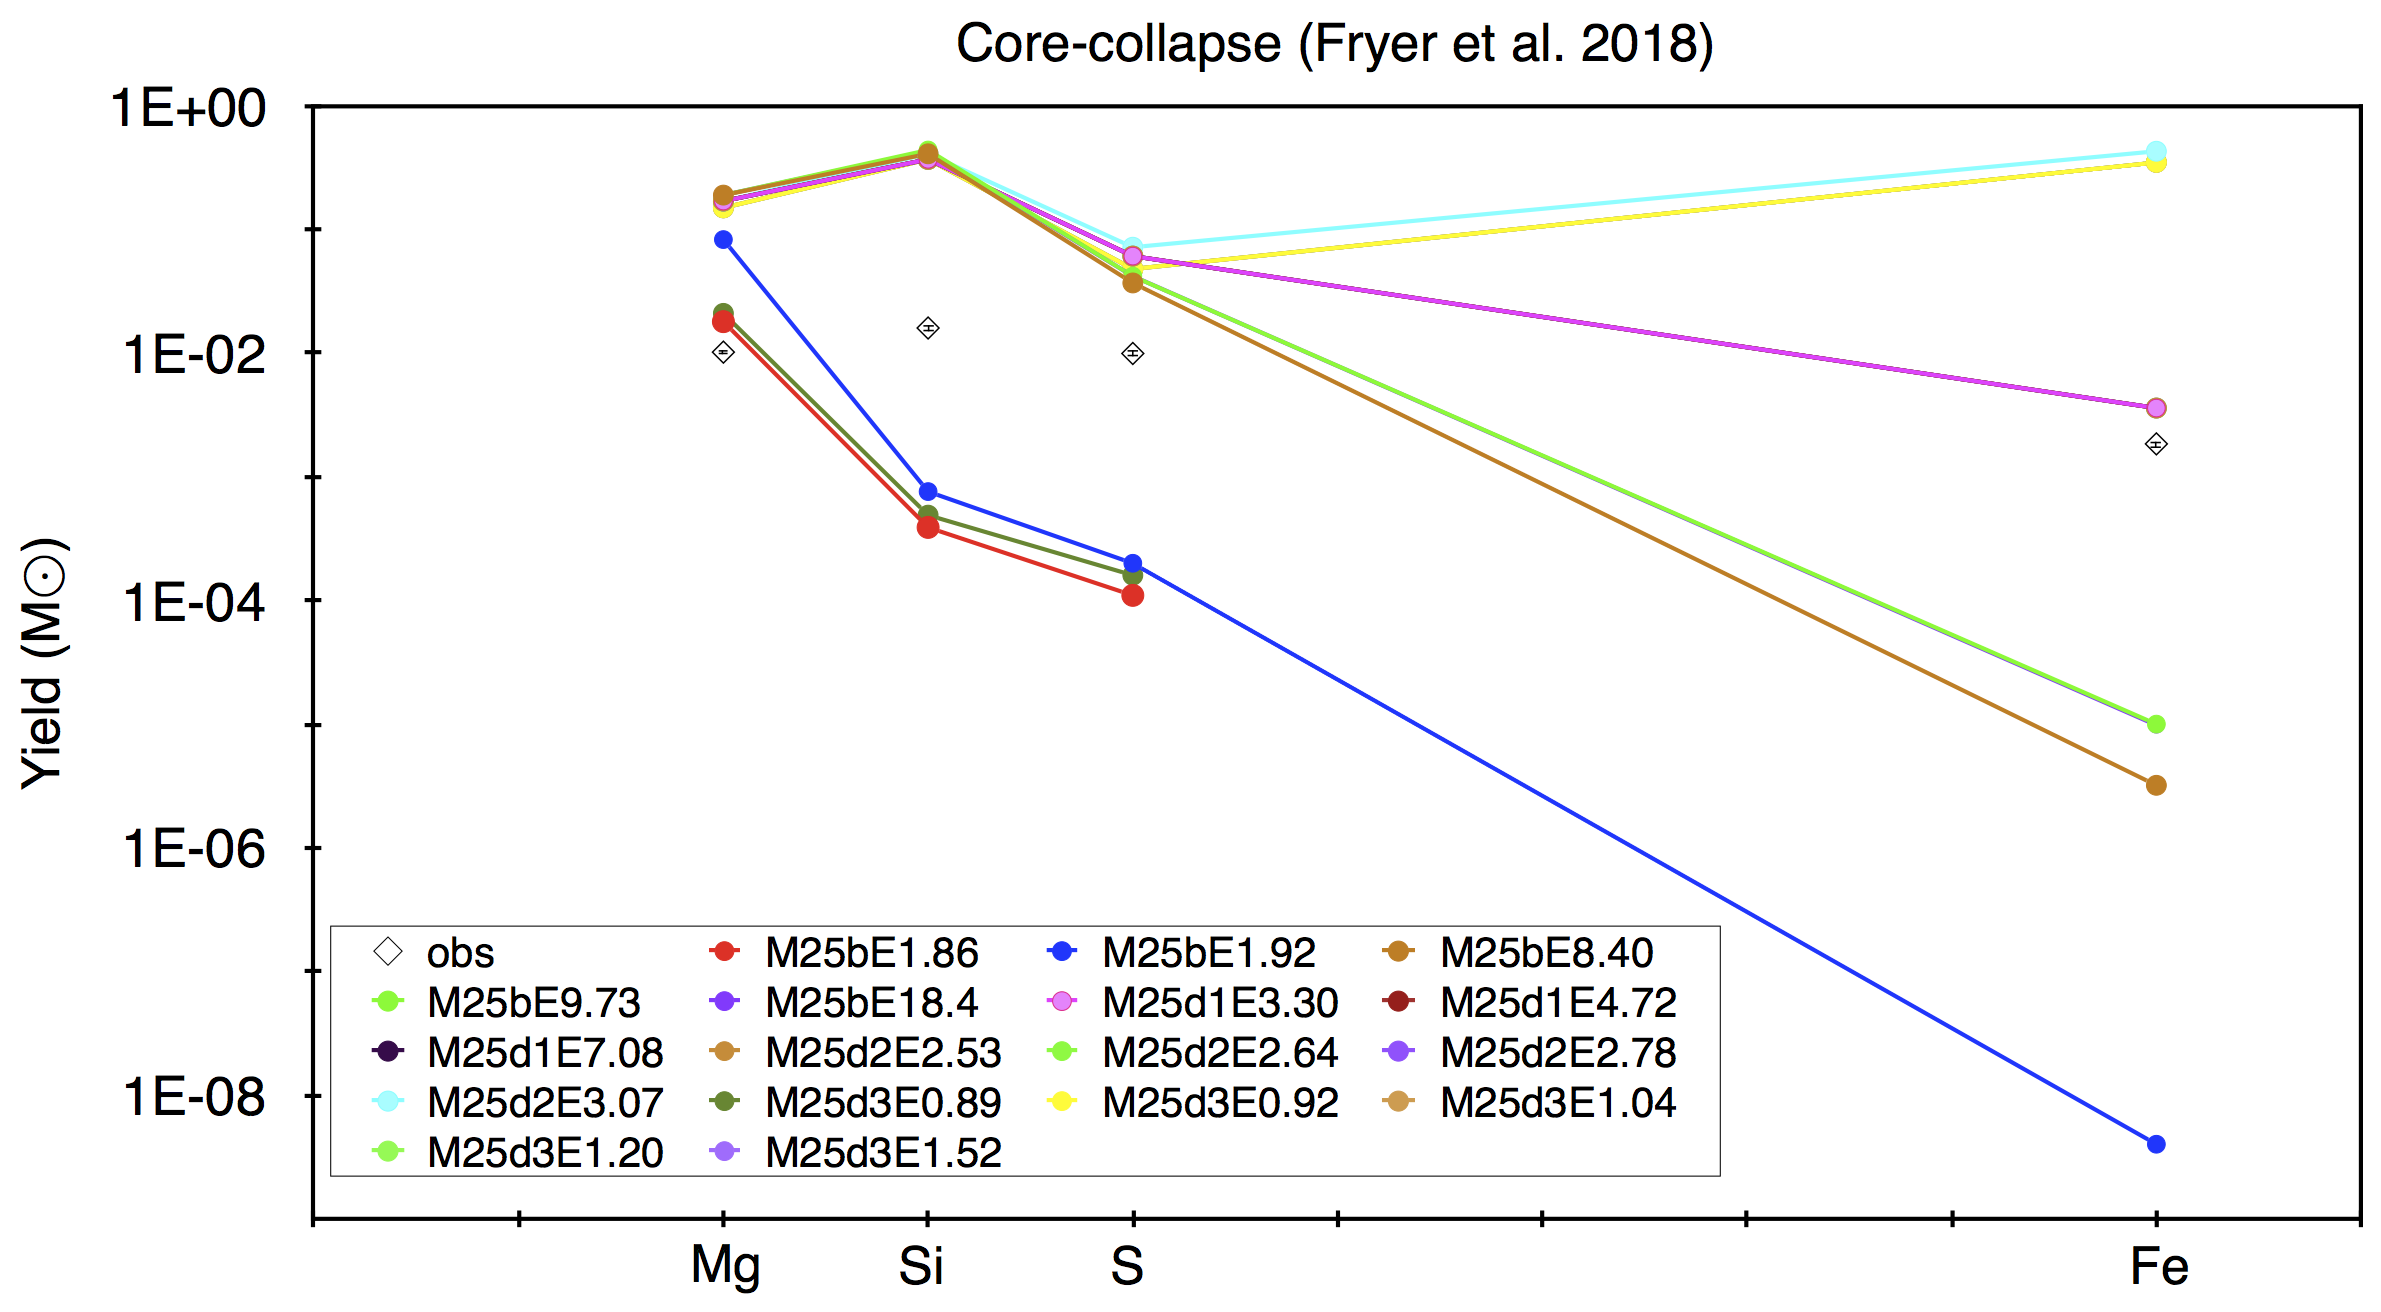
We also plotted the element masses in the X-ray-emitting gas, the Type Ia models of Nomoto et al. (1997) and Badenes et al. (2003) and the CC nucleosynthesis models with various progenitor masses of Woosley & Weaver (1995); Nomoto et al. (2006); Thielemann et al. (1996); Sukhbold et al. (2016) and Fryer et al. (2018) for comparison in Figure 3 and 4, similar to Zhou et al. (2016). In some CC models (e.g., Fryer et al. 2018), the yields are strongly dependent on the SN explosion energy. To see how the abundance depends on the progenitor mass and the explosion energy, we plotted the yields for different SN explosion energies (15, 20 and 25) as given by Fryer et al. (2018), which is shown in Figure 4. We see that none of the 25 models can explain the observed the elemental mass for this SNR. As shown in Figure 3 and 4, we found that the estimated values of 0.01, 0.016, 0.009 and 0.0018 are in good agreement with the progenitor mass of 11 (Woosley & Weaver, 1995) and between 9 and 12 (Sukhbold et al., 2016) of the CC models.
The environment of Kes 69 is suggestive of a massive progenitor star: it is interacting with MCs and the detection of IR emission from shocked molecular gas. Also its X-ray morphology has highly asymmetric nature and it is located in the Galactic plane. All these environmental and morphological typing methods support that Kes 69 has a CC origin. We note that there are no features for central compact object or a PWN in the remnant.
In summary, based on the total ejecta mass (as discussed in Section 4.1) and the result of our comparison between the element masses in the X-ray-emitting plasma and the predicted SN yields (as seen in Figure 3), we conclude that the origin of Kes 69 is a CC SN.
The centroid energy of Fe-K line (6.5 keV) corresponds to a charge number of about +18 (see Figure 1, left; Yamaguchi et al. 2014), which is consistent with cm-3 s (see Figure 5 of Hahn & Savin 2015). The low value and low centroid energy of Fe-K suggest that the CC SN exploded in the low density region.
5 Conclusions
In this paper, we analyze the archival Suzaku and Fermi-LAT data of Kes 69 and report on the spectral properties of the X-ray emission of this remnant. Our main conclusions are summarized below:
-
1.
The centre-filled X-ray emission and the radio shell-like morphology suggest that Kes 69 is a member of the MM SNR class, as noted before by Yusef-Zadeh et al. (2003).
-
2.
We confirmed the thermal origin of the central plasma and detected slightly enhanced abundances of Mg, Si, S and Fe, which suggest the possible presence of SN ejecta in Kes 69. Thus, we concluded that Kes 69 is an ejecta-dominated MM SNR candidate. Future X-ray observations with the superb high angular resolution satellites like Chandra will allow us to study the X-ray structure of the ejecta and the surrounding medium.
-
3.
The spectra can be well described by a single NEI model with a temperature of keV. The ionization time-scale is 4.1 cm-3 s, which implies that the plasma is far from ionization equilibrium, still ionizing. We found no spectral variation across the SNR. We detect the Fe-K emission line at 6.5 keV in the spectra.
-
4.
We searched for RP in Kes 69 and found that the initial plasma temperature much smaller than the current plasma temperature. Therefore, we concluded that the X-ray emitting plasma of Kes 69 is in the NEI state, not overionized.
-
5.
We investigated the origin of SN type and concluded that the origin of Kes 69 is a CC SN and its progenitor mass is most likely between 9 and 12 (see Figure 3).
-
6.
We found no significant gamma-ray emission detected from Kes 69. The lack of gamma-ray emission from this interacting MM SNR can be explained by the dominant emission mechanism depending on the location of the gas with respect to the X-ray emitting plasma and the cosmic ray acceleration site. Assuming that the only associated OH (1720 MHz) maser emission is the extended maser emission at 85 km s-1, which is lower in brightness in comparison to the one of compact maser emission, it could be a result of the interior X-ray emitting plasma rather than by the cosmic rays accelerated by the SNR shocks.
-
7.
We compared Kes 69 with other interacting MM SNRs and concluded that Kes 69 offers an interesting case because of non-detection both RP and gamma-ray emission.
Acknowledgments
We would like to thank Dr. Aya Bamba for her valuable comments to improve this paper. We thank all the Suzaku team members for their support of the observation and software development. We also thank the referee for constructive comments and recommendations. AS is supported by the Scientific and Technological Research Council of Turkey (TÜBİTAK) through the BİDEB-2219 fellowship program. TE thanks to the support of the Science Academy Young Scientists Program (BAGEP-2015). This work is supported in part by grant-in-aid from the Ministry of Education, Culture, Sports, Science, and Technology (MEXT) of Japan, No.15K05088(RY), No.18H01232(RY) and No.16K17702(YO).
Note added in proof: While this paper was under review, Nobukawa et al. (2018; arXiv:1801.07881), reported a discovery of the neutral iron line emission from Kes 69 and its flux is higher than the average of the GRXE, which agrees with our result.
Facility: Suzaku and Fermi.
References
- Abdo et al. (2009) Abdo A. A. et al., 2009, ApJ, 706, L1
- Abdo et al. (2010a) Abdo A. A. et al., 2010a, ApJ, 712, 459
- Abdo et al. (2010b) Abdo A. A. et al., 2010b, Science, 327, 1103
- Abdo et al. (2010c) Abdo A. A. et al., 2010c, ApJ, 718, 348
- Acero et al. (2015) Acero F., et al., 2015, ApJS, 218, 23
- Acero et al. (2016) Acero F., et al., 2016, ApJS, 224, 8
- Aharonian et al. (2006) Aharonian et al. 2006, ApJ, 636, 777
- Aharonian et al. (2008a) Aharonian F. et al., 2008a, A&A, 481, 401
- Aharonian et al. (2008b) Aharonian F. et al., 2008b, A&A, 483, 509
- Ajello et al. (2017) Ajello M. et al., 2017, ApJS, 232, 18
- Aleksic et al. (2012) Aleksic J. et al., 2012, A&A, 541, A13
- Albert et al. (2007) Albert J. et al., 2007, ApJ, 664, L87
- Arnaud (1996) Arnaud K. A. 1996, in ASP Conf. Ser. 101, Astronomical Data Analysis Software and Systems V, ed. G. H. Jacoby & J. Barnes (San Francisco, CA: ASP), 17
- Badenes et al. (2003) Badenes C., Bravo E., Borkowski K. J., Dominguez I., 2003, ApJ, 593, 358
- Bamba et al. (2016a) Bamba, A. et al., 2016a, ApJ, 818, 63
- Bamba et al. (2016b) Bamba, A., Sawada M., Nakano Y., Terada Y., Hewitt J., Petre R., Angelini L., 2016b, PASJ, 68, 5
- Bochow (2011) Bochow A., 2011, PhD Thesis, Ruperto-Carola University of Heidelberg
- Bocchino et al. (2012) Bocchino F. et al., 2012, A&A, 541, 152
- Borkowski et al. (2001) Borkowski K. J., Lyerly W. J., Reynolds S. P., 2001, ApJ, 548, 820
- Castro & Slane (2010) Castro D., Slane P., 2010, ApJ, 717, 372
- Condon et al. (1998) Condon J. J., Cotton W. D., Greisen E. W., Yin Q. F., Perley R. A., Taylor G. B., Broderick J. J., 1998, AJ, 115, 1693
- Cox et al. (1999) Cox D. P., Shelton R. L., Maciejewski W., Smith R. K., Plewa T., Pawl A., Rozyczka M., 1999, ApJ, 524, 179
- Ergin & Ercan (2012) Ergin T., Ercan E. N., 2012, American Institute of Physics Conference Series, 1505, 265
- Ergin et al. (2014) Ergin T., Sezer A., Saha L., Majumdar P., Chatterjee A., Bayirli A., Ercan E. N., 2014, ApJ, 790, 65
- Ergin et al. (2016) Ergin T., Sezer A., Yamazaki R., 2016, arXiv:1609.02940
- Ergin et al. (2017) Ergin T., Sezer A., Sano H., Yamazaki R., Fukui Y., 2017, ApJ, 842, 22
- Ferrand & Safi-Harb (2012) Ferrand G., Safi-Harb S., 2012, Advances in Space Research, 49, 1313
- Foster et al. (2012) Foster A. R., Ji L., Smith R. K., Brickhouse N. S., 2012, ApJ, 756, 128
- Frail (2011) Frail D. A., 2011, Mem. S.A.It., 75, 282
- Fryer et al. (2018) Fryer C. L., Andrews S., Even W., Heger A., Safi-Harb S., 2018, ApJ, 856, 63
- Green et al. (1997) Green A. J., Frail D. A., Goss W. M., Otrupcek R., 1997, AJ, 114, 2058
- Hahn & Savin (2015) Hahn M., Savin D. W., 2015, ApJ, 800, 68
- Hanabata et al. (2013) Hanabata Y., Sawada M., Katagiri H., Bamba A., Fukazawa Y., 2013, PASJ, 65, 42
- Hewitt, Yusef-Zadeh & Wardle (2008) Hewitt J. W., Yusef-Zadeh F., Wardle M., 2008, ApJ, 683, 189
- Hewitt et al. (2009a) Hewitt J. W., Rho J., Andersen M., Reach W. T., 2009a, ApJ, 694, 1266
- Hewitt et al. (2009b) Hewitt J. W., Yusef-Zadeh F., Wardle M., 2009b, ApJL, 706, L270
- Hui et al. (2011) Hui C. Y., Wu E. M. H., Wu J. H. K., Huang R. H. H., Cheng K. S., Tam P. H. T., Kong A. K. H., 2011, ApJ, 735, 115
- Ishisaki et al. (2007) Ishisaki Y. et al., 2007, PASJ, 59, 113
- Jiang et al. (2010) Jiang B., Chen Y., Wang J., Su Y., Zhou X., Safi-Harb S., DeLaney T., 2010, ApJ, 712, 1147
- Koyama et al. (2007a) Koyama K. et al., 2007a, PASJ, 59, 23
- Koyama et al. (2007b) Koyama K., Uchiyama H., Hyodo Y., Matsumoto H., Tsuru T. G., Ozaki M., Maeda Y., Murakami H., 2007b, PASJ, 59, 237
- Kushino et al. (2002) Kushino A., Ishisaki Y., Morita U., Yamasaki N. Y., Ishida M., Ohashi T., Ueda Y., 2002, PASJ, 54, 327
- Lazendic & Slane (2006) Lazendic J. S., Slane P. O., 2006, ApJ, 647, 350
- Liu et al. (2015) Liu B., Chen Y., Zhang X., Zhang G.Y., Xing Y., Pannuti T. G., 2015, ApJ, 809, 102
- Lopez et al. (2009) Lopez L. A. et al., 2009, ApJ, 706, L106
- Lopez et al. (2011) Lopez L.A., Ramirez-Ruiz E., Huppenkothen D., Badenes C., Pooley D.A., 2011, ApJ, 732, 114
- Mattox et al. (1996) Mattox J. R. et al., 1996, ApJ, 461, 396
- Nomoto et al. (1997) Nomoto K., Iwamoto K., Nakasato N., Thielemann F.-K., Brachwitz F., Tsujimoto T., Kubo Y., Kishimoto N., 1997, Nucl. Phys. A, 621, 467
- Nomoto et al. (2006) Nomoto K., Tominaga N., Umeda H., Kobayashi C., Maeda K., 2006, Nuclear Physics A, 777, 424
- Ohnishi et al. (2011) Ohnishi T., Koyama K., Tsuru T. G., Masai K., Yamaguchi H., Ozawa M., 2011, PASJ, 63, 527
- Ohnishi et al. (2014) Ohnishi T., Uchida H., Tsuru T. G. Koyama K., Masai K., Sawada M., 2014, ApJ, 784, 74
- Ozawa et al. (2009) Ozawa M., Koyama K., Yamaguchi H., Masai K., Tamagawa T., 2009, ApJL, 706, L71
- Pivato et al. (2013) Pivato G. et al., 2013, ApJ, 779, 179
- Rakowski et al. (2006) Rakowski C. E., Badenes C., Gaensler B. M., Gelfand J. D., Hughes J. P., Slane P. O., 2006, ApJ, 646, 982
- Reach et al. (2006) Reach W. T. et al., 2006, AJ, 131, 1479
- Rho & Petre (1998) Rho J., Petre R., 1998, ApJ, 503, L167
- Sato et al. (2014) Sato T., Koyama K., Takahashi T., Odaka H., Nakashima S., 2014, PASJ, 66, 124
- Sawada & Koyama (2012) Sawada M., Koyama K., 2012, PASJ, 64, 81
- Shaver & Goss (1970) Shaver P. A., Goss W. M., 1970, Aust. J. Phys. Astrophys. Supp., 14, 133
- Slavin et al. (2017) Slavin J. D., Smith R. K., Foster A., Winter H. D., Raymond J. C., Slane P. O., Yamaguchi H., 2017, ApJ, 846, 77
- Sedov (1959) Sedov L. I., 1959, Similarity and Dimensional Methods in Mechanics. Academic Press, New York, NY
- Seo & Hui (2013) Seo K.-A., Hui C. Y., 2013, JASS, 30, 87
- Serlemitsos et al. (2007) Serlemitsos P. J. et al., 2007, PASJ, 59, S9
- Seward (1990) Seward F. D., 1990, ApJS, 73, 781
- Smith et al. (2001) Smith R. K., Brickhouse N. S., Liedahl D. A., Raymond J. C., 2001, ApJ, 556, L91
- Sukhbold et al. (2016) Sukhbold T., Ertl T., Woosley S. E., Brown J. M., Janka H.-T., 2016, ApJ, 821, 38
- Suzuki et al. (2018) Suzuki H., Bamba A., Nakazawa K., Furuta Y., Sawada M., Yamazaki R., Koyama K., 2018, arXiv:1805.02882
- Tawa et al. (2008) Tawa N. et al., 2008, PASJ, 60, 11
- Thielemann et al. (1996) Thielemann F. -K., Nomoto K., Hashimoto M.-A., 1996, ApJ, 460, 408
- Tian & Leahy (2008) Tian W. W., Leahy D. A., 2008, MNRAS, 391, L54
- Uchida et al. (2012) Uchida H. et al., 2012, PASJ, 64, 141
- Uchiyama et al. (2013) Uchiyama H., Nobukawa M., Tsuru T. G., Koyama K., 2013, PASJ, 65, 19
- Vink (2012) Vink J., 2012, A&A Rev., 20, 49
- White & Long (1991) White R. L., Long K. S., 1991, ApJ, 373, 543
- Wilms et al. (2000) Wilms J., Alle A., McCray R., 2000, ApJ, 542, 914
- Woosley & Weaver (1995) Woosley S. E., Weaver T. A., 1995, ApJS, 101, 181
- Yamaguchi et al. (2009) Yamaguchi H. et al., 2009, ApJ, 705, L6
- Yamaguchi et al. (2014) Yamaguchi H. et al., 2014, ApJ, 785, L27
- Yamauchi et al. (2013) Yamauchi S., Nobukawa M., Koyama K., Yonemori M., 2013, PASJ, 65, 6
- Yamauchi et al. (2014) Yamauchi S., Minami S., Ota N., Koyama K., 2014, PASJ, 66, 2
- Yamauchi et al. (2016) Yamauchi S., Nobukawa K. K., Nobukawa M., Uchiyama H., Koyama K., 2016, PASJ, 68, 59
- Yusef-Zadeh et al. (2003) Yusef-Zadeh F., Wardle M., Rho J., Sakano M., 2003, ApJ, 585, 319
- Zhang et al. (2015) Zhang G.-Y., Chen Y., Su Y., Zhou X., Pannuti T. G., Zhou P., 2015, ApJ, 799, 103
- Zhou et al. (2009) Zhou X., Chen Y., Su Y., Yang J., 2009, ApJ, 691, 516
- Zhou et al. (2016) Zhou P., Chen Y., Safi-Harb S., Zhou X., Sun M., Zhang Z-Y., Zhang G-Y., 2016, ApJ, 831, 192