The Molecular and Ionized Gas Phases of an AGN-driven Outflow in a Typical Massive Galaxy at
Abstract
Nuclear outflows driven by accreting massive black holes are one of the main feedback mechanisms invoked at high- to reproduce the distinct separation between star-forming, disk galaxies and quiescent spheroidal systems. Yet, our knowledge of feedback at high- remains limited by the lack of observations of the multiple gas phases in galaxy outflows. In this work we use new deep, high-spatial resolution ALMA CO(3-2) and archival VLT/SINFONI H observations to study the molecular and ionized components of the AGN-driven outflow in zC400528 —a massive, main sequence galaxy at in the process of quenching. We detect a powerful molecular outflow that shows a positive velocity gradient and extends for at least 10 kpc from the nuclear region, about three times the projected size of the ionized wind. The molecular gas in the outflow does not reach velocities high enough to escape the galaxy and is therefore expected to be reaccreted. Keeping in mind the various assumptions involved in the analysis, we find that the mass and energetics of the outflow are dominated by the molecular phase. The AGN-driven outflow in zC400528 is powerful enough to deplete the molecular gas reservoir on a timescale at least twice shorter than that needed to exhaust it by star formation. This suggests that the nuclear outflow is one of the main quenching engines at work in the observed suppression of the central star-formation activity in zC400528.
1 Introduction
Powerful galaxy outflows induced by active galactic nuclei (AGN) have been invoked as one of the main drivers behind the transition experienced by massive star-forming galaxies during the main epoch of star-formation activity into “red and dead” systems (e.g., Silk & Rees, 1998; Springel et al., 2005; King & Pounds, 2015). Outflows are expected to play (at least) a twofold role in quenching the star formation activity in massive galaxies. First, they have the power to expel the star-forming material in nuclear regions to large distances ( kpc) on short timescales ( Gyr) (ejective feedback; e.g., Feruglio et al., 2010; Cicone et al., 2014; Sturm et al., 2011; Morganti et al., 2016; Veilleux et al., 2017). Second, outflows can transfer enough radiative energy to the circumgalactic medium to drastically reduce the gas accretion rate onto the host galaxy (preventive feedback; e.g., Di Matteo et al., 2005; Gabor et al., 2011; van de Voort et al., 2011).
To quantify the impact of AGN feedback in galaxy evolution it is important to understand the complex, multi-phase nature of AGN-driven outflows. This is a challenging task that requires probing winds on a wide range of physical scales ( kpc), temperatures ( K) and densities ( cm-3). The multiple outflow components include (1) very hot, quasi-relativistic winds from accretion disks observed on pc scales in X-ray spectra (Nardini et al., 2015; Tombesi et al., 2015), and (2) hundred to kilo-parsec scale atomic, molecular, and ionized winds traced by a variety of lines in absorption (e.g., H I, OH, Na I D, Fe II; Rupke et al., 2002; Sturm et al., 2011; Veilleux et al., 2013; Kornei et al., 2012; González-Alfonso et al., 2017) and emission (e.g., CO, [C II], H, [O III], etc.; Rupke & Veilleux, 2011; Contursi et al., 2013; García-Burillo et al., 2014; Woo et al., 2016; Harrison et al., 2016; Janssen et al., 2016; Concas et al., 2017). Accurate measurements of the extent, mass and energetics of AGN-driven outflows can only be achieved when more than one gas phase measurement is available, and even then, they are challenging (e.g., Mrk 231; Feruglio et al., 2010; Alatalo, 2015; Morganti et al., 2016). Part of the problem is that the electron density and the CO-to-H2 factor are required to convert ionized and molecular luminosities into outflow masses, respectively. These quantities are poorly constrained, and can introduce up to an order of magnitude uncertainty in the derived outflow masses.
Powerful AGN-driven outflows are found to be ubiquitous in typical massive galaxies at (e.g., Genzel et al., 2014; Förster Schreiber et al., 2014; Leung et al., 2017; Förster Schreiber et al., 2018a), the epoch when both star formation and nuclear activity peaks. These outflows, mostly detected in ionized gas in near-infrared spectroscopic surveys, are fast ( km s-1), can extend on large scales ( kpc), and have mass loading factors () in the range (e.g., Genzel et al., 2014; Förster Schreiber et al., 2018a).
AGN-feedback in the form of outflows is one of the main candidates to explain the observed suppression of star formation activity from nuclear regions outwards in massive, main-sequence galaxies at (also referred as inside-out quenching or growth; Tacchella et al., 2015a; Barro et al., 2016; Nelson et al., 2016). However, this would probably require mass loading factors higher than those measured in the ionized phase, which is the reason why it is so important to detect the molecular gas in outflows –most likely the wind phase carrying most of the ejected mass from the host galaxy (e.g., see compilation in Fiore et al., 2017).
Wide-band receivers on new or upgraded mm-wave arrays such as ALMA (Atacama Large Millimeter/submillimeter Array) and NOEMA (NOrthern Extended Millimeter Array) opened new windows to detect and characterize the faint (relative to the disk luminosity) molecular outflow signatures in typical massive galaxies at high . In this paper we present one case where we combine sensitive, high-spatial resolution ALMA and Very Large telescope (VLT) observations to study the molecular and ionized gas phases of the powerful galactic outflow detected in zC400528 at .
1.1 zC400528
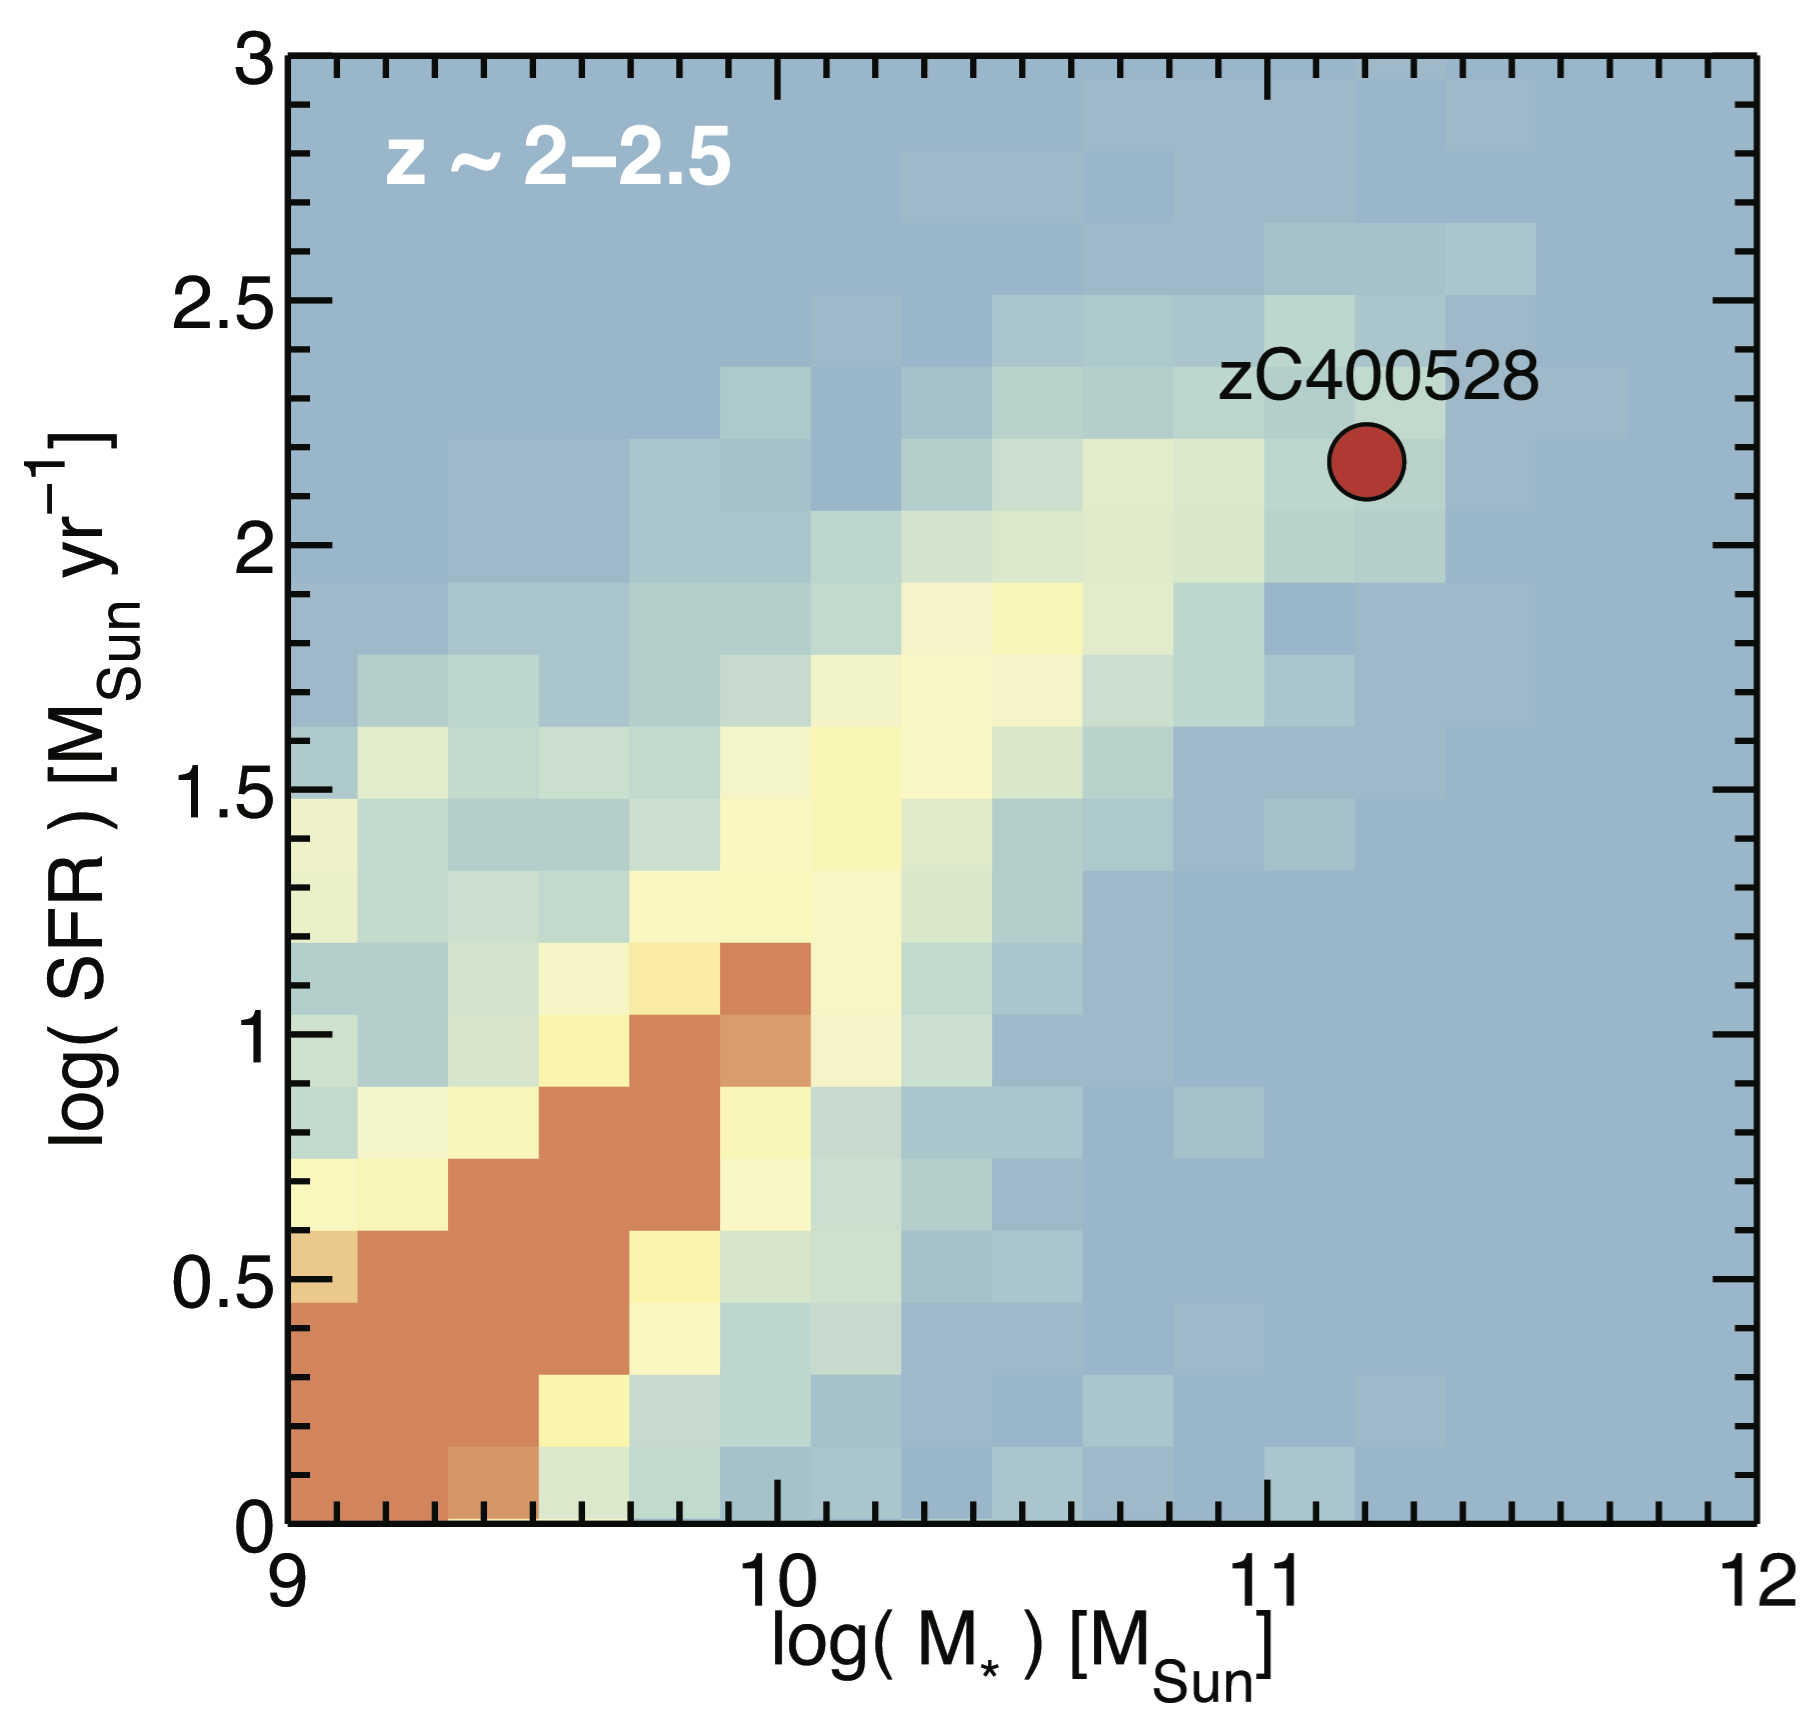
zC400528 (R.A., Decl.) is a massive (), star-forming (111Position of CO(3-2) peak.) galaxy at (Förster Schreiber et al., 2018b) located at the tip of the main-sequence relation of star-forming galaxies at (see Figure 1). This galaxy has a detected powerful ionized gas outflow that extends for about kpc (Genzel et al., 2014; Förster Schreiber et al., 2014). As discussed in Förster Schreiber et al. (2014), there is evidence for a central AGN driving the outflow that includes an observed high nuclear [N II]/H line ratio of 0.75 (Genzel et al., 2014), and a detection at 1.4 GHz that implies a M⊙ yr-1 (Schinnerer et al., 2010), exceeding its . The galaxy remains undetected in the Chandra X-ray data of the COSMOS field (Elvis et al., 2009). The flux upper limit implies erg s-1 (assuming and cm-2), although this upper-limit could be substantially higher in the Compton-thick case.
Finally, zC400528 is one of the galaxies in the study of Tacchella et al. (2015a) that shows evidence for inside-out quenching on short timescales ( Gyr) in the inner kiloparsec region (see their Figure S4, last panel). From a statistical point of view we would also expect that zC400528 will experience star-formation quenching as the fraction of quiescent galaxies with the stellar mass of zC400528 increase from 20% at to 70% at (Muzzin et al., 2013).
This paper is organized as follows. In Section 2 we describe the observations and the data reduction. In Section 3 we describe the properties (mass, size, energetics) of the molecular gas in the disk and the outflow. In Section 4 we compare the molecular and ionized phases of the outflow. In Section 5 we discuss whether the ejected molecular gas can escape the host, the impact of AGN-flickering and the expansion of the outflow, and the effect of AGN-feedback in quenching the star formation activity in the galaxy. Finally, in Section 6 we present our conclusions.
2 Observations and Data Reduction
The main goal of our observations was to detect and spatially resolve the molecular gas outflow in zC400528 using the redshifted CO(3-2) line emission as a tracer of molecular gas. Our target was first observed by ALMA in Cycle 2 for a total of 0.75 hours (0.6 hours on-source) as part of project 2013.1.00092.S (PI R. Genzel). The observations were carried out in the C34-5/6 configuration, resulting in an angular resolution of in Band 3. During the next ALMA cycle, our source was observed as part of project 2015.1.00220.S (PI R. Genzel) in a more extended configuration, C40-6, resulting in an angular resolution of in Band 3. The total observation time was 5.4 hours (4.5 hours on-source). In both cases the spectral setup included one of the spectral windows in Band 3 centered around the redshifted CO(3-2) line emission ( GHz).
The data were processed using the Common Astronomy Software Applications package (CASA; McMullin et al., 2007). The pipeline-calibrated interferometric visibilities delivered by ALMA from both cycles were then combined and imaged at 50 km s-1 resolution using natural weighting. In the combination process we took into account the different CASA visibility weights applied during Cycle 2 and 3 using the CASA task statwt.222For more details see: https://casaguides.nrao.edu/index.php/DataWeightsAndCombination The size of the restoring beam of the combined data was ( kpc) at a position angle of . By combining the data from the more extended and compact array configurations we achieved high enough spatial resolution to resolve the galaxy, and at the same time improve our ability to detect and characterize a potential extended, more diffuse component of the molecular outflow.
All values were primary beam corrected for all quantitative analyses. We reached an rms noise of 0.08 mJy beam-1 in 50 km s-1 channels for CO(3-2). No continuum emission was detected at 100 GHz.
For a detail description of the observations of the H and [N II] lines in zC400528 carried out with the near-IR integral field spectrograph SINFONI (Eisenhauer et al., 2003) at the Very Large Telescope of the European Southern Observatory (ESO) we refer to Förster Schreiber et al. (2014). In summary the galaxy was observed in -band for an on-source time of 4 hr using a natural guide star for the adaptive optics correction. The achieved angular resolution (PSF FWHM) of the final reduced data was 0.15″.
3 Results
3.1 The molecular disk
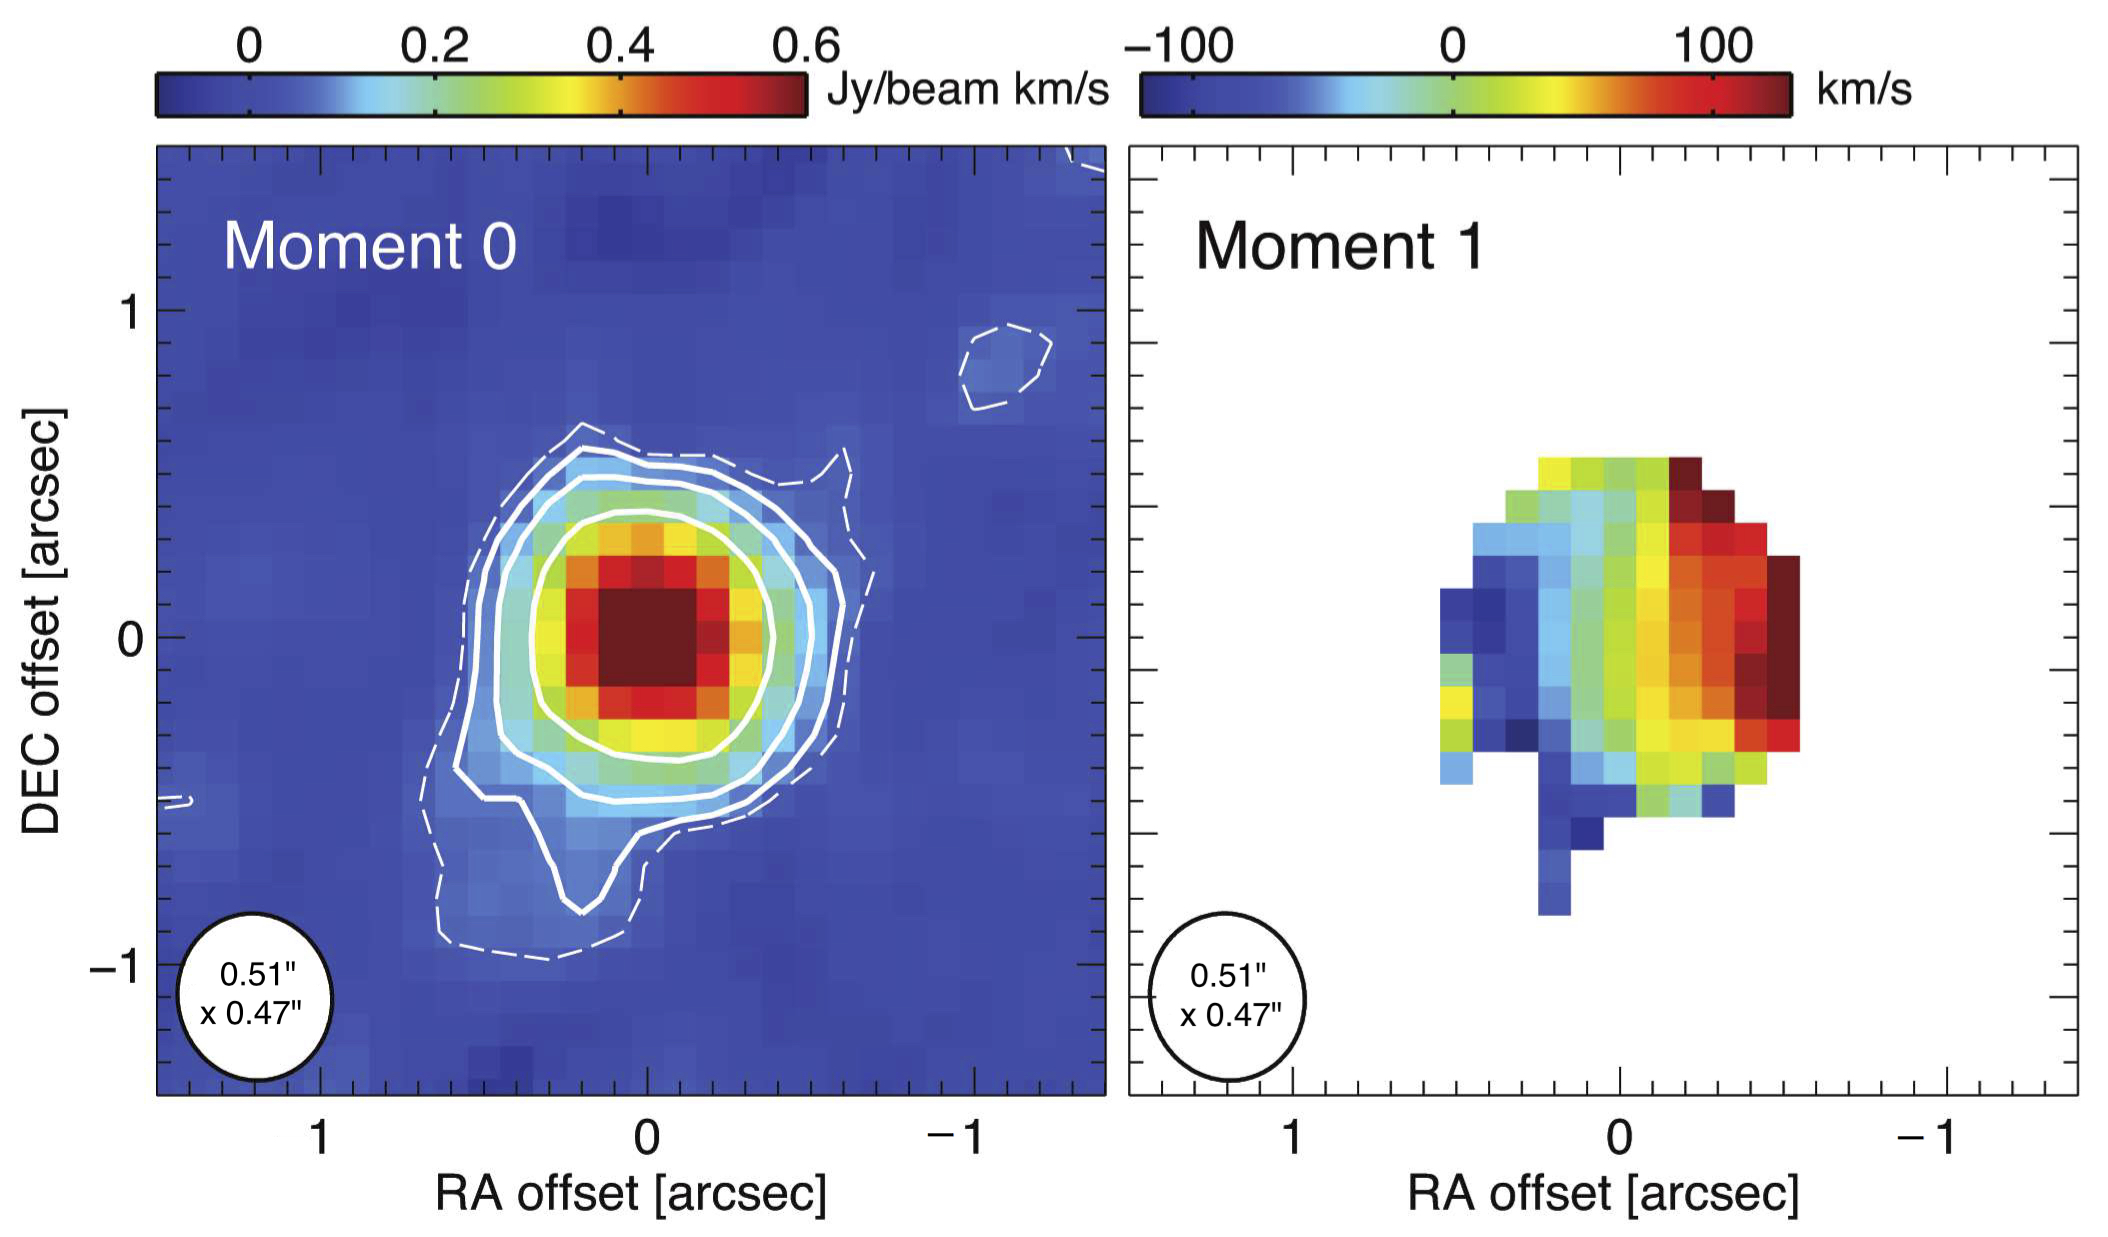
Figure 2 shows the CO(3-2) integrated intensity and velocity maps of zC400528. We measure an integrated CO(3-2) flux of Jy km s-1, which corresponds to a luminosity of . 333This measurement does not include the contribution of the outflow to the CO(3-2) emission. Please see § 3.2.1 for a description of how the molecular gas emission of the disk and the outflow was disentangled. The molecular gas mass (), assuming a conversion factor Tacconi et al. (2018)444The conversion function in Tacconi et al. (2018) corresponds to the geometric mean between the recipes as a function of metallicity of Bolatto et al. (2013a) and Genzel et al. (2015). zC400528 is a massive (), main-sequence galaxy at that according to the scaling relations in Tacconi et al. (2018) has a metallicity near solar () in the Pettini & Pagel (2004) scale. and a velocity-integrated Rayleigh-Jeans brightness temperature line ratio (e.g., Dannerbauer et al., 2009; Daddi et al., 2015; Bolatto et al., 2015), is .555The calculation of the molecular gas mass includes a helium correction factor of 1.36. This corresponds to a gas to stellar ratio of , which is consistent with typical gas mass fractions observed in massive, star-forming galaxies at (e.g., Tacconi et al., 2010, 2013, 2018).
The integrated velocity map on the right panel of Figure 2 shows that the molecular disk is rotating approximately in the east-west direction, consistent with the observed rotation in the ionized gas (Newman et al., 2013; Förster Schreiber et al., 2018b).
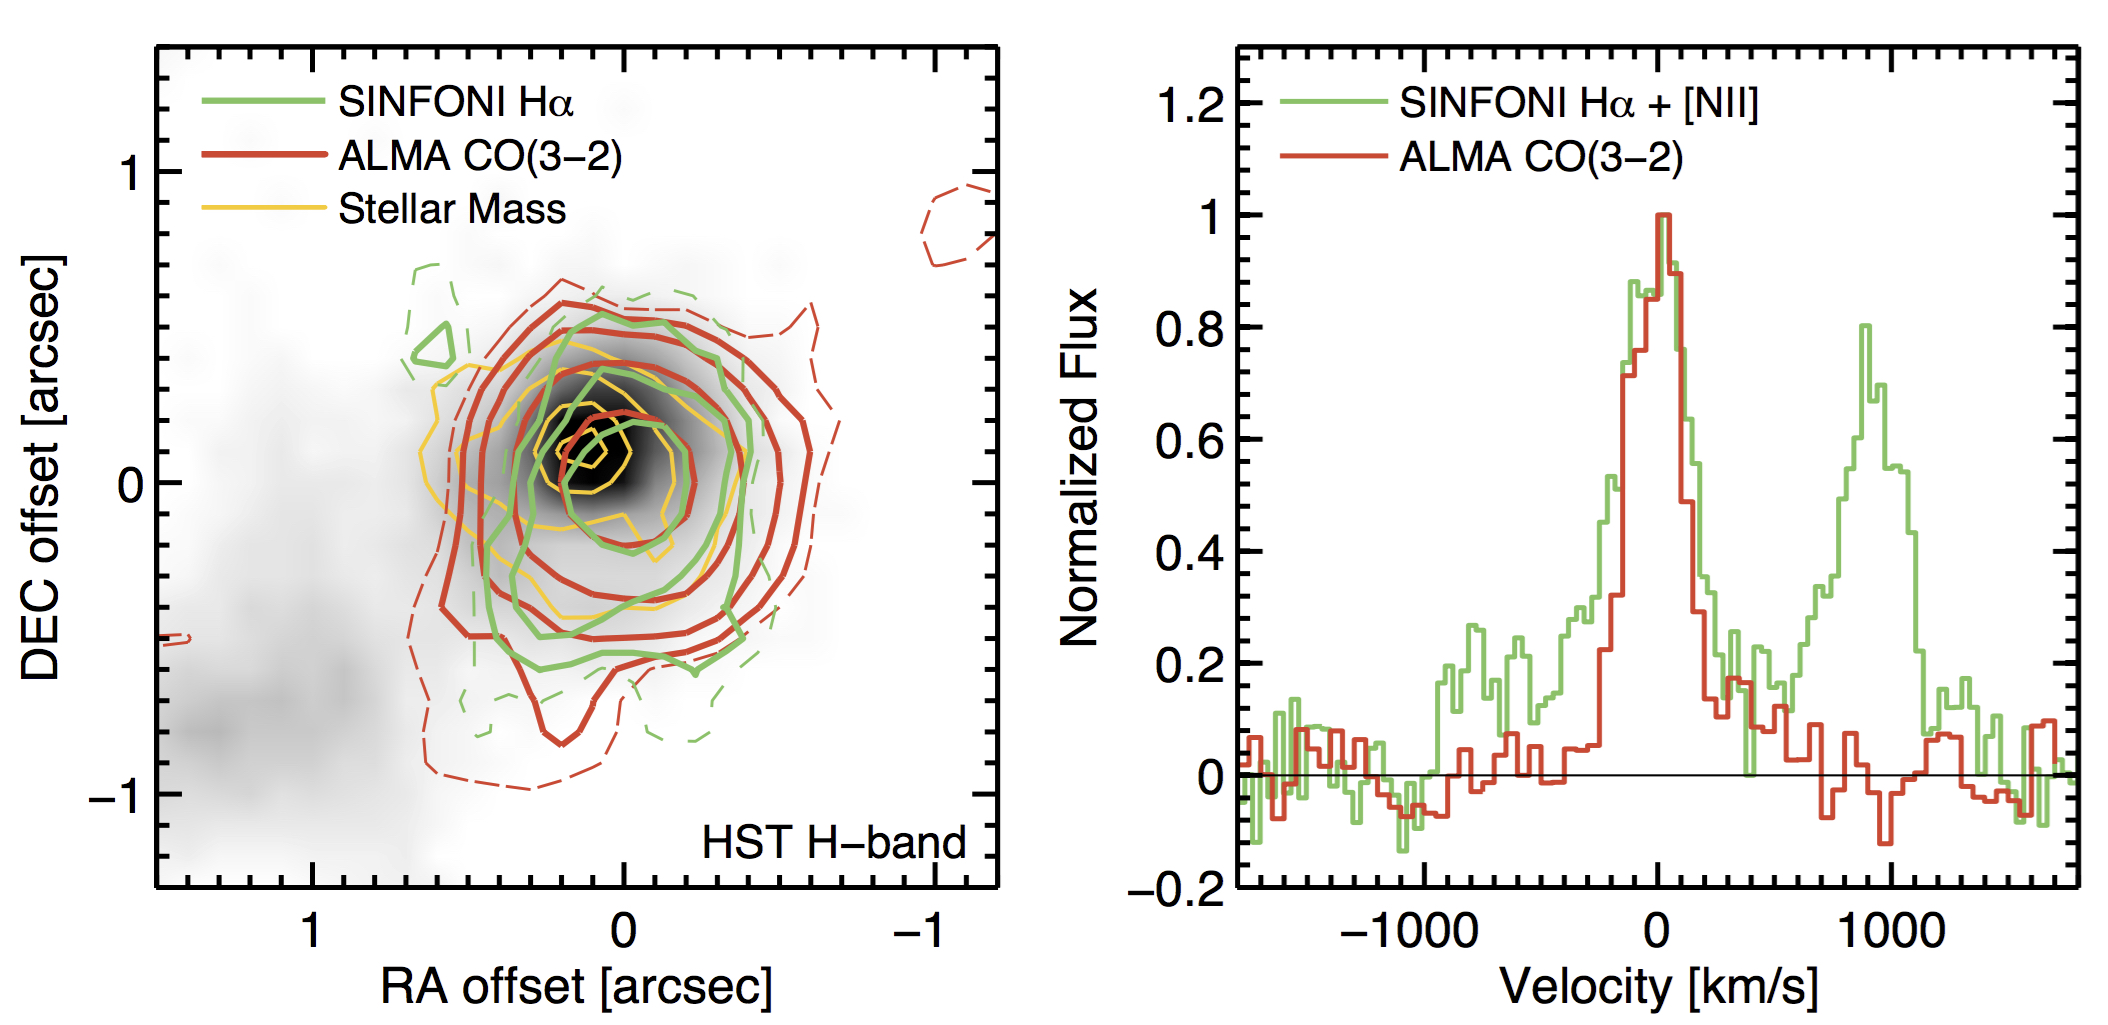
Figure 3 (left) compares the spatial distribution of the molecular gas, the ionized gas disk traced by H emission (Förster Schreiber et al., 2014), and the stellar mass traced by the HST -band (Tacchella et al., 2015b). Both molecular and ionized gas components share a similar spatial structure, including a more diffuse component that extends towards the south-east region. The peak of the -band emission is shifted north-east with respect to the peak of the ALMA CO(3-2) emission. The astrometric precision of our ALMA data is ,666According to the ALMA Technical Handbook, Chapter 10.6.6, Astrometric Observations which is at least a factor of better than the astrometrical accuracy of the HST data. Therefore, it is not possible to determine whether the spatial offset is due to physical reasons or astrometric errors.
The right panel of Figure 3 shows the CO(3-2) and H+[N II] spectrum from within a -radius circular aperture centered at the peak of emission. The [N II]/H line peak ratio is 0.8 (see also Genzel et al., 2014) which is characteristic of galaxies where the AGN contributes to the ionizing radiation or shocks affect the ionization balance (e.g., Kewley et al., 2013; Newman et al., 2014). As described in detail in Genzel et al. (2014) and Förster Schreiber et al. (2014), an ionized outflow is detected as a strong nuclear broad component in the H spectrum (detected out to velocities km s-1 relative to the systemic velocity). In the case of the CO(3-2) spectrum, we observe a high-velocity wing on the red side ([+300,+500] km s-1) that is likely the molecular component of the outflow. We analyze and interpret this high-velocity feature in the CO(3-2) spectrum in the next Section.
3.2 The molecular outflow
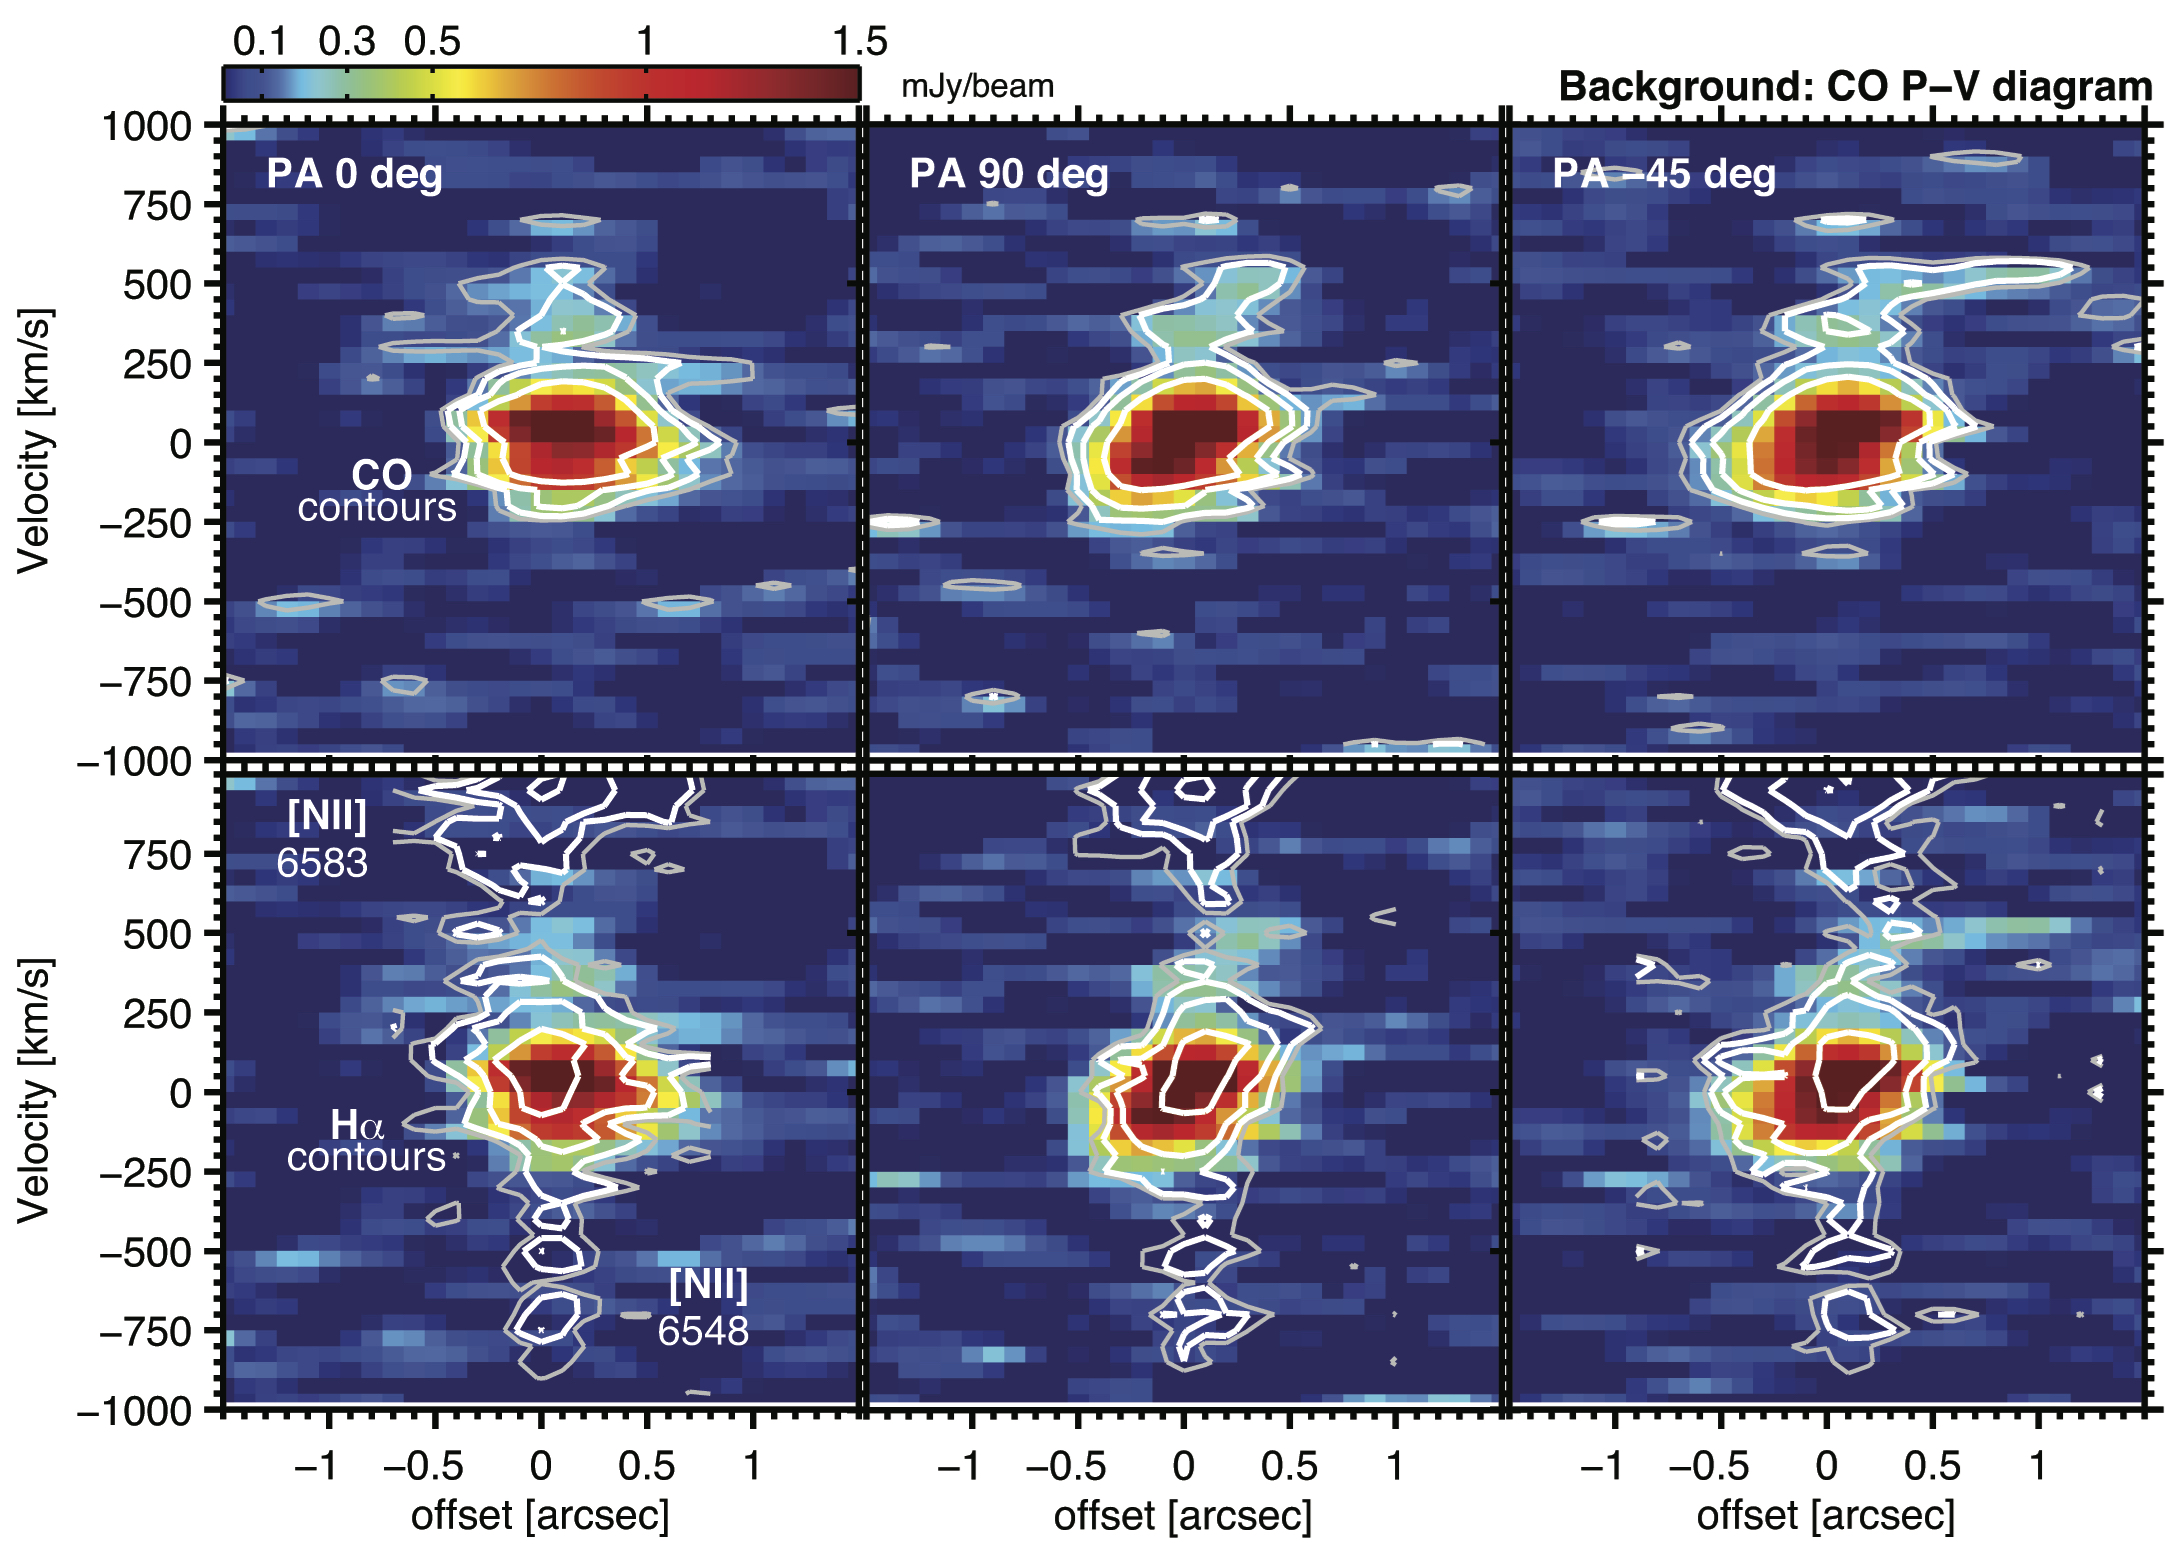
As a first step to study the high-velocity components in the ionized and molecular spectrum of zC400528, we make position-velocity (P-V) diagrams extracted along the vertical (south-north), horizontal (west-east), and (south-east to north-west) directions through the emission peak. The top panel in Figure 4 shows the results for the CO(3-2) data. We identify the rotation pattern of the galaxy in the km s-1 velocity range, and a high-velocity ( km s-1) component along all the examined directions, and that preferentially extends along the north-west direction for about ″(which corresponds to a projected distance of kpc). The contours in the bottom panels of Figure 4 show the P-V curves for the H and [N II] lines (the systemic velocity is set to match the H line central velocity) plotted on top the CO(3-2) P-V diagram. On the receding side, the outflow is detected both in ionized and molecular gas, with the latter showing a more extended spatial distribution. On the other hand, there is no molecular counterpart to the high-velocity ionized gas observed at velocities km s-1.
3.2.1 Disentangling the molecular emission from disk and outflow
To quantify the total amount of molecular gas in the outflow it is necessary to identify and remove the CO(3-2) line emission associated with the rotating disk of the galaxy. One common approach is to fit two Gaussian profiles to the spectrum where a narrow component centered at the systemic velocity is used to characterize the rotating disk, and a broad component to characterize the outflow. The flux in the broad component, however, only represents an upper limit to the actual flux from the outflowing material since it may include CO line emission at low velocities that is associated with the rotating disk. Given that we have sufficient spatial resolution and signal-to-noise (S/N) in our ALMA CO(3-2) data, here we try a different strategy to attempt to remove the low-velocity gas material.
First, we use the CASA task imfit to fit in each 50 km s-1 channel of the CO(3-2) cube a two-dimensional Gaussian to the image in the region where the source is detected. We then use the resulting fits to make a source model where the Gaussian position, orientation, and intensity changes as a function of velocity. The last step in our procedure is to remove from each slice the source model, resulting in a residual cube where the high-velocity outflowing gas is now disentangled from the emission associated with the rotating disk. A similar approach was used by Veilleux et al. (2017) to study the molecular outflow in a luminous infrared galaxy using CO(1-0) observations.
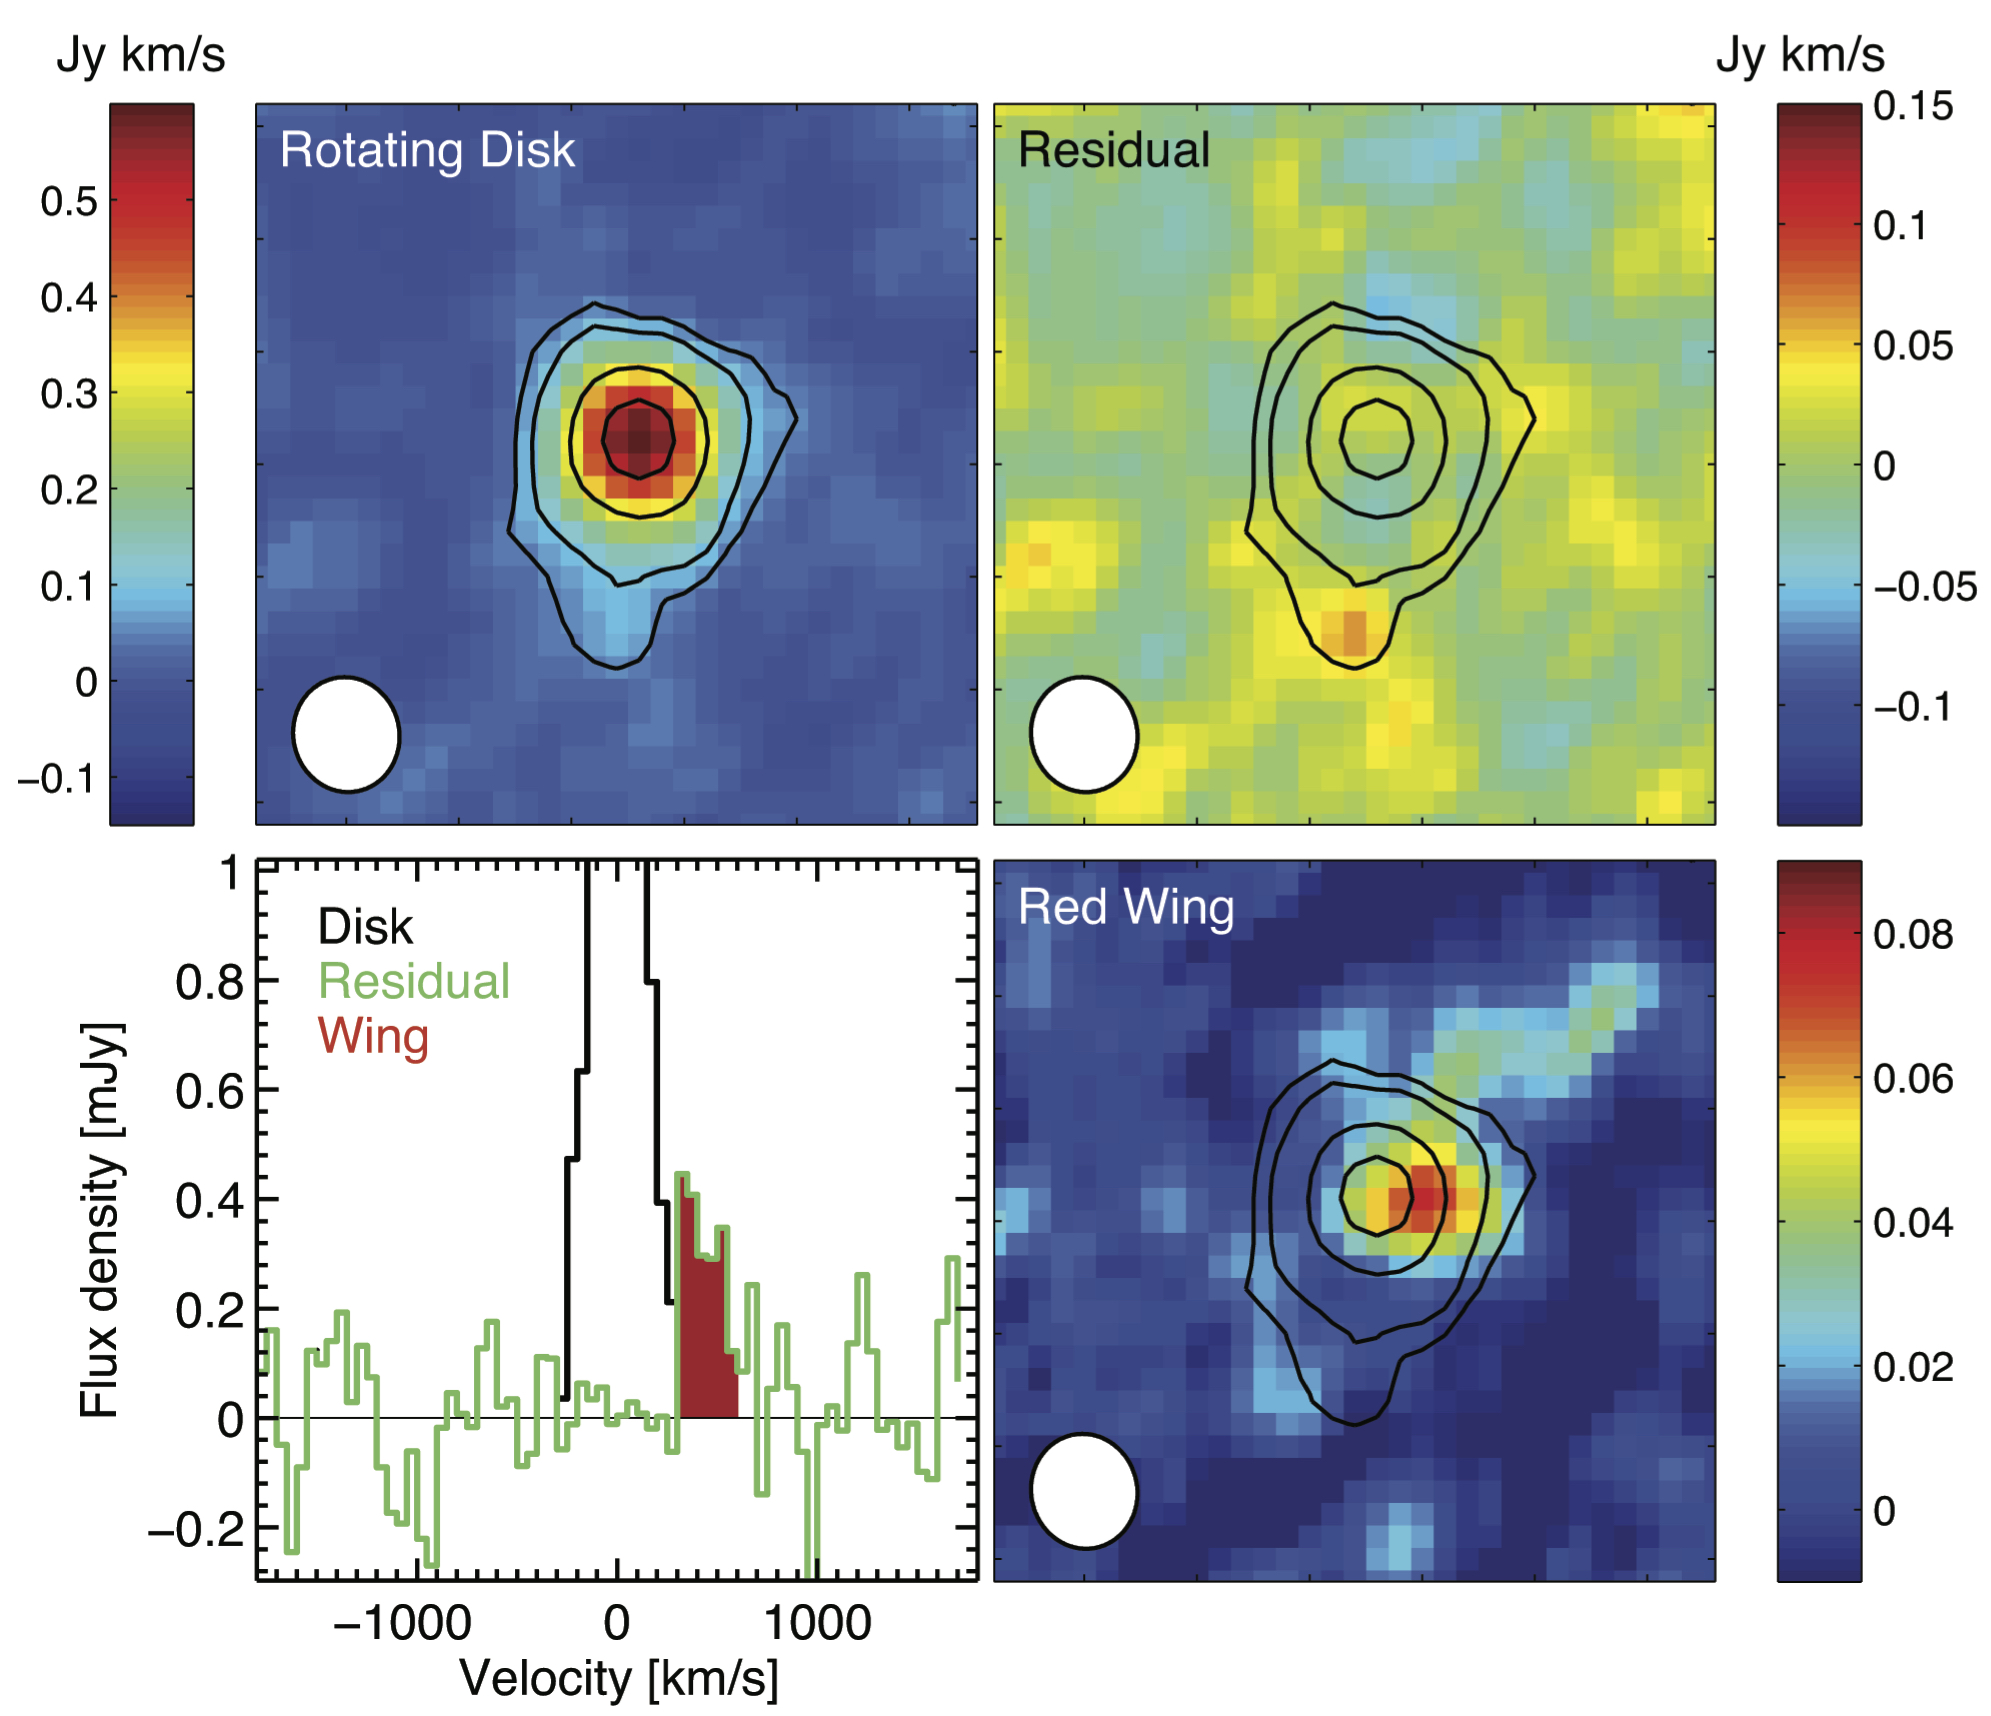
The first two panels in Figure 5 show the integrated intensity map calculated on the [250,+250] km s-1 range of the original cube (left), and the cube resulting after we subtract the rotating disk model (i.e., the residual cube; right). The model does a good job at removing the CO(3-2) line emission associated with the rotating disk, and we only observe a relatively high residual at the level of 0.06 Jy km s-1 in the more diffuse and extended south-east component. The third panel in Figure 5 shows the CO(3-2) spectrum integrated over a circular aperture with a radius of 0.5″. The black and green lines correspond to the spectrum extracted in the original cube and the residual cube, respectively. The integrated signal of the high-velocity red wing emission in the residual cube is clear, and there is no evidence for a molecular outflow component on the approaching side of the spectrum. The last panel of Figure 5 shows the integrated intensity map of the residual cube in the velocity range where we identified the red wing emission ([+300,+700] km s-1). The outflow emission peaks about 0.2″ ( kpc) west of the molecular disk center, and there is a tail of outflowing gas line emission that extends beyond the molecular disk towards the north-west for about 1″, which corresponds to a projected distance of kpc.
3.2.2 The structure of the molecular outflow
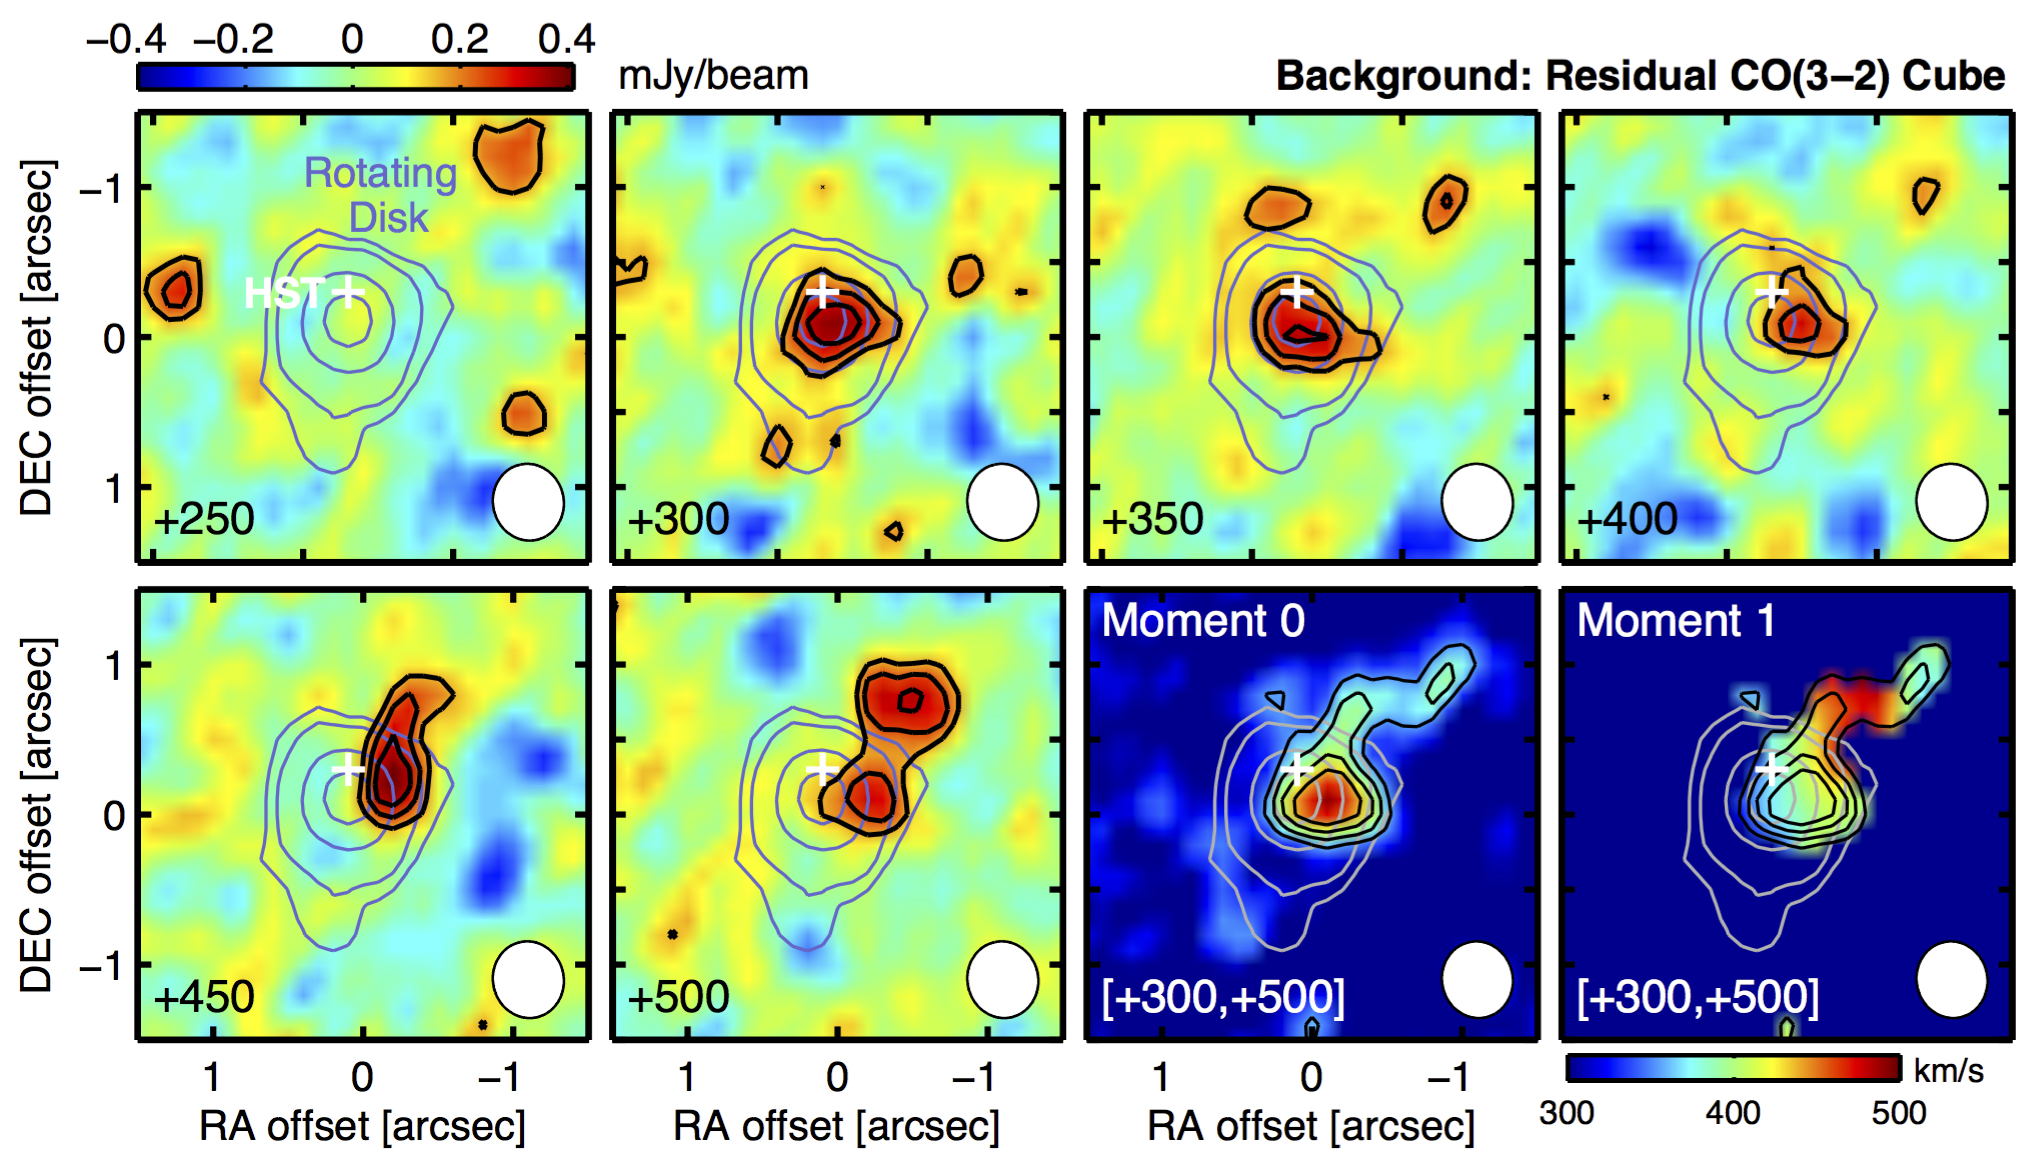
A more detailed view of the molecular outflow components as a function of velocity is shown in the velocity channel map of the residual cube in Figure 6. For reference, overplotted on each panel are the contours from the velocity integrated CO(3-2) emission of the rotating disk. The first significant outflow structure appears at km s-1 and is spatially coincident with the central region of the molecular gas disk. Between and +400 km s-1 the main component of the outflow moves towards the west about 0.2″ –which corresponds to a projected distance of kpc. At km s-1 the main outflow component starts to extend towards the north and continues until km s-1, which is the last channel at which we detect CO(3-2) line emission.
The last two panels in Figure 6 show the integrated intensity and velocity maps of the molecular outflow detected in the [+300,+500] km s-1 range. The bulk of the line emission associated with the outflow is shifted about 0.2″ (projected distance of kpc) west of the center of the molecular disk and extends to the north for approximately 0.7″ (projected distance of kpc), where it shifts to the west in what seems to appear a second outflow component –still connected to the main component– at about 1.2″ (projected distance of kpc) from the center. One could suspect that this spatially extended feature of the outflow is in reality a tidal tail product of the interaction with a lower mass companion, but visual inspection of a deep HST F160W image of the field reveals no stellar emission associated to a close neighbor in the north-east quadrant.
We observe a velocity gradient in the outflow: the gas velocity increases from to km s-1 as the outflow extends north of the nucleus. This could be indicative of an accelerating continuous outflow. Another possibility could be that the ejection of molecular gas triggered during the last outflow burst had a distribution of velocities, so the faster ejecta components traveled further away than the slower components. The velocity of the most distant outflow component in the north-west has a velocity of km s-1, a lower velocity that could be the result of gravitational pull.
In summary, perhaps the most striking characteristic of the molecular outflow in zC400528 is its asymmetry: we only detect the receding component of the wind. In the local universe is not uncommon to observe asymmetric outflows. For example, Pereira-Santaella et al. (2018) find that in four out of five spatially resolved molecular gas outflows in ULIRGs the receding component of the wind is stronger than the approaching one. This is also true for the molecular outflow in Mrk 231 (Cicone et al., 2012; Feruglio et al., 2015) and the western nucleus of Arp 220 (Barcos-Muñoz et al., 2018). High-resolution simulations of isolated disks also find that AGN-driven outflows are typically unipolar as a result of dense cloud structures in the vicinity of the black hole blocking the expansion in one direction (Gabor & Bournaud, 2014). Another possibility is that the molecular outflow on the approaching side experienced a change of phase, similar to what is observed in M82 where the dominant phase of the wind transitions from molecular to atomic at about one kiloparsec distance from the disk (Leroy et al., 2015).
3.2.3 The molecular gas mass in the outflow
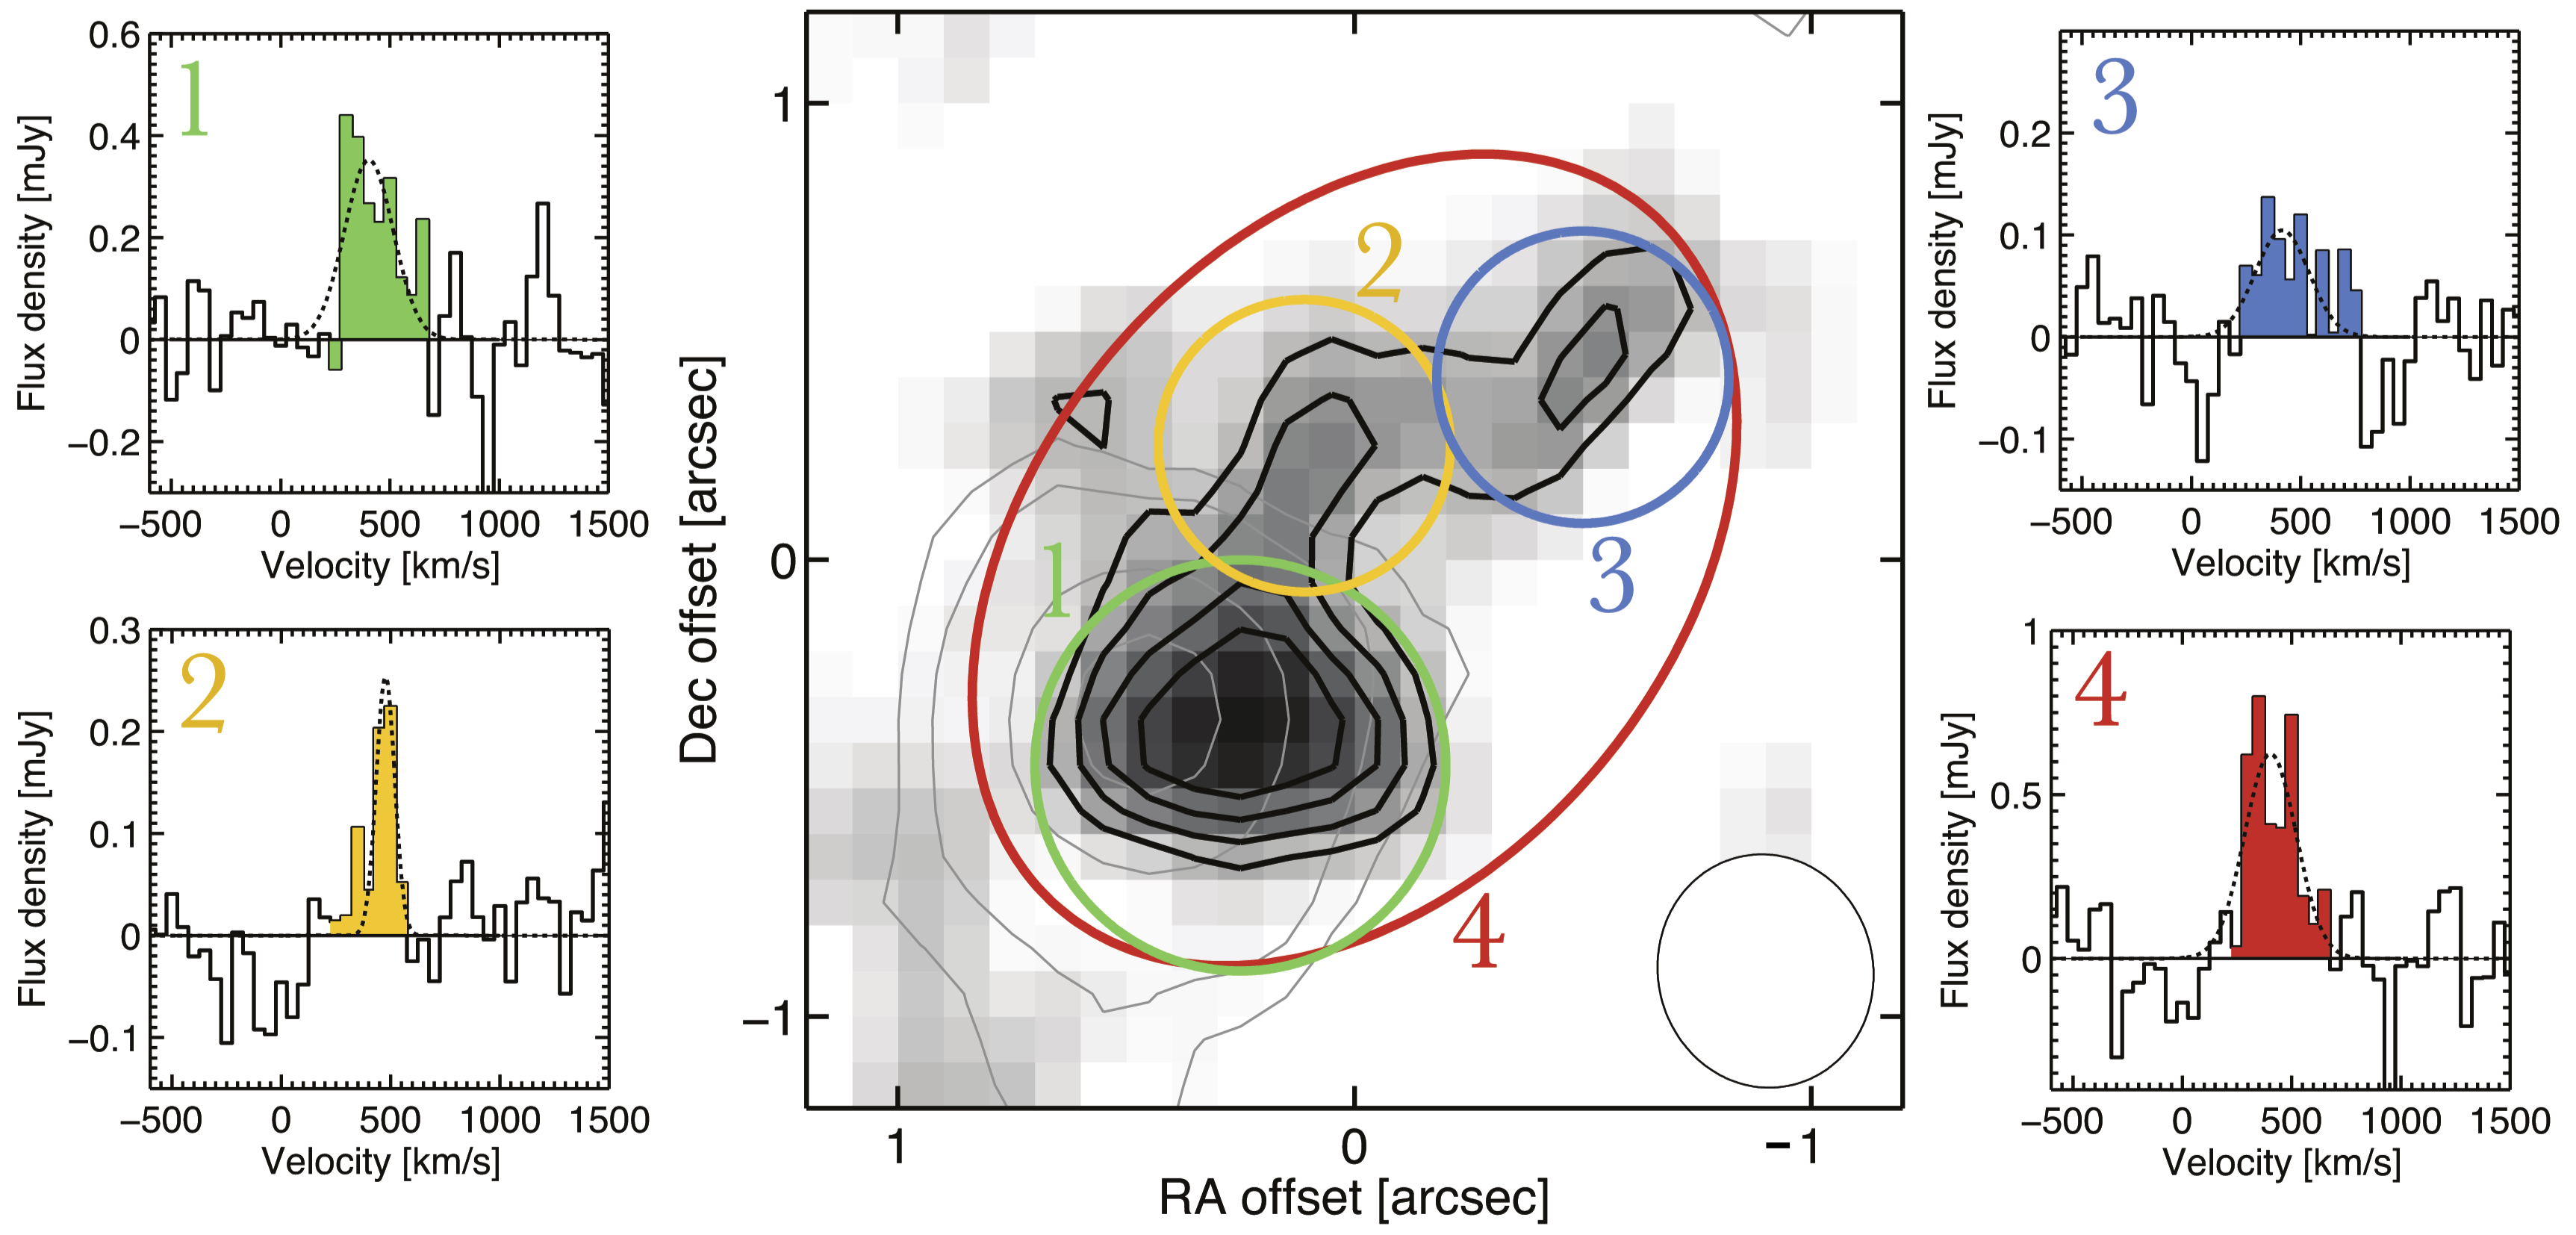
For each outflow component, we measure CO(3-2) flux densities with Gaussian fits to the spectra in the residual cube extracted from the circular and elliptical apertures shown in Figure 7. The flux densities are listed in Table 1.
How to convert these flux densities associated with the outflow into molecular gas masses is still an open question. The CO-to-H2 conversion factor depends mainly on the metallicity and the surface density of the gas (e.g., Bolatto et al., 2013a). In the case of the CO gas in the outflow, in the literature there are three CO-to-H2 conversion factors commonly used: (1) a Galactic conversion factor of (Bolatto et al., 2013a); (2) a ULIRG-like conversion factor of (e.g., Cicone et al., 2014; Feruglio et al., 2015; Veilleux et al., 2017), and (3) an optically-thin conversion factor of (e.g., Bolatto et al., 2013b; Richings & Faucher-Giguère, 2018). Assuming that the molecular gas in outflows is optically thin –as observed for example in the jet accelerated wind of IC 5063 (Dasyra et al., 2016)–, would yield the most conservative (or “minimum”) estimate of the molecular gas masses.
In this paper we adopt the ULIRG-like conversion factor (), which seems to be a good compromise given the range of conversion factors available. In addition, the detection of dense molecular gas entrained in the outflow of starbursts and LIRGs (e.g., Aalto et al., 2012, 2015; Walter et al., 2017) argues in favor a conversion factor higher than . In the main streamer of NGC 253, for example, the outflowing gas is not optically thin, as a the observed CO(2-1) to CO(1-0) brightness temperature line ratio is about unity (Zschaechner et al., submitted to ApJ). We also expect that the molecular gas in the outflow is likely not cold but warm, because it has been shocked at some level and/or it is immersed in hot gas and subjected to a substantial external radiation field. In that case the physical conditions of the molecular gas in the wind better resemble those found in the ISM of (U)LIRGs rather than the Milky Way.
The molecular gas masses for each of the outflow components are listed in Table 1. The total molecular gas mass in the outflow of zC400528 is
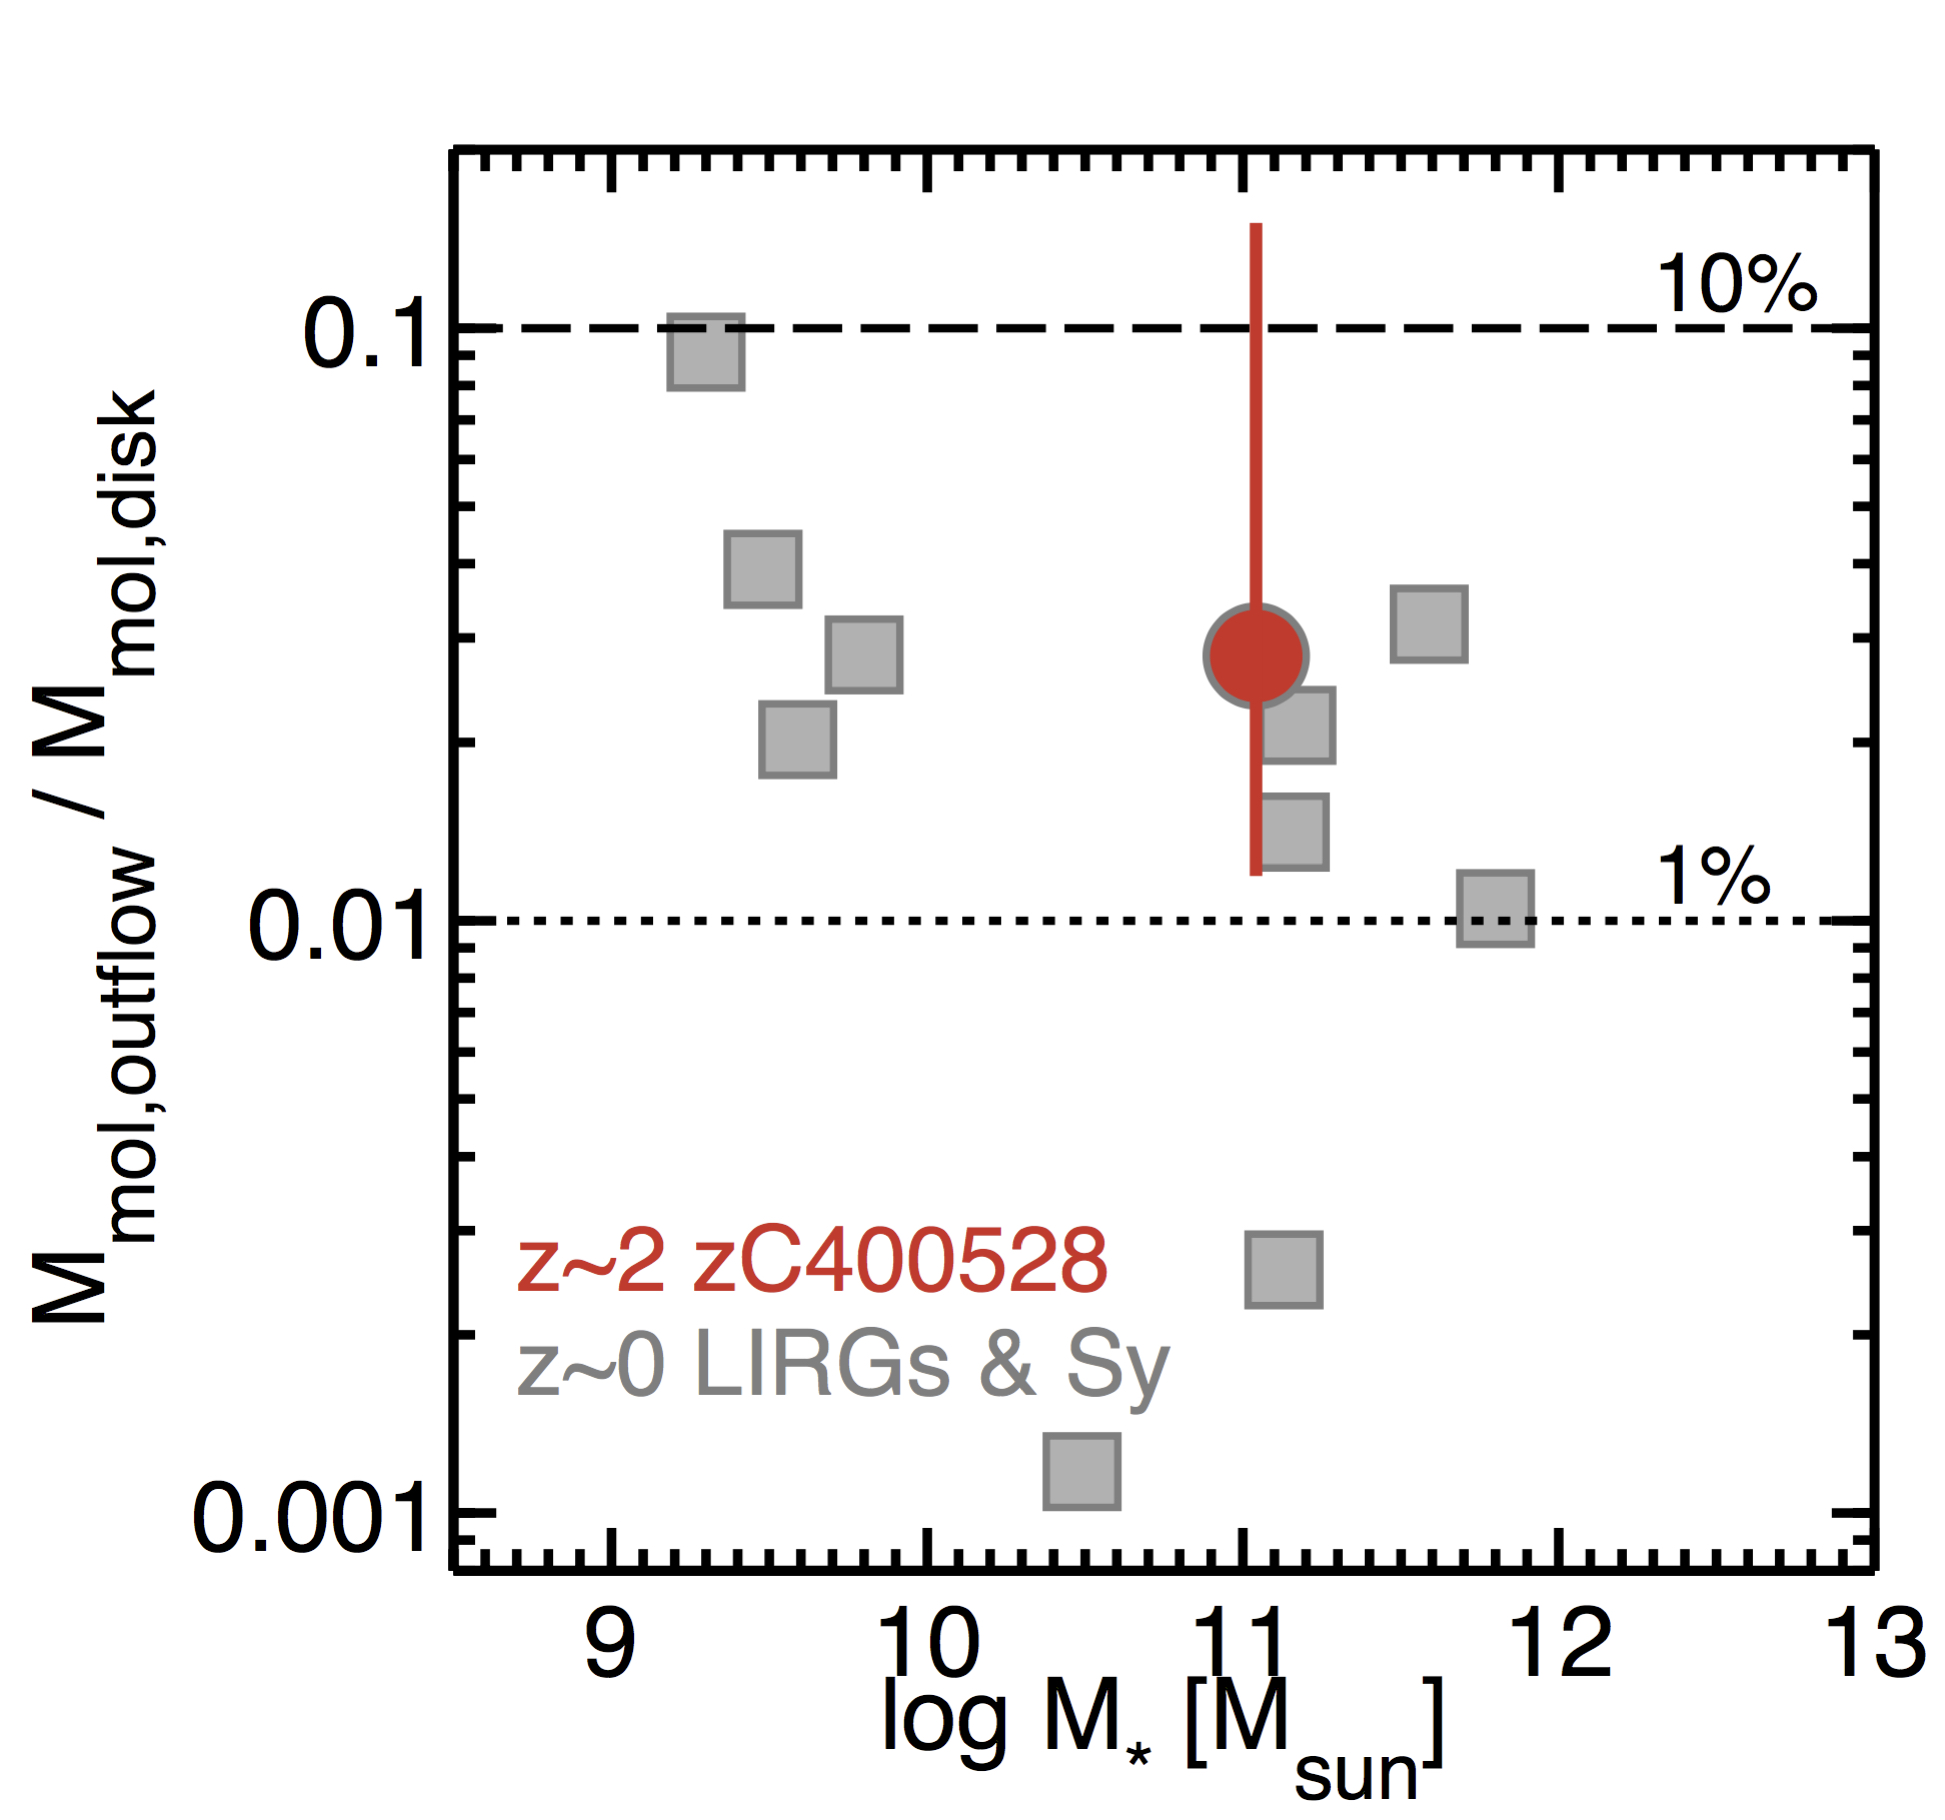
which corresponds to of the molecular gas mass in the disk. As Figure 8 shows, this fraction is similar to those measured in local (U)LIRG and Seyfert galaxies of similar stellar mass (Fiore et al., 2017, and references therein)777Note that for the bodies of starburst and (U)LIRGs drawn from the literature that are outliers in the local main-sequence relation ( dex) we use the CO-to-H2 conversion factor from the scaling relation in Genzel et al. (2015) to calculate their molecular gas masses. This conversion factor is a factor lower for starbursts and (U)LIRGs galaxies depending on their specific star formation rate, and similar to that in Tacconi et al. (2018) for main-sequence galaxies..
| Component | Integrated Flux | aaMolecular gas masses calculated using an conversion factor. The values in parenthesis correspond to the molecular gas masses we would obtain if we apply a or conversion factor, respectively. |
|---|---|---|
| # | [Jy km s-1] | [] |
| 1 | 1.81 | |
| 2 | 0.50 | |
| 3 | 0.59 | |
| 4 | 3.36 |
3.2.4 Molecular mass outflow rate
There are two common approaches to measure outflow mass rates in galaxies. There are often referred as instantaneous (maximum) and average (minimum), and a detailed description of the assumptions that go into the calculations can be found in Rupke et al. (2005). In the instantaneous approach the outflow mass rate () is calculated as the product of the outflow gas mass and the timescale taken by the gas to cross the thickness of the outflowing shell, i.e.,
| (1) |
where is the velocity of the outflow and () is the thickness of the outflow shell. This approach has been used in a number of studies including Sturm et al. (2011) and González-Alfonso et al. (2014).
In the case of the average approach, the assumption is that the outflowing gas extends to , so the outflow mass rate () is given by the outflow gas mass time-averaged over the flow timescale, i.e.,
| (2) |
If the emitting volume (spherical or multi-conical) is filled with uniform density, then the mass outflow rate in Eq. 2 should be a factor of 3 higher (e.g., Feruglio et al., 2010; Maiolino et al., 2012; Rodríguez Zaurín et al., 2013; Fiore et al., 2017).
In this paper we use the average approach, which represents a more conservative way to characterize the outflow than the instantaneous method as is smaller than by a factor . Following this, the first step is to calculate the flow timescale, . As described in §3.2.2, zC400528 has three main molecular outflow components. If we estimate the flow timescale based on the maximal extension of the outflow, then yr. A more representative or characteristic timescale would result from considering only the main outflow component (which corresponds to regions 1 and 2 in Figure 7). This component encompasses % of the outflow total mass, has a size of ( kpc; calculated from a two-dimensional Gaussian fit and deconvolved from the beam), and shows a positive velocity gradient in the [+350,+500] km s-1 range. From these values the resulting flow timescale is yr, which yields a mass outflow rate of:
This translates into an outflow depletion time () of
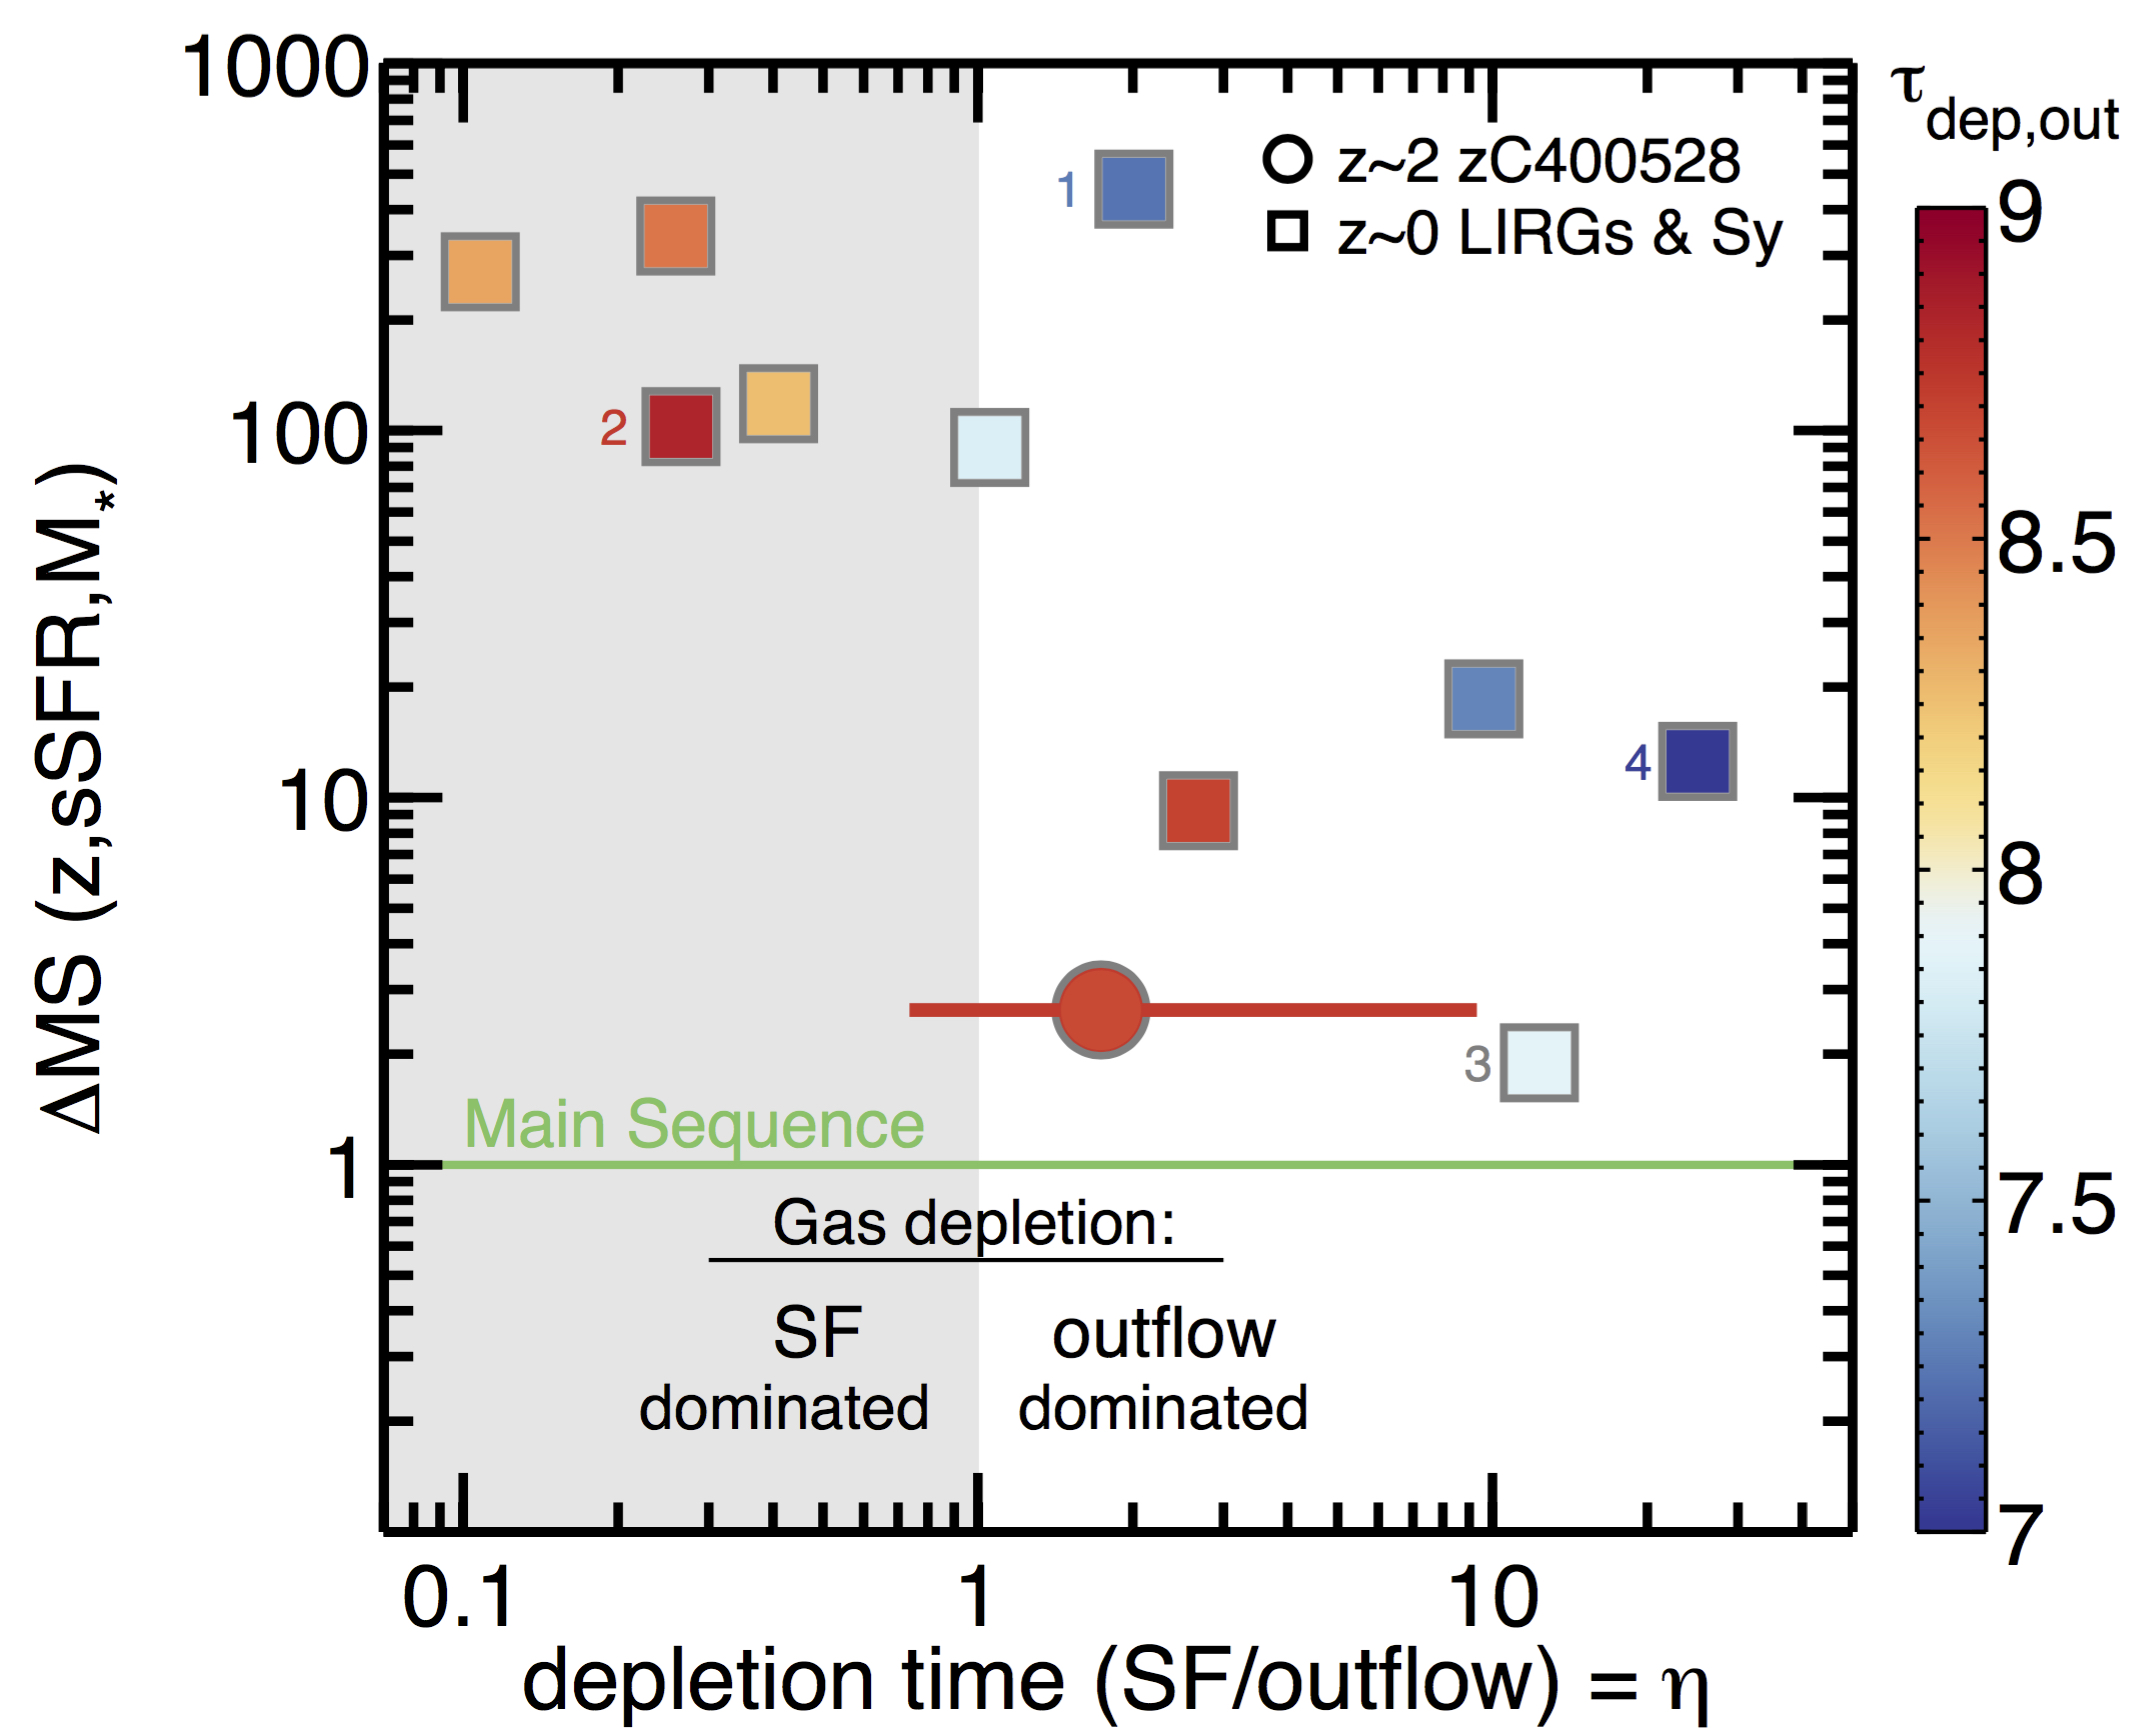
Compared to the star-formation depletion timescale (), is a factor of shorter – or equivalently, the mass loading factor in the molecular phase () is .
A more common approach used in outflow studies to measure mass loss rates consist in fitting the system line emission using two Gaussian components – a narrow component for the disk and a broad component for the outflow. The “maximum” projected velocity of the outflow component is then defined as the centroid velocity plus one-half the velocity width (e.g., Rupke et al., 2005; Veilleux et al., 2005). Following this method we measure M⊙ and km s-1. If we consider these values and the maximum projected extension of the outflow, kpc, we calculate a mass loss rate of M⊙ yr-1. This result is consistent, within the uncertainties involved in the calculation, to that we derived using the method adopted in this work described in §3.2.1.
So far we have ignored the effect that the inclination of the outflow has on the determination of the mass outflow rate, and consequently, the outflow depletion timescale. The reason is that we do not have enough information to constrain the geometry of the outflow. If corresponds to the inclination angle of the outflow with respect to the line-of-sight, then the deprojected outflow size is and the deprojected outflow velocity is . This implies that the inclination corrected mass outflow rate is proportional to . zC400528 has an inclination of (; Förster Schreiber et al., 2018b). If we assume that the outflow is perpendicular to the disk, then the deprojection effects in velocity and radius almost cancel out and the correction is small and of the order of .
Figure 9 compares the outflow and star formation depletion timescales of galaxies as a function of their separation from the main-sequence (after removing the dependence with using Tacconi et al. (2018) scaling relations). The plot includes zC400528 and a compilation of local (U)LIRG and Seyfert galaxies (Fiore et al., 2017, and reference therein). We observe that local systems where the depletion of the molecular gas is dominated by star formation lie at least dex above the main-sequence. On the other hand, galaxies where the depletion of molecular gas is dominated by outflows are located within dex of the main-sequence, with the exception of the above outlier Mrk 231 (Feruglio et al., 2010). Similar to Mrk 231, our target galaxy zC400528 is exhausting its nuclear molecular gas reservoir via the outflow about twice as fast as due to its star formation activity. Note, however, that in contrast to Mrk 231 zC400528 is not a outlier but only +0.4 dex above the main-sequence of star-forming galaxies at . We discuss in more detail the effect that the powerful molecular outflow detected in zC400528 may have on quenching its star formation in Section 5.3.
3.3 Energetics of the molecular outflow
We calculate the momentum flux () and mechanical power () in the outflow following and .
From the mass outflow rate calculated in §3.2.4, the momentum flux is
and the mechanical luminosity is
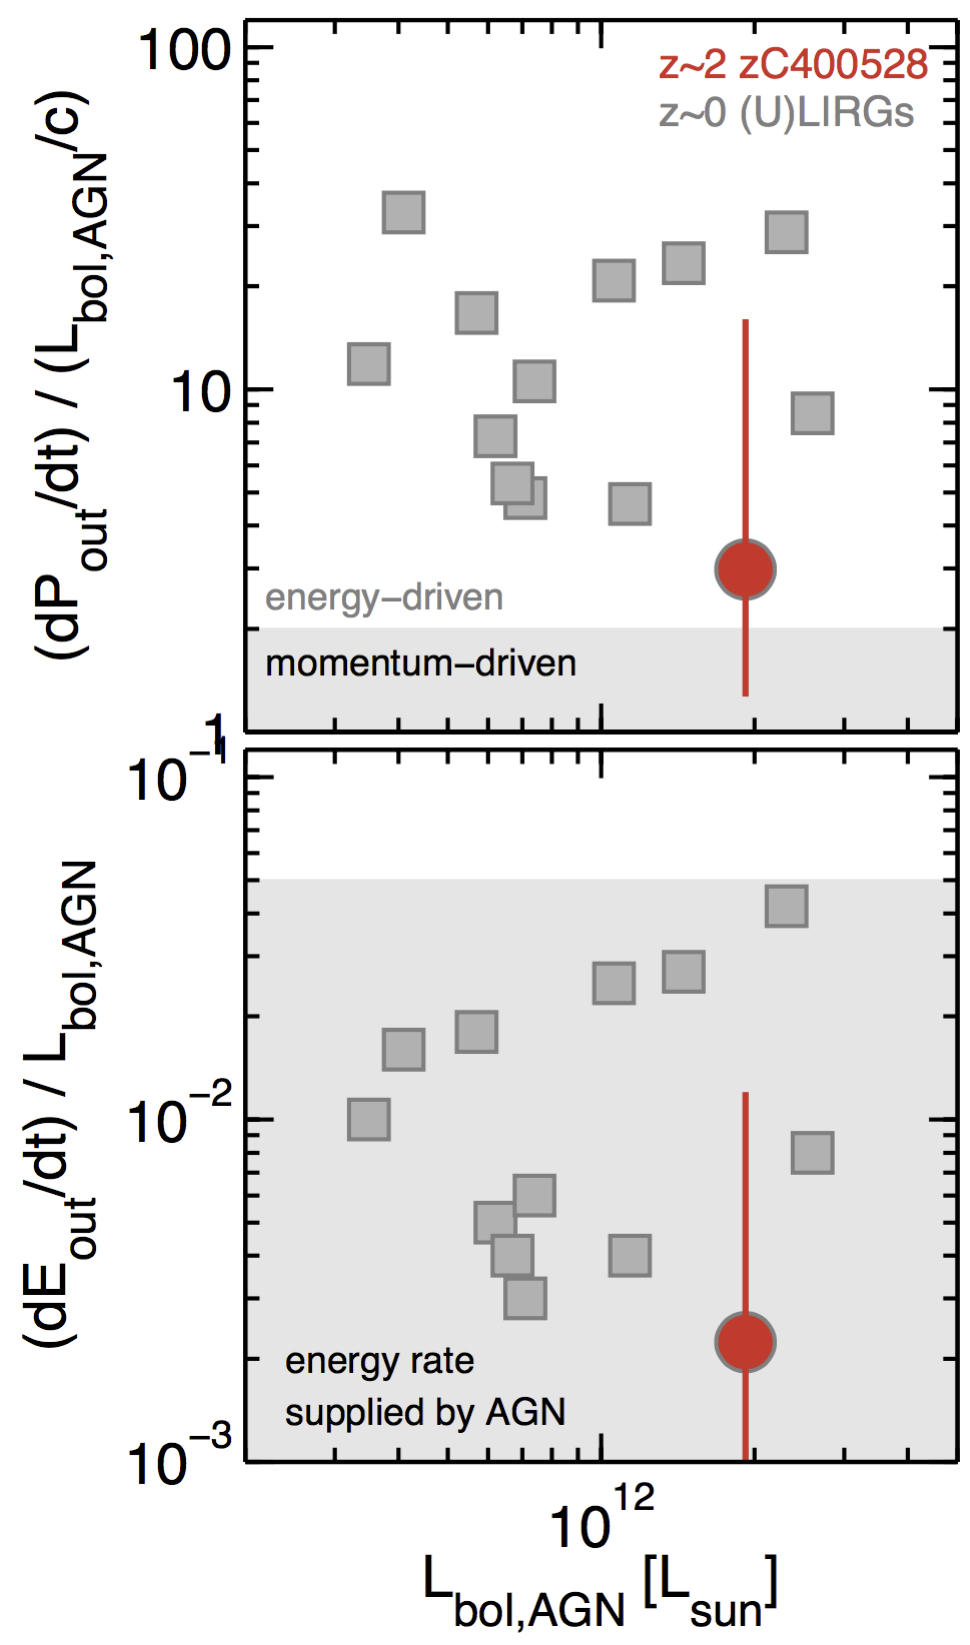
Relative to the AGN bolometric luminosity and radiation momentum rate () measured in zC400528, the momentum boost is and .
As Figure 10 shows, the momentum boost in zC400528 is at the low end of the distribution of momentum boost observed in local (U)LIRGs (; González-Alfonso et al., 2017), and suggest that if the gas in the molecular outflow is not optically thin, then the outflow is not momentum conserving () but rather energy conserving (e.g., Zubovas & King, 2012; Faucher-Giguère & Quataert, 2012). In addition, the outflow energy flux in zC400528 is of , in agreement with the theoretical expectations that AGN-driven, energy-conserving bubbles should be able to supply a power up to of (e.g., Faucher-Giguère & Quataert, 2012; King & Pounds, 2015).
A summary of the molecular outflow mass and energetics measured in zC400528 for different assumptions on can be found in Table 2.

4 Comparison between molecular and ionized outflow
Our current knowledge of the multi-phase structure and energetics of galactic outflows at high- remains greatly limited by the scarcity of observations that target both the ionized and neutral phases of the outflow. The subject of this study, zC400528, represents an exception, with high-resolution observations of the ionized (VLT/SINFONI adaptive optics-assisted) and molecular (ALMA) outflow gas available. In this section we use these complementary datasets to compare the spatial distribution and energetics of the ionized and molecular phases of the outflow.
4.1 Morphology
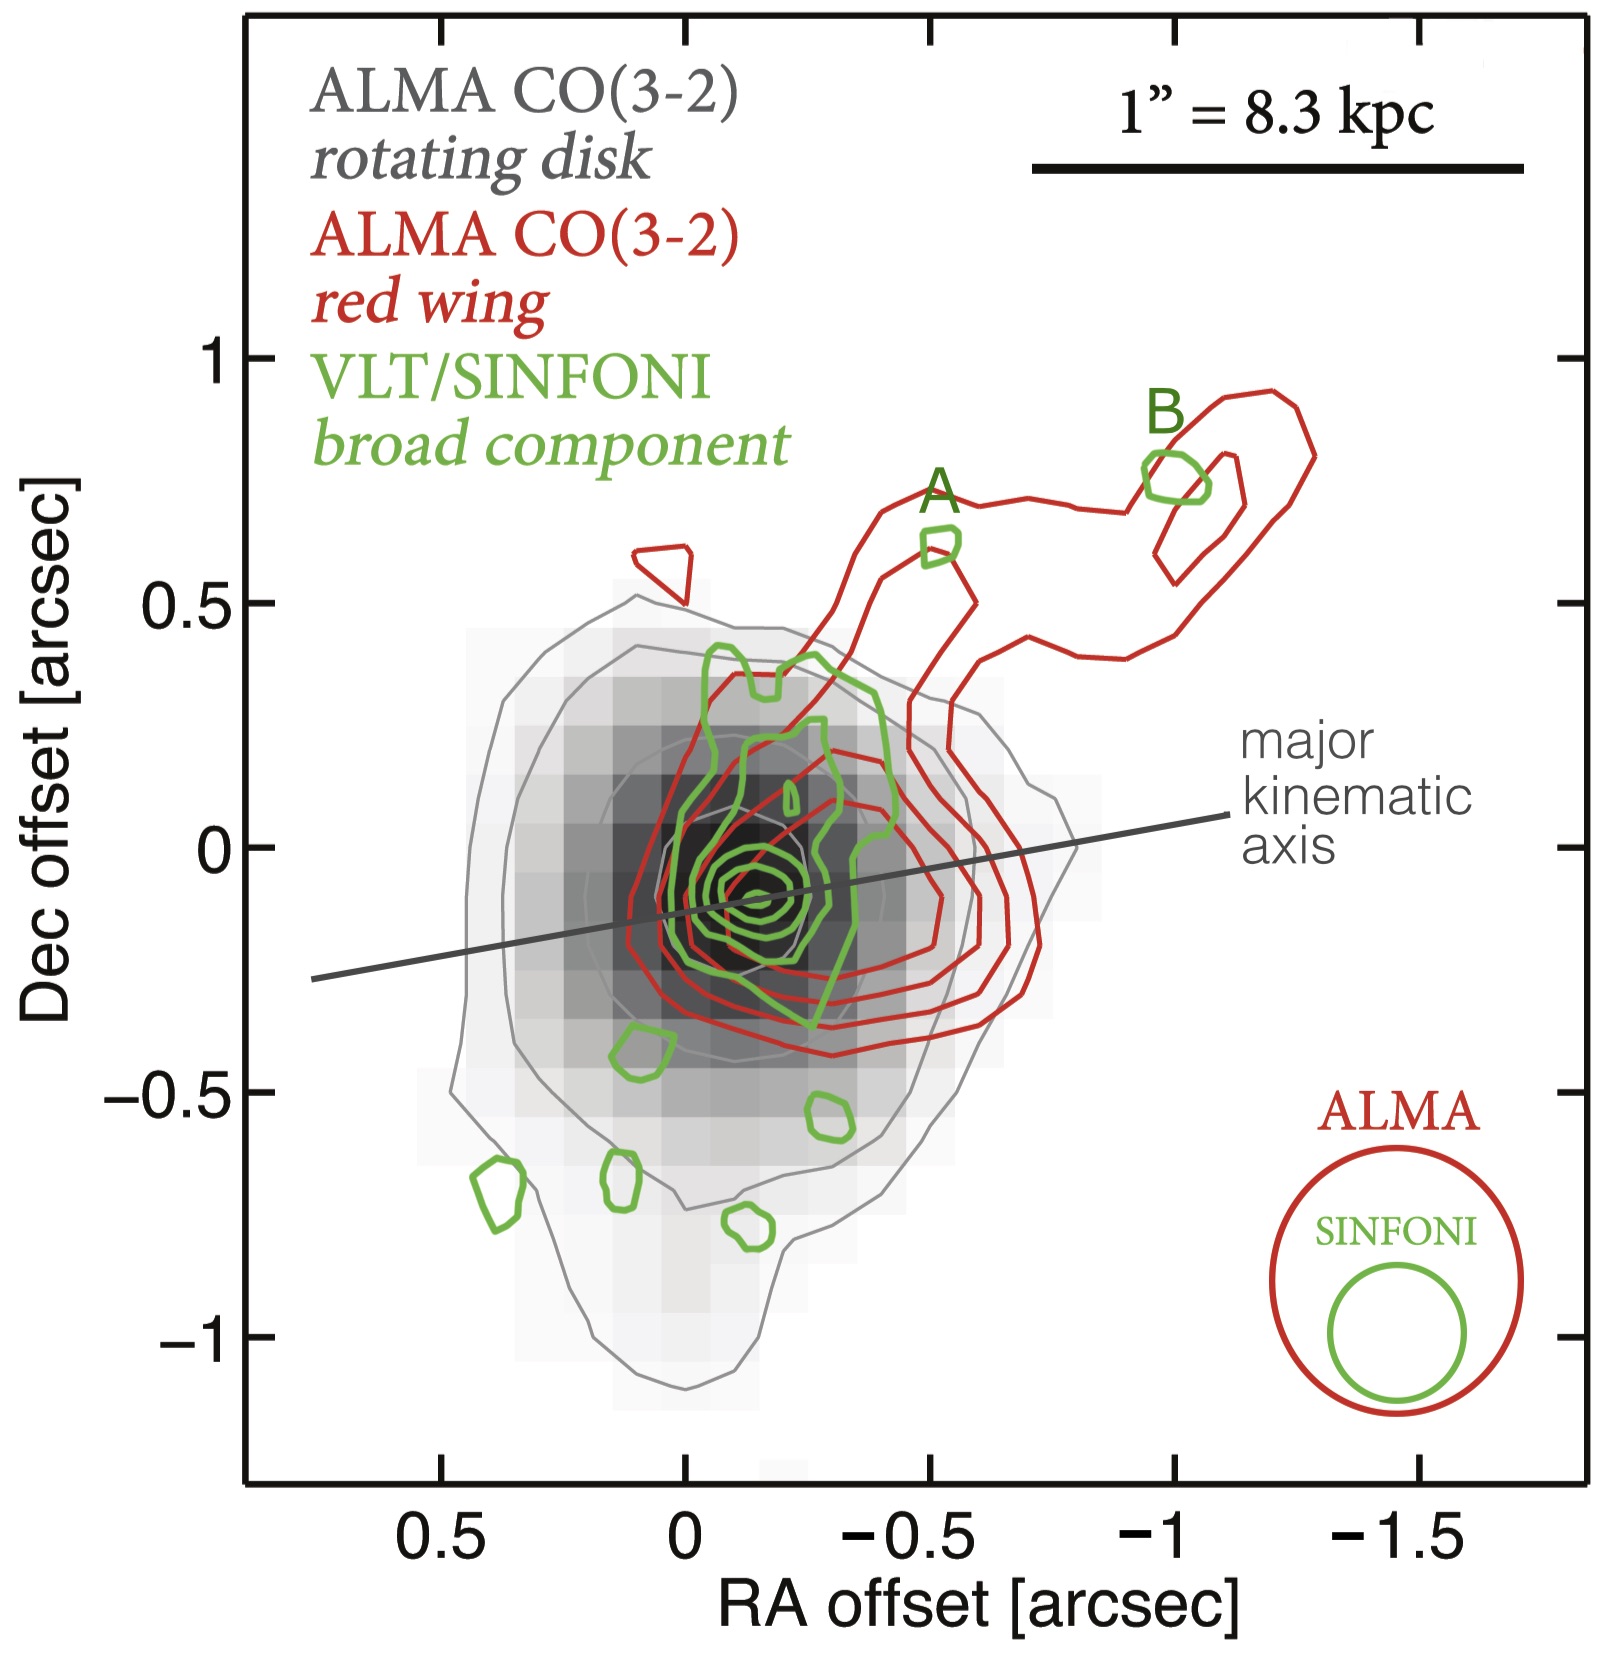
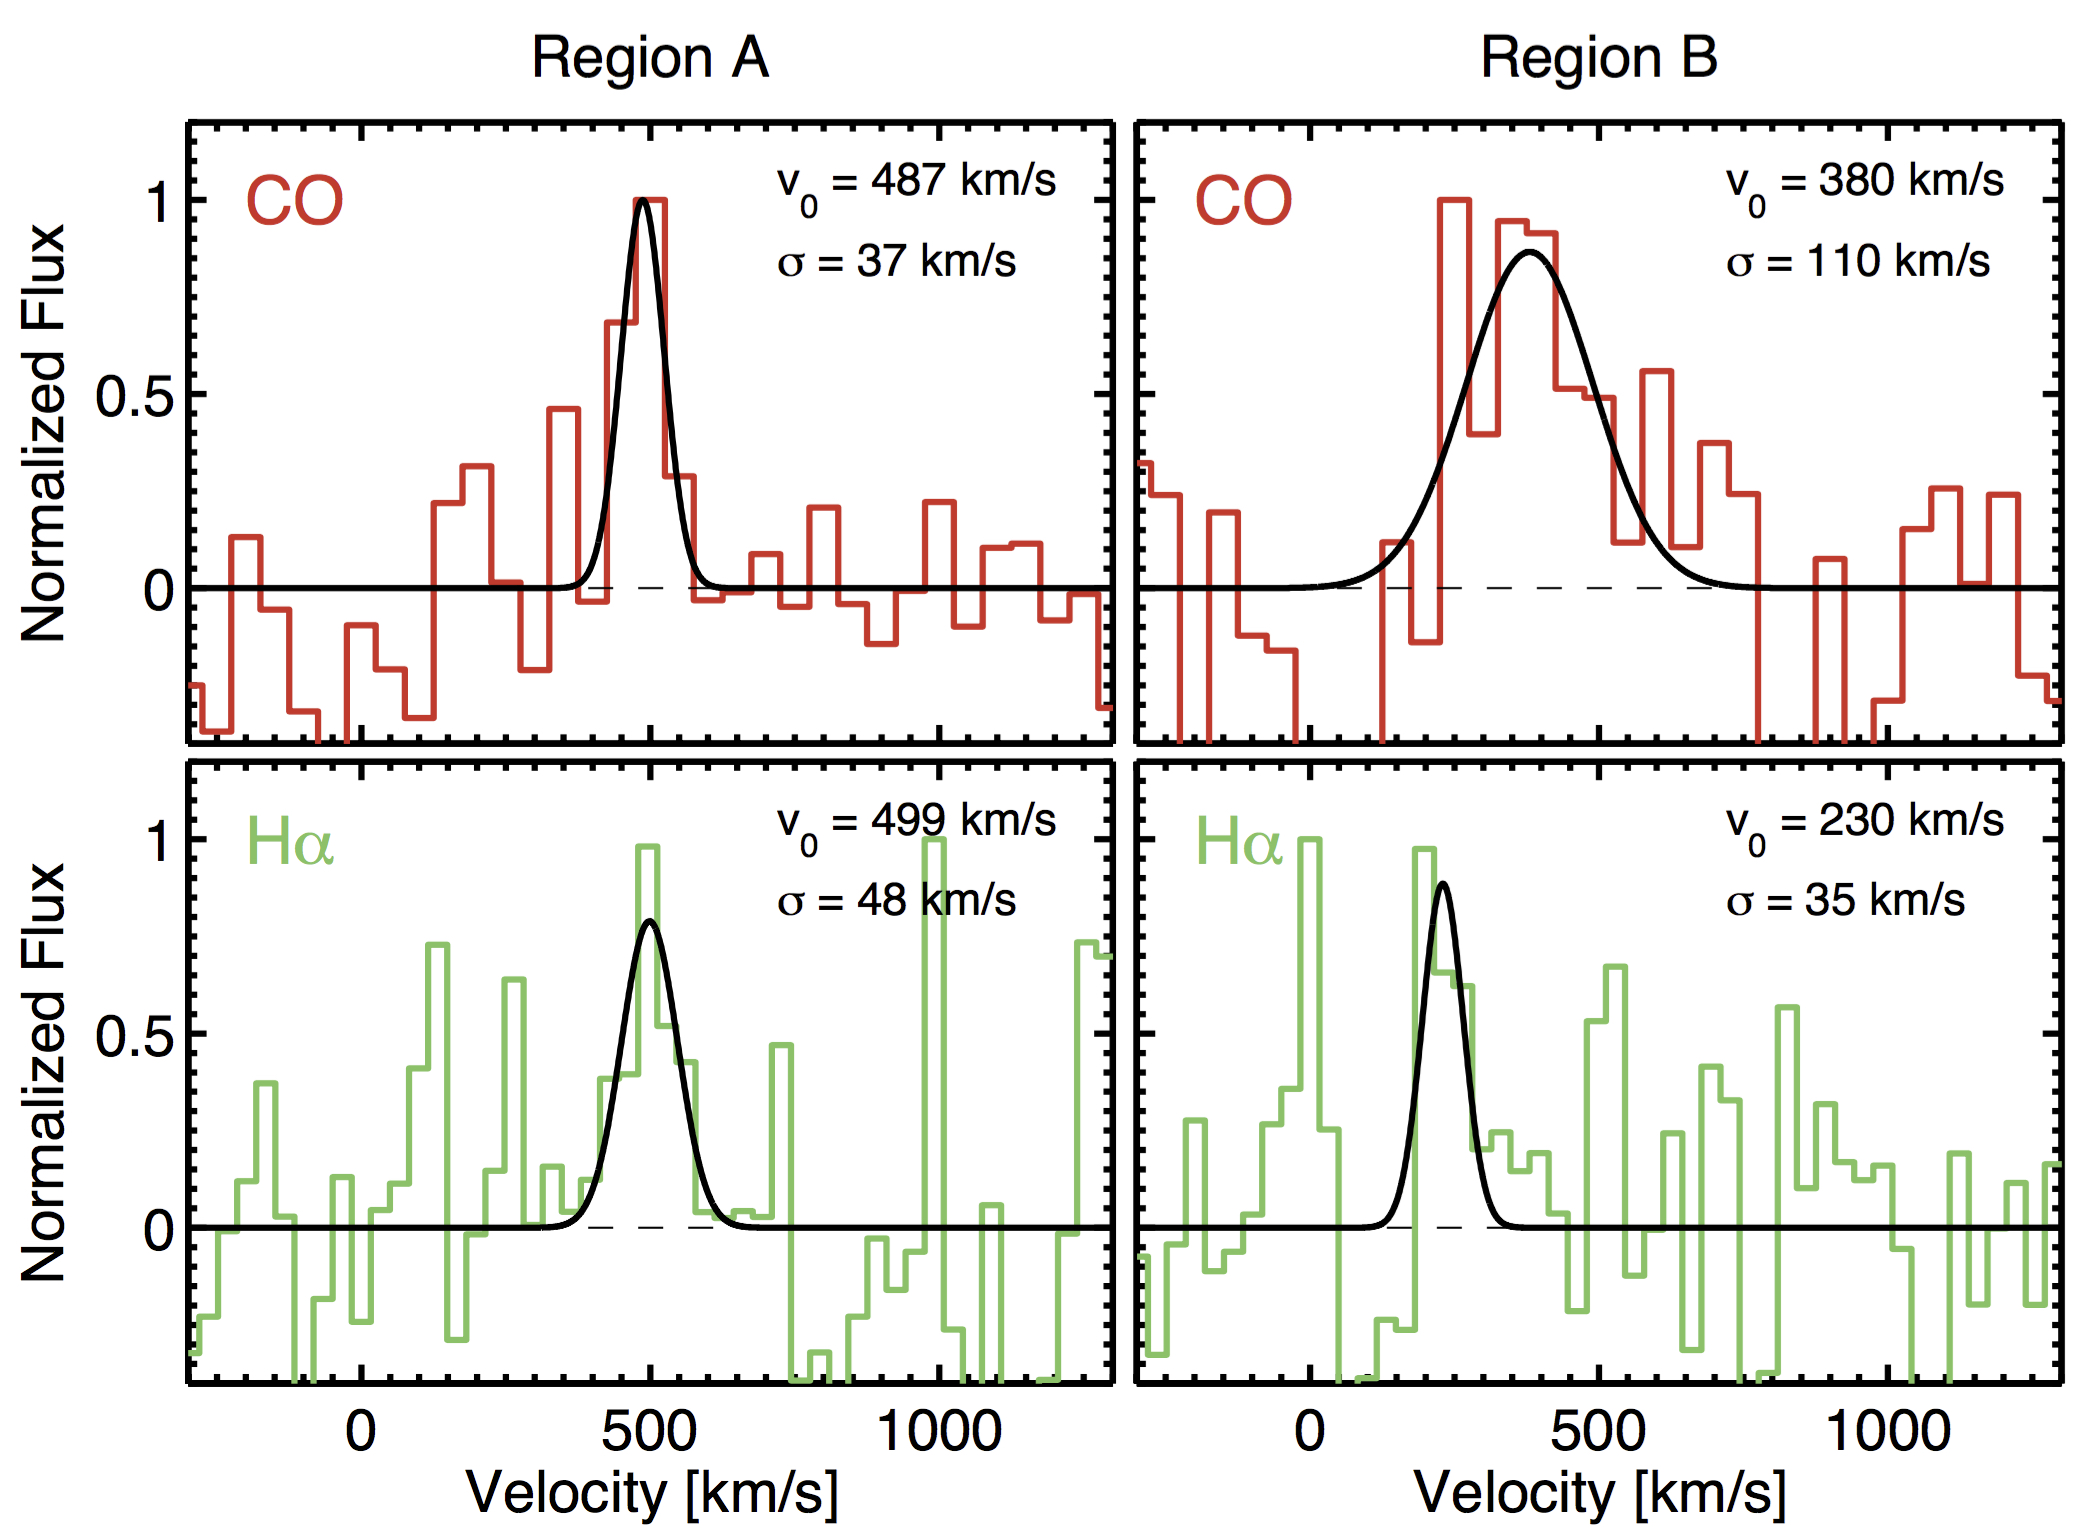
Figure 11 shows the spatial distribution of the molecular disk (background), the H blue and red broad (outflow) component (green), and the molecular wind (red). The bulk of the projected H broad emission extends kpc north from the nuclear region. Beyond this point, the only two extra-nuclear ionized outflow components detected, A and B, are co-spatial with the molecular outflow gas and at least in the case of region A, as Figure 12 shows, the molecular and ionized gas velocities are comparable.
The spatial distribution of the outflow in zC400528 suggests that the ionized gas is outflowing inclined () with respect to the major kinematic axis, likely along the path of least resistance outside the galaxy plane. There are two main molecular outflow components in the inner kpc region: one that extends alongside the ionized wind (from the center to region A), and one that is aligned with the major kinematic axis, and could therefore be equatorial. This picture resembles the structure of the AGN-driven outflow in NGC 1068 (Tecza et al., 2001; Cecil et al., 2002). There the ionized cone is inclined with respect to the galaxy disk, and the molecular outflow extends preferentially along the galaxy plane launched as a result of the ionization cone sweeping the molecular gas in the inner disk (García-Burillo et al., 2014). The fact that the outflow in zC400528 appears to be not perpendicular to the disk is a common feature observed in AGN-driven outflows. Star-formation-driven outflows, on the other hand, tend to be align with the minor kinematic axis of the disk (e.g., Leroy et al., 2015; Pereira-Santaella et al., 2018).
The configuration of the ionized and molecular phases of the outflow in zC400528 is also in qualitatively agreement with the modeling work of Zubovas & Nayakshin (2014). They find that AGN-driven outflows that start spherical quickly develop a bipolar morphology that expands faster and further in the polar direction (the direction of least resistance) than in the equatorial direction. After Myr (the flow timescale in zC400528), several cold dense clumps have formed embedded in the hot gas and are moving upward, while in the plane of the galaxy, the cold gas, squeezed by the expanding bubbles, is being pushed outwards with a mean velocity of km s-1.
4.2 Mass and energetics
The ionized mass in the outflow of zC400528 is (Genzel et al., 2014), where corresponds to the electron density of the ionized gas in the outflow. Recent results by Förster Schreiber et al. (2018a) find that the mean electron density in the outflow gas of galaxies is cm-3.
For an outflow size of kpc (Förster Schreiber et al., 2014) and an outflow velocity of km s-1 (Genzel et al., 2014), the ionized mass outflow rate is M. Based on the same assumptions, the ionized momentum and energy outflow rates are dynes and erg s-1, respectively. Figure 13 summarizes the mass and mass loss rates measured in the molecular and ionized outflow gas in zC400528. The molecular phase dominates the total observed budget of both and . Note, however, that there are gas phases in the outflow that remain unobserved and could change the overall balance, including very hot gas that could significantly contribute to the ionized outflow mass (e.g., Veilleux et al., 2005).
A summary of the ionized outflow mass and energetics measured in zC400528 for different assumptions on , and the comparison to the quantities measured in the molecular phase, can be found in Table 2.
Another quantity of interest in the study of galactic outflows is the mass loading factor (), which is defined as a the ratio between the mass outflow rate and the SFR. Figure 14 shows the molecular and ionized mass loading factors as a function of the separation from the main-sequence of galaxies (removing the dependence using Tacconi et al. (2018) scaling relations) for nearby starbursts and AGN galaxies (Heckman et al., 2015; Fiore et al., 2017) and massive (log), star-forming galaxies at (this work; Genzel et al., 2014). The ionized mass loading factors of these high- galaxies888The ionized gas outflow masses reported in Genzel et al. (2014) are calculated assuming cm-3 in the ionized outflowing gas. Here we rescaled those values to match our assumption of cm-3. are found to be comparable to those observed in local main-sequence outliers.
The molecular mass outflow rate of zC400528 is higher than its SFR (), and comparable to some of the powerful molecular outflows observed in local starbursts and Seyfert galaxies (see also §3.2.4). In addition, the molecular mass loading factor is times higher than its ionized counterpart. Note, however, that these results depend on assumptions of the properties of the outflow gas that are not yet fully constrained (e.g., the CO-to-H2 conversion factor, the electron density, geometry, etc). The same caveat applies to all the other measurements shown in the figure.
| Phase | Mass | |||
|---|---|---|---|---|
| dynes | erg | |||
| MolecularaaFor molecular gas quantities we assume an conversion factor. The values in parenthesis correspond to the values we would obtain if we apply a or conversion factor, respectively. | 3.36 | 256 | 7.2 | 1.6 |
| IonizedbbFor ionized gas quantities we assume following Förster Schreiber et al. (2018a). The values in parenthesis correspond to the values we would obtain if we assume or , respectively. | 0.22 | 53 | 2.7 | 1.10 |

5 Discussion
5.1 Can the outflowing material escape the gravitational potential of its host?
Understanding whether baryons ejected by winds escape the galaxy or rain back to the disk is key to reproduce the observed galaxy stellar masses and the metal enrichment of the IGM (e.g., Oppenheimer et al., 2010; Muratov et al., 2015). Simulations show that about half of the ejected outflow mass across all galaxy masses is later re-accreted (Übler et al., 2014; Christensen et al., 2016), and that in massive galaxies about of the stellar mass forms from gas contributed by wind recycling (Anglés-Alcázar et al., 2017).
To determine if the molecular gas in the outflow of zC400528 can permanently escape the galaxy, first we estimate the escape velocity () from the host. For this we follow Rupke et al. (2002) and use a simple gravitational model based on a truncated () isothermal sphere, so 999The escape velocity is only weakly sensitive to the exact value of .. Assuming that the dark matter halo extends to kpc and using a circular velocity for zC400528 of km s-1 (Förster Schreiber et al., 2018b), the escape velocity at kpc is km s-1. The highest velocity molecular outflow material we detect in zC400528 has a velocity of km s-1. If we take into account inclination effects (see §3.2.4) the deprojected outflow velocity could increase to km s-1, which is still lower than the escape velocity. This suggests that the bulk of the expelled molecular gas mass will be re-accreted back onto the galaxy on timescales –according to simulations– no shorter than Gyr (Oppenheimer et al., 2010; Übler et al., 2014; Christensen et al., 2016).
In the case of the ionized outflowing gas, the escape velocity at 3 kpc –the distance about the size of the ionized outflow– is km s-1. The highest velocity gas in the ionized wind can reach velocities up to km s-1 (Genzel et al., 2014), which if we correct by inclination can increase to km s-1 and potentially escape the galaxy.
The very small fraction of the molecular and ionized outflow gas that can escape the gravitational field of zC400528 is consistent with the low escape fractions () measured in neutral, ionized and molecular gas winds in local (U)LIRGs (e.g., Rupke et al., 2005; Arribas et al., 2014; Pereira-Santaella et al., 2018; Fluetsch et al., 2018).
5.2 AGN flickering and outflow expansion
Observational and theoretical arguments suggest that the AGN lifetime of yr is in reality a succession of hundreds or thousands of short ( yr) phases of supermassive black hole growth (e.g., Schawinski et al., 2015) – a process called AGN flickering. These periods of episodic AGN activity inflate large-scale outflows which can continue to expand even after the AGN finally switches off as a result of clearing the gas in the central region.
Zubovas & King (2016) used an analytical model to follow the evolution of the molecular and ionized phases in an outflow driven by an AGN that ‘flickers’ on timescales of yr. They find that the oscillations caused by the AGN flickering smooth out relatively fast ( Myr), so from an observational standpoint it would appear that the outflow is driven by an AGN with constant luminosity. For a massive galaxy similar to zC400528 ( based on the relation between halo and stellar mass in Moster et al., 2013) the model predicts that in the outflow timescale of zC400528 ( yr) the wind should have expanded between and 8 kpc with expansion velocities at that distance of and 700 km s-1 for AGN duty cycles of and 100%, respectively. The observed extent ( kpc) and velocity ( km s-1) in the molecular outflow of zC400528 is consistent with these model results and favors the scenario with a high AGN duty cycle, in agreement with the results of Genzel et al. (2014) and Förster Schreiber et al. (2018a).
5.3 Is zC400528 moving down from the main-sequence of star-forming galaxies to join the population of compact, passive galaxies?
There is growing evidence that suggests that when massive, star-forming galaxies at reach central stellar surface densities similar to those observed in massive ellipticals at ( M⊙ kpc-2 inside the inner kiloparsec region), then an effective quenching mechanism must act on relatively short timescales to shut down the star formation activity (e.g., Tacchella et al., 2015a). AGN-feedback, prevalent in massive galaxies (e.g., Genzel et al., 2014; Förster Schreiber et al., 2018a), is one of the obvious quenching candidates.
zC400528 is one of the galaxies in the study of Tacchella et al. (2015a) that shows evidence for inside-out quenching on timescales Gyr in the inner kpc region. The fact that we detect a powerful nuclear outflow in zC400528 that is removing the molecular gas on a timescale of only half a billion years argues strongly in favor of the outflow as one of the main internal mechanisms responsible for the central suppression of the star formation activity. This conclusion is reinforced if we consider that the nuclear outflow is in reality not capable of clearing the whole galaxy of its star-forming material, but only the central region. If we recalculate the outflow depletion timescale only considering the molecular gas mass in the inner kpc region we obtain a depletion timescale that is a factor of shorter ( yr). Note that for the nuclear outflow in zC400528 to be responsible for the quenching of the star-formation activity in the entire galaxy would require an efficient mode of “preventive” feedback, i.e., that the outflow injects enough energy into the halo to keep it hot, drastically reducing the accretion of gas into the disk, including the recycling of molecular gas expelled by the nuclear outflow (e.g., Gabor et al., 2011; King & Pounds, 2015; Costa et al., 2017; Davé et al., 2017).
Keeping in mind the many uncertainties associated to the calculation of the mass outflow rate described in §4, we can attempt to further explore the quenching scenario with a simple back-of-the-envelope calculation. We start by estimating the balance of gas input and drainage , which is one the key parameters regulating the movement of galaxies relative to the main-sequence. To calculate the inflow rate, we use the expression for the mean gas accretion rate in Bouché et al. (2010) (see also Lilly et al., 2013):
| (3) |
where is the accretion efficiency, () is the cosmic baryonic fraction, and is the mass of the halo. Assuming a fiducial value for the accretion efficiency of (e.g., Bauermeister et al., 2010), a cosmic baryonic fraction of , and a halo mass of (based on the relation between halo and stellar mass in Moster et al., 2013), we obtain a mean gas accretion rate for zC400528 of . Then, the balance of gas input and drainage in zC400528 is
From the scaling relation described in Tacchella et al. (2016) between the balance term (in the central 5 kpc) and the rate of change of distance from the main-sequence, , we speculate that zC400528 is moving down from the main-sequence at a rate of dex Gyr-1. At this rate, and ignoring other mechanisms that could contribute to the star formation activity on timescales Gyr (e.g., re-accretion of ejected molecular gas expelled by the outflow; see §5.1), it should only take zC400538 about Gyr to transition from the main-sequence to the regime of passive, quenched galaxies dex below the main-sequence. This is consistent with the expectations from inside-out quenching that claims that massive, star-forming galaxies such as zC400528 should be fully quenched by ( Gyr later than the epoch).
6 Conclusions
In this paper we use ALMA CO(3-2) observations to study the molecular gas properties of the disk and the AGN-driven outflow in zC400528, a typical massive galaxy at in the process of quenching (Tacchella et al., 2015b). We complement these observations with VLT/SINFONI adaptive-optics H data (Förster Schreiber et al., 2014, 2018b) which allowed us to conduct one of the first spatially-resolved, multi-phase studies of a galactic outflow at .
We highlight the following points:
-
1.
Molecular disk: The molecular gas mass in the rotating disk of zC400528 (assuming a CO-to-H2 conversion factor of ) is , which translates to a molecular gas to stellar ratio of . This high gas mass fraction is comparable to those observed in massive star-forming galaxies at (Genzel et al., 2015; Tacconi et al., 2018).
-
2.
Molecular outflow: The molecular outflow in zC400528 is asymmetrical, with only its receding component detected out to a projected distance of kpc. The bulk of the emission is concentrated in the nuclear region and aligned with the major kinematic axis of the disk. We observe a positive velocity gradient in the outflow with projected velocities that range from km s-1 in the nuclear part to km s-1 in the furthest components.
We measure a molecular outflow mass and mass loss rate of and , respectively (these assume a ULIRG-like CO-to-H2 conversion factor). With this powerful molecular mass loss rate zC400528 is depleting its nuclear molecular gas twice as fast as due to its star formation activity.
The momentum boost in the molecular phase of the outflow is and the energy flux is , in agreement with theoretical expectations for an AGN-driven, energy-conserving outflow.
-
3.
Molecular and ionized phases in the outflow: The ionized and molecular phases of the outflow in zC400528 have different morphological properties. While the ionized outflow extends for kpc from the nuclear region inclined about with respect to the major kinematic axis of the disk, the central component of the molecular outflow is found preferentially in between the ionized wind and the major kinematic axis. This type of configuration is not uncommon in AGN-driven outflows as found in observational and simulation studies (e.g., García-Burillo et al., 2014; Zubovas & King, 2014). We also observe that in the extended molecular component of the outflow ( kpc) there are at least two regions (A and B in Fig. 11) where ionized and molecular gas are co-spatial and moving at similar high-velocities.
Keeping in mind all the uncertainties that affect the determination of the ionized and molecular outflow properties (e.g., electron density, CO-to-H2 conversion factor, geometry, etc.), both the mass and energetics of the outflow are dominated by the molecular phase. For the ionized phase to be dominant would require the combination of low electron densities and optically thin molecular gas in the wind. Both of these conditions seem unlikely (e.g., Aalto et al., 2015; Walter et al., 2017; Förster Schreiber et al., 2018a). The mass loading factors () of the molecular and ionized outflow phases are 1.7 and 0.4, respectively.
-
4.
AGN-driven outflow quenching in action? Kilo-parsec scale observations of the stellar content and the star formation activity in zC400528 reveal that one or more quenching mechanisms are shutting down the star formation activity from the inside-out on short timescales ( Gyr; Tacchella et al., 2015a). The fact that we detect an AGN-driven outflow powerful enough to expel the star-forming material in the central region on short timescales ( Gyr if we consider the molecular gas in the inner four kiloparsecs) points at the outflow as one of the main quenching engines at work. Although it is true that the expelled molecular gas is not fast enough to escape the system, the energy input of the outflow into the halo should reduce the accretion of both fresh and recycled gas into the disk, facilitating even more the transition of zC400528 into the realm of passive systems below the main-sequence of galaxies.
7 Acknowledgments
RHC would like to thank the support and encouragement from Fares Bravo Garrido and dedicates this paper with love to Fares and Olivia. SGB thanks economic support from funding grant AYA2016-76682-C3-2-P. CF acknowledges support from the European Union Horizon 2020 research and innovation programme under the Marie Sklodowska-Curie grant agreement No 664931. LC acknowledges financial support by the Spanish Ministry for Science, Innovation and Universities under grants AYA2015-68964 and ESP2017-83197. The Cosmic Dawn Center is funded by the Danish National Research Foundation. This paper makes use of the following ALMA data: ADS/JAO.ALMA#2013.1.00092.S and #2015.1.00220.S. ALMA is a partnership of ESO (representing its member states), NSF (USA) and NINS (Japan), together with NRC (Canada) and NSC and ASIAA (Taiwan) and KASI (Republic of Korea), in cooperation with the Republic of Chile. The Joint ALMA Observatory is operated by ESO, AUI/NRAO and NAOJ. This work is based on observations taken by the 3D-HST Treasury Program (GO 12177 and 12328) with the NASA/ESA HST, which is operated by the Association of Universities for Research in Astronomy, Inc., under NASA contract NAS5-26555.
Appendix A AGN bolometric luminosity of zC400528
Given the non-detection of zC400528 in X-ray emission described in §1.1, we estimate its AGN bolometric luminosity in two ways: (1) We convert its SFR into a total infrared luminosity () using the prescription by Murphy et al. (2011). Then, we use the common assumption that , and that a fraction (a typical AGN fraction in ULIRGs, e.g., Veilleux et al., 2009) of is associated to the bolometric AGN luminosity. This results in . (2) We follow the methodology described in Förster Schreiber et al. (2018a) and use the [N II]6584 luminosity in the narrow component after subtracting the contribution by star-forming regions based on the mass-metallicity relation. The resulting AGN bolometric luminosity is , a factor of higher than the TIR-based estimate in (1). In the analysis we use the average between these two values, i.e., .
References
- Aalto et al. (2012) Aalto, S., Garcia-Burillo, S., Muller, S., et al. 2012, A&A, 537, A44
- Aalto et al. (2015) —. 2015, A&A, 574, A85
- Alatalo (2015) Alatalo, K. 2015, ApJ, 801, L17
- Anglés-Alcázar et al. (2017) Anglés-Alcázar, D., Faucher-Giguère, C.-A., Kereš, D., et al. 2017, MNRAS, 470, 4698
- Arribas et al. (2014) Arribas, S., Colina, L., Bellocchi, E., Maiolino, R., & Villar-Martín, M. 2014, A&A, 568, A14
- Barcos-Muñoz et al. (2018) Barcos-Muñoz, L., Aalto, S., Thompson, T. A., et al. 2018, ApJ, 853, L28
- Barro et al. (2016) Barro, G., Kriek, M., Pérez-González, P. G., et al. 2016, ApJ, 827, L32
- Bauermeister et al. (2010) Bauermeister, A., Blitz, L., & Ma, C.-P. 2010, ApJ, 717, 323
- Bolatto et al. (2013a) Bolatto, A. D., Wolfire, M., & Leroy, A. K. 2013a, ARA&A, 51, 207
- Bolatto et al. (2013b) Bolatto, A. D., Warren, S. R., Leroy, A. K., et al. 2013b, Nature, 499, 450
- Bolatto et al. (2015) —. 2015, ApJ, 809, 175
- Bouché et al. (2010) Bouché, N., Dekel, A., Genzel, R., et al. 2010, ApJ, 718, 1001
- Cecil et al. (2002) Cecil, G., Dopita, M. A., Groves, B., et al. 2002, ApJ, 568, 627
- Christensen et al. (2016) Christensen, C. R., Davé, R., Governato, F., et al. 2016, ApJ, 824, 57
- Cicone et al. (2012) Cicone, C., Feruglio, C., Maiolino, R., et al. 2012, A&A, 543, A99
- Cicone et al. (2014) Cicone, C., Maiolino, R., Sturm, E., et al. 2014, A&A, 562, A21
- Concas et al. (2017) Concas, A., Popesso, P., Brusa, M., et al. 2017, A&A, 606, A36
- Contursi et al. (2013) Contursi, A., Poglitsch, A., Grácia Carpio, J., et al. 2013, A&A, 549, A118
- Costa et al. (2017) Costa, T., Rosdahl, J., Sijacki, D., & Haehnelt, M. G. 2017, ArXiv e-prints, arXiv:1709.08638
- Daddi et al. (2015) Daddi, E., Dannerbauer, H., Liu, D., et al. 2015, A&A, 577, A46
- Dannerbauer et al. (2009) Dannerbauer, H., Daddi, E., Riechers, D. A., et al. 2009, ApJ, 698, L178
- Dasyra et al. (2016) Dasyra, K. M., Combes, F., Oosterloo, T., et al. 2016, A&A, 595, L7
- Davé et al. (2017) Davé, R., Rafieferantsoa, M. H., & Thompson, R. J. 2017, MNRAS, 471, 1671
- Di Matteo et al. (2005) Di Matteo, T., Springel, V., & Hernquist, L. 2005, Nature, 433, 604
- Eisenhauer et al. (2003) Eisenhauer, F., Abuter, R., Bickert, K., et al. 2003, in Proc. SPIE, Vol. 4841, Instrument Design and Performance for Optical/Infrared Ground-based Telescopes, ed. M. Iye & A. F. M. Moorwood, 1548–1561
- Elvis et al. (2009) Elvis, M., Civano, F., Vignali, C., et al. 2009, ApJS, 184, 158
- Faucher-Giguère & Quataert (2012) Faucher-Giguère, C.-A., & Quataert, E. 2012, MNRAS, 425, 605
- Feruglio et al. (2010) Feruglio, C., Maiolino, R., Piconcelli, E., et al. 2010, A&A, 518, L155
- Feruglio et al. (2015) Feruglio, C., Fiore, F., Carniani, S., et al. 2015, A&A, 583, A99
- Fiore et al. (2017) Fiore, F., Feruglio, C., Shankar, F., et al. 2017, A&A, 601, A143
- Fluetsch et al. (2018) Fluetsch, A., Maiolino, R., Carniani, S., et al. 2018, ArXiv e-prints, arXiv:1805.05352
- Förster Schreiber et al. (2014) Förster Schreiber, N. M., Genzel, R., Newman, S. F., et al. 2014, ApJ, 787, 38
- Förster Schreiber et al. (2018a) Förster Schreiber, N. M., Übler, H., Davies, R. L., et al. 2018a, ArXiv e-prints, arXiv:1807.04738
- Förster Schreiber et al. (2018b) Förster Schreiber, N. M., Renzini, A., Mancini, C., et al. 2018b, ArXiv e-prints, arXiv:1802.07276
- Gabor & Bournaud (2014) Gabor, J. M., & Bournaud, F. 2014, MNRAS, 441, 1615
- Gabor et al. (2011) Gabor, J. M., Davé, R., Oppenheimer, B. D., & Finlator, K. 2011, MNRAS, 417, 2676
- García-Burillo et al. (2014) García-Burillo, S., Combes, F., Usero, A., et al. 2014, A&A, 567, A125
- Genzel et al. (2014) Genzel, R., Förster Schreiber, N. M., Rosario, D., et al. 2014, ApJ, 796, 7
- Genzel et al. (2015) Genzel, R., Tacconi, L. J., Lutz, D., et al. 2015, ApJ, 800, 20
- González-Alfonso et al. (2014) González-Alfonso, E., Fischer, J., Graciá-Carpio, J., et al. 2014, A&A, 561, A27
- González-Alfonso et al. (2017) González-Alfonso, E., Fischer, J., Spoon, H. W. W., et al. 2017, ApJ, 836, 11
- Harrison et al. (2016) Harrison, C. M., Alexander, D. M., Mullaney, J. R., et al. 2016, MNRAS, 456, 1195
- Heckman et al. (2015) Heckman, T. M., Alexandroff, R. M., Borthakur, S., Overzier, R., & Leitherer, C. 2015, ApJ, 809, 147
- Janssen et al. (2016) Janssen, A. W., Christopher, N., Sturm, E., et al. 2016, ApJ, 822, 43
- Kewley et al. (2013) Kewley, L. J., Maier, C., Yabe, K., et al. 2013, ApJ, 774, L10
- King & Pounds (2015) King, A., & Pounds, K. 2015, ARA&A, 53, 115
- Kornei et al. (2012) Kornei, K. A., Shapley, A. E., Martin, C. L., et al. 2012, ApJ, 758, 135
- Leroy et al. (2015) Leroy, A. K., Walter, F., Martini, P., et al. 2015, ApJ, 814, 83
- Leung et al. (2017) Leung, G. C. K., Coil, A. L., Azadi, M., et al. 2017, ApJ, 849, 48
- Lilly et al. (2013) Lilly, S. J., Carollo, C. M., Pipino, A., Renzini, A., & Peng, Y. 2013, ApJ, 772, 119
- Maiolino et al. (2012) Maiolino, R., Gallerani, S., Neri, R., et al. 2012, MNRAS, 425, L66
- McMullin et al. (2007) McMullin, J. P., Waters, B., Schiebel, D., Young, W., & Golap, K. 2007, in Astronomical Society of the Pacific Conference Series, Vol. 376, Astronomical Data Analysis Software and Systems XVI, ed. R. A. Shaw, F. Hill, & D. J. Bell, 127
- Morganti et al. (2016) Morganti, R., Veilleux, S., Oosterloo, T., Teng, S. H., & Rupke, D. 2016, A&A, 593, A30
- Moster et al. (2013) Moster, B. P., Naab, T., & White, S. D. M. 2013, MNRAS, 428, 3121
- Muratov et al. (2015) Muratov, A. L., Kereš, D., Faucher-Giguère, C.-A., et al. 2015, MNRAS, 454, 2691
- Murphy et al. (2011) Murphy, E. J., Condon, J. J., Schinnerer, E., et al. 2011, ApJ, 737, 67
- Muzzin et al. (2013) Muzzin, A., Marchesini, D., Stefanon, M., et al. 2013, ApJ, 777, 18
- Nardini et al. (2015) Nardini, E., Reeves, J. N., Gofford, J., et al. 2015, Science, 347, 860
- Nelson et al. (2016) Nelson, E. J., van Dokkum, P. G., Förster Schreiber, N. M., et al. 2016, ApJ, 828, 27
- Newman et al. (2013) Newman, S. F., Genzel, R., Förster Schreiber, N. M., et al. 2013, ApJ, 767, 104
- Newman et al. (2014) Newman, S. F., Buschkamp, P., Genzel, R., et al. 2014, ApJ, 781, 21
- Oppenheimer et al. (2010) Oppenheimer, B. D., Davé, R., Kereš, D., et al. 2010, MNRAS, 406, 2325
- Pereira-Santaella et al. (2018) Pereira-Santaella, M., Colina, L., Garcia-Burillo, S., et al. 2018, ArXiv e-prints, arXiv:1805.03667
- Pettini & Pagel (2004) Pettini, M., & Pagel, B. E. J. 2004, MNRAS, 348, L59
- Richings & Faucher-Giguère (2018) Richings, A. J., & Faucher-Giguère, C.-A. 2018, MNRAS, 474, 3673
- Rodríguez Zaurín et al. (2013) Rodríguez Zaurín, J., Tadhunter, C. N., Rose, M., & Holt, J. 2013, MNRAS, 432, 138
- Rupke et al. (2002) Rupke, D. S., Veilleux, S., & Sanders, D. B. 2002, ApJ, 570, 588
- Rupke et al. (2005) —. 2005, ApJ, 632, 751
- Rupke & Veilleux (2011) Rupke, D. S. N., & Veilleux, S. 2011, ApJ, 729, L27
- Schawinski et al. (2015) Schawinski, K., Koss, M., Berney, S., & Sartori, L. F. 2015, MNRAS, 451, 2517
- Schinnerer et al. (2010) Schinnerer, E., Sargent, M. T., Bondi, M., et al. 2010, ApJS, 188, 384
- Silk & Rees (1998) Silk, J., & Rees, M. J. 1998, A&A, 331, L1
- Skelton et al. (2014) Skelton, R. E., Whitaker, K. E., Momcheva, I. G., et al. 2014, ApJS, 214, 24
- Springel et al. (2005) Springel, V., Di Matteo, T., & Hernquist, L. 2005, ApJ, 620, L79
- Sturm et al. (2011) Sturm, E., González-Alfonso, E., Veilleux, S., et al. 2011, ApJ, 733, L16
- Tacchella et al. (2016) Tacchella, S., Dekel, A., Carollo, C. M., et al. 2016, MNRAS, 457, 2790
- Tacchella et al. (2015a) Tacchella, S., Carollo, C. M., Renzini, A., et al. 2015a, Science, 348, 314
- Tacchella et al. (2015b) Tacchella, S., Lang, P., Carollo, C. M., et al. 2015b, ApJ, 802, 101
- Tacconi et al. (2010) Tacconi, L. J., Genzel, R., Neri, R., et al. 2010, Nature, 463, 781
- Tacconi et al. (2013) Tacconi, L. J., Neri, R., Genzel, R., et al. 2013, ApJ, 768, 74
- Tacconi et al. (2018) Tacconi, L. J., Genzel, R., Saintonge, A., et al. 2018, ApJ, 853, 179
- Tecza et al. (2001) Tecza, M., Thatte, N., & Maiolino, R. 2001, in IAU Symposium, Vol. 205, Galaxies and their Constituents at the Highest Angular Resolutions, ed. R. T. Schilizzi, 216
- Tombesi et al. (2015) Tombesi, F., Meléndez, M., Veilleux, S., et al. 2015, Nature, 519, 436
- Übler et al. (2014) Übler, H., Naab, T., Oser, L., et al. 2014, MNRAS, 443, 2092
- van de Voort et al. (2011) van de Voort, F., Schaye, J., Booth, C. M., Haas, M. R., & Dalla Vecchia, C. 2011, MNRAS, 414, 2458
- Veilleux et al. (2017) Veilleux, S., Bolatto, A., Tombesi, F., et al. 2017, ApJ, 843, 18
- Veilleux et al. (2005) Veilleux, S., Cecil, G., & Bland-Hawthorn, J. 2005, ARA&A, 43, 769
- Veilleux et al. (2009) Veilleux, S., Rupke, D. S. N., Kim, D.-C., et al. 2009, ApJS, 182, 628
- Veilleux et al. (2013) Veilleux, S., Meléndez, M., Sturm, E., et al. 2013, ApJ, 776, 27
- Walter et al. (2017) Walter, F., Bolatto, A. D., Leroy, A. K., et al. 2017, ApJ, 835, 265
- Woo et al. (2016) Woo, J.-H., Bae, H.-J., Son, D., & Karouzos, M. 2016, ApJ, 817, 108
- Zubovas & King (2012) Zubovas, K., & King, A. 2012, ApJ, 745, L34
- Zubovas & King (2016) —. 2016, MNRAS, 462, 4055
- Zubovas & King (2014) Zubovas, K., & King, A. R. 2014, MNRAS, 439, 400
- Zubovas & Nayakshin (2014) Zubovas, K., & Nayakshin, S. 2014, MNRAS, 440, 2625