A Morphing Continuum Simulation of Transonic Flow over an Axisymmetric Hill
Abstract
Finite volume simulations of turbulent boundary layer flow over an axisymmetric hill are performed for using Morphing Continuum Theory (MCT), and compared with DNS data from Castagna et. al. and experimental data obtained by Simpson. The inlet profile was specified by inputting values from the profile specified by Castagna et. al. Root-mean-square velocity fluctuations are inputted using the new variable of gyration from MCT. Additional terms introduced by MCT lead to a new formulation of the Q-criterion, which allows for the visualization of three-dimensional turbulent structures including a hairpin vortices. Streamline plots of the separation bubble show a more confined bubble than Castagna et. al., but agree well on the separation and reconnection points. The surface pressure coefficient matches Simpson much more closely than Castagna et. al. MCT data was obtained on a cell mesh containing a smaller number of cells by an order of magnitude than that of the DNS mesh of by Castagna et. al. The effects of the particle on the larger structures are inferred from the variation in the new variable of gyration.
Nomenclature
| = | material constant, |
| = | dimensionless parameter |
| = | dimensionless parameter |
| = | dimensionless parameter |
| = | deformation rate tensor, |
| = | deformation rate tensor, |
| = | material constant |
| = | speed of sound of the fluid, |
| = | specific heat at constant pressure |
| = | specific heat at constant volume |
| = | pressure coefficient |
| = | boundary layer thickness, |
| = | Kronecker delta tensor |
| = | internal energy density, |
| = | total energy density, |
| = | Levi-Civita tensor |
| = | body force density, |
| = | subscale diffusivity, |
| = | diffusion coefficient, |
| = | geometric interpolation factor |
| = | energy source density, |
| = | height of bump, |
| = | subscale inertia tensor |
| = | microinertia, |
| = | subscale viscosity, |
| = | body moment density, |
| = | second coefficient of viscosity, |
| = | first coefficient of viscosity, |
| = | moment stress tensor, |
| = | Mach number at inlet |
| = | hydrostatic pressure, |
| = | transport variable |
| = | heat flux, |
| = | density, |
| = | thermal conductivity, |
| = | source function for |
| = | surface vector of the cell face |
| = | Cauchy stress tensor, |
| = | temperature, Kelvin |
| = | second invariant of |
| = | x-velocity in wall coordinates |
| = | root-mean-square velocity, |
| = | friction velocity, |
| = | cell volume, |
| = | translational velocity vector, |
| = | gyration vector, |
| = | position vector for point P in reference configuration, m |
| = | position vector from center at point P, m |
| = | directors attached to point P |
| = | y-coordinate in wall units |
| = | troot-mean-square gyration, |
| = | number of sampling points |
| = | gyration fluctuation, |
| = | turbulence intensities |
1 Introduction
The demand for comprehensive, robust, and efficient numerical methods for modeling turbulence, while also yielding new physical insights into well-studied cases, is a continuous challenge for each new model [1, 2, 3, 4] . The reliability of direct numerical simulation (DNS) in producing results that conform to experimental data is well documented, but these results are obtained at the expense of considerable computational resources [5, 6, 7, 8, 9] . The primary difficulty is the ability to resolve all relevant scales of motion, and in particular the smallest eddies. For these eddies, viscous diffusion of energy into heat is the primary mode of energy transfer. Since this cascade process is how energy is ultimately dissipated, no complete description of turbulent physics can omit these scales of motion. In order to resolve these eddies in DNS, the mesh must be continuously refined, driving up the computational costs.
Due to this hurdle, the Navier-Stokes equations have been modified with averaging or filtering techniques, producing the familiar large-eddy simulation (LES) and Reynolds-averaged Navier-Stokes (RANS) methods. Though these techniques do obtain credible results at cheaper costs, they still require closure models that change depending on the system being studied. Typically, different versions of well-tested models are applied to canonical problems to test their viability, cost, and potential for solving more complex problems. Rodi et al’s tests of different versions of the model for vortex-shedding flow illustrate the limits of various closure models and the occasional necessity of combining different models to approximate increasing levels of turbulence around a bluff body[2] . Walters and Coljkat proposed a three-equation model that incorporated closure models for the RANS equations based on the transport of different types of fluctuations to different regimes of the flow [10] . Depending on the nature of the results, or the geometry of the flow, different RANS models may be utilized. These models do not come from any first principles and are typically ad hoc, based of particular experiments or observations. They can be successful in adapting to new problems. Still, the smallest relevant length scales in turbulent motion may be smoothed over in the case of averaging, or filtered out as in the case of LES.
Developing a theory that captures these smallest length scales without resorting to ad hoc closure models is the goal of morphing continuum theory (MCT) [9, 11, 12, 13, 14] . When the dynamics of a fluid’s inner structure are considered, the resulting governing equations provide new terms that account for the motion or deformation of individual eddies. These terms arise from the independent local rotation of finite-sized particles in the fluid that give the fluid its inner structure. Recent successes in numerical simulations of two-dimensional boundary layer flows and compressible turbulent flows have produced visualizations of shock-turbulent interactions, turbulent kinetic energy transfer, transitional profiles, and other experimental fluids phenomena [15, 16, 17] . The key to these simulations is the ability to generate data consistent with experiment and DNS results, without the associated high computational costs [9, 15, 16, 17] . Additionally, the new variable of local rotation, the new material properties associated with the inner structure, and the new governing equations allow for alternative strategies of visualizing large structures within the flow. These tools can help with the visualization of three-dimensional turbulent boundary layer flow. To prove MCT’s applicability to physical cases of turbulence, the theory must be able to capture the structures involved in three-dimensional turbulence. MCT should not be confused with RANS or LES. RANS and LES both work by taking the existing Navier-Stokes equations and adding approximations or modifications to make the simulation of turbulent flows more cost-effective. In those theories, the fluid is modeled as a classical continuum with infinitesimal points. In MCT, the fluid is modeled as a continuum with finite-sized inner structures possessing rotation. The rotation is similar to the rotation of a solid body, which can be solved independently with the conservation of angular momentum. In RANS or LES, an arbitrary length scale, e.g. integral length, or turbulence model must be used to close the system of governing equations. In MCT, these equations flow directly from the nature of continuum mechanics and the second law of thermodynamics. This paper will derive new, objective, mathematical tools from MCT for visualizing structures within the three-dimensional flow.
The aim of this paper is to demonstrate the capability of MCT to produce compressible, three-dimensional, turbulent flow data that demonstrate at least qualitative consistency with experimental and numerical results. In addition, the effectiveness of the objective Q-criterion will be tested in its ability to visualize structure in three-dimensional turbulence. Section 2 presents the mathematical principles, variables, parameters, and derivations leading to the governing equations. From these governing equations, an objective invariant, similar to the Q-criterion in the Navier-Stokes equations, is derived. Section 3 will deal with the conversion of the analytical equations to a form suitable for numerical application. The numerical values for the material properties will be introduced, with their values determined by key dimensionless parameters. Section 4 will produce the results from the three-dimensional compressible axisymmetric hill simulation and compare them with experimental and numerical data. Contour plots of the new, frame-indifferent Q-criterion will unveil large structures such as hairpin vortices within the flow. Finally, section 5 will present concluding remarks on the reliability of the new MCT data, the value added by the new objective Q-criterion, and the future of MCT in modeling three-dimensional turbulence.
2 Morphing Continuum Theory and Turbulence
The classical continuum is characterized as a collection of infinitesimal points while the morphing continuum is defined as a continuous collection of finite size particles. The Navier-Stokes equations solve for the fluid profile at infinitesimal points throughout the domain, with the solutions describing the motion and interaction of groups of particles. With Eringen’s introduction of a new independent variable of sub-scale motion, the influence of the motion of small particles on the macroscopic behavior of the flow can be described mathematically[18] .
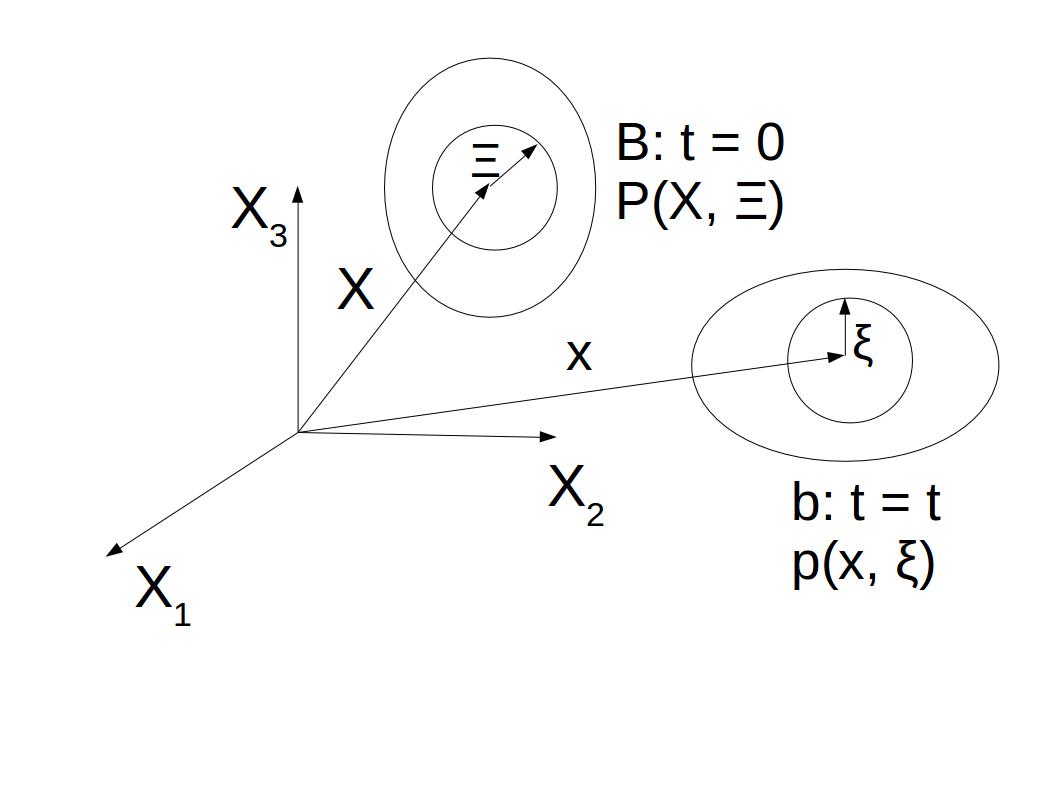
Local differences in the properties of the fluid are now explicitly stated through the addition of new properties related to the particles. While some turbulence models introduce terms such as eddy viscosity, Eringen’s theory derives new material properties related to the sub-scale viscosity and diffusivity [18] . The importance of these parameters in generating turbulence in the flow will be explained later in this section.
Individual particles in a morphing continuum can behave similarly to eddies in a turbulent flow. Figure 1 depicts the simultaneous sub-scale motion of an eddy by a local vector and a director to account for any deformation of this eddy. These vectors constantly influence and react to the macroscopic variables. Therefore, any forces that drive the overall behavior of the fluid must also alter the sub-scale motion vectors. Additionally, the motion of these vectors is shown to be a one-to-one mapping, meaning the vectors satisfy relations of the form:
| (1) | ||||||
| (2) |
Here, and refer to the macroscale vector components of the position of a particle, with initial coordinate indices denoted by and final directions denoted by . Equation 1 adds nine more degrees of freedom of sub-scale motion to the classical fluids description, making a concise picture of the overall behavior of the fluid a challenge. In the case of Morphing Continuum Theory, only three extra degrees of freedom will be introduced due to the assumption of rigid directors (c.f. equation 3).
The relationship between these individual particles in the fluid and eddies in a turbulent flow is worth addressing. Richardson notes that the range of eddy sizes within turbulence is arbitrary[19] . One can only approximate an upper limit to eddy size based on a problem’s largest relevant length scale. Furthermore, Richardson notes, turbulent structures blend together, making the tracking of eddy sizes a challenge. As Richardson notes, "big whirls have lesser whirls and so on to viscosity- in the molecular sense" [19] In other words, if a large eddy appears to form in a turbulent flow, further investigation will reveal that this eddy is in fact composed of smaller eddies, which themselves may be composed of even smaller eddies. This observation requires any analytical theory to start from a carefully selected small length scale and reconstruct larger eddies from that scale.
Morphing continuum theory achieves this goal by assuming a quality of the fluid known as sub-scale isotropy. This assumption allows for the elimination of the extra degrees of freedom of sub-scale motion mentioned earlier. Any elongations or compressions of the eddies in a turbulent flow are presumed to be isotropic at the length scale of the smallest eddies. As a mathematical consequence, the directors used to describe sub-scale motion become orthonormal [18] :
| (3) |
In short, any stretching motion of a particle is irrelevant, and the only motion that becomes relevant at this smallest scale is its local rotation. Deformations of any larger structures in the flow still occur, as in classical fluids. For individual particles, equation 3 leaves only sub-scale rotation and translation. Each particle is characterized as a rigid sphere with self-spinning rotation. Since individual particles can represent individual eddies, larger eddies can always be composed of eddies with their own independent rotation. Richardson’s picture becomes a mathematical description of the fluid.
With the introduction of sub-scale deformations, Eringen defines a property corresponding to a particle’s resistance to that deformation[18] :
| (4) |
The term serves a role similar to the moment of inertia of the particle, and has its own definition[20] :
| (5) |
Taking the average of the trace of the subscale inertia tensor from equation (4) yields:
| (6) |
As discussed earlier, MCT uses spherical particles as the fundamental components of the fluid. These spheres still contain their own inertia, with the characteristic length scale being the diameter of the sphere. Chen showed that a fluid of spherical particles leads to the relation [21] . Therefore, is a parameter available for controlling the size of eddies. If the smallest eddy remains smaller than the smallest element within a mesh, then this parameter allows for the modelling of that subgrid scale. For this paper the fluid will consist of a set of particles with uniform size, thus making the parameter constant.
With the addition of the rotation of the particles, the concept of strain in the fluid must be altered from that of classical fluids. Taking material derivatives of the deformation tensors in equation 1, Eringen derives the morphing continuum strain-rate tensors, and , as[18] :
| (7) |
| (8) |
These new tensors show how the gyration, , or local rotation of the particles adds to the familiar strain-rate, which is produced in classical fluids only by transverse velocity gradients. The tensor indicates that an entirely new strain is experienced from simple gradients in the gyration. The physical meaning of this strain will become evident when stress tensors are expressed in terms of the deformation tensors. With this new variable for gyration, MCT provides the means of calculating the rotational kinetic energy of individual structures. Given a fluid density , the rotational energy of a particle then becomes . Since these particles mimic the behavior of eddies, this expression can be used to approximate turbulent kinetic energy. In the simulations of turbulence before and after a shock, this term will carry the information about eddy energy transfer [16, 22] .
The governing equations for MCT are derived from balance laws for mass, linear momentum, angular momentum, and energy. In tensor form, the balance laws are written as:
| (9) |
| (10) |
| (11) |
| (12) |
Dotted terms refer to their material derivatives, i.e. . Here, is the body moment density, is the Cauchy stress tensor, is the body force density, is the moment stress tensor, is the internal energy density, and is the heat flux. These laws are derived directly from rational continuum thermomechanics (RCT) and apply to any morphing continuum, the term used for any space composed of spherical inner structures [18, 6, 23, 24] .
To obtain the governing equations for MCT, constitutive equations are used to relate the Cauchy and moment stresses and the heat flux to the velocity and gyration in the flow. These linear constitutive equations are derived to be [18, 21, 25] :
| (13) |
| (14) |
| (15) |
Here is the pressure, is the first coefficient of viscosity, is the second coefficient of viscosity, is the permutation tensor, is the sub-scale viscosity coefficient, is the sub-scale diffusivity, and are material constants, is the temperature gradient, is the thermal conductivity, and and are the deformation-rate tensors shown earlier. When the expressions for deformation-rate tensors in equations 7 and 8 and stress tensors are plugged into the balance laws with body forces neglected, the governing equations have the form:
| (16) |
| (17) |
| (18) |
| (19) |
where is the total energy density of the fluid. The dotted variables refer to the material derivative of those variables.
To close this system of equations, the pressure and density must be related to the specific energy . For this case, the fluid is presumed to be an ideal gas, leading to the relations:
| (20) |
| (21) |
Here, and refer to the specific heats of the fluid at constant pressure and volume respectively. The ratio was set to the value for air, .
These equations set the foundation for the numerical solver and the process of visualizing eddies in the flow. Before the details of the numerical analysis can be explained, a key mathematical tool from the governing equations must be derived.
2.1 The Q-criterion of MCT
The subject of the identification of a vortex has been discussed for decades, with various mathematical and physical arguments given for how to isolate true vortices in the flow [26, 27, 28, 29] . Qualitative definitions involving swirling motion or quantitative arguments based on the presence of high vorticity were among the first criteria proposed to distinguish vortices in the flow. As defined by Hunt, the Q-criterion focused on restricting the value of the velocity-gradient tensor and requiring the existence of a local minimum in the pressure [27] .
This practice of determining which facets of the flow counted as true vortices continued with the study of invariants. The local pressure minimum criterion eventually evolved into a requirement that the well-known invariant remain negative in the flow. In these cases, vortices become apparent for steady Navier-Stokes flows, with the observer sitting in a Gallilean coordinate system [29] . Haller noted, however, that simple rotations of the coordinate system caused both the Q and criteria to break down. Haller’s discussion expanded into a broader investigation of what kind of criteria succeeded in identifying vortices, independent of the physical situation and choice of coordinate system. Specifically, the invariants used to determine the presence of a vortex needed to preserve “objectivity,” or indifference to a precise change in the reference coordinate system [29, 30] .
One invariant that satisfies this criterion emerges from the deformation-rate tensor, , defined in equation 7 [6]. This strain encompasses the traditional strain-rate produced from the velocity gradient and adds the local rotation supplied by the gyration of individual particles. Including both of these motions is essential to calculating objective quantities in MCT. Eringen demonstrates that objectivity is maintained in a morphing continuum by taking into account macroscopic and sub-scale deformations simultaneously, both of which are featured in equation 7 [6] . Only by accounting for these motions can remain indifferent to coordinate transformations. This characteristic of the deformation in MCT is essential for maintaining a rigorous standard for vortex identification. This paper will seek to reformulate the Q-criterion as a first step towards establishing an objective criterion for identifying a vortex.
From linear algebra, one invariant calculates the level of asymmetry in a two-dimensional matrix, e.g. the strain-rate tensor. Setting this invariant to be , the expression for this value has the form [26] :
| (22) |
where is the deformation-rate tensor. If the fluid obeys the continuum assumption, then this expression expresses a balance between the magnitude of the vorticity and the shear strain rate [26] . Since the deformation-rate tensor in equation 7 contains the shear rate and the gyration, this new invariant involves a balance of more aspects of the flow.
If the expression for from equation 7 is substituted into equation 22, the invariant becomes:
| (23) |
Multiplying and canceling the appropriate terms yields:
| (24) |
where the identities and have been employed. Letting all the indices go to their respective coordinates in the three-dimensional Euclidean coordinate system, it is clear that the diagonal terms associated with the compressibility of the fluid disappear when the indices from the shear terms equal one another. Therefore, the invariant used for vortex visualization in MCT under Euclidean coordinates has the form:
| (25) |
The final version of the invariant contains the expected shear strain-rate components from both the large and small scales of motion. The familiar velocity gradient terms, contained in the Q-criterion for the Navier-Stokes equations, are now balanced with the magnitude of the gyration for individual particles. If the gyration terms disappear, the Navier-Stokes Q-criterion is recovered [26, 27] . This fact is a consequence of the governing equations of MCT reducing to the Navier-Stokes equations when the gyration is set to zero. Also, if the gyration equals zero and the macroscopic stresses cancel one another out, then the macroscopic flow simply has no preferred rotational direction. Finally, if all stresses become zero then, naturally, no vortical motion could possibly exist and the invariant dissapears once more. As observed by Jeong et al for the Navier-Stokes’ Q-criterion, a non-zero value is expected to produce visible eddies but may not be sufficient to visualize a true vortex [26] . Future investigations into this criterion and how it relates to other formal definitions of vortices are needed to make a conclusive case that MCT identifies true vortices. Still, the new expression from MCT allows for a new objective tool of visualizing eddies and turbulent structures of various sizes in the three-dimensional flow.
3 Numerical Implementation
3.1 Finite Volume Method
For this work, the finite volume method is used to discretize the MCT balance laws. The spatial domain is divided into connected control volumes, or cells, with the physical variables solved at the center of each cell.
The transport equation for any conserved property can be written in the following form:
| (26) |
Here, refers to the transport variable, is the diffusion coefficient, and is the source function for . If , equation 26 becomes the continuity equation 16. Setting yields the linear momentum equation 17, while yields the new governing equation for the angular momentum 18. Finally, if the new energy equation 19 is obtained.
The finite volume method requires that the governing equations in their integral form be satisfied over the control volume. Applying spatial integration to Eq. 26 gives:
| (27) |
The diffusion term in equation 26 can be approximated as:
| (28) |
where represents the surface vector of the face, and denotes the summation over the faces of the control volume. The term can be obtained from the weighted average of the gradients at the centroids of the face multiplied by the diffusivity at the centroid:
| (29) |
where the subscripts and represent the nodes at the center of the owner cells and neighbor cells respectively. Here, is the geometric interpolation factor related to the position of the element face with respect to the cell center . The gradient term located at the cell center is computed using the Green-Gauss theorem [31] :
| (30) |
The nonlinear convection term in equation 26 requires a special treatment. The scheme adopted for the convection term should be able to capture any shock waves and discontinuities, and at the same time avoid oscillations. The convection term can be approximated as:
| (31) |
Notable methods found in the literature that are able to effectively produce accurate non-oscillatory solutions are: piecewise parabolic method (PPM) [32] ; essentially non-oscillatory (ENO) [33, 34] ; weighted ENO (WENO) [35] ; and the Runge-Kutta discontinuous Galerkin (RKDG) method [36] . All of these methods involve Riemann solvers, characteristic decomposition and Jacobian evaluation, making them troublesome to implement.
In the present solver a simple forward-Euler scheme is implemented for the unsteady term:
| (32) |
where represents the cell volume, the subscript gives the cell center, and superscripts and refer to the new and old time values respectively. In these schemes, different temporal solvers can be substituted. One can input a higher-order Runge-Kutta time integration scheme to achieve a higher level of accuracy. Kurganov et al demonstrated that stability is achieved with the implementation of a modified Euler method [37] . For this scheme, the diffusion terms in the momenta equations are solved at the new time step, meaning that the implicit character that allows for numerical stability of the KNP algorithm is preserved. The scheme implemented in this study is a second-order semi-discrete, non-staggered scheme, introduced by Kurganov, Noelle and Petrova (KNP) as a generalization of the Lax-Friedrichs scheme [37] . The interpolation procedure from the cell center to the face center implemented in this scheme is split into two directions corresponding to the outward or inward direction of the face normal:
| (33) |
where is the same as and . The subscript is denoted for the directions coinciding with , and for the opposite direction, the weighted coefficient, and is the diffusive volumetric flux. The two terms and in equation 33 represent the flux evaluated at the and directions respectively. The last term, , is an additional diffusive term based on the maximum speed of propagation of any discontinuity that may exist at the face. The weighting coefficient is based on the local speed of propagation shown below:
| (34) | |||
| (35) |
Here is the speed of sound of the fluid. The weighting factor is:
| (36) |
and the diffusive volumetric flux is:
| (37) |
3.2 Initial and Boundary Conditions
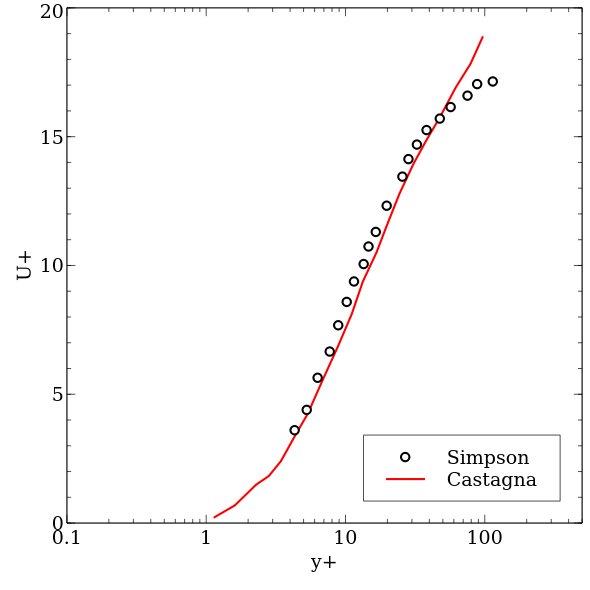
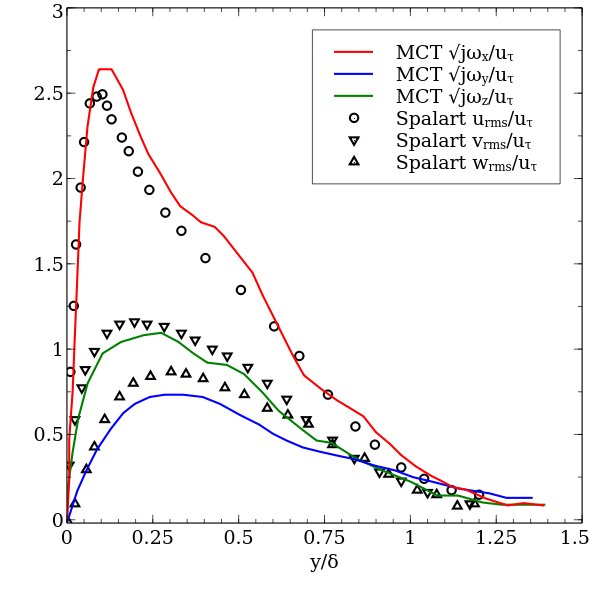
An inlet boundary layer profile with a thickness of was specified with an otherwise uniform flow of at the inlet of a domain with as per Castagna et. al. [38] . The inflow velocity profile was specified by using the mean velocity of the precursor simulation done by Castagna et. al. [38] and comparing the profile with the inflow profile measured experimentally by Simpson [39] . Figure 3 shows that the inflow profiles match very well near the wall and overpredict the velocity in the log layer where . The profiles share a boundary layer thickness of . This discrepancy was kept to see if MCT could still capture experimental flow phenomena in the bulk flow. Turbulent fluctuations were specified by equating the root-mean-square (rms) of the new variable of gyration with the root-mean-square (rms) velocities specified by Castagna et. al. and compared with Spalart [38, 40] . Figure 4 compares the normalized root-mean-square data from MCT and Castagna et. al. with the experimental data obtained by Spalart [40] . The discrepancies are the same for both MCT and Castagna et. al. , since the data by Castagna et. al. was directly transferred to the gyration variable, via the expression . Therefore, the kinetic energy generated by fluctuations in the velocity profile by Castagna et. al. matches the rotational kinetic energy produced by the gyration. Discrepancies between the DNS and experimental data were most notable in the log-layer. These discrepancies were preserved in the gyration, again to see if MCT could still produce better agreement with experiment given the same initial flow data.
2
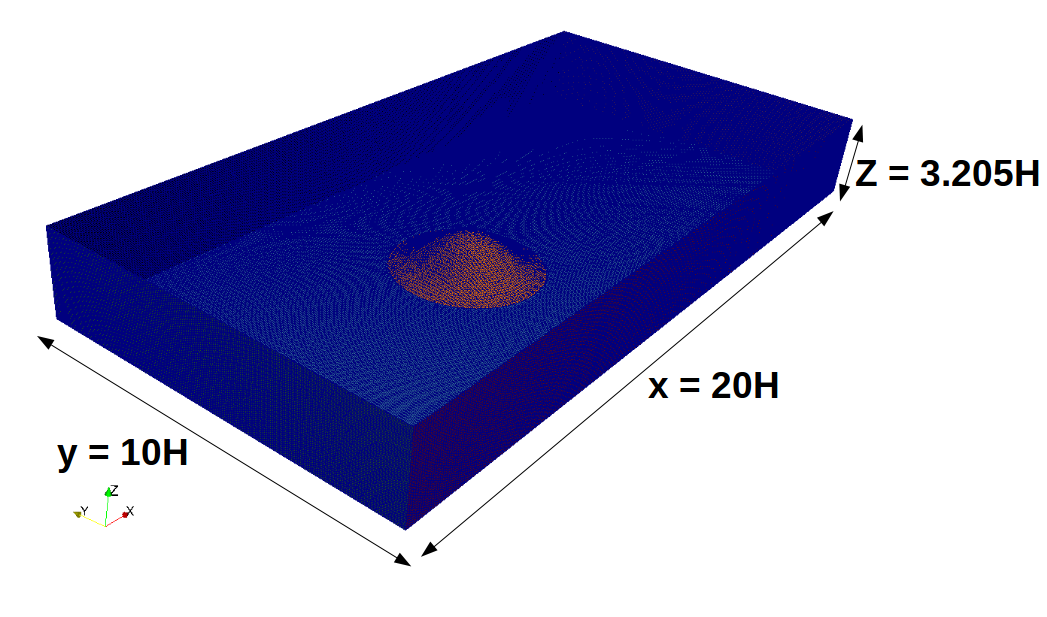
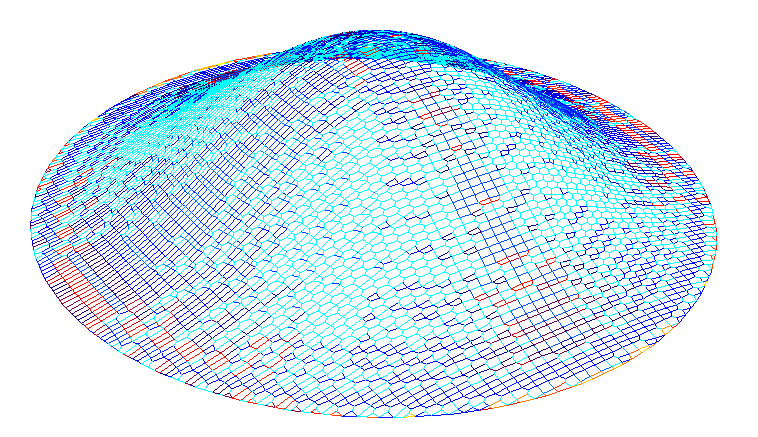
Inflow density, total viscosity , and freestream velocity , were all set to ensure the Reynolds number, , based on the height matched the value of 6500 by Castagna et. al. The time-step for the MCT simulations was s, shorter than the value of s by Castagna et. al.. The smaller mesh cells near the wall required these small time step values, but the resulting data benefited from increased temporal accuracy. The wall-normal mesh distribution was set to have a simple grading whereby the last cell away from the wall would be 200 times the length of the smaller cell near the wall. Non-reflective boundary conditions were set at the top and outlet of the domain to prevent unphysical pressure effects from affecting the dynamics at the hill and to follow the setup by Castagna et. al. [38] . Periodic boundary conditions were set in the spanwise direction, also in line with the conditions by Castagna et. al. [38] . Zero gradient, and no-slip boundaries for the velocity, were set at the floor and hill. The mesh near the hill was tailored to the shape of the hill, determined by the mathematical functions set in Castagna et. al. [38] . Table 2 lists the key statistics associated with this custom mesh. A key note is the number of cells for this mesh, totaling around 6.7M elements. With the unstructured mesh, however, the viscous sublayer, defined by the limit , contained 30 cells as opposed to the 10 cells needed in the mesh by Castagna et. al. [38] . Still, the argument that MCT can provide results comparable to DNS data without the associated computational costs is supported by the dramatic decrease in mesh cell number.
| Parameter | Value |
|---|---|
| Maximum Aspect Ratio | 8.62886 |
| Time Step | s |
| Maximum Skewness | 5.124 |
| 0.148 | |
| Number of cells: | 30 |
| Total Number of Cells |
3.3 Material Properties
Three non-dimensonal parameters to gauge the onset of turbulence are introduced by Peddieson [14] and are later explained by Wonnell and Chen [16] . These parameters can be extracted from the governing equations through dimensionless analysis [14] . For incompressible flow over a flat plate, these parameters produced turbulent velocity profiles within a boundary layer that matched experimental data produced by the European Research Community on Flow, Turbulence and Combustion (ERCOFTAC) [15] . The parameters are defined as follows:
| (38) |
In the flat plate study, proved to be the pivotal parameter in matching an experimental turbulent profile [15] . This parameter serves as a ratio between the particles’ contribution to the Cauchy stress, and the classical viscous diffusion term, , in the linear momentum equation 17. Local variation in the gyration of the particles leads to a tension in the fluid that disrupts the otherwise smooth laminar flow. The classical viscous diffusion attempts to smooth disruptions created by differences in gyration, and so the balance of these forces is critical for determining whether a flow has reached a turbulent state. This result indicates that the tension created by differences in rotational motion of particles needs to exceed viscous diffusion by a considerable amount in order to maintain turbulence within an incompressible boundary layer.
Table 3 gives the values of the three dimensionless parameters for that successfully generated turbulence in the incompressible case. The problem of capturing sub-grid length scales becomes more important when the turbulence becomes more compressible, as the smallest eddies could be impacted by density fluctuations. The balance of compressibility with viscous fluctuations occurs at all scales of motion. This balance is reflected in the new total viscosity, , of the fluid found in the Reynolds number, . The contribution of individual structures to the total viscous resistance of the fluid is captured through . This simulation incorporates no sub-grid models and will allow for the effects of compressible turbulence to be taken into account.
4 Results
Results were obtained after the freestream flow made 1.2 trips through the domain to follow the example of Castagna et. al., or around [38] .
6
3
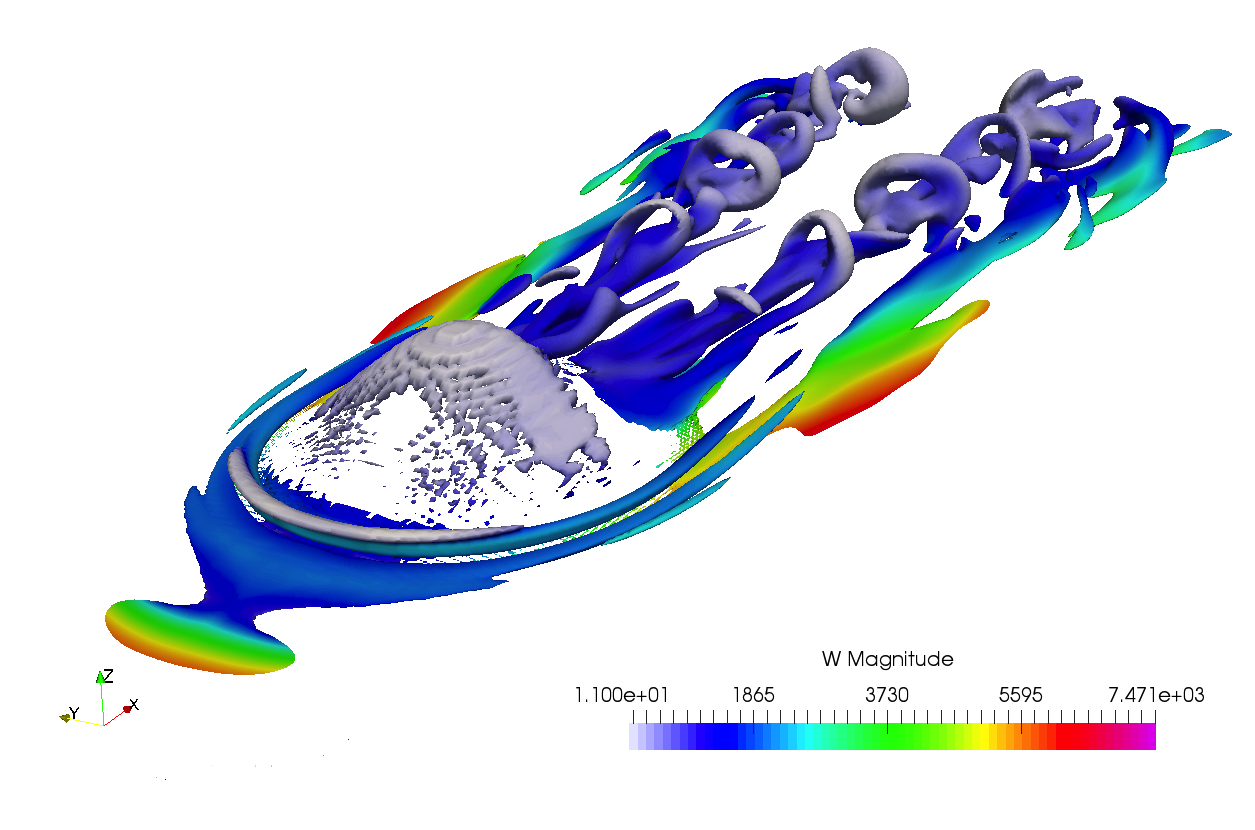
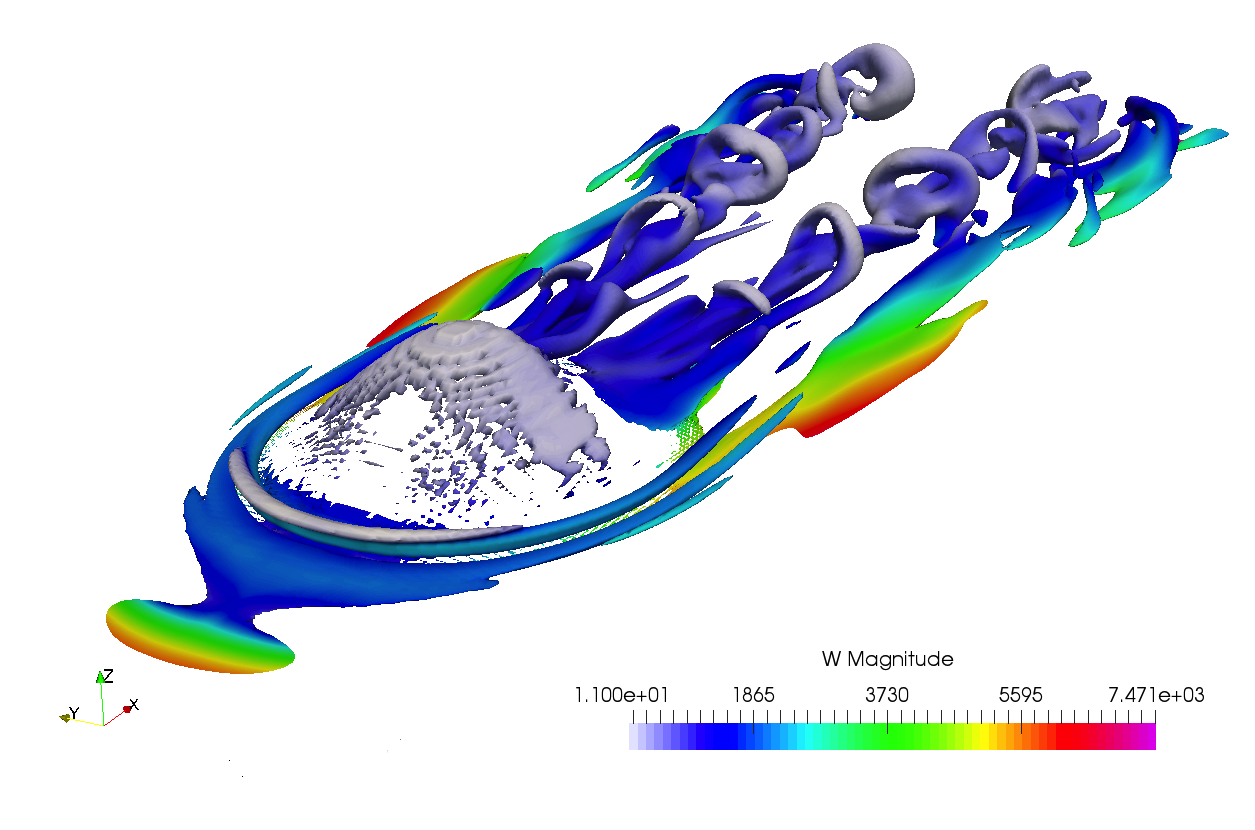
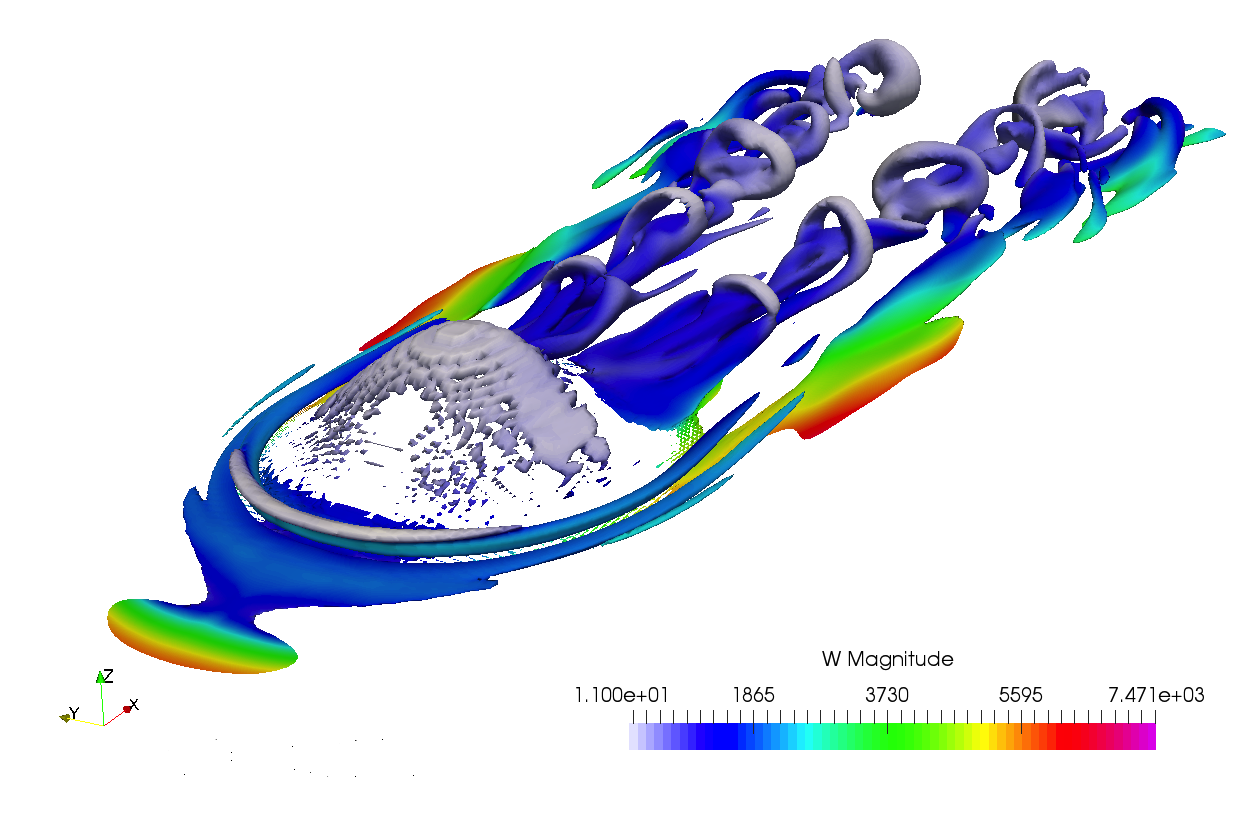
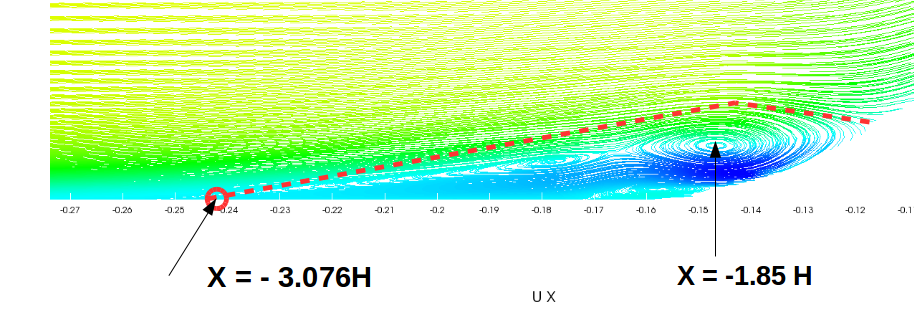
Figure 5 highlights the formation of the separation bubble on the windward side of the hill using streamlines of the flow along the centerline . The leeward side does not show any apparent separtion bubble. Meanwhile the outline of the MCT windward side bubble falls slightly below some of the recirculation in the MCT data. The reattachment point for the MCT data, at , is slightly downstream than the prediction by Castagna et. al. at , but the size of the windward bubble in MCT clearly exceeds the predictions by Castagna et. al. Inflow turbulence generated near the wall from the gyration and velocity fluctuations may have lead to a much earlier separation point for the MCT flow.
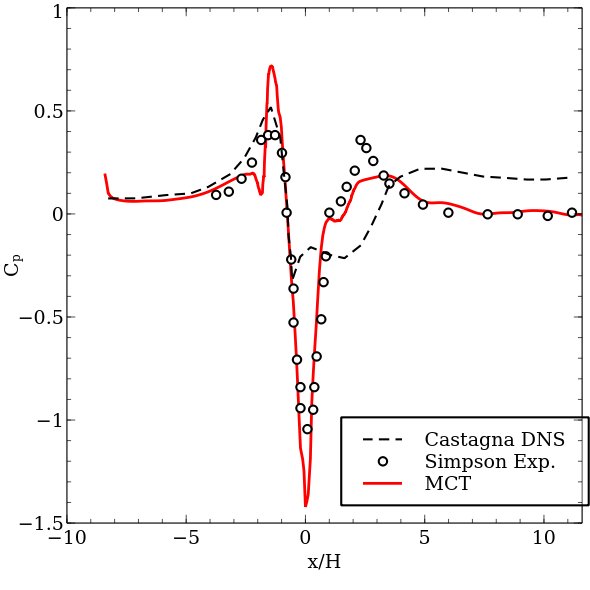
Figure 6 shows that experimental data for the pressure coefficient obtained from Simpson [39] line up more closely with MCT than the numerical results from Castagna et. al. [38] . These successful comparisons add confidence to the statement that numerical simulations of MCT produce realistic, physical flow data without the need for excessively dense grids or high computational costs. The pressure peak downstream of the hill appears at . The DNS study failed to capture this peak, but MCT clearly demonsrates a local peak in this region. After this peak, MCT captures the further evolution of the wall pressure while the data by Castagna et. al. overpredicts the surface pressure. The rapid differences in the vorticity found near the secondary local peak are likely the cause of the local variance in pressure. Simpson noted that the pressure coefficient could be directly related to the vorticity flux [39], and the resolution of this vorticity near the wall likely helps the resolution of the surface pressure.
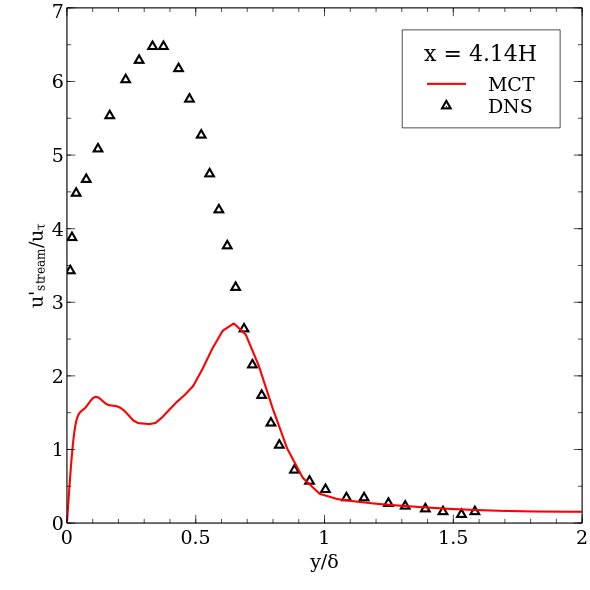
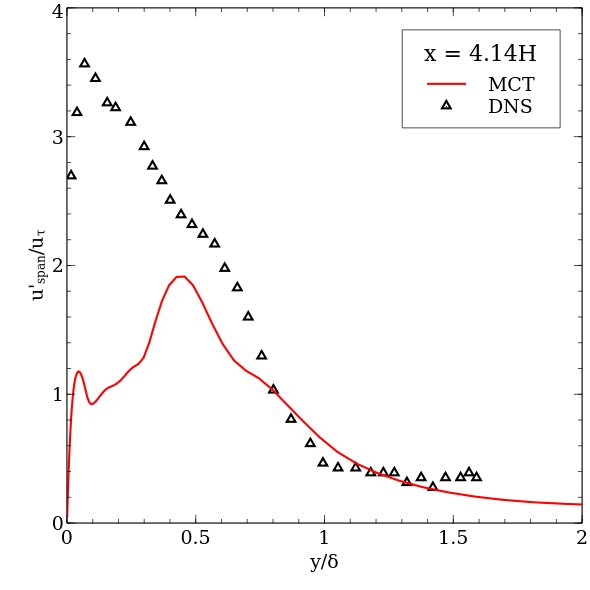
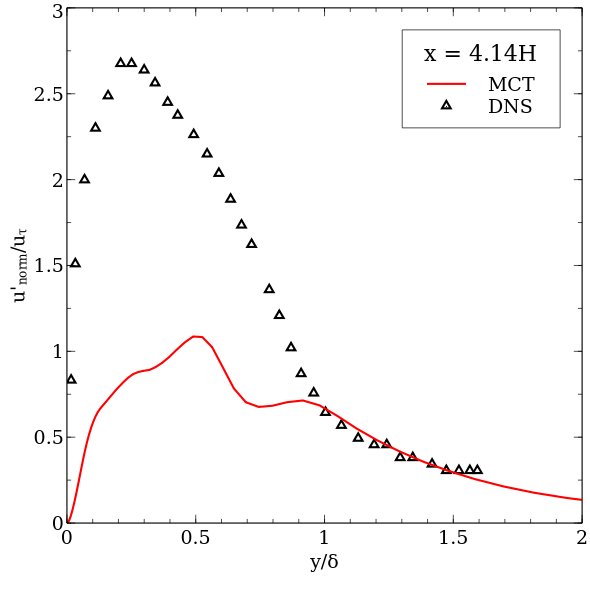
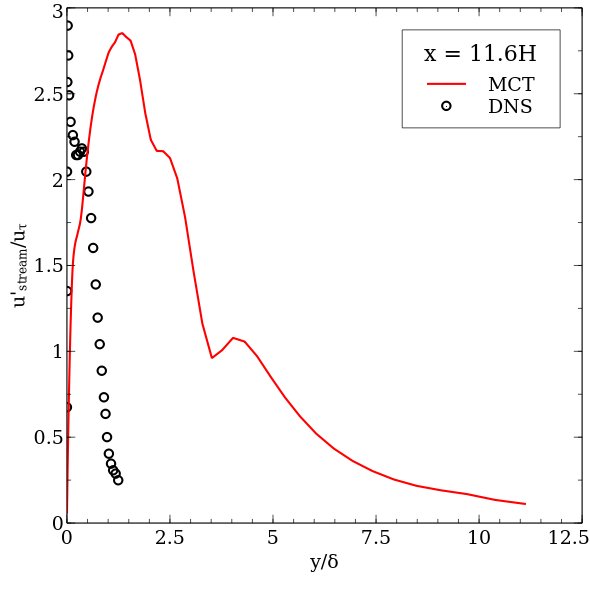
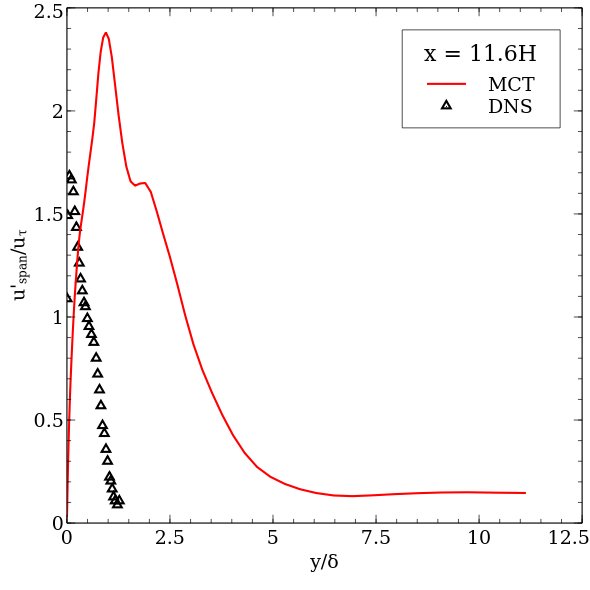
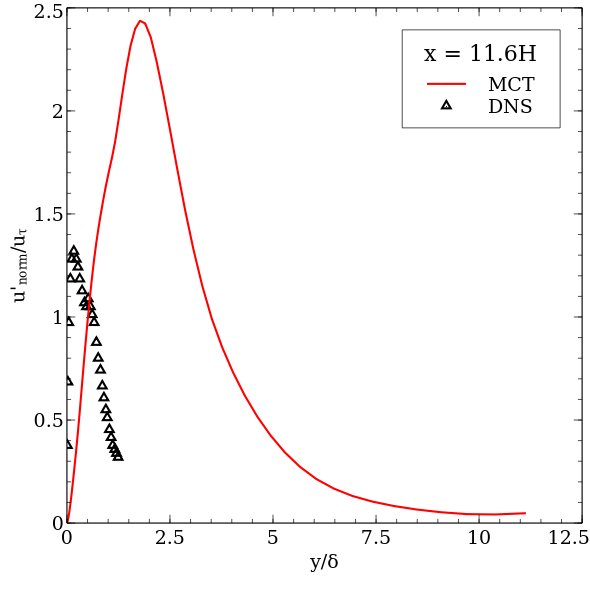
Near the wall, turbulent fluctuations in MCT data behave in recognizable patterns, but contain noticeable differences from Navier-Stokes simulations. Figure 7 compares the turbulence intensities from Castagna et. al. [38] and MCT data at the same Reynolds number. The MCT turbulence intensities are calculated from gyration. The gyration variable is considered as a stochastic variable and used to perturb the velocity field. The MCT turbulence intensities () are obtained by finding the root-mean-square value of gyration [41]
| (39) |
Qualtiatively similar results are found near the edge of the boundary layer downstream of the hill, and near the wall upstream of the hill. MCT results demonstrate the characteristic peak and decline in turbulence intensity, with some noticeable differences in the wall-normal data. Downstream of the bump at , the boundary layer in the MCT data shrinks considerably, leading to a wider spread of the turbulence intensity. The downstream behavior is likely affected by the formation of structures such as hairpin vortices.
More in-depth information of the structure of the flow is found using the MCT Q-criterion [30]. Figure 8 shows the isosurface of the Q-criterion colored by the gyration. Figure 8 reveals structures within the turbulence, and particularly hairpin vortices downstream of the hill. Periodic regular hairpin vortices emerge for the Q-value of , with the arches of these vortices characterized by a low value of gyration. Since these structures are all described by the same value for the Q-criterion, these lower regions of gyration must correspond to higher values of velocity gradients. Here, the macroscale component of the flow is dominant. Near the floor, however, gyration plays a more critical role in determining local evolution of strucutre near the wall. Overall, the new Q-criterion provides the tool to visualize the evolution of large-scale structures that form within the flow and see how small and large scale rotations affect the dynamics and topology of the bulk flow.
5 Conclusion
Direct comparisons with the experimental results of Simpson [39] and the numerical data of Castagna et. al. [38] suggest that MCT can reproduce several aspects of flows simulated using the N-S equations on coarser grids and provide new tools for visualizing the behavior of flow structures. The obtained plot of the separation bubble lines on the windward side of the bump yields recirculation qualitatively similar to DNS results, and the associated pressure coefficient matches more closely with experimental data likely due to the presence of large vorticity differences near the wall. Turbulence intensities are shown to be qualitatively similar to the data by Castagna et. al., though differences are found primarily near the wall. The sharp drop in mesh size as compared with Castagna et. al. [38] shows turbulent fluctuations, hairpin vortices, and pressure trends can be obtained without incurring high computational costs. Furthermore, MCT adds an objective Q-criterion for flow visualization, and can observe variation in local rotation in these structures through the gyration variable. Since the gyration acts on the flow only at the smallest scales, an analysis can be done to see how the inner structure of the flow affects the behavior of larger structures. The contour plots suggest that hairpin vortices contain regions of high gyration near the wall but develop regions of low gyration at the top. These regions can show where small or large scale differences in rotation predominate.
These initial comparisons with DNS and experimental data represent a first step for MCT to model compressible turbulence and identify vortices. The new Q-criterion makes possible a new discussion of what variables and which length scales matter for the formation and evolution of structures within turbulent flows. Future work with canonical cases involving the formation of vortices will illuminate how sub-scale motion affects the formation or decay of large and small vortices. Altering values for , which denotes the contribution of the inner structure to the evolution of turbulence will show the role gyration plays in the shape and stability of vortices. Identifying vortices and distinguishing them from large or small-scale eddies in the flow will give a better assessment of the structure of the turbulence, which will in turn yield better information on the turbulence intensity, pressure, and stress profiles. With the multiscale character of MCT, this information on the structure of turbulence can be obtained from smaller mesh sizes and fewer computational resources. It should be emphasized that MCT is constructed on the basis of two different length scales within a continuum. On the contrary, RANS and LES are formulated within the classical continuum with single length scale and the additional length scale is introduced through statistical averaging or filtering. Therefore, unlike RANS and LES, the MCT constitutive equations can be completely formulated through the second law of thermodynamics and sufficient to close the system of the governing equations.
Acknowledgements
This material is based upon work supported by the Air Force Office of Scientific Research under award number FA9550-17-1-0154. The authors would like to thank our coworkers Mohamed Mohsen Ahmed and Allison Adams for their assistance and insights at every stage of this process.
References
- Wilcox [1988] Wilcox, D. C., “Reassessment of the scale-determining equation for advanced turbulence models,” AIAA Journal, Vol. 26, No. 11, 1988, pp. 1299–1310. 10.2514/3.10041.
- Rodi [1997] Rodi, W., “Comparison of LES and RANS calculations of the flow around bluff bodies,” Journal of Wind Engineering and Industrial Aerodynamics, Vol. 69, 1997, pp. 55–75. 10.1016/S0167-6105(97)00147-5.
- Park and Kwon [2004] Park, S. H., and Kwon, J. H., “Implementation of k-omega turbulence models in an implicit multigrid method,” AIAA Journal, Vol. 42, No. 7, 2004, pp. 1348–1357. 10.2514/1.2461.
- Pitsch [2006] Pitsch, H., “Large-eddy simulation of turbulent combustion,” Annual Review of Fluid Mechanics, Vol. 38, 2006, pp. 453–482. 10.1146/annurev.fluid.38.050304.092133.
- Van Ingen [1956] Van Ingen, J. L., “A suggested semi-empirical method for the calculation of the boundary layer transition region,” Technische Hogeschool Delft, Vliegtuigbouwkunde, Rapport VTH-74, 1956.
- Eringen [1964] Eringen, A. C., “Simple microfluids,” International Journal of Engineering Science, Vol. 2, No. 2, 1964, pp. 205–217. 10.1016/0020-7225(64)90005-9.
- Joslin et al. [1993] Joslin, R. D., Streett, C. L., and Chang, C.-L., “Spatial direct numerical simulation of boundary-layer transition mechanisms: Validation of PSE theory,” Theoretical and Computational Fluid Dynamics, Vol. 4, No. 6, 1993, pp. 271–288. 10.1007/BF00418777.
- Fürst et al. [2013] Fürst, J., Straka, P., Příhoda, J., and Šimurda, D., “Comparison of several models of the laminar/turbulent transition,” EPJ Web of Conferences, Vol. 45, EDP Sciences, 2013, p. 01032. 10.1051/epjconf/20134501032.
- Chen et al. [2012a] Chen, J., Liang, C., and Lee, J. D., “Numerical simulation for unsteady compressible Micropolar fluid flow,” Computers & Fluids, Vol. 66, 2012a, pp. 1–9. 10.1016/j.compfluid.2012.05.015.
- Walters and Cokljat [2008] Walters, D. K., and Cokljat, D., “A three-equation eddy-viscosity model for Reynolds-averaged Navier–Stokes simulations of transitional flow,” Journal of Fluids Engineering, Vol. 130, No. 12, 2008, p. 121401. 10.1115/1.2979230.
- Heinloo [2004] Heinloo, J., “Formulation of turbulence mechanics,” Physical Review E, Vol. 69, No. 5, 2004, p. 056317. 10.1103/PhysRevE.69.056317.
- Kirwan [1986] Kirwan, A. D., “Boundary conditions for micropolar fluids,” International Journal of Engineering Science, Vol. 24, No. 7, 1986, pp. 1237–1242. 10.1016/0020-7225(86)90018-2.
- Mehrabian and Atefi [2008] Mehrabian, R., and Atefi, G., “A Cosserat continuum mechanical approach to turbulent channel pressure driven flow of isotropic fluid,” Journal of Dispersion Science and Technology, Vol. 29, No. 7, 2008, pp. 1035–1042. 10.1080/01932690701783093.
- Peddieson [1972] Peddieson, J., “An application of the micropolar fluid model to the calculation of a turbulent shear flow,” International Journal of Engineering Science, Vol. 10, No. 1, 1972, pp. 23–32. 10.1016/0020-7225(72)90072-9.
- Chen and Wonnell [2015] Chen, J., and Wonnell, L. B., “A Multiscale Morphing Continuum Description for Turbulence,” APS Meeting Abstracts, 2015. DOI: 10.1007/BF00418777.
- [16] Wonnell, L. B., and Chen, J., “A Morphing Continuum Approach to Compressible Flows: Shock Wave-Turbulent Boundary Layer Interaction,” AIAA 2016-4279, ???? 10.2514/6.2016-4279.
- Wonnell and Chen [2017] Wonnell, L. B., and Chen, J., “Morphing Continuum Theory: Incorporating the Physics of Microstructures to Capture the Transition to Turbulence Within a Boundary Layer,” Journal of Fluids Engineering, Vol. 139, No. 1, 2017, p. 011205. 10.1115/1.4034354.
- Eringen [1965] Eringen, A. C., “Theory of micropolar fluids,” Tech. rep., DTIC Document, 1965. 10.1512/iumj.1967.16.16001.
- Richardson [1922] Richardson, L. F., Weather Prediction by Numerical Process, Cambridge University Press, 1922. 10.1017/CBO9780511618291.
- Chen et al. [2012b] Chen, J., Liang, C., and Lee, J. D., “Micropolar electromagnetic fluids: Control of vortex shedding using imposed transverse magnetic field,” Journal of Advanced Mathematics and Applications, Vol. 1, No. 1, 2012b, pp. 151–162. 10.1166/jama.2012.1011.
- Chen et al. [2012c] Chen, J., Liang, C., and Lee, J. D., “Numerical simulation for unsteady compressible Micropolar fluid flow,” Computers & Fluids, Vol. 66, 2012c, pp. 1–9. 10.1016/j.compfluid.2012.05.015.
- [22] Cheikh, M. I., and Chen, J., “A Morphing Continuum Approach to Supersonic Flow Over a Compression Ramp,” AIAA 2017-3460, ???? 10.2514/6.2017-3460.
- Eringen [1999] Eringen, A. C., Microcontinuum Field Theories: I. Foundations and Solids, Springer, 1999.
- Eringen [2001] Eringen, A. C., Microcontinuum Field Theories: II. Fluent media, Vol. 2, Springer, 2001.
- Chen et al. [2011] Chen, J., Lee, J. D., and Liang, C., “Constitutive equations of Micropolar electromagnetic fluids,” Journal of Non-Newtonian Fluid Mechanics, Vol. 166, No. 14, 2011, pp. 867–874. 10.1016/j.jnnfm.2011.05.004.
- Jeong and Hussain [1995] Jeong, J., and Hussain, F., “On the identification of a vortex,” Journal of Fluid Mechanics, Vol. 285, 1995, pp. 69–94. 10.1017/S0022112095000462.
- Hunt et al. [1988] Hunt, J. C., Wray, A. A., and Moin, P., “Eddies, streams, and convergence zones in turbulent flows,” Center for Turbulence Research CTR-S88, 1988, p. 193.
- Chen et al. [2015] Chen, Q., Zhong, Q., Qi, M., and Wang, X., “Comparison of vortex identification criteria for planar velocity fields in wall turbulence,” Physics of Fluids, Vol. 27, No. 8, 2015, p. 085101. 10.1063/1.4927647.
- Haller [2005] Haller, G., “An objective definition of a vortex,” Journal of Fluid Mechanics, Vol. 525, 2005, pp. 1–26. 10.1017/S0022112004002526.
- Chen [2018] Chen, J., “Morphing continuum theory for turbulence: Theory, computation and visualization,” Physical Review E, Vol. 96, 2018, p. 043108. 10.1103/PhysRevE.96.043108.
- Darwish et al. [2015] Darwish, M., Abdul Aziz, A., and Moukalled, F., “A coupled pressure-based finite-volume solver for incompressible two-phase flow,” Numerical Heat Transfer, Part B: Fundamentals, Vol. 67, No. 1, 2015, pp. 47–74. 10.1080/10407790.2014.949500.
- Colella and Woodward [1984] Colella, P., and Woodward, P. R., “The piecewise parabolic method (PPM) for gas-dynamical simulations,” Journal of Computational Physics, Vol. 54, No. 1, 1984, pp. 174–201. 10.1016/0021-9991(84)90143-8.
- Shu and Osher [1988] Shu, C.-W., and Osher, S., “Efficient implementation of essentially non-oscillatory shock-capturing schemes,” Journal of Computational Physics, Vol. 77, No. 2, 1988, pp. 439–471. 10.1016/0021-9991(88)90177-5.
- Harten et al. [1987] Harten, A., Engquist, B., Osher, S., and Chakravarthy, S. R., “Uniformly high order accurate essentially non-oscillatory schemes, III,” Journal of Computational Physics, Vol. 71, No. 2, 1987, pp. 231–303. 10.1006/jcph.1996.5632.
- Liu et al. [1994] Liu, X.-D., Osher, S., and Chan, T., “Weighted essentially non-oscillatory schemes,” Journal of Computational Physics, Vol. 115, No. 1, 1994, pp. 200–212. 10.1006/jcph.1994.1187.
- Cockburn and Shu [1998] Cockburn, B., and Shu, C.-W., “The Runge–Kutta discontinuous Galerkin method for conservation laws V: multidimensional systems,” Journal of Computational Physics, Vol. 141, No. 2, 1998, pp. 199–224. 10.1006/jcph.1998.5892.
- Kurganov et al. [2001] Kurganov, A., Noelle, S., and Petrova, G., “Semidiscrete central-upwind schemes for hyperbolic conservation laws and Hamilton–Jacobi equations,” SIAM Journal on Scientific Computing, Vol. 23, No. 3, 2001, pp. 707–740. 10.1137/S1064827500373413.
- Castagna et al. [2014] Castagna, J., Yao, Y., and Yao, J., “Direct numerical simulation of a turbulent flow over an axisymmetric hill,” Computers & Fluids, Vol. 95, 2014, pp. 116–126. 10.1016/j.compfluid.2014.02.014.
- Simpson et al. [2002] Simpson, R. L., Long, C. H., and Byun, G., “Study of vortical separation from an axisymmetric hill,” International Journal of Heat and Fluid Flow, Vol. 23, No. 5, 2002, pp. 582–591. 10.1016/S0142-727X(02)00154-6.
- Spalart [1988] Spalart, P. R., “Direct simulation of a turbulent boundary layer up to ,” Journal of Fluid Mechanics, Vol. 187, 1988, pp. 61–98. 10.1017/S0022112088000345.
- Cheikh et al. [2018] Cheikh, M. I., Wonnell, L. B., and Chen, J., “Morphing Continuum Analysis of Energy Transfer in Compressible Turbulence,” Physical Review Fluids, Vol. 3, 2018, p. 024604. 10.1103/PhysRevFluids.3.024604.