A Study of Muon Collider Background Rejection Criteria in Silicon Vertex and Tracker Detectors
Abstract
The hit response of silicon vertex and tracking detectors to muon collider beam background and results of a study of hit reducing techniques are presented. The background caused by decays of the 750 GeV and beams was simulated using the MARS15 program, which included the infrastructure of the beam line elements near the detector and the nozzles that shield the detector from this background. The ILCRoot framework, along with the Geant4 program, was used to simulate the hit response of the silicon vertex and tracker detectors to the muon decay background remaining after the shielding nozzles. The background hit reducing techniques include timing, energy deposition, and hit location correlation in the double layer geometry.
keywords:
muon collider background; MARS15; ILCRoot; Silicon vertex and tracking detector hit simulation; background hit reducing techniques1 Introduction
The latest results [1] of a comprehensive study of interaction region (IR) and machine-detector interface (MDI) designs for 1.5 TeV muon collider [2, 3, 4] demonstrate that the muon beams background can be suppressed more than three orders of magnitude by using properly designed shielding cones (see details in [5]). Data was obtained with the MARS15 simulation program [6]. They represent the list of background particles with their characteristics given at the detector surface of the MDI (two 10∘ shielding nozzles near the interaction point (IP)).
The MARS15 output data were used as input for simulation of the detector hit response in the ILCRoot framework [7] . In this paper we present results of ILCRoot simulation of silicon vertex and tracking detectors hit response to the muon beam background. The background reducing techniques were studied on the hit level. They include use of timing, energy deposition and hit spatial correlation in the double layer geometry of silicon vertex and tracking detectors.
Event tracks come from the IP. Background comes from the beamline, most of which is not at the IP.
2 The MARS15 Modeling Results
The major source of the detector background in collider is the electrons and positrons from beam muon decays. For 750 GeV muon beam with intensity of per bunch there are about decays per meter per bunch crossing. The decay and produce high intensity secondary particle fluxes in the beam line components and accelerator tunnel in the vicinity of the detector (interaction region IR, Figure 1). As it was shown in the recent study [1], the appropriately designed interaction region and machine detector interface (including shielding nozzles, Figure 3 and Figure 3 ) can provide the reduction of muon beam background by more than three orders of magnitude for a muon collider with a collision energy of 1.5 TeV. These results were obtained with the MARS15 simulation code, the framework for simulation of particle transport and interactions in accelerator, detector and shielding components. The MARS15 model takes into account all the related details of geometry, material distributions and magnetic fields for collider lattice elements in the vicinity of the detector including shielding nozzles.
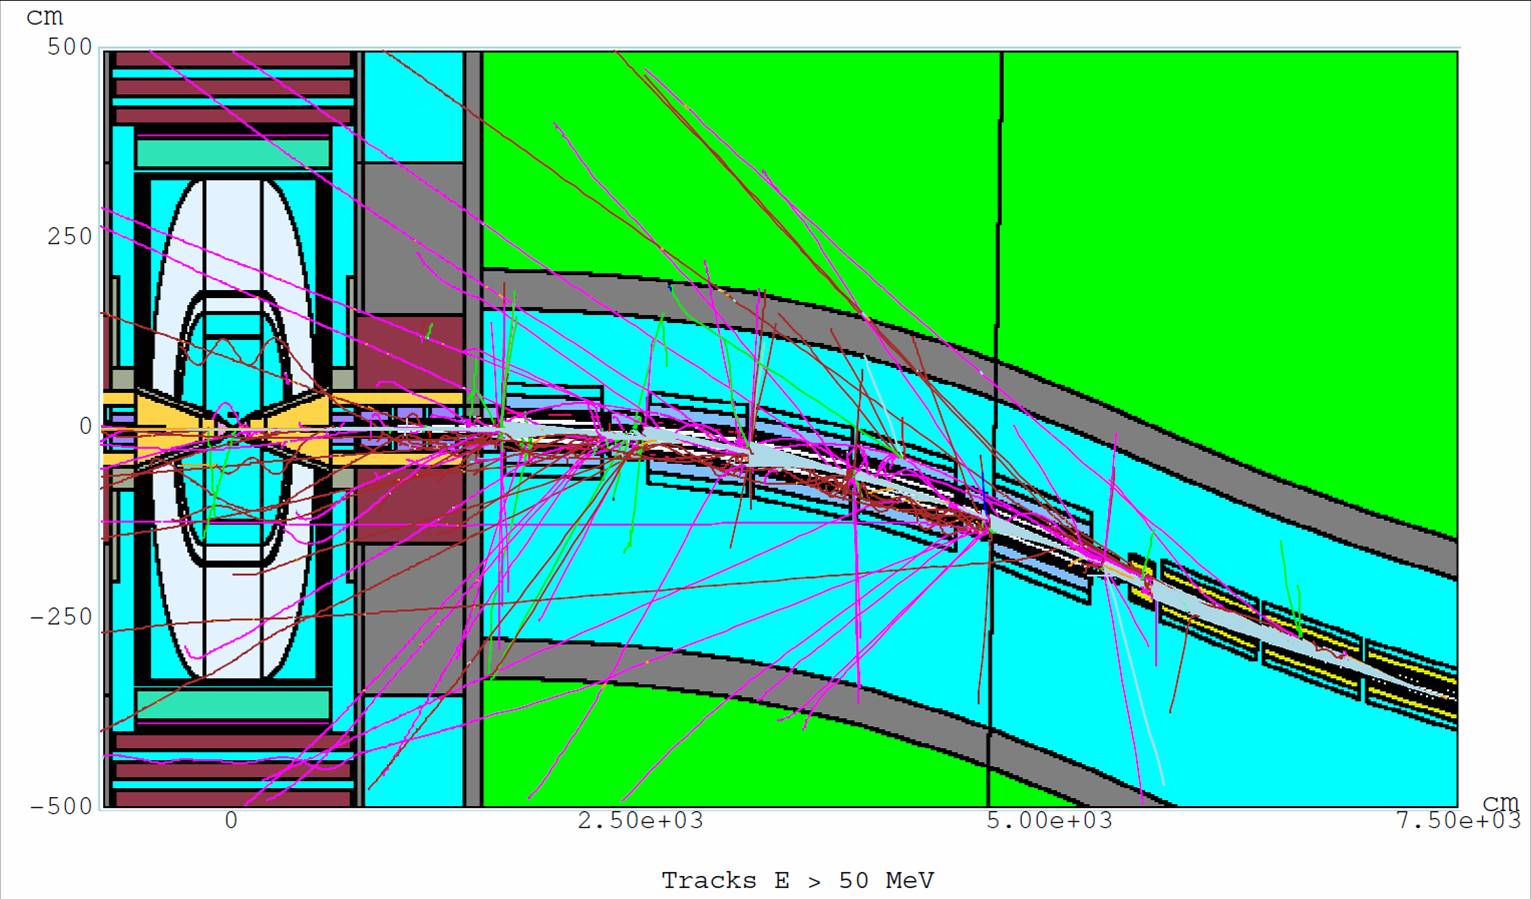
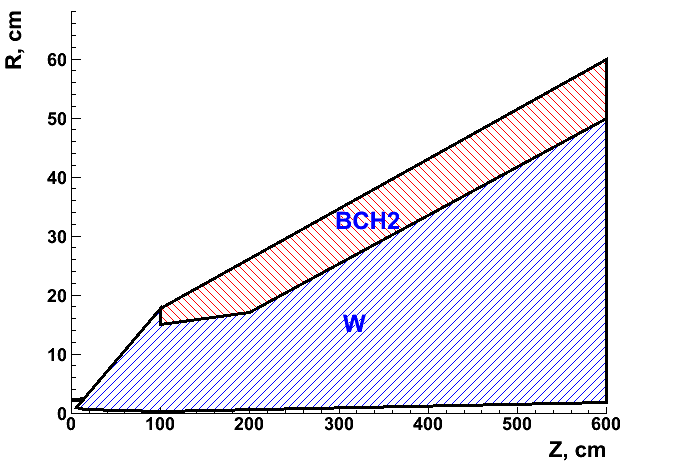
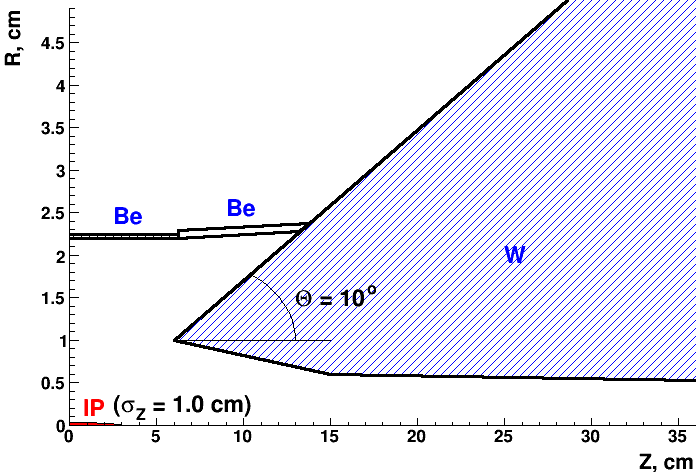
The amount of MARS15 simulated data was limited to 4.6% of the decays on the 26 m beam length yielding total of background particles per bunch crossing (BX). The corresponding statistical weight (22.3) was taken into account in the following ILCRoot simulation. For each given MARS15 particle its momentum was smeared azimuthally 22-23 times to get 100% statistics and provide total yield of particles entering the detector in the ILCroot simulation. The most abundant background consists of photons and neutrons. Table 1 lists these background yields together with kinetic energy thresholds used in the MARS15 simulation for different types of particles.
| Particles | n | e | p, | ||
|---|---|---|---|---|---|
| Yield/BX | 1.72x | 1.51x | 1.5x | 6.04x | 0.28x |
| Threshold | 100 keV | 0.001 eV | 100 keV | 100 keV | 100 keV |
3 The ILCRoot Simulation of the Hits in Vertex and Tracker Silicon Detectors
ILCRoot [7] is the software Infrastructure for Large Colliders based on ROOT [8] and add-ons made for muon collider detectors studies. It makes use of the virtual Monte Carlo concept allowing one to select and load at run time different Monte Carlo models (Geant3, Geant4, Fluka). We used Geant4 [9] with the QGSP-BERT-HP-LIV physics list for a better description of the neutron transport and low energy EM processes. The ILCRoot simulation presented here was limited to the hit level only and did not include the front-end electronics response.
3.1 Detector Layout
In this work the geometry of the ILCRoot detector included the vertex (VXD) and tracker (Tracker) silicon subsystems as the only sensitive detectors. The other detectors such as muon spectrometer, electromagnetic and hadron calorimeters were used as material in interactions with background particles without hit simulation. Other non active components were the shielding nozzles, detector magnet coil and walls.
The vertex and tracker silicon detector layouts are based on the SiD ILC concept [10]. The vertex subsystem comprises of five barrel layers with radii 3-14 cm and length of 12 cm in Z-direction and eight end-cap disks. The tracker has five barrel layers with radii 20-120 cm and lengths of 50-320 cm in z-direction and fourteen end-cap disks. In addition to the SiD ILC concept, the silicon forward tracker detector with six end-cap disks was used to cover and improve tracking in the forward region with high hit occupancy.
The barrel layer of vertex and tracker detectors has two sublayers, each 75 microns and 200 microns thick, respectively. To study an effect of double layer rejection criteria four sets of layout geometry were simulated in ILCRoot, with space between sublayers of 1 mm and 2 mm and detector magnetic fields of 3.5 T and 7 T. At each geometry two sets of data were simulated separately, MARS15 background and IP with momentum P = 0.2 - 10 GeV/c. The interaction point (IP) was smeared in Z with =1cm. The samples of IP muons served for estimate of efficiency in selection criteria.
3.2 ILCRoot Simulation Results
The ILCRoot simulation output data present ROOT files with records containing information about GEANT4 hits and tracks producing them. The hit is defined for each step of the particle tracking in the sensitive volume of detector. It has X, Y, Z coordinates, time and momentum P components of the track at the begining and at the end of the step, energy deposition in the step, particle ID etc. ILCRoot keeps detailed information about hits provided by GEANT4 including status of the track (if the track entered or left a sensitive volume or stopped in it). Table 2 shows fractions of background particles making hits (directly or through secondary interactions) in all layers of vertex and tracker silicon detectors at magnetic field of 3.5 T and 1 mm space between sublayers. The data in Table 2 are not corrected for geometry acceptance of the silicon detectors. The overall fraction of MARS15 background particles making hits in VXD and Tracker is 3%.
| Particles | n | e | p, | ||
|---|---|---|---|---|---|
| Fraction, % | 3.8 | 1.7 | 19.3 | 64.4 | 84.9 |
4 Data Analysis and Background Rejection Criteria
The ILCRoot output data with hits were analyzed in stand-alone code to define and apply timing, energy deposition and double layer criteria for hits in the barrel layers of the VXD and Tracker only. In this analysis the group of hits for a given track in the given sensitive volume (silicon sublayer), which ends by a final hit when a track was leaving the volume or stopped in it, was handled as a hit cluster. It was used to sum the energy deposition per cluster and estimate the number of pixels crossed by the track in the hit cluster. For cluster timing and position coordinates the average over hits was used. The final results were a hit cluster efficiency for IP muons and a hit cluster surviving fraction for MARS15 background particles.
4.1 Timing
The MARS15 framework gives the time of flight of background particles calculated on the detector side surface of the shielding cone with respect to bunch crossing, BX. GEANT4 in ILCroot is tracking these particles through the detector, and takes into account the MARS15 time of flight and provides the time of flight (TOF) for each hit in sensitive volume with reference to BX.
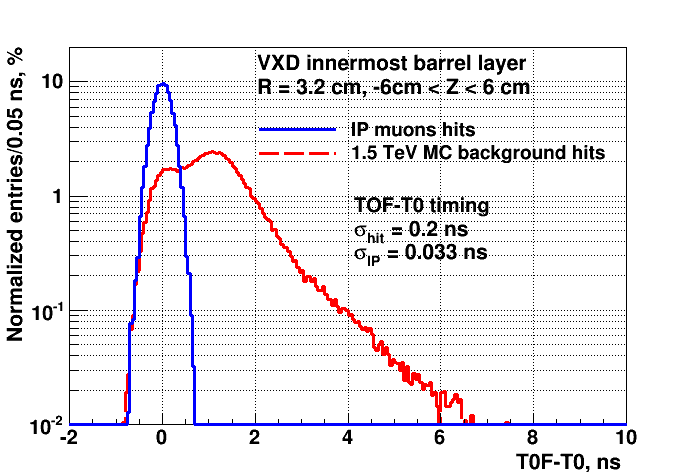
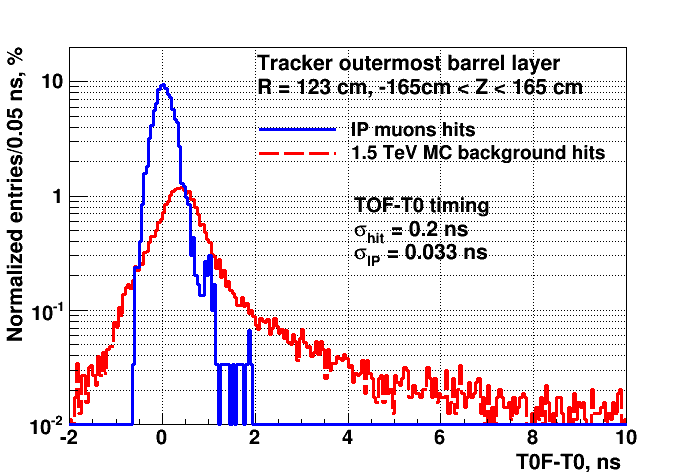
In analysis we used instead TOF-T0 where T0 - time of flight of IP photon from interaction point IP with coordinates X=0, Y=0 and Z=0 to the point with IP muon or MARS15 background particle hit coordinates. This compensates the difference in TOF for IP particles making hits in different layers of VXD and Tracker at different R and Z coordinates of the hit. The TOF-T0 time of the hit cluster was smeared with Gaussian time resolution of 0.2 ns. There is an additional smearing with 0.033 ns in ILCroot due to the Z distribution of the muon IP.
The start and width of the timing gate for TOF-T0 were defined from Gaussian fit of the TOF-T0 distribution with conditions to have the IP efficiency of 97% in each sublayer of VXD and Tracker. Figures 5-5 present TOF-T0 time distributions for hit clusters produced by IP muons and MARS15 background particles. The backgroud distribution depends on the VXD and Tracker layer as one can see from Figures 5-5, therefore, the conditions to keep the same IP muon efficiency in all layers results in different rejections of the MARS background in different layers.
4.2 Energy Deposition Cut
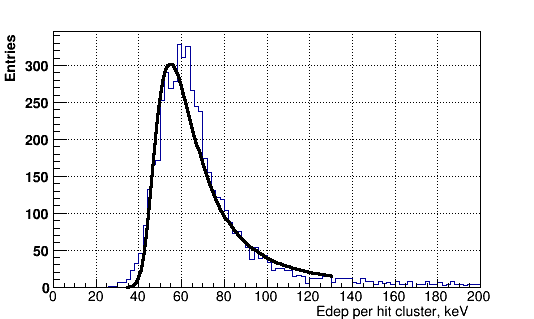
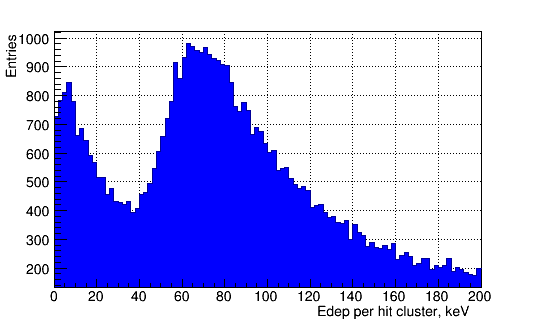
The energy deposition of the hit cluster was defined as a sum of energy depositions in all hits of this hit cluster for given track in given sublayer of VXD and Tracker. The energy deposition resolution was introduced as 1/10 of Landau peak position in distribution for IP muons. The cut on energy deposition (threshold) was calculated using (Landau peak position - 2.2*) where is Landau fit parameter for distribution for IP muons. The corresponding IP muon track hit cluster efficiency per sublayer with higher than the threshold was 96-98. Figures 7-7 present hit cluster energy deposition for IP muons (at hit cluster Z=0) and MARS background particles (at all Z) in the Tracker outermost barrel sublayer. For fitted Landau peak position in IP muon distribution at 56 keV, the threshold was 42 keV with corresponding IP muon efficiency 98% per sublayer. The first peak in the MARS background distribution corresponds to mostly resulting from background n and interactions with silicon in any point of sensitive volume while the second peak is for particles crossing the sublayer.
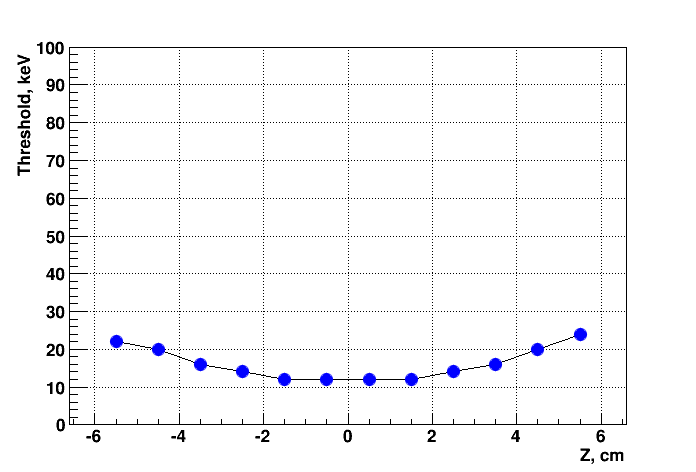
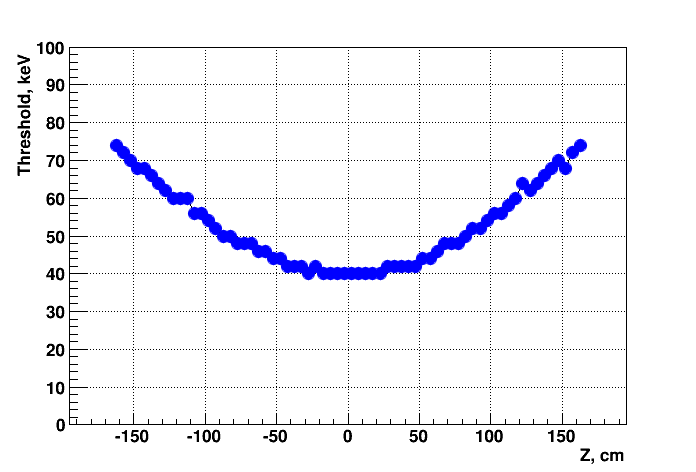
The energy deposition threshold for IP muons depends on sensitive volume thickness (m for VXD barrel and m for Tracker barrel sublayers) and track polar angle (Z position of the hit cluster in the VXD or Tracker barrel sublayers), see Figures 9-9.
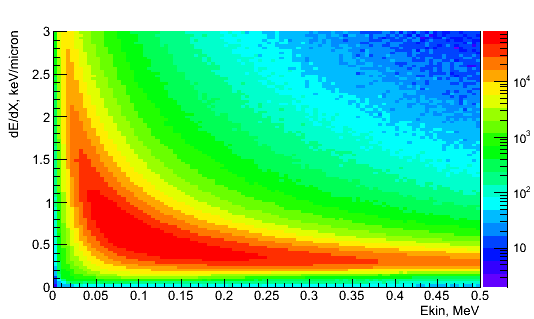
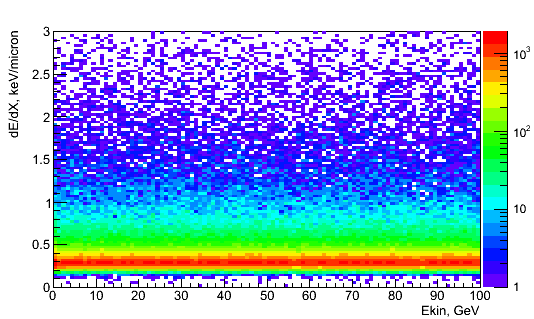
The energy deposition selection does not provide high rejection of the muon collider background due to large dE/dX at the end of range for low energy coming from background n and interactions. To estimate dE/dX we use GEANT4 energy deposition per step divided by the length of the step in the hit. These large dE/dX exceed dE/dX of the IP muons crossing Si layers of VXD and Tracker, see Figures 11-11. One can expect a modest improvement in rejection factor if using likelihood-ratio test instead of just threshold.
4.3 Double Layer Criteria
A stacked layer design to reduce muon collider random neutral background occupancy based on inter-layer correlation in the silicon detector was introduced in [11]. A single layer was replaced with two sublayers being 1-2mm apart and located in magnetic field (B4T). The soft tracks from the muon collider background hits in one sublayer do not reach the second sublayer while IP physics charged tracks produce hits in both sublayers. Making readout of appropriate silicon pixels in both sublayers will suppress random background hits.
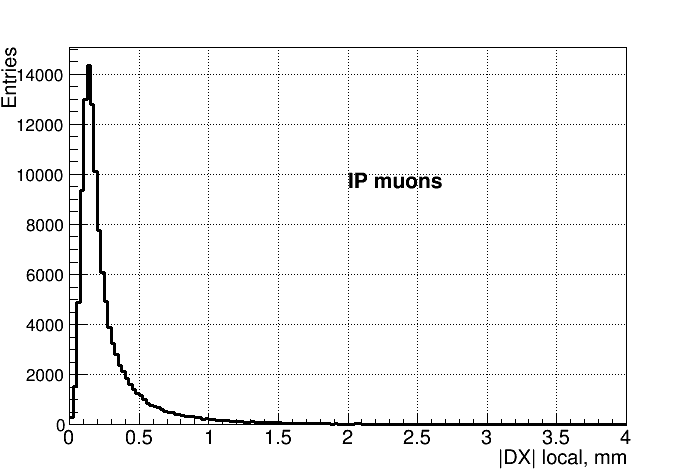
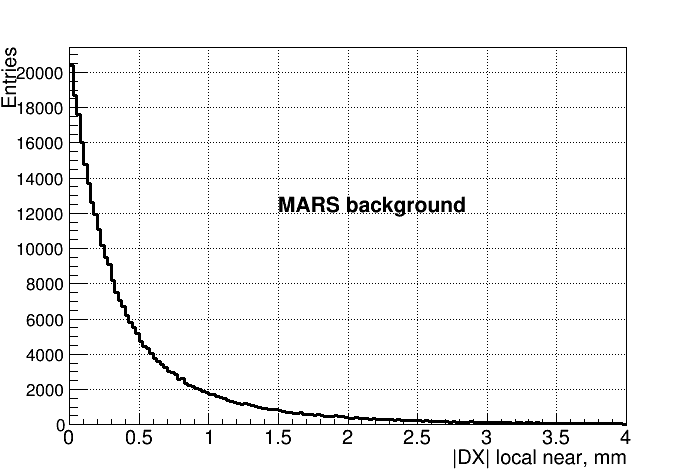
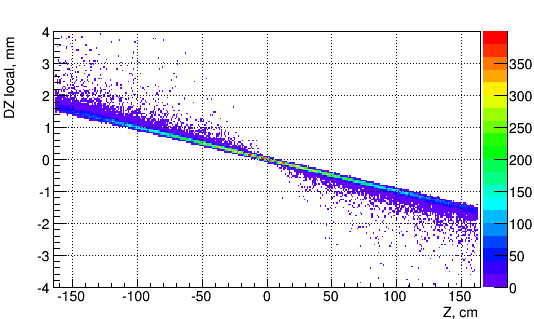
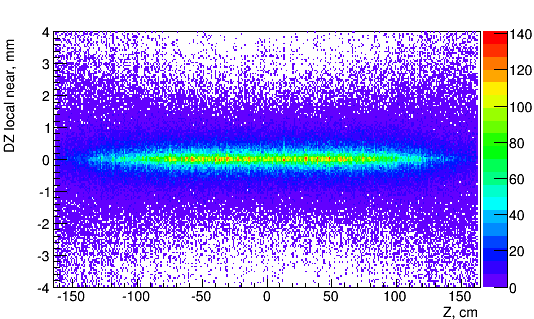
In analysis we used 97% IP muon cluster hits efficient cuts on difference of the hit clusters local X and Z coordinates in both sublayers of the given layer. The coordinates were smeared with = 6m for the VXD and = 15m for the Tracker. Figures 13 and 13 present distributions of absolute value of difference in X (DX) for IP muons and MARS background cluster hits in the outermost Tracker barrel layer in geometry with a 1 mm space between sublayers and a 3.5 T magnetic field. To illustrate the DX difference distribution for MARS background cluster hits the nearest cluster hit X local coordinate was used. The distributions of DZ local coordinates difference vs. global Z coordinate of the cluster hit in the outermost tracker barrel layer in the same geometry for IP muons (Figure 15) and MARS background (Figure 15) suggest implementation of two-sided cuts depending on Z and VXD (Tracker) barrel layer.
5 Results for IP Muon Efficiency and MARS Background Surviving Fraction
The IP muon cluster hit efficiency per layer after cuts is presented on Figure 17. Here layers 1-5 are VXD barrel layers and 6-10 are Tracker barrel layers. The overall efficiency after all cuts is 80-90%. MARS background hit clusters surviving fraction per sublayer depends on the cuts and the layer. See Figure 17 for the geometry with 1 mm space between sublayers and a 3.5 T magnetic field. Most of the rejection comes from timing and double layer cuts with an overall rejection factor as high as 200 in the outermost layers of the Tracker barrel. Such high suppression of background is due to low hit clusters density in these layers where the double layer criteria becomes the most powerful.
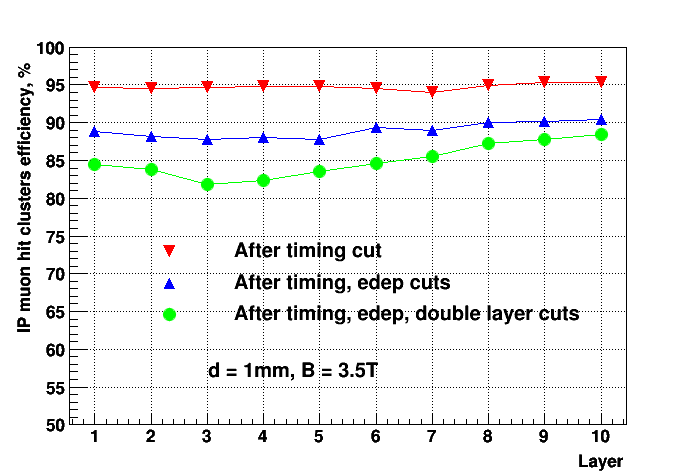
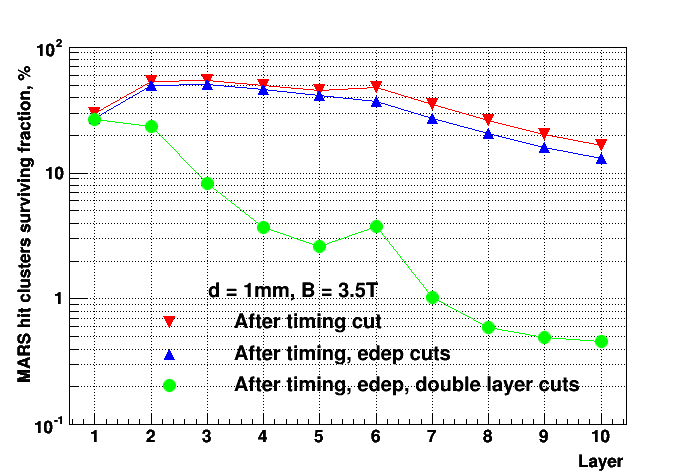
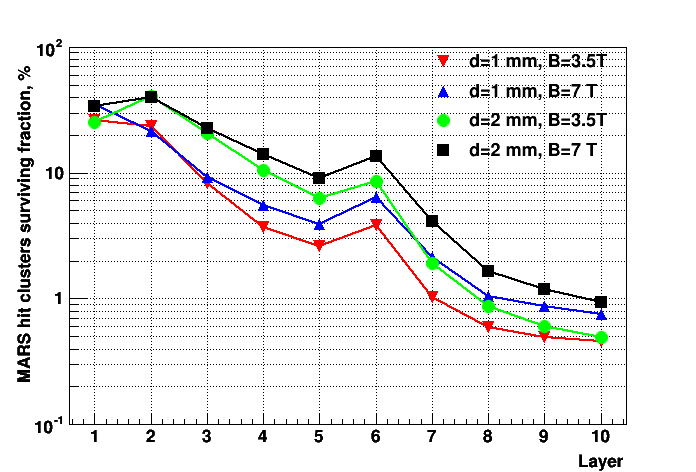
Figure 18 presents the MARS hit clusters surviving fraction after all cuts in different geometries. The background surviving fraction goes up with increasing sublayer space and magnetic field due to loosening double layer cuts (if the IP efficiency is kept the same). The overall MARS background hit clusters surviving fraction in barrel VXD and Tracker sublayers is 3% in 1 mm geometries and 4-5% in 2 mm geometries at IP efficiency of 85% per layer.
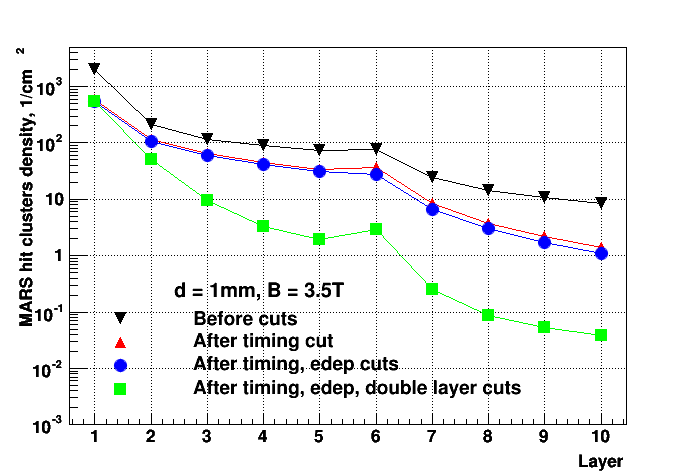
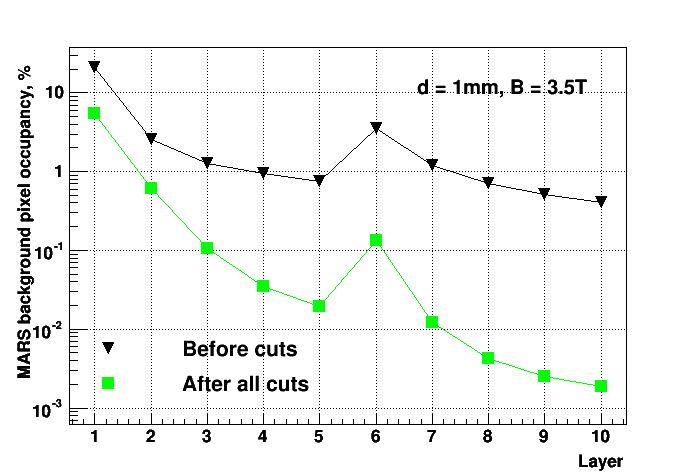
The density of MARS background hit clusters per sublayer in barrel layers of VXD and Tracker, before cuts and after cuts, is shown on Figure 20. It remains high in the first two innermost barrel layers of VXD where the double layer cut is ineffective. The corresponding estimates of pixel occupancies are presented in Figure 20 for 2020 m pixels in VXD barrel sublayers and 5050 m pixels in Tracker barrel layers. ILCroot provides module structure of the sensitive silicon sublayers. In analysis we used a simplified geometry of the pixels defined as sensitive sublayer of the module divided into square pixels. Only the pixels crossed by background track plus adjacent pixels were counted.
6 Conclusion
The recent development in the design of the interaction region and machine-detector interface of the 1.5 TeV muon collider has demonstrated the possibility of suppression of muon beam background in the detector by more than three orders of magnitude. The ILCRoot simulation of the silicon vertex and tracking detector hit response to the MARS15 background and the analysis of results on the hit level showed the feasibility of the use of a combination of timing, energy deposition and double layer criteria for further reduction of this background. The timing criteria could be used in front-end electronics to decrease the readout of background data. The next level of the background reduction can be achieved by implementation of the energy deposition cuts and double layer criteria in the analysis of the readout data (on a trigger level or in the tracking algorithms).
Acknowledgements.
Work supported by Fermi Research Alliance, LLC under contract No. DE-AC02-07CH11359 with the U.S. Department of Energy through the DOE Muon Accelerator Program (MAP).References
- [1] N.V. Mokhov, Y.I. Alexahin, V.V. Kashikhin, S.I. Striganov, and A.V. Zlobin, Muon Collider Interaction Region and Machine-Detector Interface Design, PAC 2011, arXiv:1202.3979.
- [2] J. C. Gallardo et al., Collider: Feasibility Study, Snowmass 1996, BNL -52503.
- [3] D. J. Summers et al., Muon Acceleration to 750 GeV in the Tevatron Tunnel for a 1.5 TeV Collider, PAC 2007, arXiv:0707.0302.
- [4] D. Stratakis and R. Palmer, Rectilinear Six-dimensional Ionization Cooling Channel for a Muon Collider: A Theoretical and Numerical Study, Phys. Rev. ST Accel. Beams 18 (2015) 031003.
- [5] N.V. Mokhov and S.I. Striganov, Detector backgrounds at muon colliders, Physics Procedia 37 (2012) 2015.
- [6] N.V. Mokhov, The Mars Code System User’s Guide, Version 15 (2016), Fermilab-FN-1058-APC (2018), https://mars.fnal.gov.
- [7] Corrado Gatto, The ILC simulation General Framework: ILCroot, http:www.silc.to.infn.itdocpaperscorrado_gatto.pdf
- [8] Rene Brun and Fons Rademakers, ROOT - An Object Oriented Data Analysis Framework, Nucl. Instrum. Meth. A389 (1997) 81.
-
[9]
S. Agnostinelli et al.,
Geant4 - a Simulation Toolkit,
Nucl. Instrum. Meth. A506 (2003) 250;
J. Allison et al., Geant4 Developments and Applications, IEEE Trans. Nucl. Sci. 53 (2006) 270. - [10] T. Behnke et al., ILC Reference Design Report Volume 4 - Detectors, arXiv:0712.2356.
- [11] J. Chapman and S. Geer, The Pixel Microtelescope, Snowmass 1996, FERMILAB - CONF - 96 -375.