Numerical Simulation of magnetized jet creation using a hollow ring of laser beams
Abstract
Three dimensional FLASH magneto-hydrodynamics(MHD) modeling is carried out to interpret the OMEGA laser experiments of strongly magnetized, highly collimated jets driven by a ring of 20 OMEGA beams. The predicted optical Thomson scattering spectra and proton images are in good agreement with a subset of the experimental data. Magnetic fields generated via the Biermann battery term are amplified at the boundary between the core and the surrounding of the jet. The simulation predicts multiple axially aligned magnetic flux ropes with alternating poloidal component. Future applications of the hollow ring configuration in laboratory astrophysics are discussed.
I Introduction
Supersonic, well collimated outflows are ubiquitous in many astrophysical systems, such as young stellar objects (YSO)(Hirose et al., 1997), active galactic nucleus (AGN)(Ferrari, 1998) and gamma-ray bursts (GRB)(Sari et al., 1999). Despite various astronomical observations, theoretical studies, and numerical modelings of astrophysical jets, many fundamental questions remain, e.g. launching mechanism, composition, morphology of the magnetic field and stability. Magnetic fields permeate the universe, but their origin is not fully understood, especially in astrophysical jets. A variety of ideas have been proposed in which seed magnetic fields could be created. However, this mechanism has only been demonstrated in the laboratory recently(Tzeferacos et al., 2017, 2018).
With advances in large laser facilities, scalable laboratory experiments to study astrophysical phenomena have become achievable. Over the years, experiments have been performed to study astrophysics utilizing high-intensity lasers at the OMEGA laser facility at the Laboratory for Laser Energetics(LLE), and the National Ignition Facility(NIF) at Lawrence Livermore National Laboratory as well as laser facilities in other countries(Remington, 2005; Foster et al., 2005; Ciardi et al., 2007, 2009; Lebedev et al., 2004, 2005, 2002; Remington et al., 2006). Laboratory produced jets with proper dimensionless parameters may provide an alternative platform to study the jets of astrophysical scales.
A new way of launching high density and high temperature plasma jets using multiple intense laser beams is to utilize the hollow ring configuration as proposed by Fu et. al(Fu et al., 2013, 2015). It was demonstrated in two dimensional numerical simulations that a bundle of laser beams of given individual intensity, duration and focal spot size, produces a supersonic jet of higher density, temperature and better collimation, if the beams are focused to form a circular ring pattern on a flat target instead of a single focal spot. The Biermann Battery ( ) term(Biermann, 1950) can generate and sustain strong toroidal fields downstream in the collimated jet outflow far from the target surface. Those simulations were carried out in two dimensional cylindrical geometry, where the intensity variation along the ring due to individual laser beams were neglected. Three dimensional simulations are necessary to understand the formation and evolution of the jet in the actual experiments.
The ring jet experiments were designed and carried out on OMEGA laser facility(Boehly et al., 1997) in 2015 and 2016111L. Gao et. al. to be submitted. We used 20 OMEGA beams to simultaneously irradiate the target forming a ring pattern. Each beam delivers 500J energy in . In this paper, we aim to use three dimensional FLASH(Fryxell et al., 2000) simulations to explain the observed jet parameters in the experiments. Using the MHD results, we can predict the diagnostics outcomes from first principles. In Sec. II, we describe the experiment design to produce laboratory jets on the OMEGA laser and the simulation methods to model the experiment. Simulation results are discussed in Sec. III. The validation against a subset of experimental data is discussed in Sec. IV.
II Simulation methods
II.1 Non-ideal magneto-hydrodynamics in FLASH code
The FLASH code222FLASH4 is available at https://flash.uchicago.edu/ is used to carry out the detailed physics simulations of our laser experiments to study the formation and dynamics of the jet and the origin of magnetic fields. FLASH(Dubey et al., 2009; Fryxell et al., 2000) is a publicly available, multi-physics, highly scalable parallel, finite-volume Eulerian code and framework whose capabilities include: adaptive mesh refinement (AMR), multiple hydrodynamic and MHD solvers, implicit solvers for diffusion using the HYPRE library and laser energy deposition. FLASH is capable of using multi-temperature equation of states and multi-group opacities. Magnetic field generation via the Biermann battery term has been implemented and studied in FLASH recently(Graziani et al., 2015).
| Composition (number fraction) | Density | Laser target Ring radius |
| C(50%) H(50%) | 1.04g/cc | 0, 400, 800, 1200 |
| C(49%) H(49%) Fe(2%) | 1.21g/cc | 800, 1200 |
We use the same FLASH code units as in (Tzeferacos et al., 2017) to solve the three-temperature non-ideal MHD equations. A cartesian grid with zones is used to resolve a domain, corresponding to 11 per cell width. The number of cells we use is sufficient to resolve the spatial distribution of all the quantities that the plasma diagnostics are able to resolve in the OMEGA experiments. We did test runs at diffrent resolutions, and the simulation converge at a cell with of 11. The plasma has zero initial magnetic field. The laser target is modeled as a 3mm diameter and 0.5mm thick disk with the composition listed in Table 1. To model the material properties of the CH and CHdopant targets, we utilize the opacity and EoS tables computed with PROPACEOS333PROPACEOS is available at http://www.prism-cs.com. We use the equation of state of helium in the chamber with initial density equal to , which should have been vacuum. The helium does not affect the simulation significantly, as the mass, momentum and energy budget in the modeled helium is much less than 1%. To suppress the magnetic field from numerical artefact, we turn off the Biermann battery term and use the largest allowed magnetic resistivity in the explicit solver for each time step in the regions with density lower than . The electron heat conduction is calculated using Braginskii model(Braginskii, 1965) in weak magnetic field limit.


To model the laser driven blowoffs, we use the spatial and temporal specifications of each of the twenty OMEGA driver beams. The 20 driver beams are turned on and turned off simultaneously with a 1ns pulse duration. Each delivers 500J of energy on a target flat-top. The radius of each beam is 125. The laser spots are arranged to form a ring pattern of radius , as shown in Fig 1. The target is 0.5mm thick to prevent the burn-through. The setup of the diagnostics is sketched in Figure 2 and discussed in the following subsections.
For convention, is the time for laser turn on. The direction is perpendicular to the surface of the target plane. The jet is formed in the region. We also use cylindrical coordinates where is the central axis of the target. The target surface is located at . Axial direction is along axis. Toroidal or azimuthal direction is the direction in the cylindrical coordinate system. Target chamber center(TCC) is at , .
II.2 Optical Thomson scattering
Optical Thomson scattering(Froula et al., 2006, 2005) is used to probe the electron/ion temperatures, electron density and flow velocity at TCC. We used one probe beam with 1ns pulse, energy and 532nm wavelength() as the backlighter. The intensity distribution of the probe beam is 70 FWHM 2D gaussian.
We model the Thomson scattering spectrum using the 3D FLASH simulation results. The spatial profiles of electron density, electron/ion temperature, flow velocity, and fraction of species are taken as the input for the spectroscopy code(Sheffield et al., 2010). The heating by the probe beam is modeled by laser absorption. The dispersion relations for ion acoustic wave and electron plasma wave(Sheffield et al., 2010) are used to calculate the power output. The final power output is weight averaged by the spatial intensity distribution of the probe laser. The instrument broadening(Follett et al., 2016) is taken into account in the modeling spectrum.
The experimental data are also fitted using the model(see more results in Gao et. al. 2018) to compare with the plasma quantities averaged cube centered at TCC.
II.3 Proton radiography
Our OMEGA experiments used two types of proton sources to map out the magnetic fields (1) DD(3MeV) and (14.7MeV) protons from fusion reaction driven by 24 OMEGA beams(Li et al., 2006; Manuel et al., 2012). The actual spectrum is typically an up-shifted symmetric gaussian distribution, FWHM=320keV centered at 3.6MeV for DD protons, FWHM=670keV centered at 15.3MeV for protons. The emitting position of protons follows a 3D gaussian distribution with e-fold radius equal to 20 and the burn time is 150ps(Manuel et al., 2012); (2) Broadband protons up to 60MeV are driven by an OMEGA EP beam via Target Normal Sheath Acceleration(TNSA) mechanism(Zylstra et al., 2012). The actual spectrum is typically an exponential distribution with effective temperature 3.79MeV for our copper backlighter target(Flippo et al., 2010). The initial position of protons at the source follows a 3D gaussian distribution with e-fold radius equal to 5(Manuel et al., 2012), and the pulse duration is 1ps. For the DD and protons, the source stands 1cm from TCC, while the image plate CR39 is located 17cm from TCC on the other side. For the TNSA protons, the source stands 0.8cm from TCC, while the radiochromic film pack is located 16.5cm from TCC on the other side.
The modeling for proton radiography is composed of (1) sampling for the source distributions mentioned above, (2) solving the trajectory of the protons, (3) recording the protons on the detector plane.
The deflection of protons in electromagnetic fields is calculated by solving the Newton-Lorentz equation
| (1) |
In a typical MHD fluid, , where is the hydrodynamical velocity scale of the fluid. The ratio of electric force to magnetic force is . For a proton with energy larger than , the proton speed is much larger than , so we use electric field approximation in the modeling. The energy lost is calculated throughout the proton motion from the NIST PSTAR table444The PSTAR table is available at https://physics.nist.gov/PhysRefData/Star/Text/PSTAR.html. Protons lose significant amount of energy in the remaining solid target with density .
We assume that the detector for DD protons has uniform sensitivity for protons with , and that for protons has uniform sensitivity for all protons with . The TNSA proton energy range that each film is primarily sensitive to is , and the deposited energy per proton is proportional to , while no energy is deposited for . The characteristic energy is different for each pack in radiochromic film. Temporal smearing of TNSA protons images is neglected because the pulse duration is short. Temporal smearing of DD and protons is calculated using the integral of the second order interpolation among successive images with 0.1ns intervals.
III FLASH Simulation results
III.1 Hydrodynamics
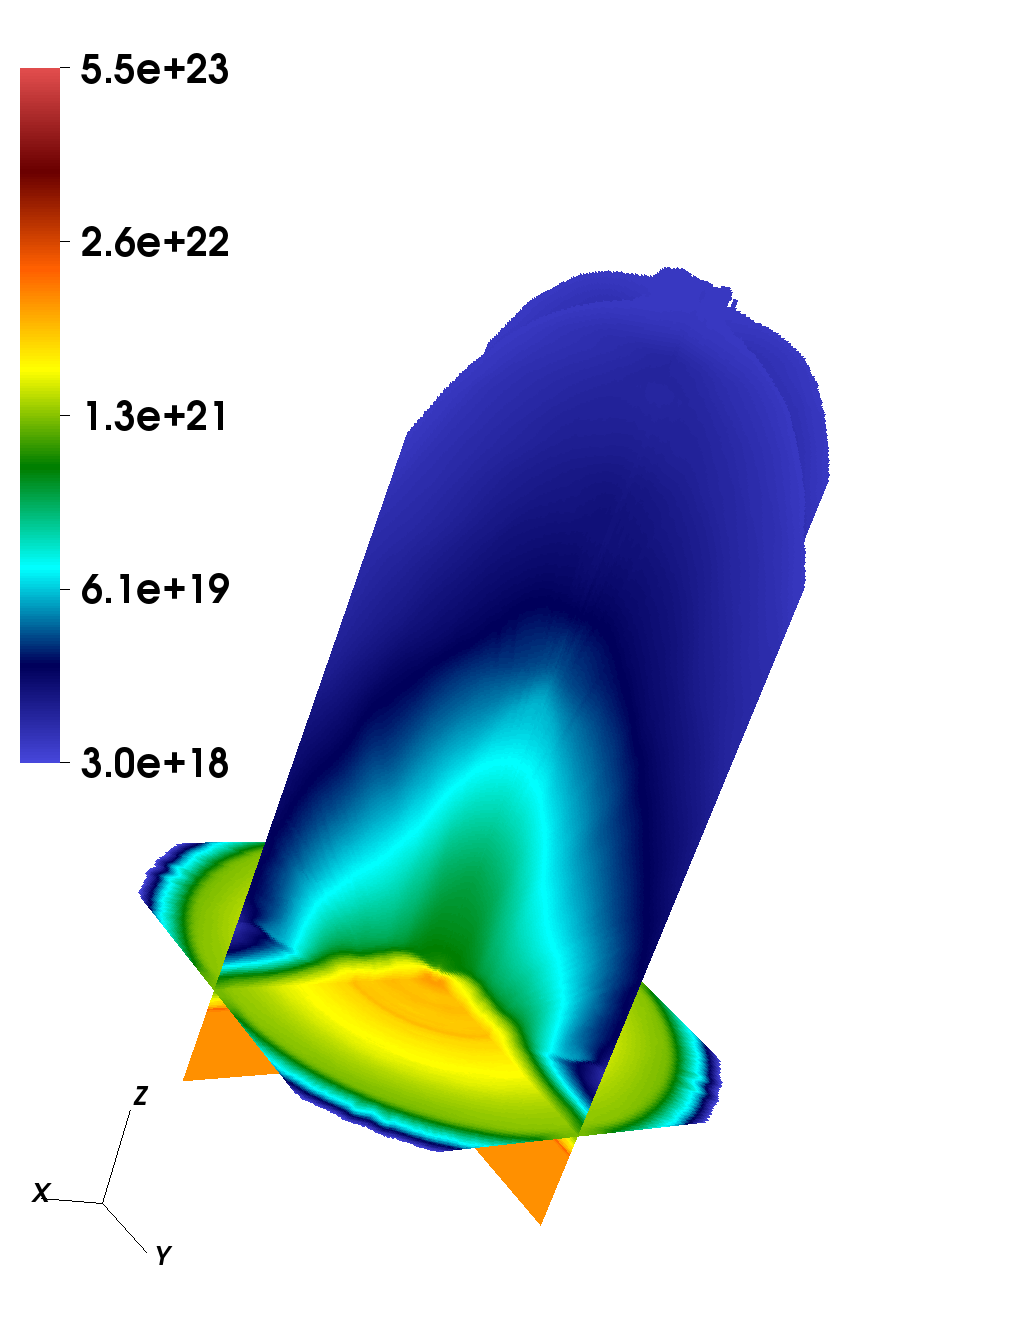
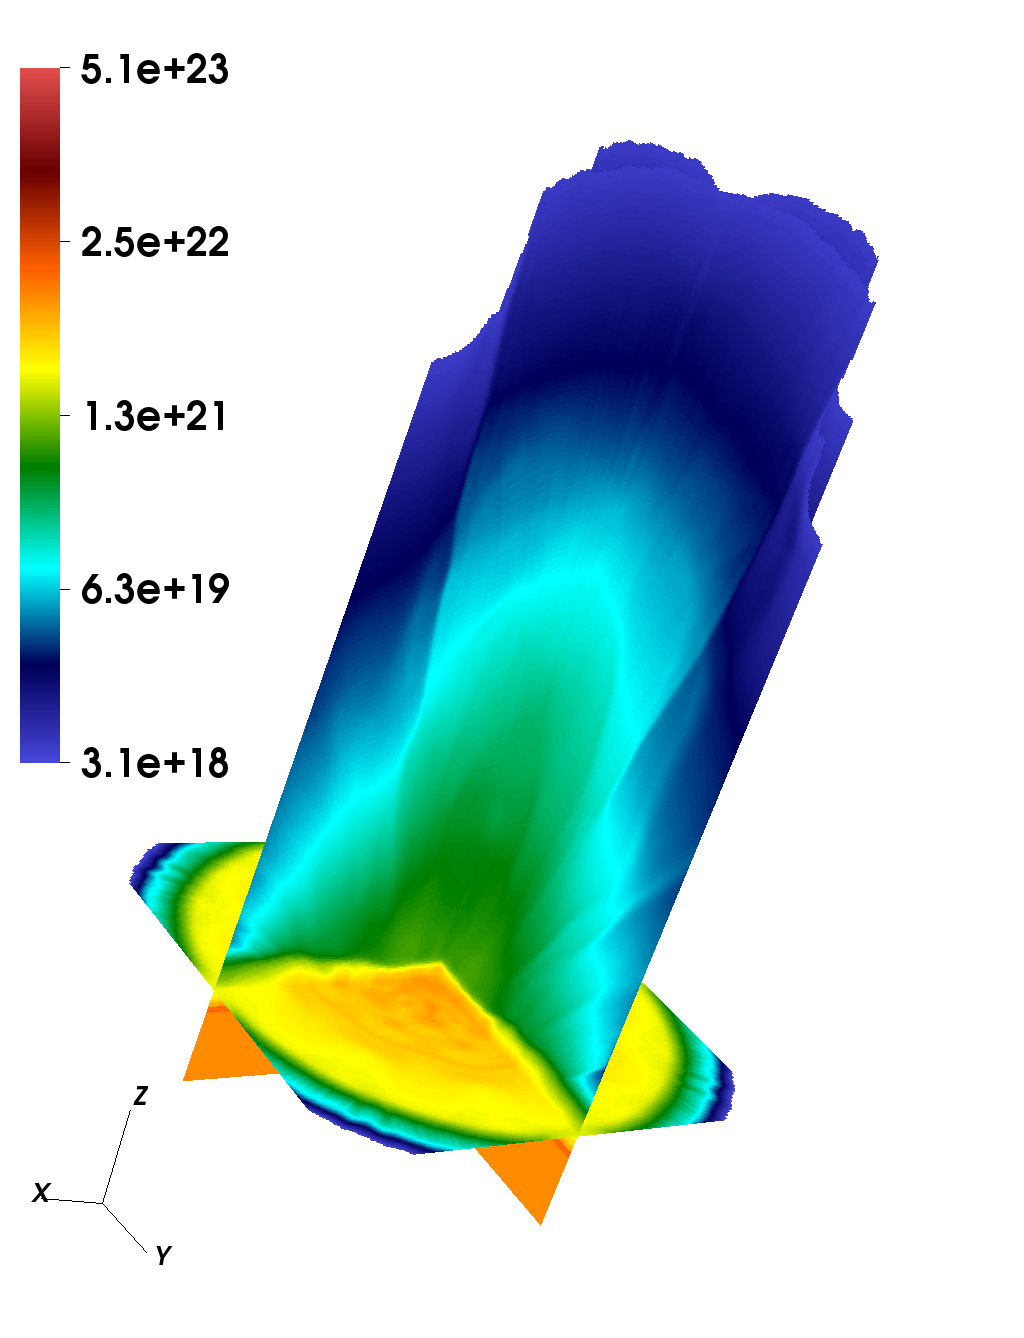
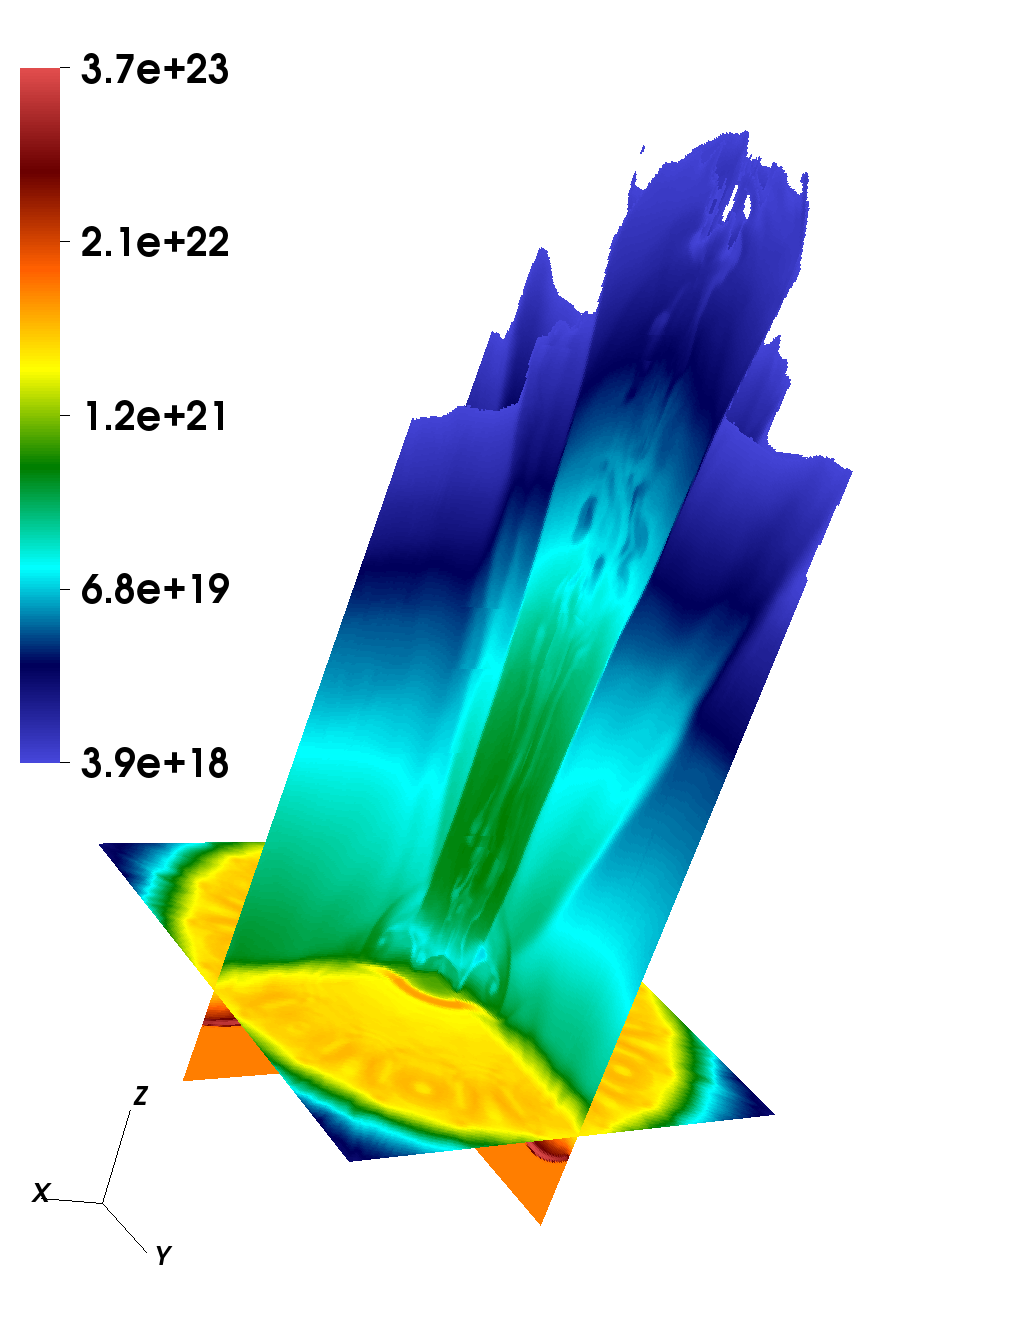
The jet is formed by the merging of the plasma plumes produced by 20 individual OMEGA beams through a strong cylindrical shock. By using a large ring radius, the flows will not collide immediately while the lasers irradiate the target. For the collision at later time with more available room, the flows develop larger radial velocities which become more supersonic. Thus a stronger cylindrical shock is generated near the axis. For the cylindrical shock, the surrounding is in the upstream and the central core is in the downstream. It is a hydrodynamic shock where the plasma is much larger than unity. Figure 3 shows the time evolution of the jet for CH target simulation. The jet is supersonic and well collimated. The jets with different ring radius all travel several millimeters by . The jet keeps traveling and expanding so that the length and the radius keep growing even after . The width and the length of the jet are much larger than the laser spot size(250), as shown in Table 2.
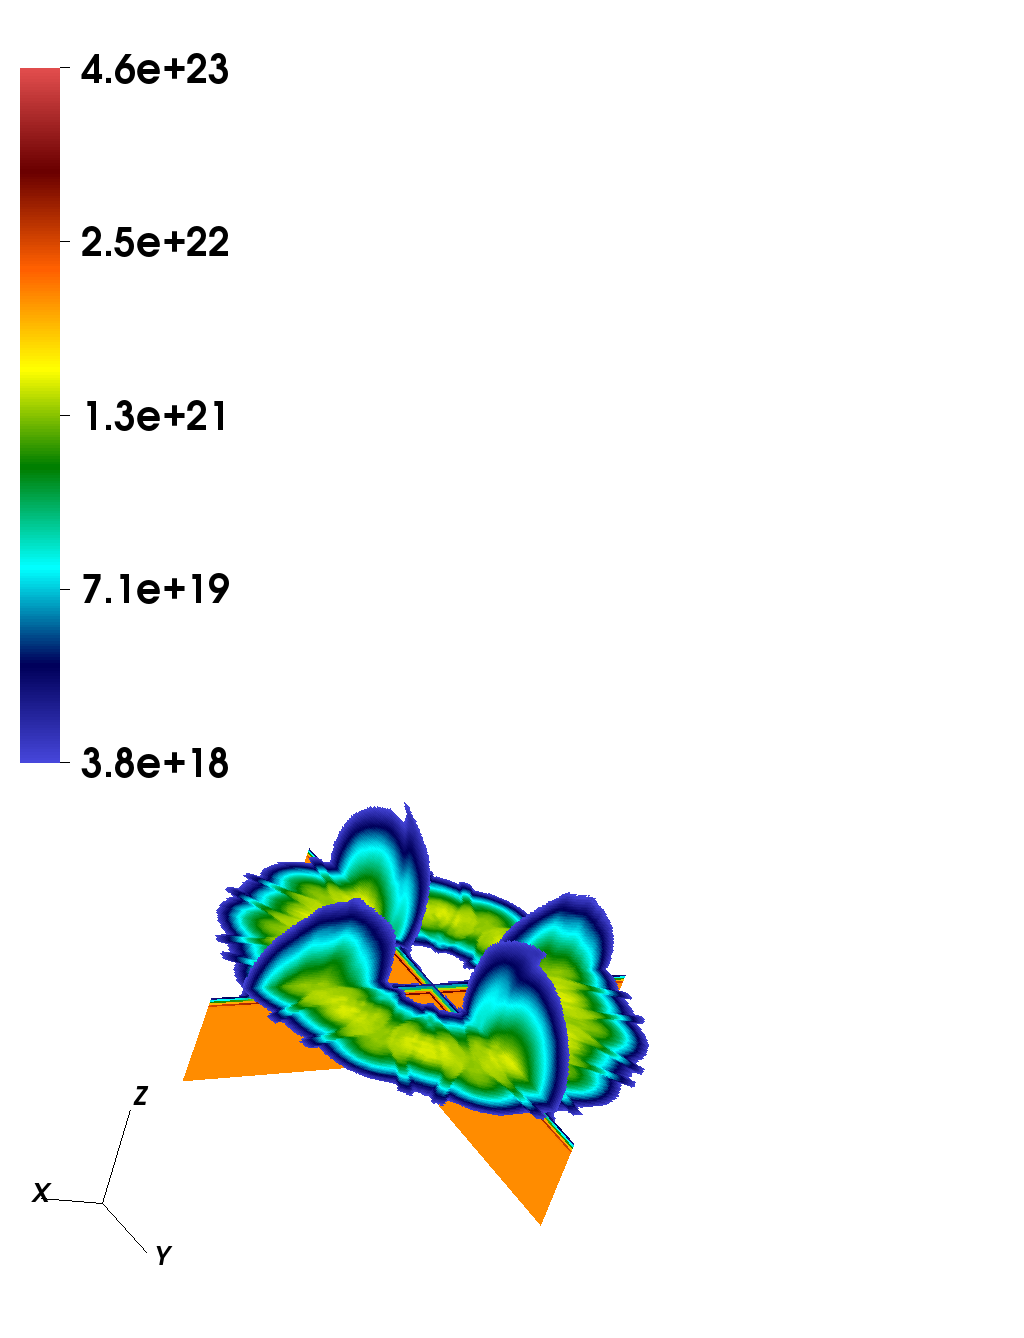
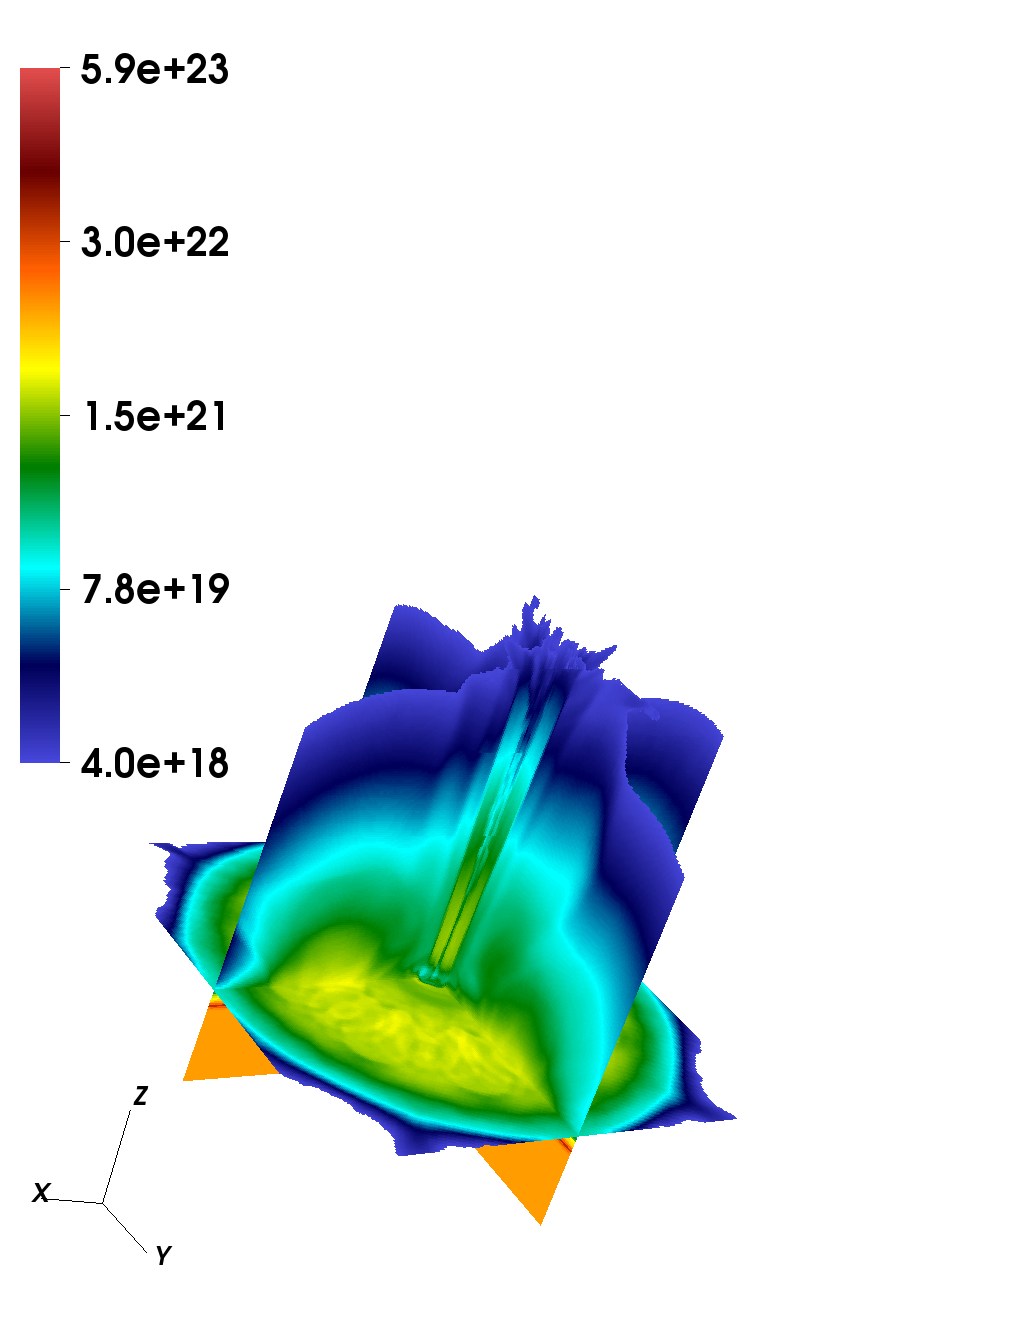
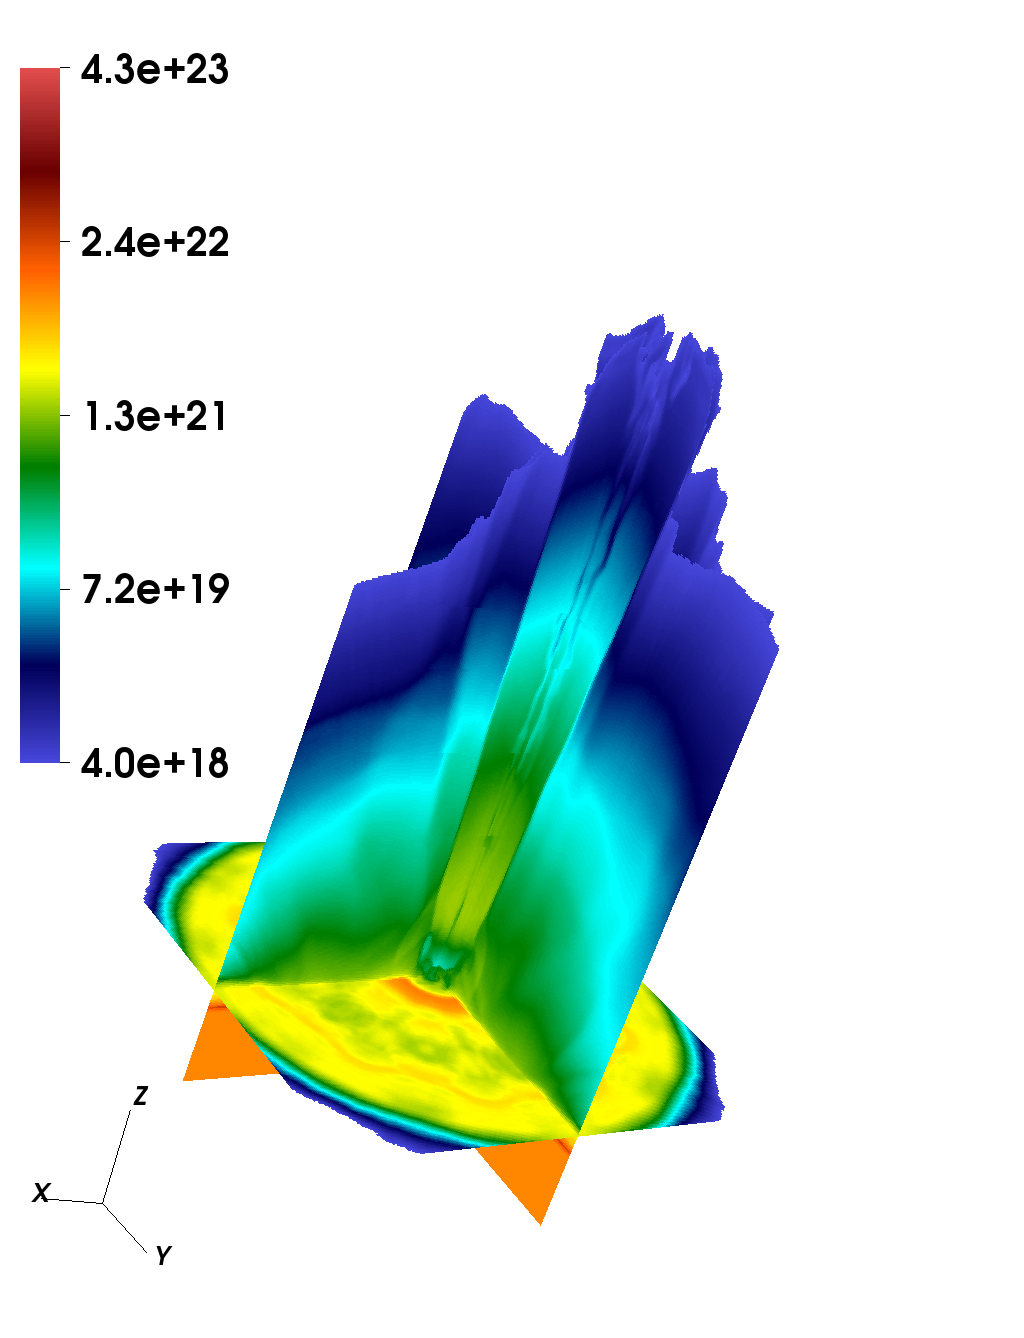
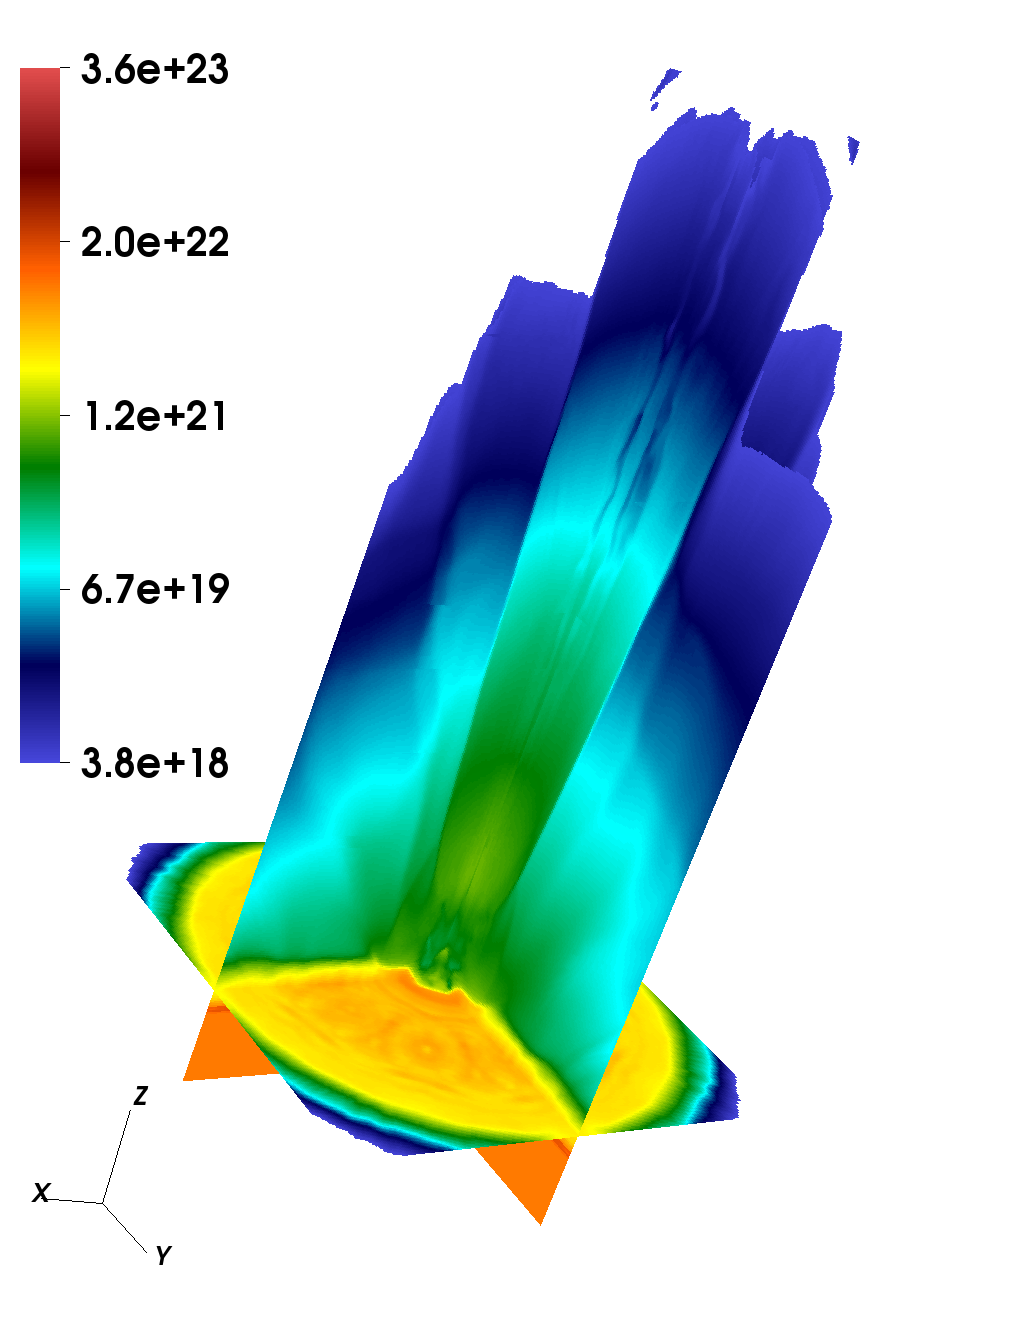


| Plasma property | 2% Fe dopant | 2% Fe dopant | ||||
| Electron density () | ||||||
| Electron temperature (eV) | ||||||
| Ion temperature (eV) | ||||||
| Magnetic field (gauss) | ||||||
| Jet width (cm) | ||||||
| Jet length (cm) | ||||||
The properties of the jet become more interesting as the ring radius increases. Figure 4 shows the shape of the jet for different laser ring radii at . Figure 5 shows the evolution of electron/ion temperature, electron density and flow velocity at TCC for different runs in the FLASH simulation. The quantities are calculated by averaging over a cubic around TCC(, ). The peak electron/ion temperature on-axis is higher for larger ring radius. Comparing to the case where , the temperatures for or are about one order of magnitude higher. The peak electron density is highest for , which is one order of magnitude higher than the case. The ratio of the jet becomes larger(see Table 2) as gets larger. Large ring radius also reduces the opening angle of the jet. The flow velocity is hardly affected by increasing . These results are in good agreement with previous 2D cylindrical hydrodynamics simulations by Fu et. al.(Fu et al., 2013) using 2D FLASH. The simulations in this work are in 3D cartesian geometry. The full details of the laser configuration are taken into account. In 3D simulations, even though there is the azimuthal asymmetry of the laser intensity on the target as shown in Figure 1, the jet is still well collimated and has similar hydrodynamical properties as in the 2D cylindrical case. The azimuthal asymmetry level for electron density can exceed 10%, and the pattern of density distribution in z-slice resembles a “sun flower” as shown in Figure 7.
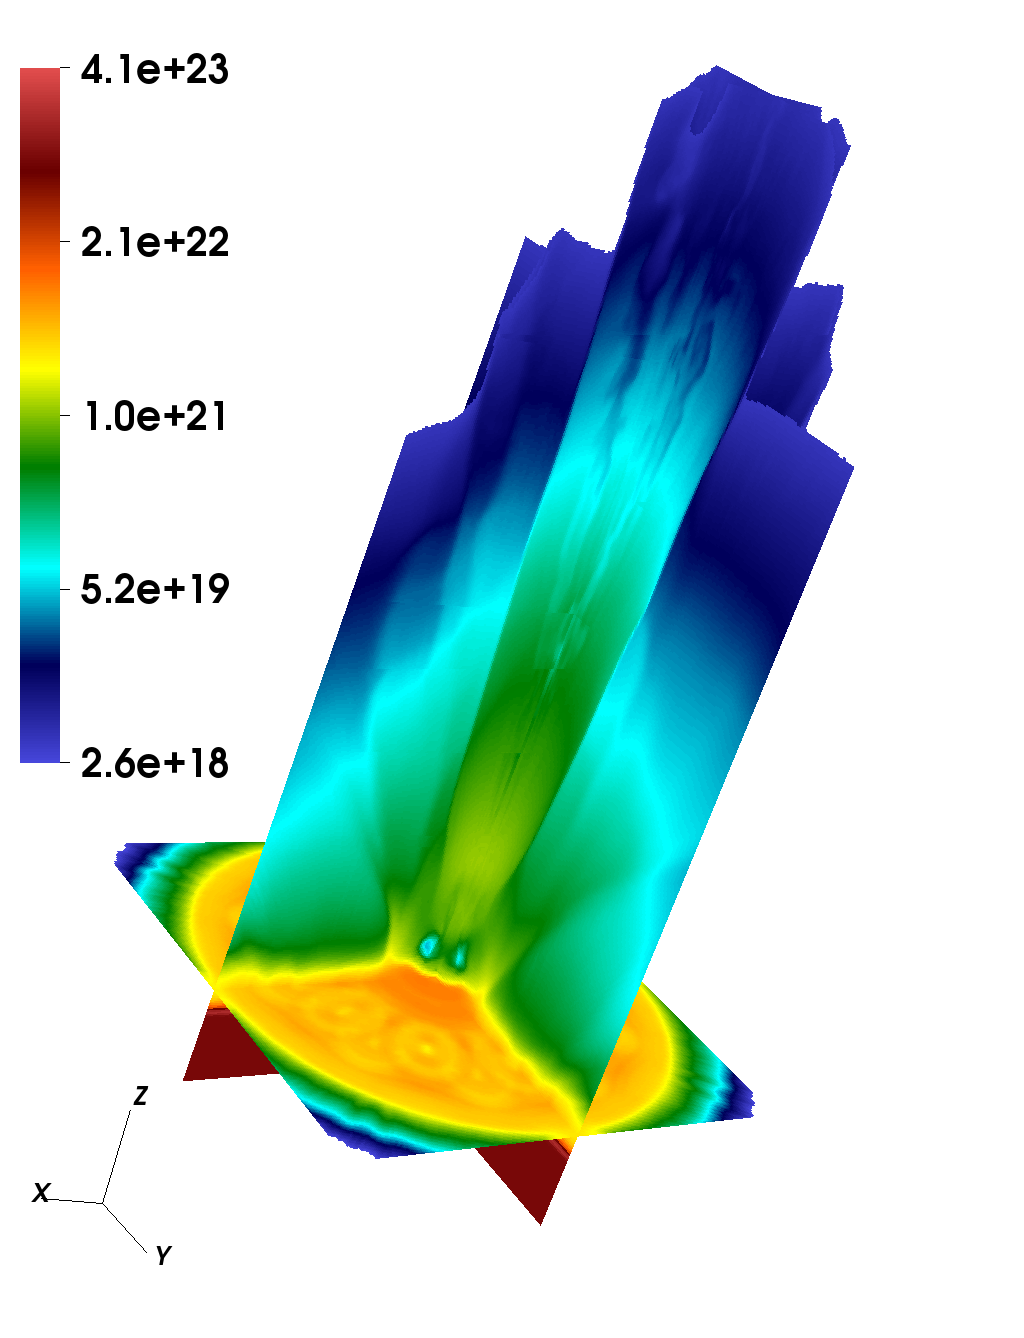
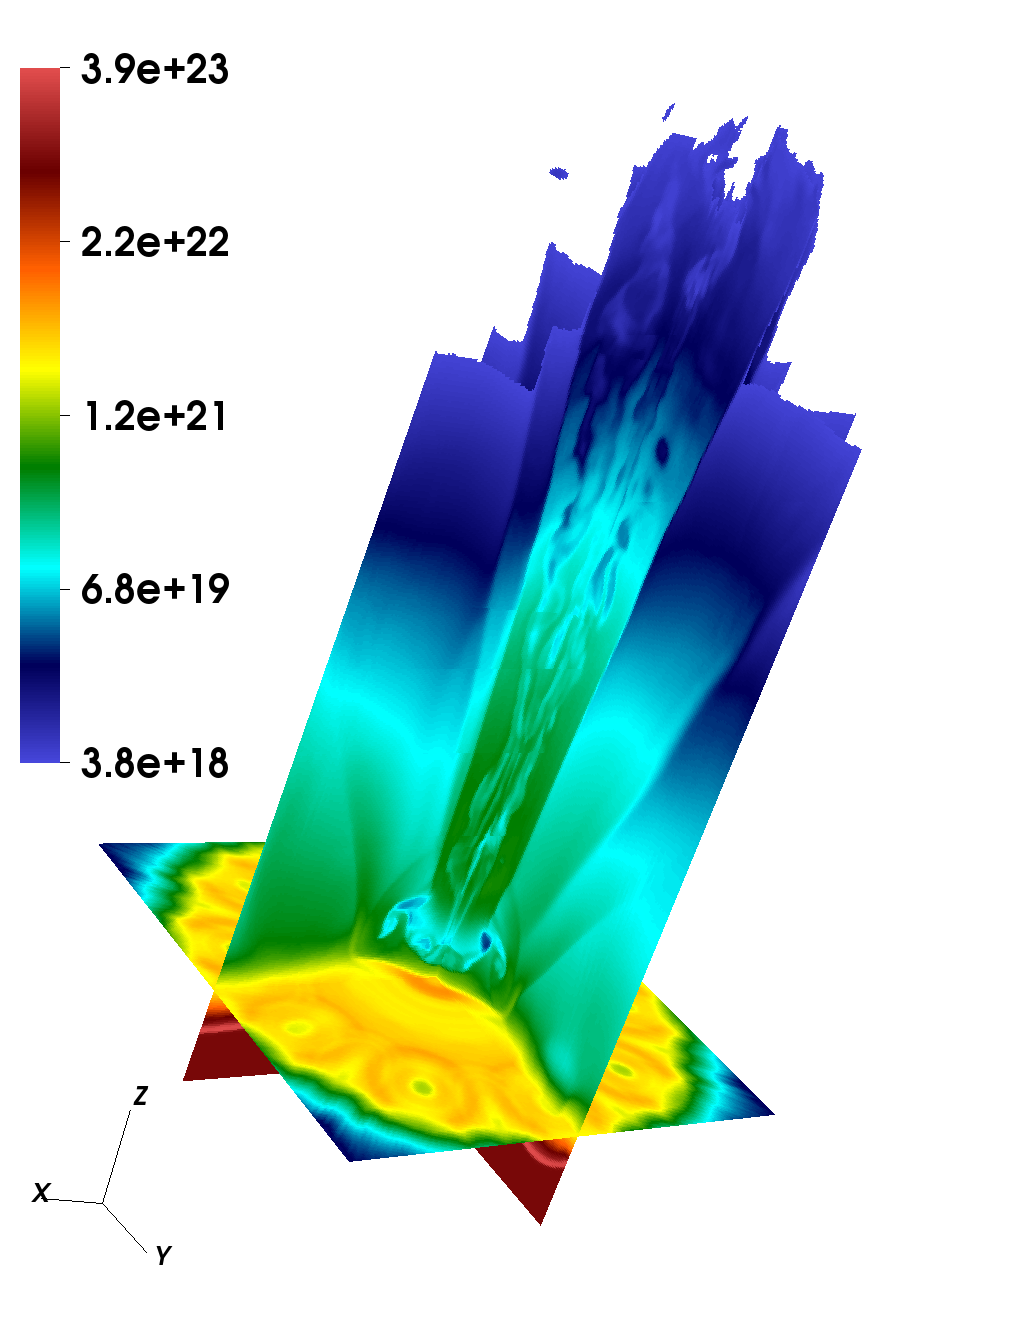


The jet for 2% Fe dopant shot is slightly different than the one without dopant, as shown in Figure 6. The jet in a dopant shot radiate several times more than that in a non-dopant shot. But the radiative cooling time at for the jet is much large than nanosecond even in the dopant shot. Thus, the radiation cooling(see Table 4) has little to do with the shape of the jet after it has grown to millimeter size. For an earlier time, however, cooling rate is large enough to play a role. As a result, the electron temperature at TCC for doped jets is always lower than that in the non-doped jets with the same ring radius . The reduction in electron temperature relaxes the cylindrical shock. Thus, more electrons flow into the core, which causes the jets in dopant shots to have higher electron density than the non-dopant ones. In both doped and non-doped case, the jets are always optically thin.
| Plasma property | Formula | Value at | Value at |
| Electron density () | |||
| () | |||
| Mass density () | |||
| () | |||
| Electron temperature (eV) | |||
| (eV) | |||
| Ion temperature (eV) | |||
| (eV) | |||
| Magnetic field (gauss) | |||
| (gauss) | |||
| Average ionization | |||
| Average atomic weight | |||
| Flow velocity (cm/s) | |||
| (cm/s) | |||
| Perpendicular velocity (cm/s) | |||
| Sound speed (cm/s) | |||
| Mach number | |||
| Electron plasma frequency(rad/s) | |||
| Coulomb logarithm | |||
| Electron thermal velocity (cm/s) | |||
| Electron collision rate (1/s) | |||
| Electron-ion collision rate (1/s) | |||
| Electron mean free path (cm) | |||
| Electron gyro-frequency (rad/s) | |||
| Electron gyroradius (cm) | |||
| Ion thermal velocity (cm/s) | |||
| Ion collision rate (1/s) | |||
| Ion mean free path (cm) | |||
| Ion gyro-frequency (rad/s) | |||
| Ion gyroradius (cm) | |||
| Plasma | |||
| Kinetic energy/Thermal energy | |||
| Reynolds number | |||
| Magnetic Reynolds number | |||
| Biermann number | |||
| Hall number |
| Plasma property | Formula | Value |
| Planck opacity () for CH target | from PROPACEOS | |
| Optical depth for CH target | ||
| Cooling rate (1/s) for CH target | ||
| Planck opacity () for 2% Fe dopant target | from PROPACEOS | |
| Optical depth for 2% Fe dopant target | ||
| Cooling rate (1/s) for 2% Fe dopant target |
A list of on-axis plasma properties from a snapshot in FLASH simulation results is listed in Table 3 using the snapshot for m case at 3ns. Other relevant physical terms can be deduced from the scales and dimensionless numbers in Table 3. The plasma in the jet is fully ionized, i.e and for non-doped shots, and for doped shots. The optical Thomson scattering diagnostics are simulated and discussed in Sec. IV.1. By including laser energy deposition from the probe beam, the hydrodynamical variables in a small region of around will change significantly. This effect is significant for the analysis of diagnostics, but not of the main interest in the dynamical evolution of the jet.
III.2 Magnetic fields
Without any initial magnetic fields, the seed magnetic filed is generated via the Biermann battery term caused by the individual beam heating. The azimuthal asymmetry in the system is significant for the generation of seed fields. In table 3, the Hall number is much larger than the Biermann number . The Hall term is zero if , so it does not generate seed fields. Thus the Hall term () is neglectable in our system. Biermann battery term is the only source term in the generalized Ohm’s law that we calculate in FLASH simulation. Magnetic resistivity is also included in the computation. However, due to large magnetic Reynolds number, magnetic reconnection can hardly happen until later on in the MHD picture.
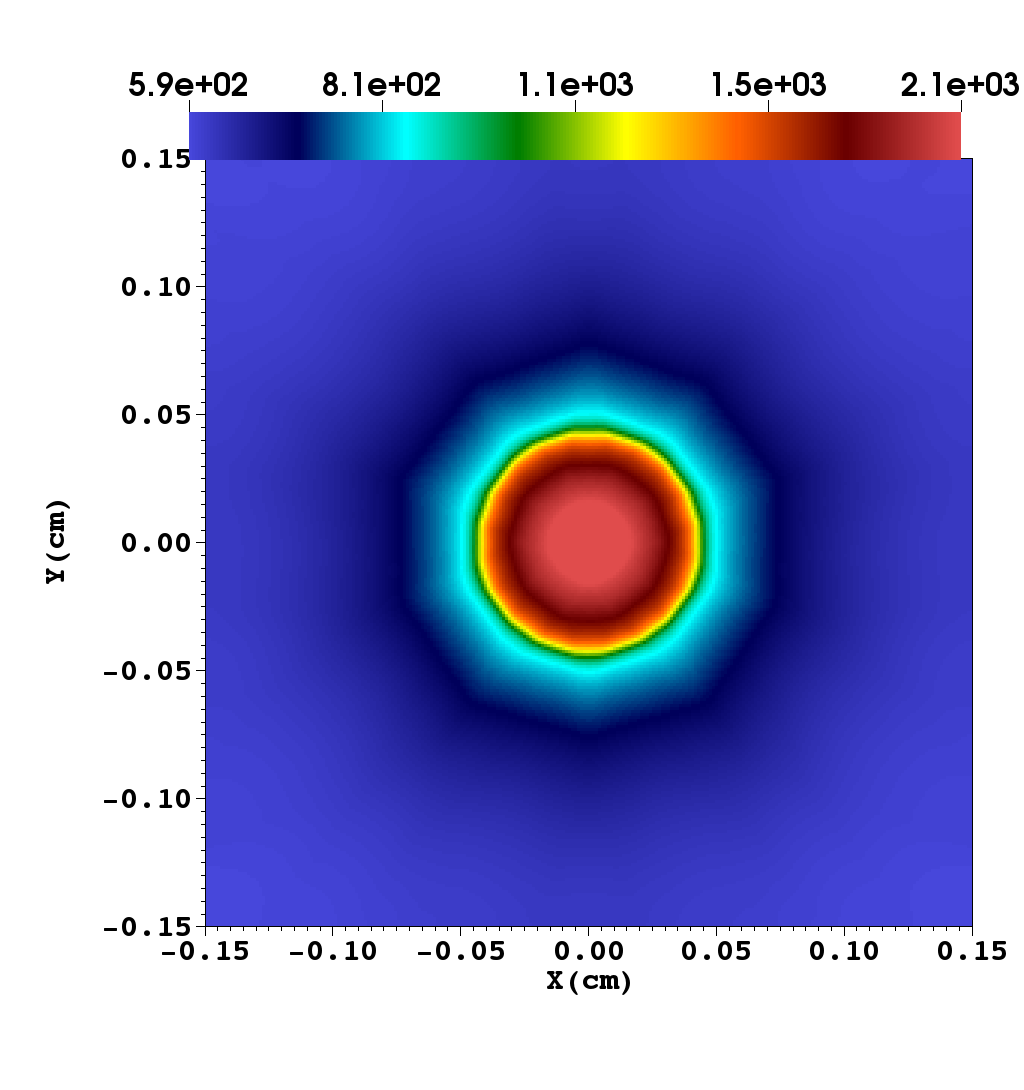
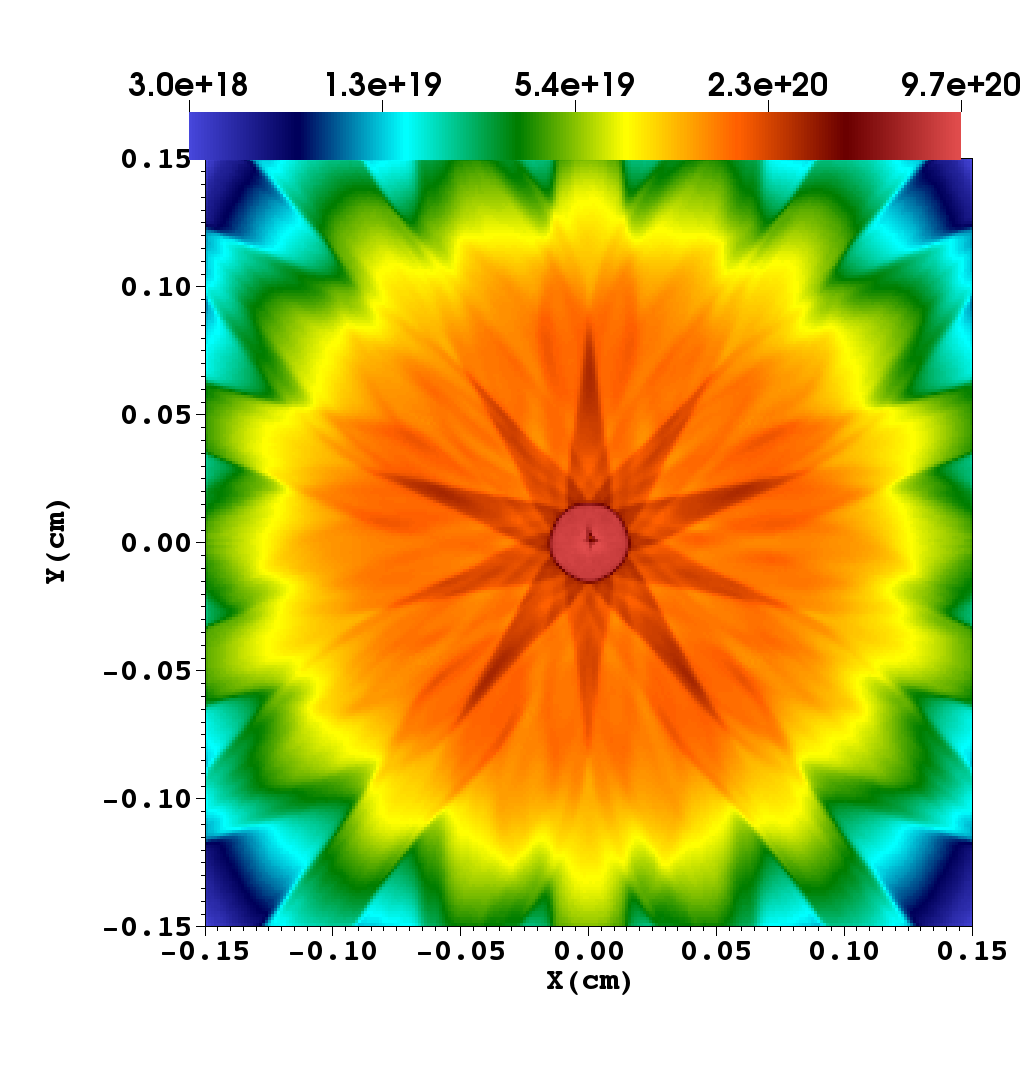
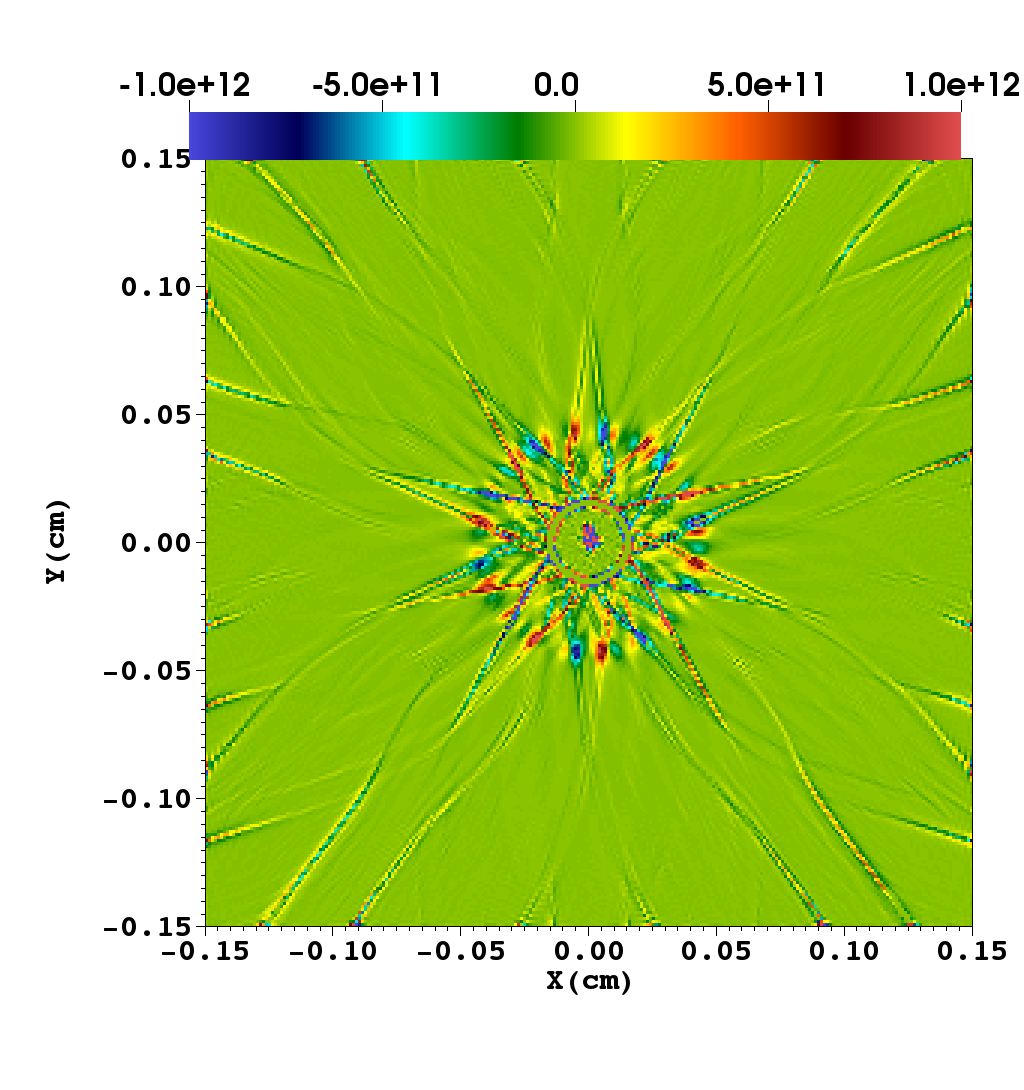
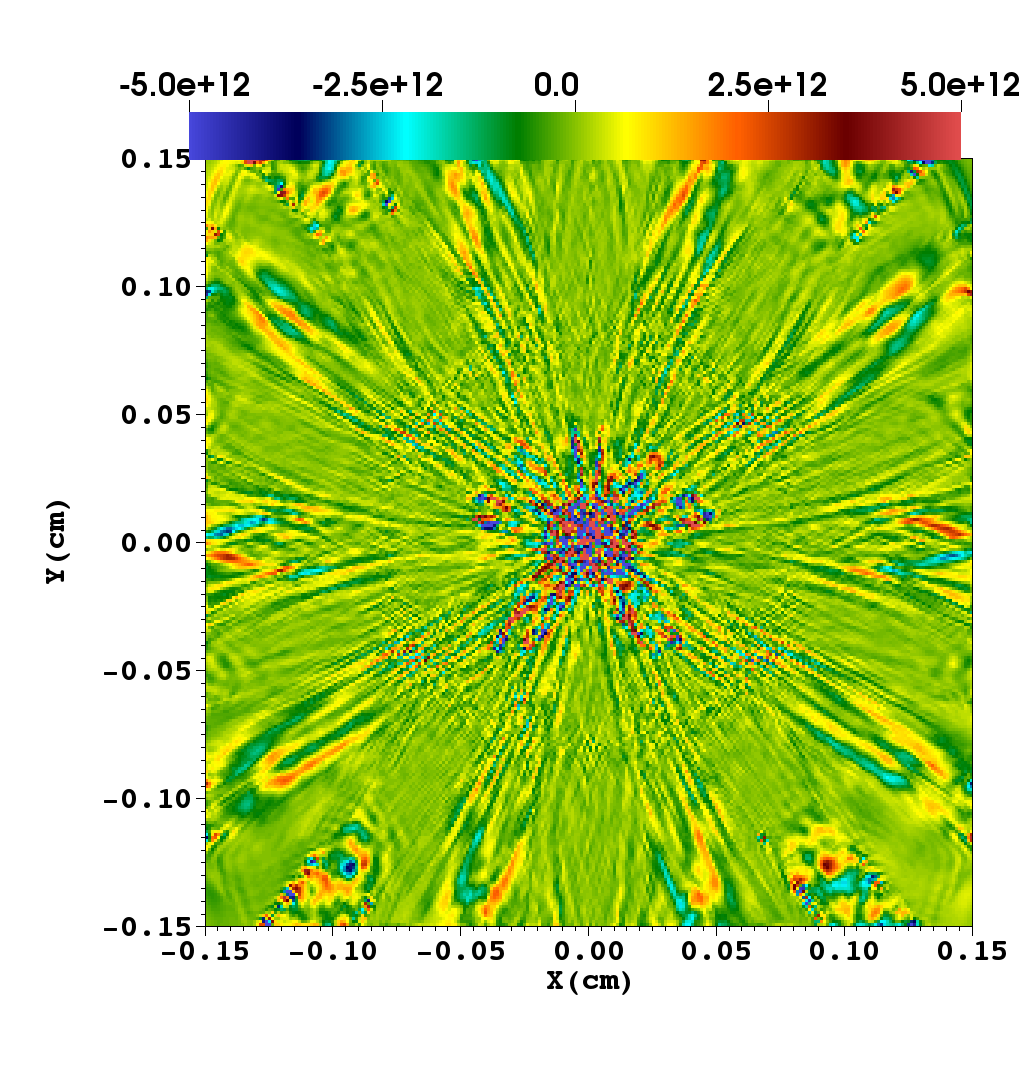
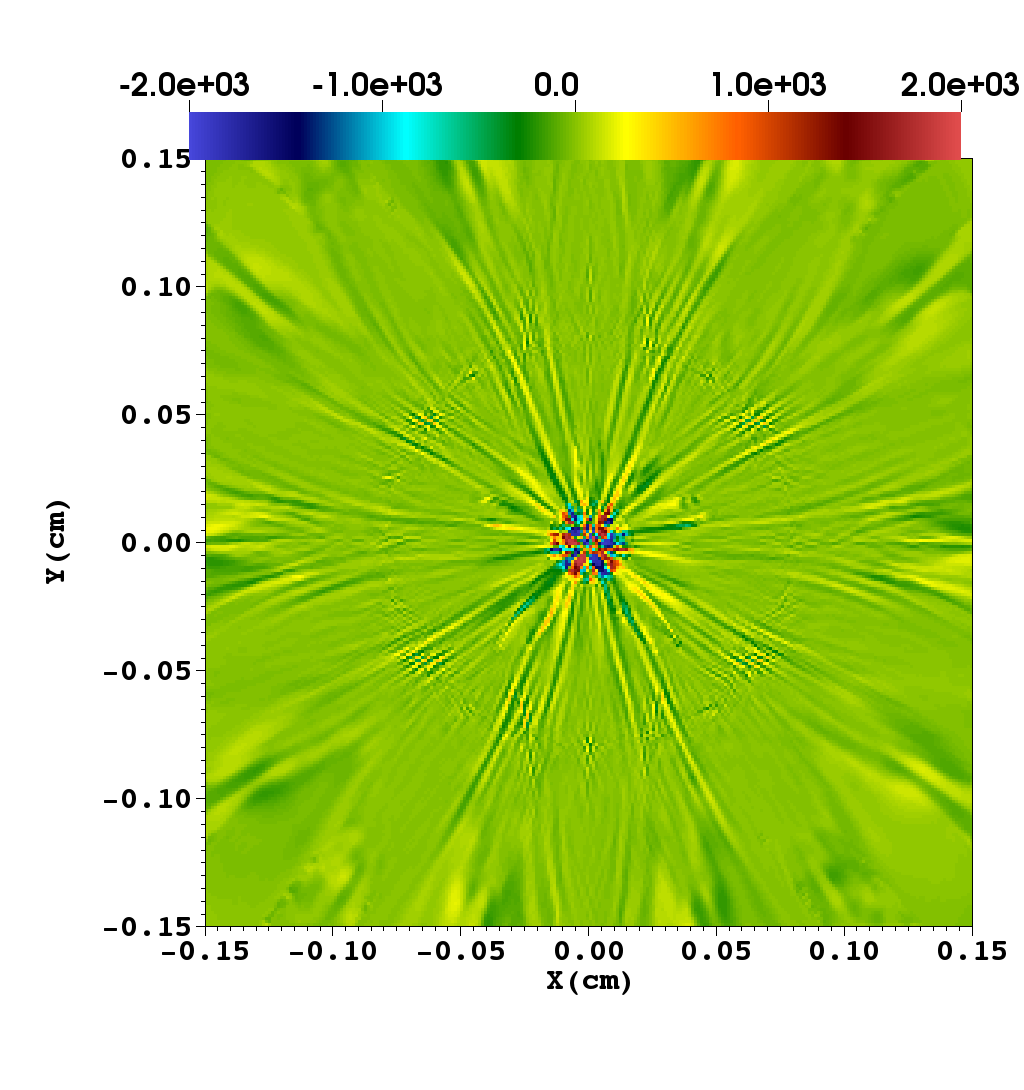
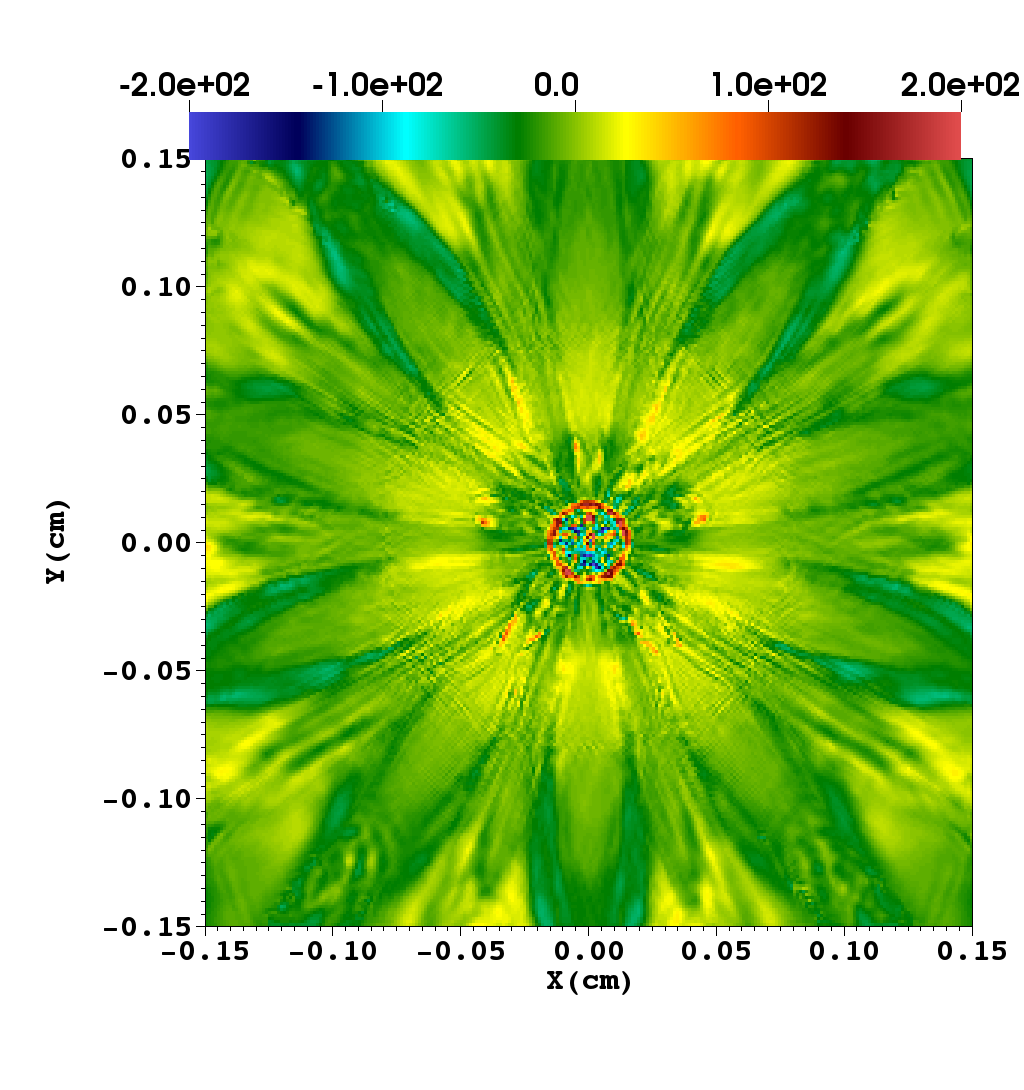
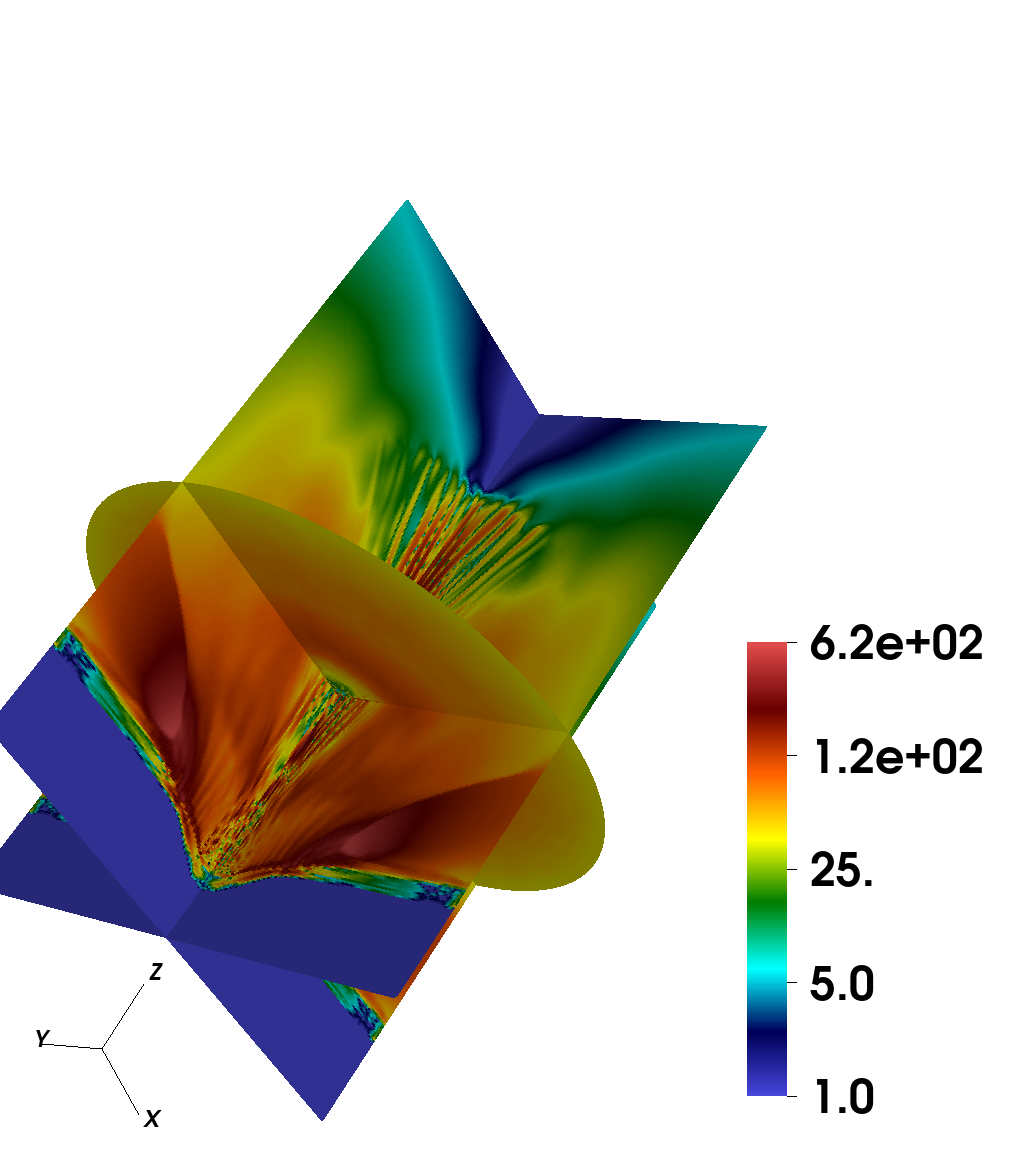
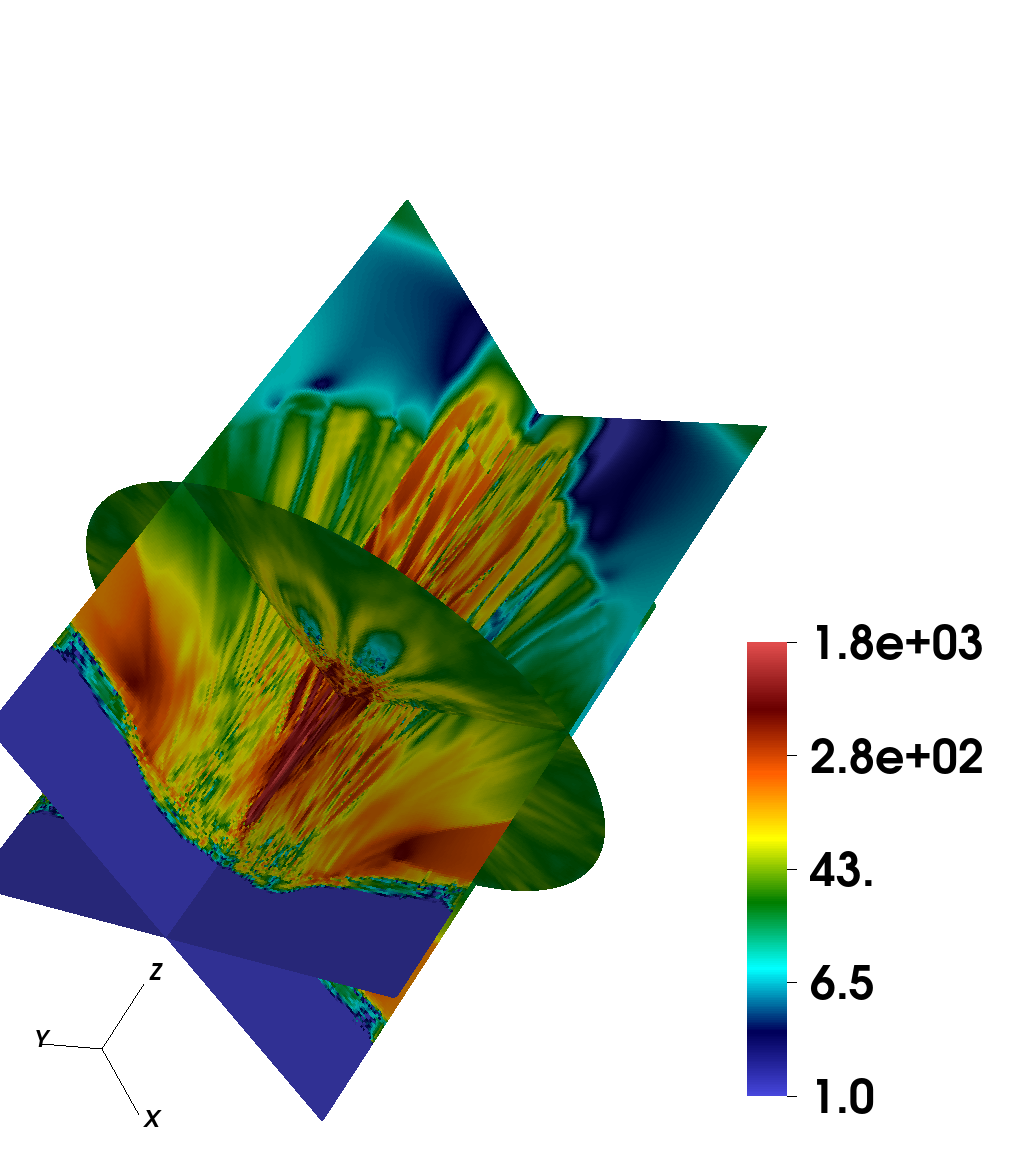
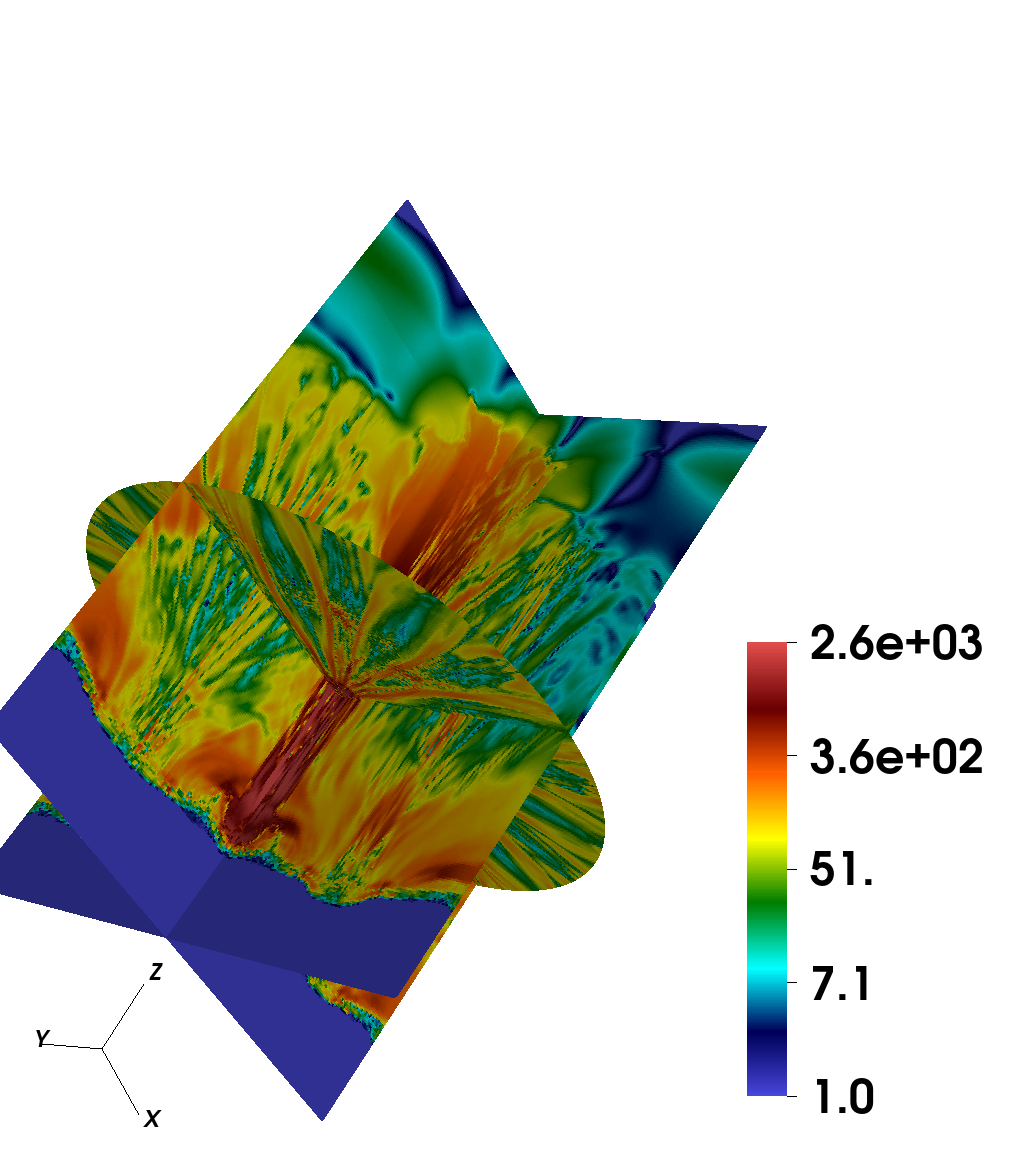
The generation and evolution of the axial dominant magnetic field is demonstrated in Figure 7. Because of the radial temperature gradient(see Figure 7(a)) and the azimuthal density gradient(see Figure 7(b)), the Biermann battery term () is mainly in axial direction. Toroidal dominated magnetic fields are only generated near the surface of the target, where there is little azimuthal density gradient but large axial density gradient. At a millimeter above the target surface, the magnetic field is generated in the surrounding(the ring near in Figure 7(c)) and advected into the core(the central part of Figure 7(d)). The shock amplifies the axial magnetic field by a factor of due to the flux conservation as the plasma flows from the surrounding to the core. The cylindrical shock makes the magnetic field highly concentrated as shown in Figure 7(e). Because the gradient of density alternates several times azimuthally, the generated axial field also alternates. The 5-fold symmetry in the field comes from the 5-fold symmetry in arranging the laser spots as shown in Figure 1. The symmetry is slightly broken in the simulation due to the cubic cells and finite resolution. By using a larger ring of laser spots, the magnetic energy is more concentrated in the core of the jet as shown in Figure 9 and 10.
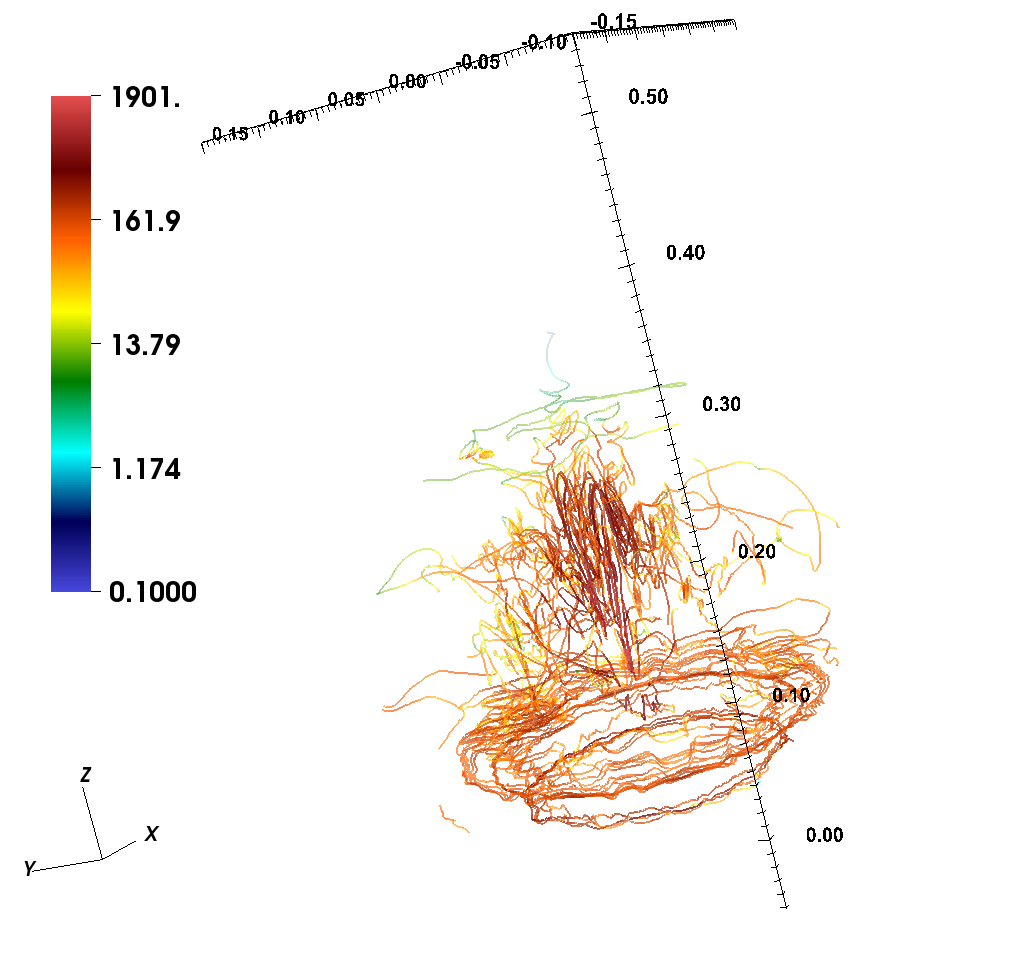
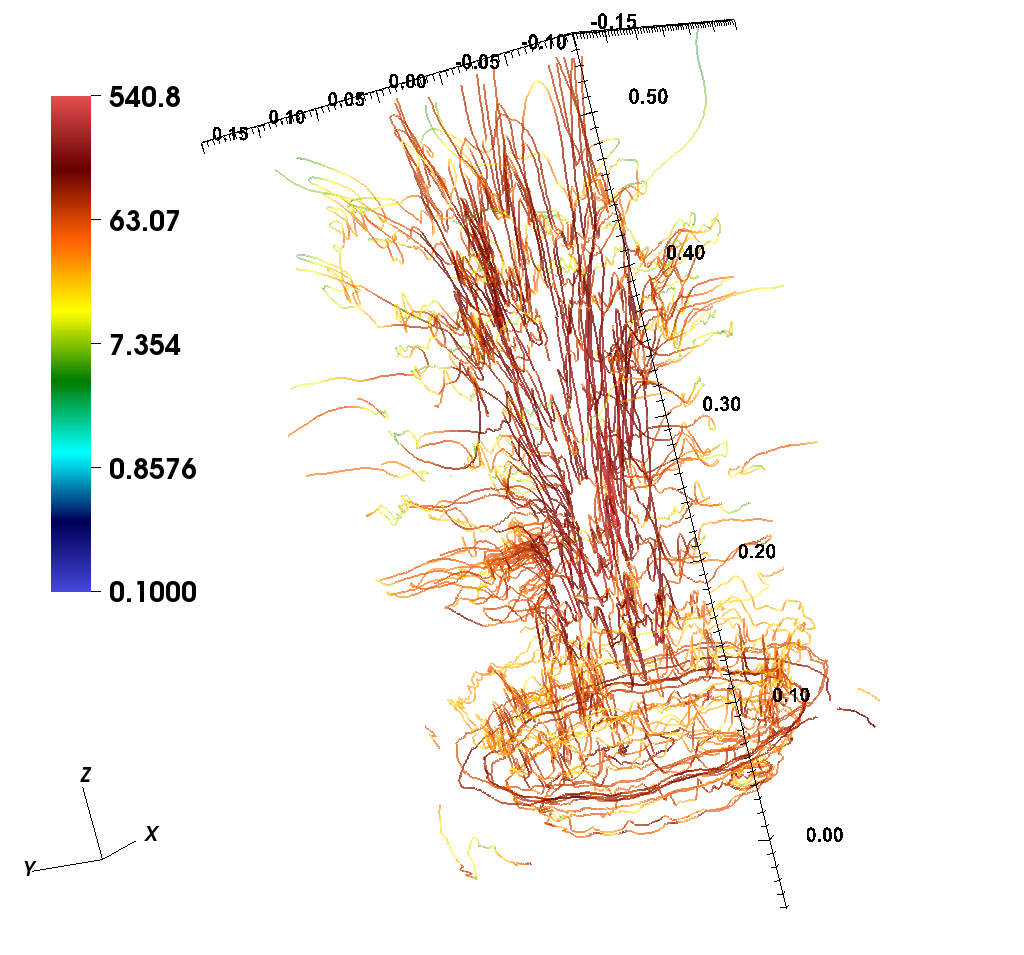
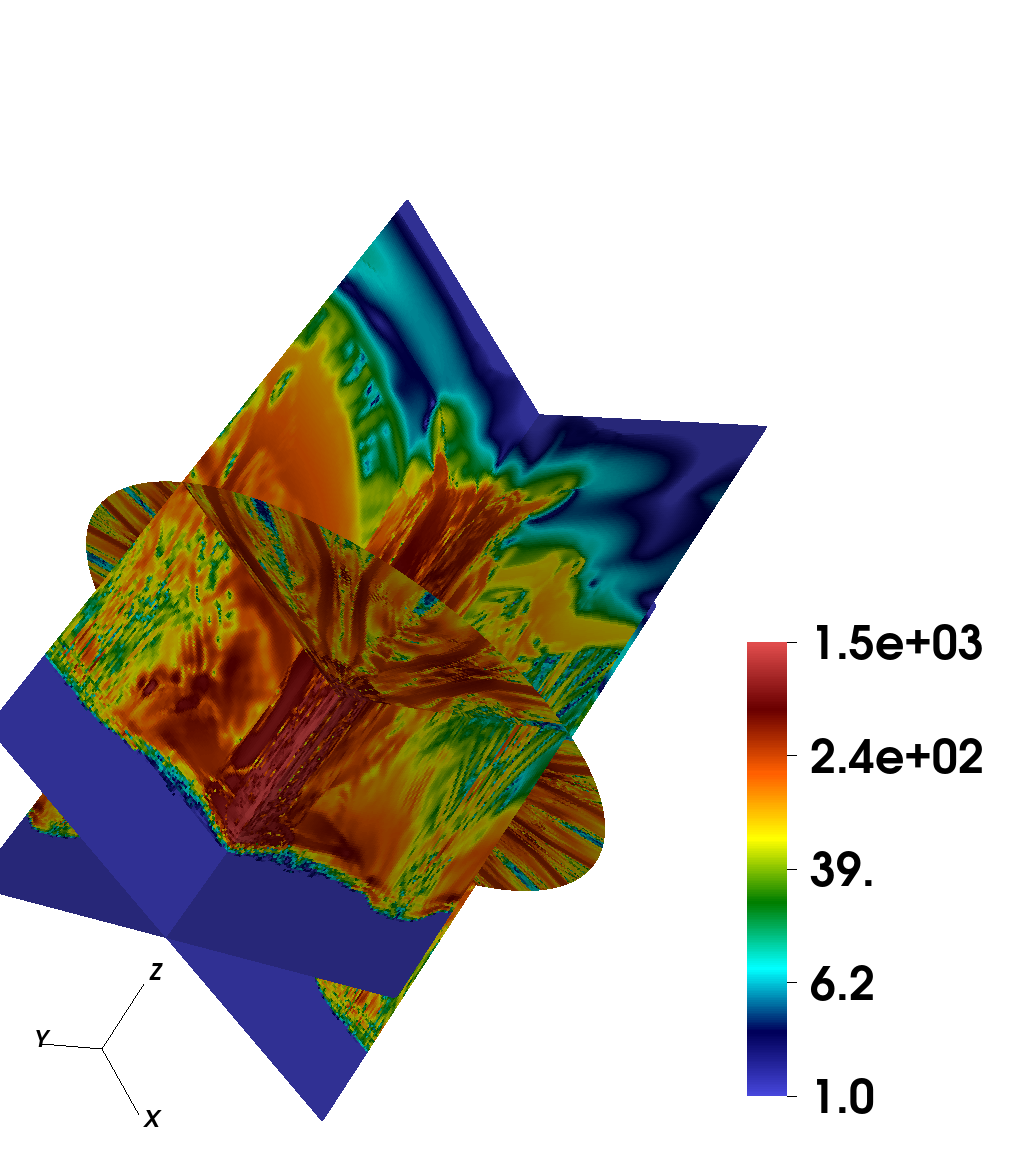
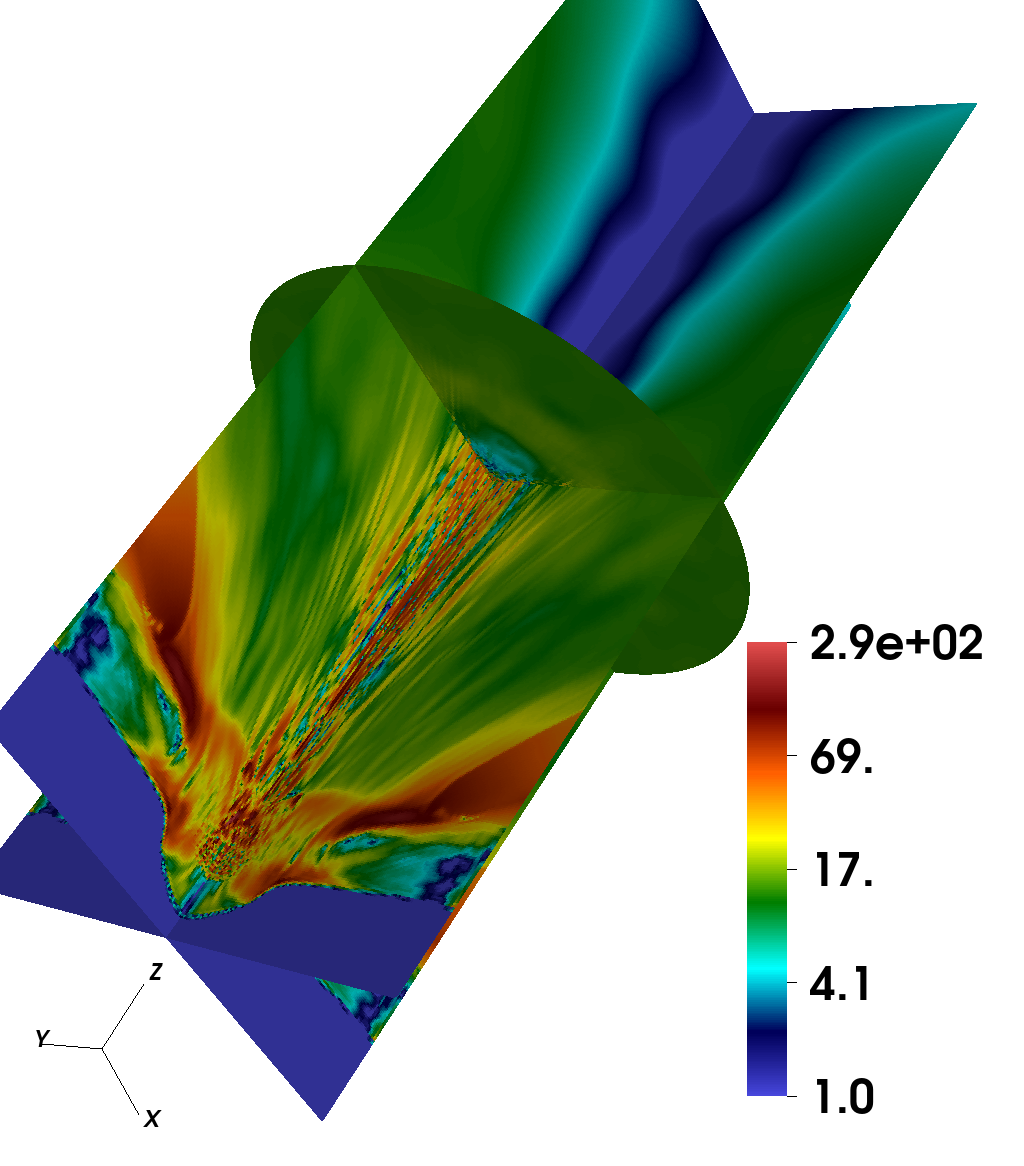
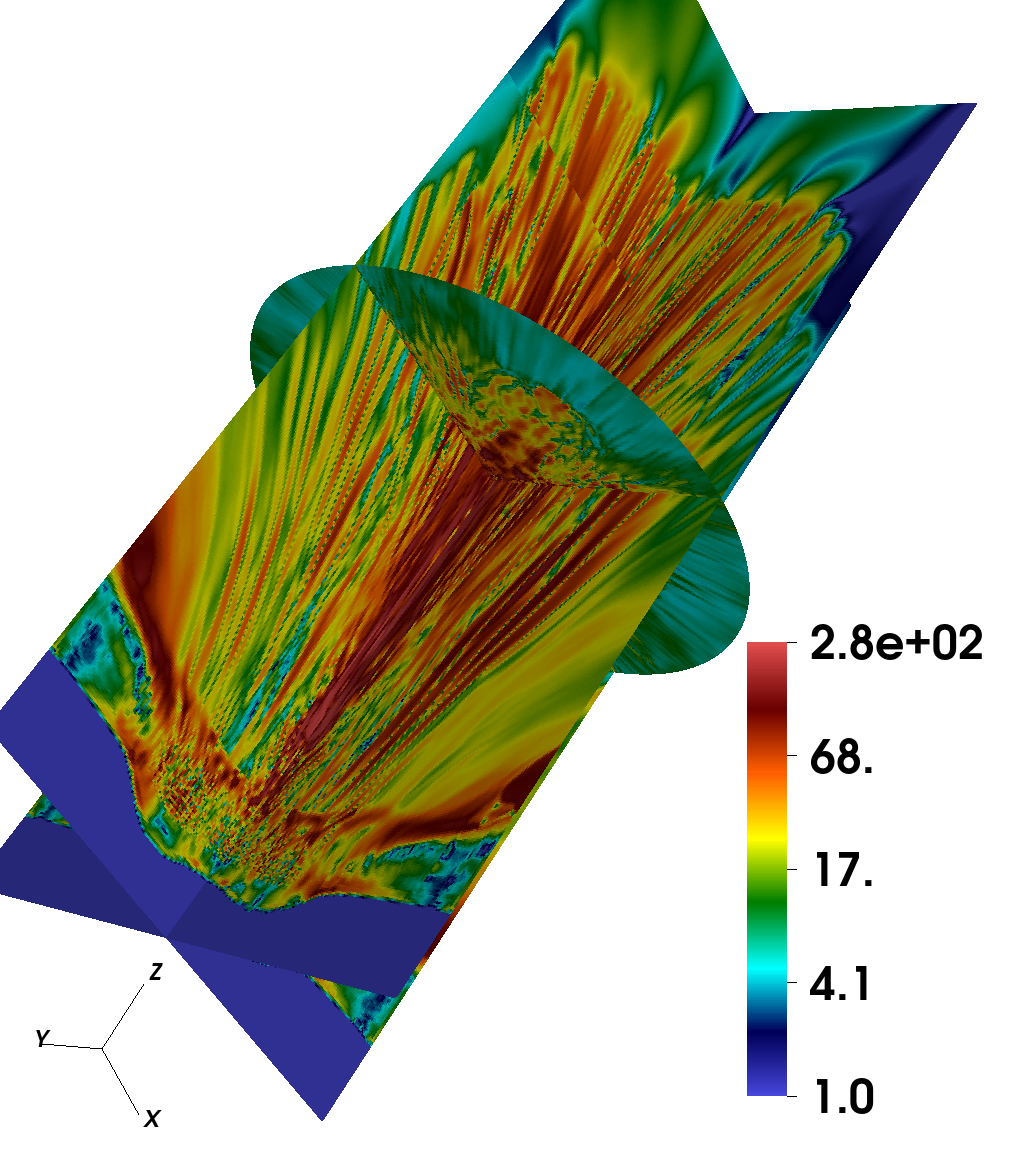
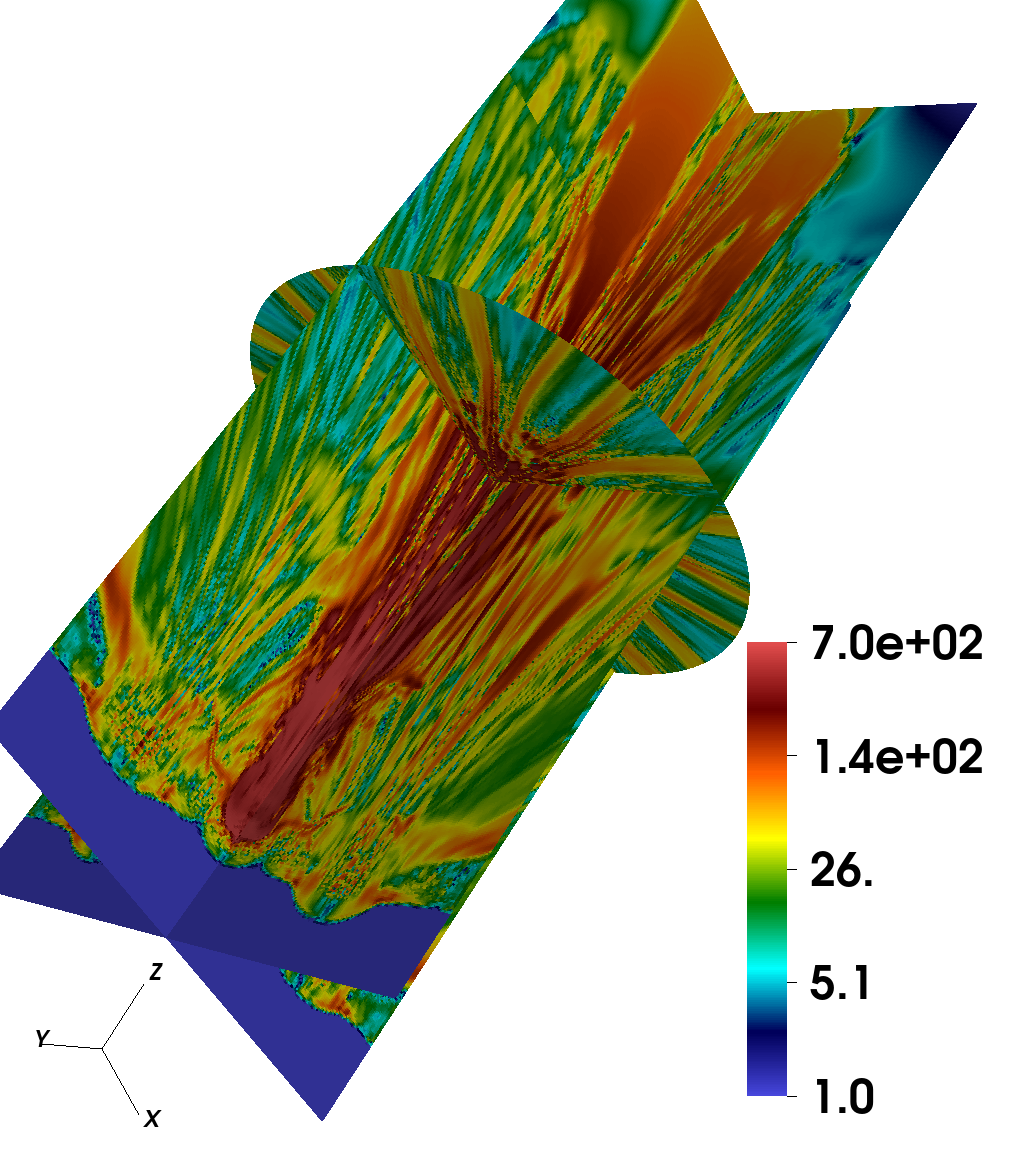
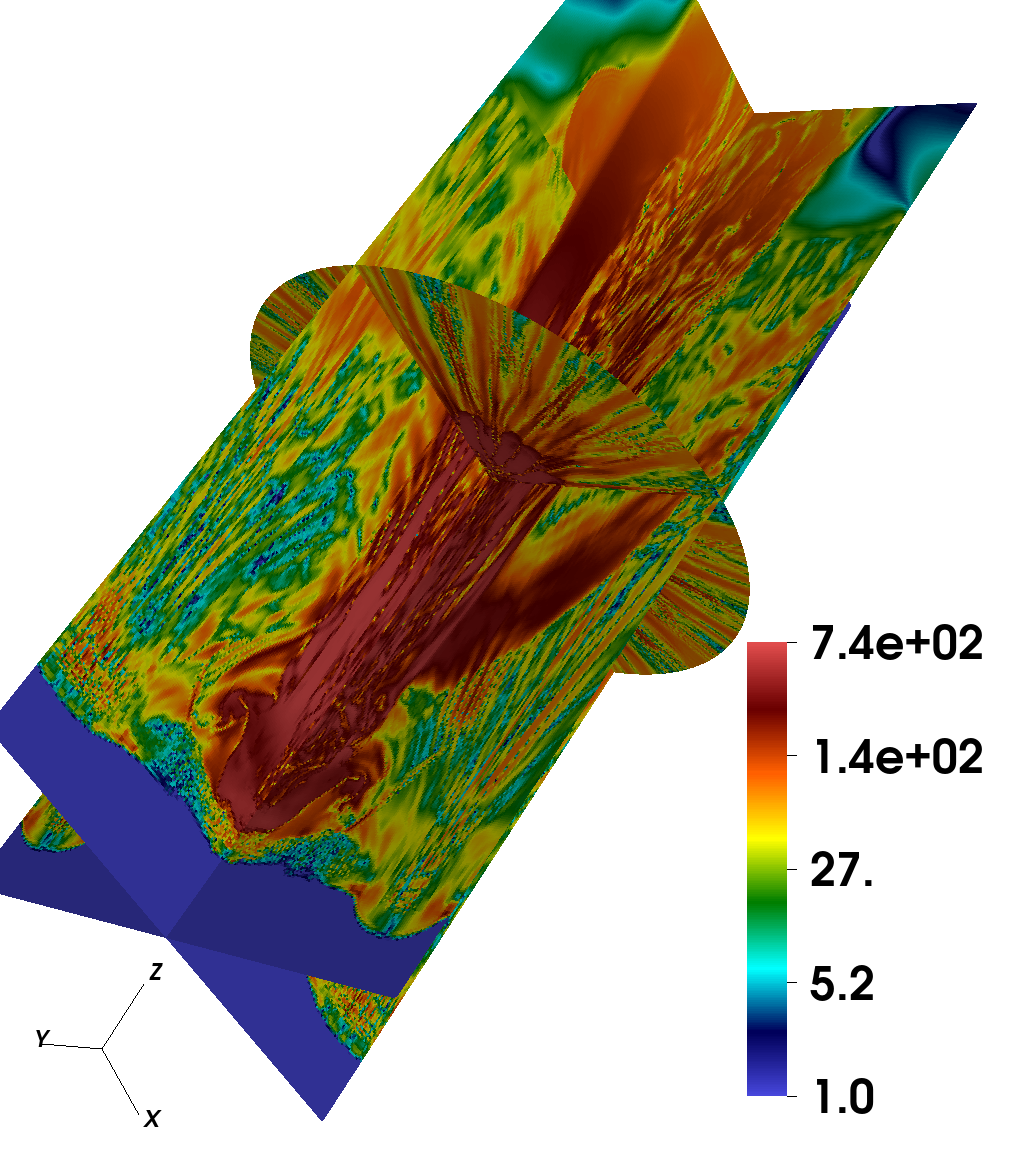
The magnetic field is mostly axial near the axis and mostly toroidal near the surface of the target, as shown in Figure 7(f) and Figure 8. The width and the length of the field bundles grow with the jet. The maximum field strength reaches several hundred kilo-gauss. The maximum magnitude of magnetic field at increases with the radius of the laser ring, as shown in Figure 10. This is consistent with the 2D cylindrical simulation(Fu et al., 2015). However, the full three dimensional simulation predicts a magnetic field axial polarized and much stronger than those in the two dimensional cylindrical simulation. In the 2D cylindrical simulation, the laser intensity is azimuthally uniform, thus the Biermann battery term only has the toroidal component.
IV Diagnostics modeling and Comparison to experiments
IV.1 Optical Thomson scattering spectrum
Although we can fit the optical Thomson-scattering spectrum using the theoretical spectrum to infer the temperatures, density, and flow velocity, the gradient of these quantities near TCC can affect the spectrum and mislead the interpretation. As shown in Table 3, the variation of some quantities can exceed and thus significantly alters the spectrum. Moreover, the probe beam can potentially heat the plasma near TCC. In our simulation, the heating effect and all the gradients are taken into account. Instead of directly comparing the deduced quantities with those predicted in Figure 5, we compare the synthetic spectrum with the data for experiment spectrum in Figure 11.


Figure 11(a) and (b) shows that the heating from the TS probe has a significant impact on the measured spectra. Although the energy in the probe beam () is low compared to the drive beams, the diameter focal spot results in an intensity of . FLASH simulations are performed with and without the probe beam to study the impact of probe-beam heating. The locations of the TS peaks in the simulated spectra that included the probe beam are in much better agreement with the measured spectra. The effect is more pronounced for smaller ring radii because the electron temperature is lower, which leads to higher collisional absorption.
The background of the measured EPW spectrum comes from the bremsstrahlung radiation, which is not calculated in the simulation. The bremsstrahlung shape is apparent when the electron density is larger than .
The agreement for IAW spectrum is excellent for when the heating is included, as shown in the first plot in 11(b). However, for finite , the simulation always underestimates the width of the broadened line. The depth of the valley in the middle of the shape is corrected by including the heating effect, which can be explained by the increasing of the electron temperature from probe heating. The under-predicted width of the IAW spectrum indicates the under-predicted ion temperature. Because ions are not directly heated by the probe beam, we also compare the ion temperature from fitting the IAW spectrum and the averaged value in FLASH simulations in Figure 12.
One may argue that the reason for underestimating the IAW line width is the inaccuracy of the RAGE-like (it is so named because it is identical to the method implemented in the radiation hydrodynamics code RAGE(Gittings et al., 2008)) energy apportion in our modeling. The RAGE-like approach apportions the work term among the ions, electrons, and radiation field in proportion to the partial pressures of these components. It is physically accurate in smooth flow, but does not distribute internal energy correctly among the ions, electrons, and radiation field at shocks. For the finite case, strong and multiple shocks are presented. There are the shocks between the plumes generated by neighboring beams and the cylindrical shock surrounding the core. The core is usually a secondary downstream. The ion heating exists at all shocks, but is not calculated accurately using the RAGE-like approach. The electron temperature should be significantly overestimated if the energy apportion between electrons and ions is inaccurate. However, the comparison between the measured IAW spectrum and the synthetic spectrum with probe heating does not suggest any significant overestimation of electron temperature. The reason for this might be the usage of electron heat conduction in FLASH simulation, which mitigates the inaccuracy of energy apportion. The extra part of the ion thermal energy measured by IAW spectrum can only come from part of the kinetic energy in the axial bulk motion of the flow, since multiple shocks already convert the kinetic energy of radial and toroidal bulk motion into thermal energy, and the magnetic energy is little comparing to the thermal energy and the kinetic energy. For example, 10% of the bulk kinetic energy density at and corresponds to . It is likely that the turbulence is developed from the flow velocity difference between the plumes generated from different laser spots due the laser intensity difference between these spots. The plasma has high Reynolds number, as shown in Table 3. The kinetic energy in turbulent motion does not have to be dissipated into heat to make the IAW spectrum broader, as long as a significant amount of turbulent kinetic energy is cascaded down to a scale below the resolution of Thomason scattering, i.e. . We will study the turbulence effect in a future work.

IV.2 Proton radiography
The proton images are smeared by a few factors (1) Spatial smearing: the finite size of the proton source, which is 45 for the fusion protons and for the TNSA protons; (2) Temporal smearing: the pulse duration of the proton source, which is for fusion protons and for TNSA protons. The pulse duration causes the smearing at length scale , where is the characteristic speed of the plasma. For fusion protons, , , using the velocities in Table 3. For TNSA protons with , , ; (3) Spectrum smearing: the energy variation of the source proton. Derived from Eq(16) in Graziani et. al.(Graziani et al., 2017), the variation of deflection angle cause by is times the deflection angle. If there is only spectrum smearing, assuming the proton is shifted by (which is typical) seen in the TCC frame, it is expected that the 10.2MeV TNSA protons with ( is half of the effective temperature)resolve the magnetic field at , DD protons with resolve magnetic field at , and protons with resolve magnetic field at . The energy gain or lost from the electric field is estimated to be less than , which is negligible compare to the of the beam itself. Overall, our FLASH simulation is able to resolve a smaller spatial scale than the experiment.


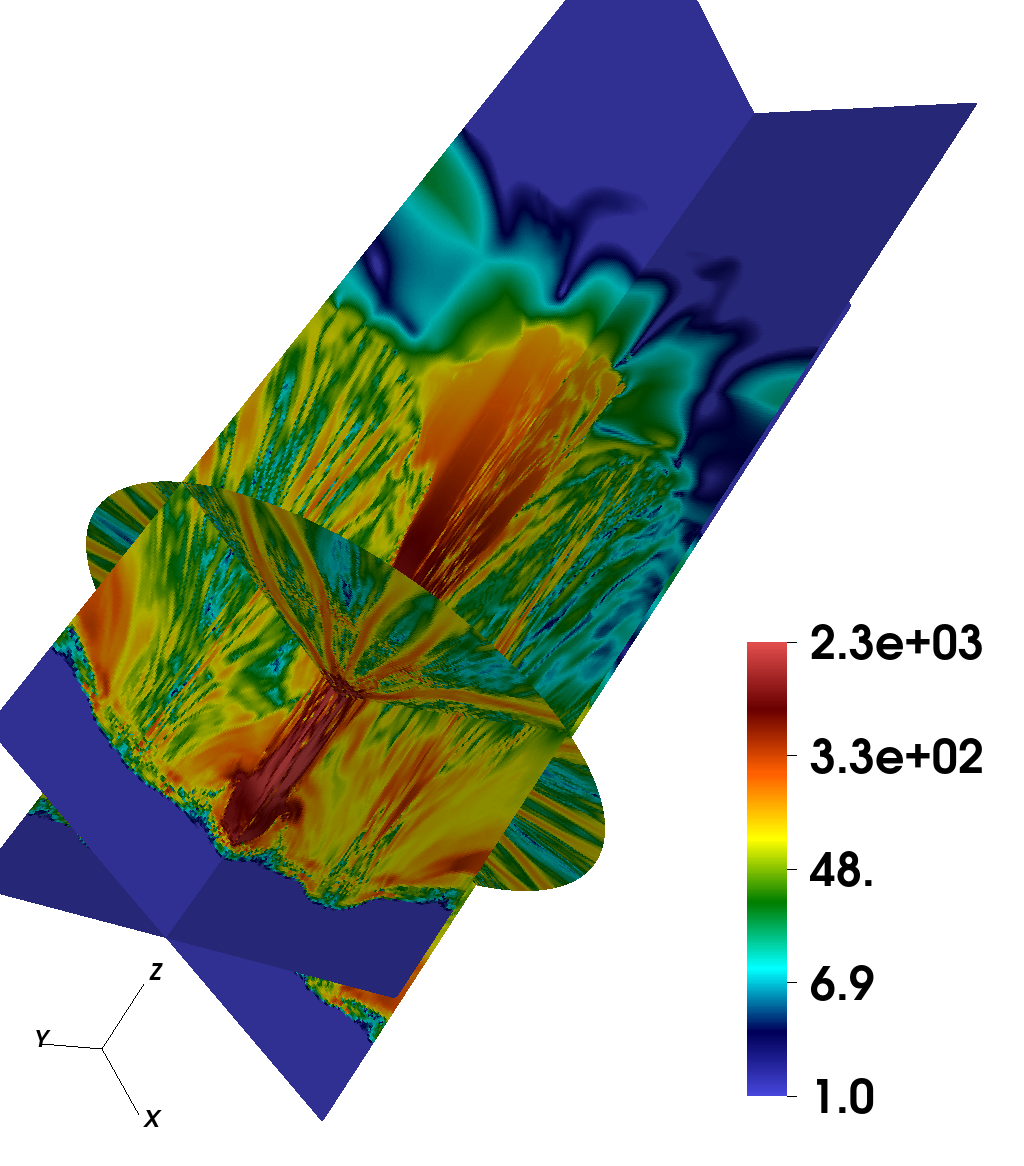


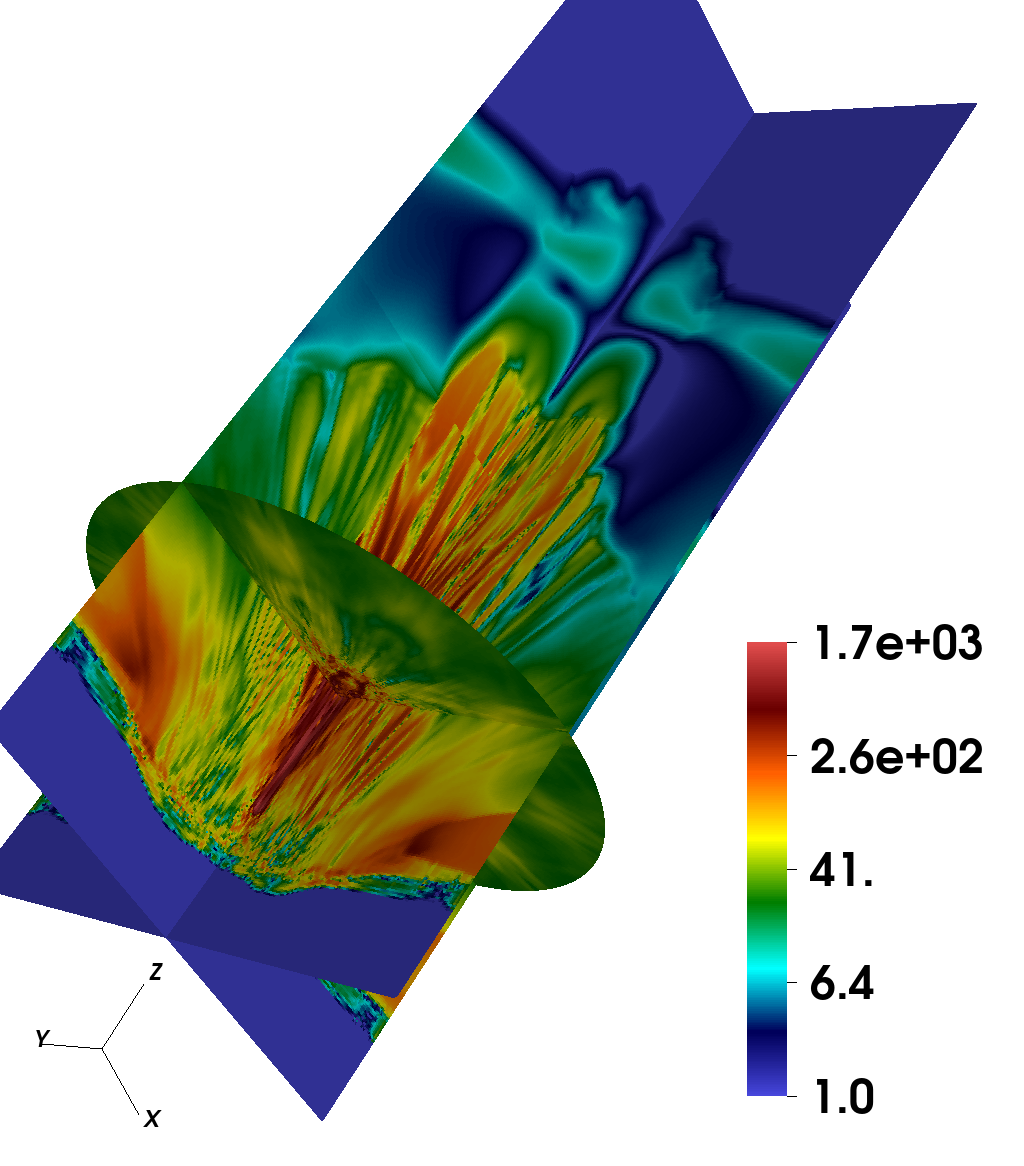


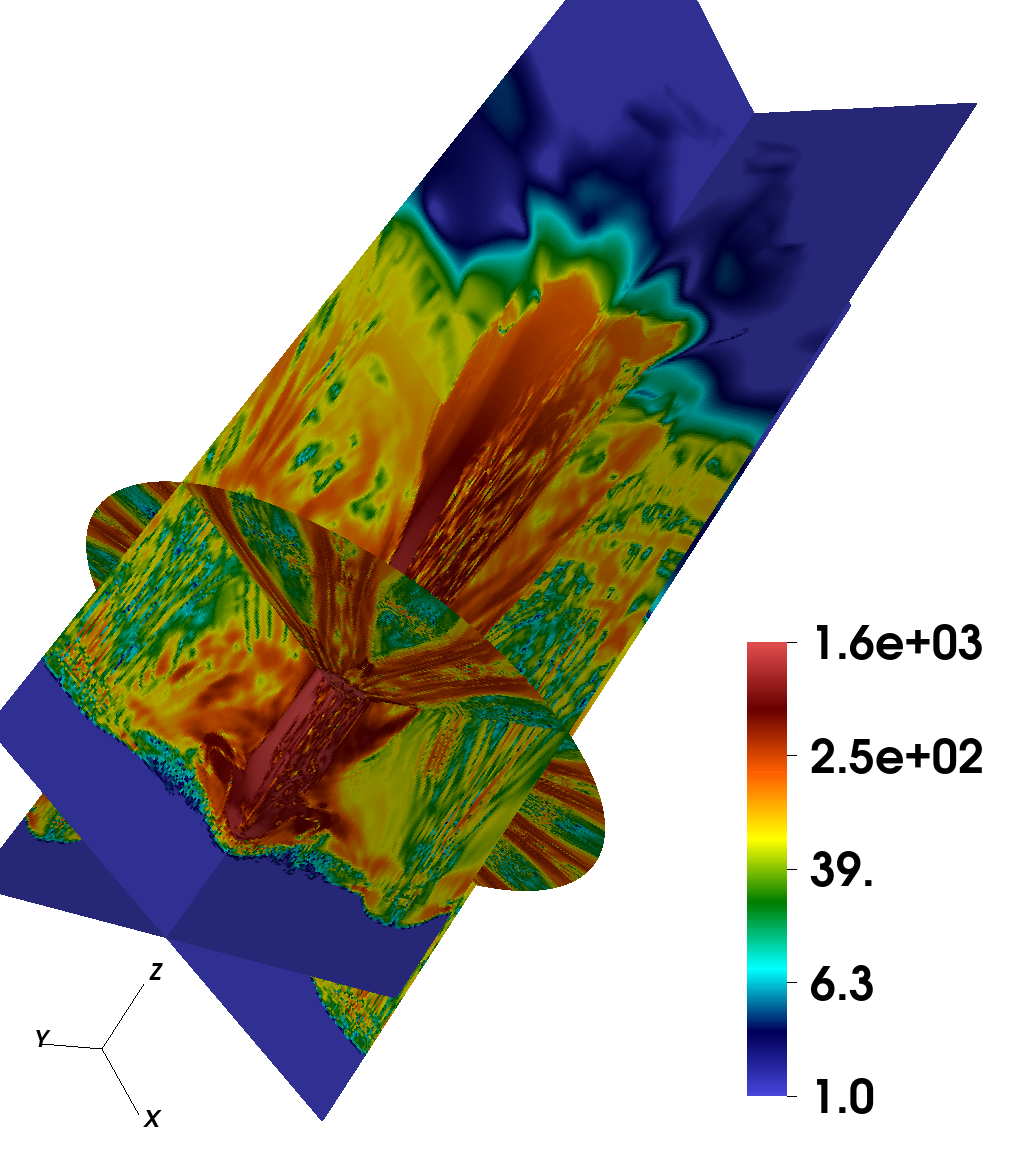


The simulation of images predicts the features observed in the experimental data. To the lowest order the light and dark patterns correspond to the averaged MHD current() projected along the light of sight(Graziani et al., 2017). The alternating axial field filaments result in several vertical dark and bright strips. The curved horizontal strip close to the surface of the target is produced by the large loop of surface toroidal field. Figure 13 shows the comparison between the simulation synthetic and experimental proton images. Figure 14 shows the comparison between the simulation synthetic and experimental TNSA proton image. Figure 15 shows examples of the proton images for and case. The good qualitative agreement between the synthetic images and the ones from experiment on the general trend of large scale features suggests that the magnetic field structures we predict using FLASH simulation are consistent with the structures in the experiments.
Nernst effect can affect the evolution of magnetic field(Gao et al., 2015; Lancia et al., 2014). This might be the reason why there are some disagreements in small scale structure and sizes between the experimental data and the synthetic images. In Table 3, the product of the electron gyro-frequency and electron collision time is at and at . The value indicates that Nernst effect is important for our experiments. The MHD model with Nernst term will be implemented in FLASH in the future. We will make detail qualitative comparison in a future study with Nernst term included.
V Conclusions and Discussions
The FLASH simulation results were validated against a subset of experimental data from the OMEGA experiments. The creation of the jets and strong magnetic fields using the ring laser pattern is explained. 3D simulations reproduce some features in previous 2D cylindrical results(Fu et al., 2013, 2015). However, many new features emerges in 3D, e.g. the “sun flower” density pattern and the alternating para-axial magnetic field bundles. Some questions still remain, e.g. the under-prediction in the line width of IAW spectrum in Figure 11. An accurate modeling for the magnetic fields requires implementation of Nernst effect in FLASH code. Simulations using higher resolutions are also desired. The XRFC modeling will be discussed in a future study.
The geometry of magnetic fields in our jets may be different from the generally believed models in many astrophysical context, e.g. the magnetic field of the jet along the axis of an accreting black hole(Beckwith et al., 2008), where the toroidal field supposedly dominates. However, much can still be learned about the magnetic effect on jet collimation, stability and structure in the laboratory. The characteristics of the magnetized jet can be well controlled by tuning the ring radius and increasing number of beams. By varying the hollow ring radius, laser and target properties, we can achieve a large dynamic range for the jet parameters, thus creating a highly versatile laboratory platform for laser-based astrophysics. By using the jets we created, shocks and shear flows can be studied with jet-jet collisions.
The hollow ring laser platform is also ideally suited to scale up to NIF with 192 beams and more energy per beam, creating centimeter-sized magnetized jets. The jets produced with the NIF platform will have several distinctive properties from OMEGA experiments, but are of key importance for astrophysical jet modeling. The higher temperature, density, flow velocity, and magnetic field will lead to large dimensionless parameters. A turbulence regime is possible. The longer pulse on NIF can sustain the jet for longer time, so that the radiative cooling for doped targets become significant and useful to make the aspect ratio larger. The aspect ratio can become large enough() that the stability study can become more relevant to astrophysics. The physical parameters of the jet can be tuned in such ways that various collisionless and collisional regimes of the plasma can be accessed. The dimensionless parameters for astrophysical jets may be better realized in the large scale jets of NIF. Magnetic field geometry may be tuned by increasing the number of beams.
VI Acknowledgment
This research is supported by DOE grant DE-NA0002721. The research and materials incorporated in this work were partially developed at the National Laser Users’ Facility at the University of Rochester’s Laboratory for Laser Energetics(LLE), with financial support from the U.S. Department of Energy(DOE) under Cooperative Agreement DE-NA0001944. This work used the Extreme Science and Engineering Discovery Environment (XSEDE(Towns et al., 2014)), which is supported by National Science Foundation(NSF) grant number ACI-1548562. This research used resources of the National Energy Research Scientific Computing Center, a DOE Office of Science User Facility supported by the Office of Science of the U.S. Department of Energy under Contract No. DE-AC02-05CH11231. Additional simulations were performed at the Argonne Leadership Computing Facility and with Los Alamos National Laboratory institutional computing. YL and EL acknowledge partial support by LANL-LDRD during the writing of this paper. We also acknowledge the valuable discussions with Hui Li.
References
- Hirose et al. (1997) S. Hirose, Y. Uchida, K. Shibata, and R. Matsumoto, Publications of the Astronomical Society of Japan 49, 193 (1997).
- Ferrari (1998) A. Ferrari, Annual Review of Astronomy and Astrophysics 36, 539 (1998).
- Sari et al. (1999) R. Sari, T. Piran, and J. P. Halpern, The Astrophysical Journal 519, L17 (1999).
- Tzeferacos et al. (2017) P. Tzeferacos, A. Rigby, A. Bott, A. R. Bell, R. Bingham, A. Casner, F. Cattaneo, E. M. Churazov, J. Emig, N. Flocke, F. Fiuza, C. B. Forest, J. Foster, C. Graziani, J. Katz, M. Koenig, C.-K. Li, J. Meinecke, R. Petrasso, H.-S. Park, B. A. Remington, J. S. Ross, D. Ryu, D. Ryutov, K. Weide, T. G. White, B. Reville, F. Miniati, A. A. Schekochihin, D. H. Froula, G. Gregori, and D. Q. Lamb, Physics of Plasmas 24, 041404 (2017).
- Tzeferacos et al. (2018) P. Tzeferacos, A. Rigby, A. F. A. Bott, A. R. Bell, R. Bingham, A. Casner, F. Cattaneo, E. M. Churazov, J. Emig, F. Fiuza, C. B. Forest, J. Foster, C. Graziani, J. Katz, M. Koenig, C.-K. Li, J. Meinecke, R. Petrasso, H.-S. Park, B. A. Remington, J. S. Ross, D. Ryu, D. Ryutov, T. G. White, B. Reville, F. Miniati, A. A. Schekochihin, D. Q. Lamb, D. H. Froula, and G. Gregori, Nature Communications 9 (2018), 10.1038/s41467-018-02953-2.
- Remington (2005) B. A. Remington, Plasma Physics and Controlled Fusion 47, A191 (2005).
- Foster et al. (2005) J. M. Foster, B. H. Wilde, P. A. Rosen, R. J. R. Williams, B. E. Blue, R. F. Coker, R. P. Drake, A. Frank, P. A. Keiter, A. M. Khokhlov, J. P. Knauer, and T. S. Perry, The Astrophysical Journal 634, L77 (2005).
- Ciardi et al. (2007) A. Ciardi, S. V. Lebedev, A. Frank, E. G. Blackman, J. P. Chittenden, C. J. Jennings, D. J. Ampleford, S. N. Bland, S. C. Bott, J. Rapley, G. N. Hall, F. A. Suzuki-Vidal, A. Marocchino, T. Lery, and C. Stehle, Physics of Plasmas 14, 056501 (2007).
- Ciardi et al. (2009) A. Ciardi, S. V. Lebedev, A. Frank, F. Suzuki-Vidal, G. N. Hall, S. N. Bland, A. Harvey-Thompson, E. G. Blackman, and M. Camenzind, The Astrophysical Journal 691, L147 (2009).
- Lebedev et al. (2004) S. V. Lebedev, D. Ampleford, A. Ciardi, S. N. Bland, J. P. Chittenden, M. G. Haines, A. Frank, E. G. Blackman, and A. Cunningham, The Astrophysical Journal 616, 988 (2004).
- Lebedev et al. (2005) S. V. Lebedev, A. Ciardi, D. J. Ampleford, S. N. Bland, S. C. Bott, J. P. Chittenden, G. N. Hall, J. Rapley, C. Jennings, M. Sherlock, A. Frank, and E. G. Blackman, Plasma Physics and Controlled Fusion 47, B465 (2005).
- Lebedev et al. (2002) S. V. Lebedev, J. P. Chittenden, F. N. Beg, S. N. Bland, A. Ciardi, D. Ampleford, S. Hughes, M. G. Haines, A. Frank, E. G. Blackman, and T. Gardiner, The Astrophysical Journal 564, 113 (2002).
- Remington et al. (2006) B. A. Remington, R. P. Drake, and D. D. Ryutov, Reviews of Modern Physics 78, 755 (2006).
- Fu et al. (2013) W. Fu, E. P. Liang, M. Fatenejad, D. Q. Lamb, M. Grosskopf, H.-S. Park, B. Remington, and A. Spitkovsky, High Energy Density Physics 9, 336 (2013).
- Fu et al. (2015) W. Fu, E. P. Liang, P. Tzeferacos, and D. Q. Lamb, High Energy Density Physics 17, 42 (2015).
- Biermann (1950) L. Biermann, Zeitschrift Naturforschung Teil A 5, 65 (1950).
- Boehly et al. (1997) T. Boehly, D. Brown, R. Craxton, R. Keck, J. Knauer, J. Kelly, T. Kessler, S. Kumpan, S. Loucks, S. Letzring, F. Marshall, R. McCrory, S. Morse, W. Seka, J. Soures, and C. Verdon, Optics Communications 133, 495 (1997).
- Note (1) L. Gao et. al. to be submitted.
- Fryxell et al. (2000) B. Fryxell, K. Olson, P. Ricker, F. X. Timmes, M. Zingale, D. Q. Lamb, P. MacNeice, R. Rosner, J. W. Truran, and H. Tufo, The Astrophysical Journal Supplement Series 131, 273 (2000).
- Note (2) FLASH4 is available at https://flash.uchicago.edu/.
- Dubey et al. (2009) A. Dubey, K. Antypas, M. K. Ganapathy, L. B. Reid, K. Riley, D. Sheeler, A. Siegel, and K. Weide, Parallel Computing 35, 512 (2009).
- Graziani et al. (2015) C. Graziani, P. Tzeferacos, D. Lee, D. Q. Lamb, K. Weide, M. Fatenejad, and J. Miller, The Astrophysical Journal 802, 43 (2015).
- Note (3) PROPACEOS is available at http://www.prism-cs.com.
- Braginskii (1965) S. I. Braginskii, Reviews of Plasma Physics 1, 205 (1965).
- Froula et al. (2006) D. H. Froula, J. S. Ross, L. Divol, and S. H. Glenzer, Review of Scientific Instruments 77, 10E522 (2006).
- Froula et al. (2005) D. Froula, P. Davis, L. Divol, J. Ross, N. Meezan, D. Price, S. Glenzer, and C. Rousseaux, Physical Review Letters 95 (2005), 10.1103/physrevlett.95.195005.
- Sheffield et al. (2010) J. Sheffield, D. Froula, S. H. Glenzer, and J. N. C. Luhmann, Plasma Scattering of Electromagnetic Radiation: Theory and Measurement Techniques (Academic Press, 2010).
- Follett et al. (2016) R. K. Follett, J. A. Delettrez, D. H. Edgell, R. J. Henchen, J. Katz, J. F. Myatt, and D. H. Froula, Review of Scientific Instruments 87, 11E401 (2016).
- Li et al. (2006) C. K. Li, F. H. Séguin, J. A. Frenje, J. R. Rygg, R. D. Petrasso, R. P. J. Town, P. A. Amendt, S. P. Hatchett, O. L. Landen, A. J. Mackinnon, P. K. Patel, V. A. Smalyuk, T. C. Sangster, and J. P. Knauer, Physical Review Letters 97 (2006), 10.1103/physrevlett.97.135003.
- Manuel et al. (2012) M. J.-E. Manuel, A. B. Zylstra, H. G. Rinderknecht, D. T. Casey, M. J. Rosenberg, N. Sinenian, C. K. Li, J. A. Frenje, F. H. Séguin, and R. D. Petrasso, Review of Scientific Instruments 83, 063506 (2012).
- Zylstra et al. (2012) A. B. Zylstra, C. K. Li, H. G. Rinderknecht, F. H. Séguin, R. D. Petrasso, C. Stoeckl, D. D. Meyerhofer, P. Nilson, T. C. Sangster, S. L. Pape, A. Mackinnon, and P. Patel, Review of Scientific Instruments 83, 013511 (2012).
- Flippo et al. (2010) K. Flippo, T. Bartal, F. Beg, S. Chawla, J. Cobble, S. Gaillard, D. Hey, A. MacKinnon, A. MacPhee, P. Nilson, D. Offermann, S. L. Pape, and M. J. Schmitt, Journal of Physics: Conference Series 244, 022033 (2010).
- Note (4) The PSTAR table is available at https://physics.nist.gov/PhysRefData/Star/Text/PSTAR.html.
- Gittings et al. (2008) M. Gittings, R. Weaver, M. Clover, T. Betlach, N. Byrne, R. Coker, E. Dendy, R. Hueckstaedt, K. New, W. R. Oakes, D. Ranta, and R. Stefan, Computational Science & Discovery 1, 015005 (2008).
- Graziani et al. (2017) C. Graziani, P. Tzeferacos, D. Q. Lamb, and C. Li, Review of Scientific Instruments 88, 123507 (2017).
- Gao et al. (2015) L. Gao, P. Nilson, I. Igumenshchev, M. Haines, D. Froula, R. Betti, and D. Meyerhofer, Physical Review Letters 114 (2015), 10.1103/physrevlett.114.215003.
- Lancia et al. (2014) L. Lancia, B. Albertazzi, C. Boniface, A. Grisollet, R. Riquier, F. Chaland, K.-C. L. Thanh, P. Mellor, P. Antici, S. Buffechoux, S. Chen, D. Doria, M. Nakatsutsumi, C. Peth, M. Swantusch, M. Stardubtsev, L. Palumbo, M. Borghesi, O. Willi, H. Pépin, and J. Fuchs, Physical Review Letters 113 (2014), 10.1103/physrevlett.113.235001.
- Beckwith et al. (2008) K. Beckwith, J. F. Hawley, and J. H. Krolik, The Astrophysical Journal 678, 1180 (2008).
- Towns et al. (2014) J. Towns, T. Cockerill, M. Dahan, I. Foster, K. Gaither, A. Grimshaw, V. Hazlewood, S. Lathrop, D. Lifka, G. D. Peterson, R. Roskies, J. R. Scott, and N. Wilkens-Diehr, Computing in Science & Engineering 16, 62 (2014).