11email: mweiler@fqa.ub.edu
Revised Gaia Data Release 2 passbands††thanks: Table 2 is only available at the CDS via anonymous ftp to cdsarc.u-strasbg.fr (130.79.128.5) or via http://cdsarc.u-strasbg.fr/viz-bin/qcat?J/A+A/vol/page.
Abstract
Context. The European Space Agency mission Gaia has published, with its second data release (DR2), a catalogue of photometric measurements for more than 1.3 billion astronomical objects in three passbands. The precision of the measurements in these passbands, denoted G, , and , reach down to the milli-magnitude level. The scientific exploitation of this data set requires precise knowledge of the response curves of the three passbands.
Aims. This work aims to improve the exploitation of the photometric data by deriving an improved set of response curves for the three passbands, allowing for an accurate computation of synthetic Gaia photometry.
Methods. This is achieved by formulating the problem of passband determination in a functional analytic formalism, and linking the photometric measurements with four observational, one empirical, and one theoretical spectral library.
Results. We present response curves for G, , and that differ from the previously published curves, and which provide a better agreement between synthetic Gaia photometry and Gaia observations.
Key Words.:
astronomical databases – catalogues – instrumentation: photometers – techniques: photometric – techniques: spectroscopic1 Introduction
The European Space Agency (ESA) space mission Gaia (Gaia Collaboration Prusti et al., 2016) performs an all-sky astrometric, photometric, and spectroscopic survey. Its second data release (Gaia DR2 in the following, Gaia Collaboration et al. (2018)) includes photometric measurements in three different passbands. Gaia’s G passband covers a wavelength range from the near ultraviolet (roughly 330 nm) to the near infrared (roughly 1050 nm). The other two passbands, denoted and , cover smaller wavelength ranges, from approximately 330 to 680 nm, and 630 to 1050 nm, respectively. Gaia DR2 includes photometric observations of some 1.7 billion astronomical objects in G band, and more than 1.3 billion objects in and in a magnitude range from about three to 21. For the sources with a magnitude below 15, the precision of the photometric data reaches the level of some milli-magnitudes (Evans et al., 2018).
Interpreting this unique rich data set requires knowledge of the response curves of the passbands in which the photometric observations were performed. Before the launch of the Gaia spacecraft in 2013, expected response curves based on laboratory measurements and simulations of the instrumental components (mirror reflectance, prism transmissivities, charge-coupled device (CCD) quantum efficiencies) were published by Jordi et al. (2010). Differences between the predicted passbands and the actual Gaia DR2 passbands have, however, been detected, and Evans et al. (2018) present updated passbands for G, , and that allow for a more accurate reproduction of the observed photometry by synthetic photometry from spectral energy distributions (SEDs) of astronomical calibration sources. In fact two sets of response curves are provided by Evans et al. (2018), one set named DR2, which was used in the preparation of the Gaia DR2, and one named REV, which was derived using more accurate knowledge of the instrument, and which is therefore considered to be closer to the true passband than the DR2 set of response curves. In this work, we aim to further improve the Gaia DR2 passbands. The improvements are achieved in two ways. First, we make use of the techniques for passband reconstruction developed by Weiler et al. (2018), allowing for a deeper insight into the problem and more control over the passband solutions that can be obtained. Second, we include systematic effects in the Gaia DR2 photometry described by Evans et al. (2018) and Arenou et al. (2018) in the problem of passband determination.
The response curves presented by Evans et al. (2018) have been derived by first generating an initial guess based on measured reflectivity, transmissivity, and quantum efficiency curves plus an adjustment for the position of the wavelength cut-on/off position for and . This initial guess has then been modified either by adding a linear combination of the leading few principal components derived from a set of random generated response curves (for G and ), or by multiplying the initial guess with a polynomial (for ) until a good agreement between the synthetic photometry of a set of calibration sources and their observed photometry was achieved (see Chapter 5.3.6 in the Gaia DR2 online documentation111http://gaia.esac.esa.int/documentation/.). In this work we use a functional analytic formulation of the problem as outlined by Weiler et al. (2018). As an additional constraint on the shape of the response curves, we make use of empirical stellar spectra and compare their positions in colour-colour diagrams with the distribution of Gaia DR2 sources in the same colour-colour diagrams. Employing these techniques, we are able to improve the passbands for Gaia DR2, allowing for a better description of the Gaia photometric system.
As during this work have to refer to the three Gaia passbands, and for each of the passbands we have to refer to three different solutions for the response curves (the DR2, the REV, and the solution from this work), and for each of these cases we have to discriminate between observational magnitudes and magnitudes from synthetic photometry, we simplify the nomenclature in the following way. Instead of referring to and , we simply use and when referring to passbands in a generic way. In the superscript we use obs and com to refer to observational magnitudes and computed magnitudes. In the subscript we use dr2, REV, and c to refer to the two passbands by Evans et al. (2018) and the solution from this work, respectively. For the observational photometry, the difference between dr2, REV, and c arises only from small differences in the photometric zero points, except for , as discussed in Sect. 4.
In Sect. 2 of this work we summarise the mathematical approach in brief and discuss modifications with respect to the work by Weiler et al. (2018). In Sect. 3 we discuss the calibration data used in detail, and in Sects. 4 to 6 we derive new passbands for G, , and , compare our results with the initially expected passbands by Jordi et al. (2010) and the revised passbands by Evans et al. (2018), and compare colour-colour relations predicted with different passbands with observed colour-colour relations. We close this work with a summary and discussion in Sect. 7.
2 Theoretical approach
2.1 Mathematical formalism
Following the approach outlined in Weiler et al. (2018), we can formulate the problem of finding a passband given a set of astronomical objects with well known SED and the photometric observations of these objects as follows. We assume that we have a photon-counting device, such as a CCD detector, that records photo-electrons. Let be the response curve, defined as the ratio of recorded photo-electrons over the number of photons entering into the instrument, as a function of wavelength . We assume that is different from zero only inside an a-priori known wavelength interval . Let be a vector of length containing the numbers of observed photo-electrons for different astronomical objects. The entries of , are thus the numbers of electrons per unit of time and unit of area. For Gaia DR2, the unit of area is the aperture of the Gaia telescope, which is 0.7278 m2. Furthermore we assume that we know the SED of the objects, to which we refer as the ”calibration sources”, on the wavelength interval . We transform the SED into the spectral photon distribution (SPD) by dividing the SED with the energy of a photon as a function of wavelength. The SPDs of the calibration sources we denote as . With the abbreviation , the relationship between and is
| (1) |
Assuming square-integrability for all relevant functions over the wavelength interval , we exploit the properties of a Hilbert space of square-integrable functions over and the field of real numbers, . The expression in this context is the scalar product between two vectors, which are the functions and . We can now develop the set of SPDs in an -dimensional orthonormal basis , with , denoting the Kronecker delta, and :
| (2) |
Combining Eqs. (1) and (2) for all calibration sources, we obtain
| (3) |
with the matrix containing the coefficients for source and basis function , and the -vector containing the elements . The values of are thus the projections of the passband onto the basis function , and we denote the linear combination
| (4) |
the ”parallel component” of the passband . This function is uniquely defined by the set of calibration sources and is obtained by solving Eq. (3) for . However, we have the freedom of adding any function that satisfies the condition
| (5) |
to the parallel component without affecting . The function , which we call the ”orthogonal component” of the passband , is entirely unconstrained by the calibration sources and this function has to be estimated under the constraint that the sum
| (6) |
satisfies all physical constraints that apply to the passband (i.e. non-negativity, smoothness, bound to unity) and that the sum meets the a-priori information on the passband.
The orthonormal basis functions suitable for representing the SPDs of the set of calibration sources we construct using functional principal component analysis on the tabulated SPDs of the calibration sources. The number we estimate from the residuals obtained in solving Eq. (3). To estimate the orthogonal component of the passband, , we start from an initial guess for the passband , which we denote . This initial guess we modify with a linear multiplicative model, that is, we write
| (7) |
Here, are some suitably but otherwise freely chosen basis functions, and the are coefficients to be optimised. The difference to the standard approach of deriving a passband by modifying the shape of an initial guess for the passband is that we enforce the modified passband to have a parallel component that is obtained from the solution of Eq. (3), that is, we find the under the constraint
| (8) |
With the matrix , , we thus obtain the coefficients by solving the linear equations
| (9) |
Up to here, the approach is identical to the one outlined by Weiler et al. (2018), and the reader is referred to this work for a more detailed description. Weiler et al. (2018) take into account the uncertainty in by replacing with random sampled vectors generated using the formal variance-covariance matrix of the solution from Eq. (3). This procedure is referred to as the ”random sampling approach” by Weiler et al. (2018). Furthermore, free parameters for modifying without affecting were introduced by making Eq. (9) underdetermined and computing a basis for the null space of the matrix . Weiler et al. (2018) refers to this as the ”null space approach”. We now introduce some small modifications that concern these two last aspects and which have proven useful for deriving Gaia DR2 passbands.
For the linear modification model according to Eq. (7), Weiler et al. (2018) have used a polynomial, . For the case of Gaia DR2 passbands, we found that we can use a larger number of basis functions than was used by Weiler et al. (2018), and that a polynomial modification model does not provide sufficient flexibility for finding satisfying estimates for . In this work we use cubic B-splines instead. By adjusting the knot sequence defining the B-spline basis functions , much more flexibility in is obtained while preserving . In order to allow for the identity transformation, we include a constant function in the set of B-spline basis functions , that is, , , . This way, we easily obtain satisfying estimates for for a given parallel component, in the sense that the obtained solutions for are sufficiently smooth, bound to the interval , and close to the initial guess .
The second change with respect to Weiler et al. (2018) is that we combine the random sampling approach and the null space approach. We choose , and compute the null space of ; the basis matrix of the null space we denote . We then generate random solutions from , taking and the variance-covariance matrix on from Eq. (3). For each random solution, we choose the -element vector of free parameters such that minimises the difference between the modified initial guess for the passband and the initial guess passband, being one particular solution of the underdetermined system given by Eq. (9). As a measure for this difference we take the -norm of , excluding the zero entry in , corresponding to the constant function , from computing the norm. Excluding the zero entry of from evaluating the difference makes the approach insensitive to a scaling factor between the initial guess and the modified passband. This way, after a small number of random samplings (less than 100 samples, typically), we obtain good estimates for .
We complete the theoretical considerations of the problem of passband determination in this work by considering the uncertainty on the derived passband. As the passband , according to Eq. (6), is the sum of a constrained function and an unconstrained function , the error on the passband is not a well defined concept. An error on can in principle be obtained, in the form of a variance-covariance matrix on the coefficient vector . However, as the orthogonal component can be chosen arbitrarily, there is no error on this component, and consequently no meaningful error on the sum of and . Modifying an initial passband with some version of a modification model as in Evans et al. (2018) or Weiler et al. (2018) may allow us to compute an error on the coefficients of that particular model. However, choosing another initial passband or modification model will result in a solution for that predicts the same synthetic photometry for all calibration sources, but has a different confidence interval. This effect can be seen in the two sets of passbands, the DR2 and the REV passbands, by Evans et al. (2018). Both sets of passbands result essentially in the same residuals on the photometry of the calibration sources, indicating that they both have the same parallel component with respect to the SPDs of the calibration sources used. The strong differences in shape between the DR2 and REV passbands only affect orthogonal components, which are not constrained by the calibration sources. Although the residuals obtained with the two different sets of passbands are virtually the same, the error intervals specified by Evans et al. (2018) strongly deviate from each other in some wavelength ranges, indicating the model-dependency of the error intervals. The uncertainty on is therefore as arbitrary as the choice of the modification model, using a multiplication with polynomials or B-spline basis functions or adding principal components resulting from a simulated data set or whatever else. When comparing the passbands derived in this work with the passbands by Evans et al. (2018), we therefore do not consider the error intervals provided. As the error on is dominated by the error in the calibration spectra, for which no suitable error model is currently available (Weiler et al., 2018), we also do not provide errors on the parallel component in this work.
2.2 Colour-colour relations
For sources with an SPD that lies within the subspace of spanned by the SPDs of the calibrations sources (that is, for SPDs that can be well approximated by a linear combination of the SPDs of the calibration sources), the synthetic photometry depends on the constrained parallel component of the passband. For sources with a significant component in their SPD that falls outside the space spanned by the calibration sources, the synthetic photometry also depends on the guess for the orthogonal passband component. The larger the component of an SPD outside the subspace spanned by the calibration sources is in comparison to its component inside the subspace, the stronger the contribution of the unconstrained passband component to the synthetic photometry becomes. This effect affects objects with very non-stellar SPDs, such as quasars, and, as already demonstrated in Weiler et al. (2018), very red sources not included in the set of calibration sources. An incorrect estimate of can thus introduce systematic errors in the synthetic photometry for such sources. In the case of very red sources, the systematic error increases with decreasing effective temperature of the objects.
To reduce the effects of such systematic errors, we make use of empirical spectra representative for different spectral types, as well as theoretical stellar spectra, including spectral types not included in the set of calibration sources. For these spectra, no individual astrophysical source is available for comparing synthetic and Gaia DR2 photometry. Instead we compare the synthetic photometry in a statistical way with observations, by comparing the path the empirical and theoretical spectra follow in a colour-colour diagram with the curve the observed photometry of a large set of sources forms in the same diagram. We confirm that, for passbands derived from spectral libraries as described in Sect. 2.1, the path in the colour-colour diagram for empirical and theoretical spectra agrees well with the observational relation for sources of spectral types similar to the calibration sources. We then assume that the agreement between the empirical and theoretical and observational colour-colour relations should also hold for sources with significant components of their SPDs outside the space spanned by the SPDs of the calibration sources. We thus add the additional constraint on the orthogonal component that it should not only result from a smooth variation of the initial guess for the passband, but at the same time also result in a good agreement between the predicted and observed colour-colour relation for stars of all spectral types, including very red sources.
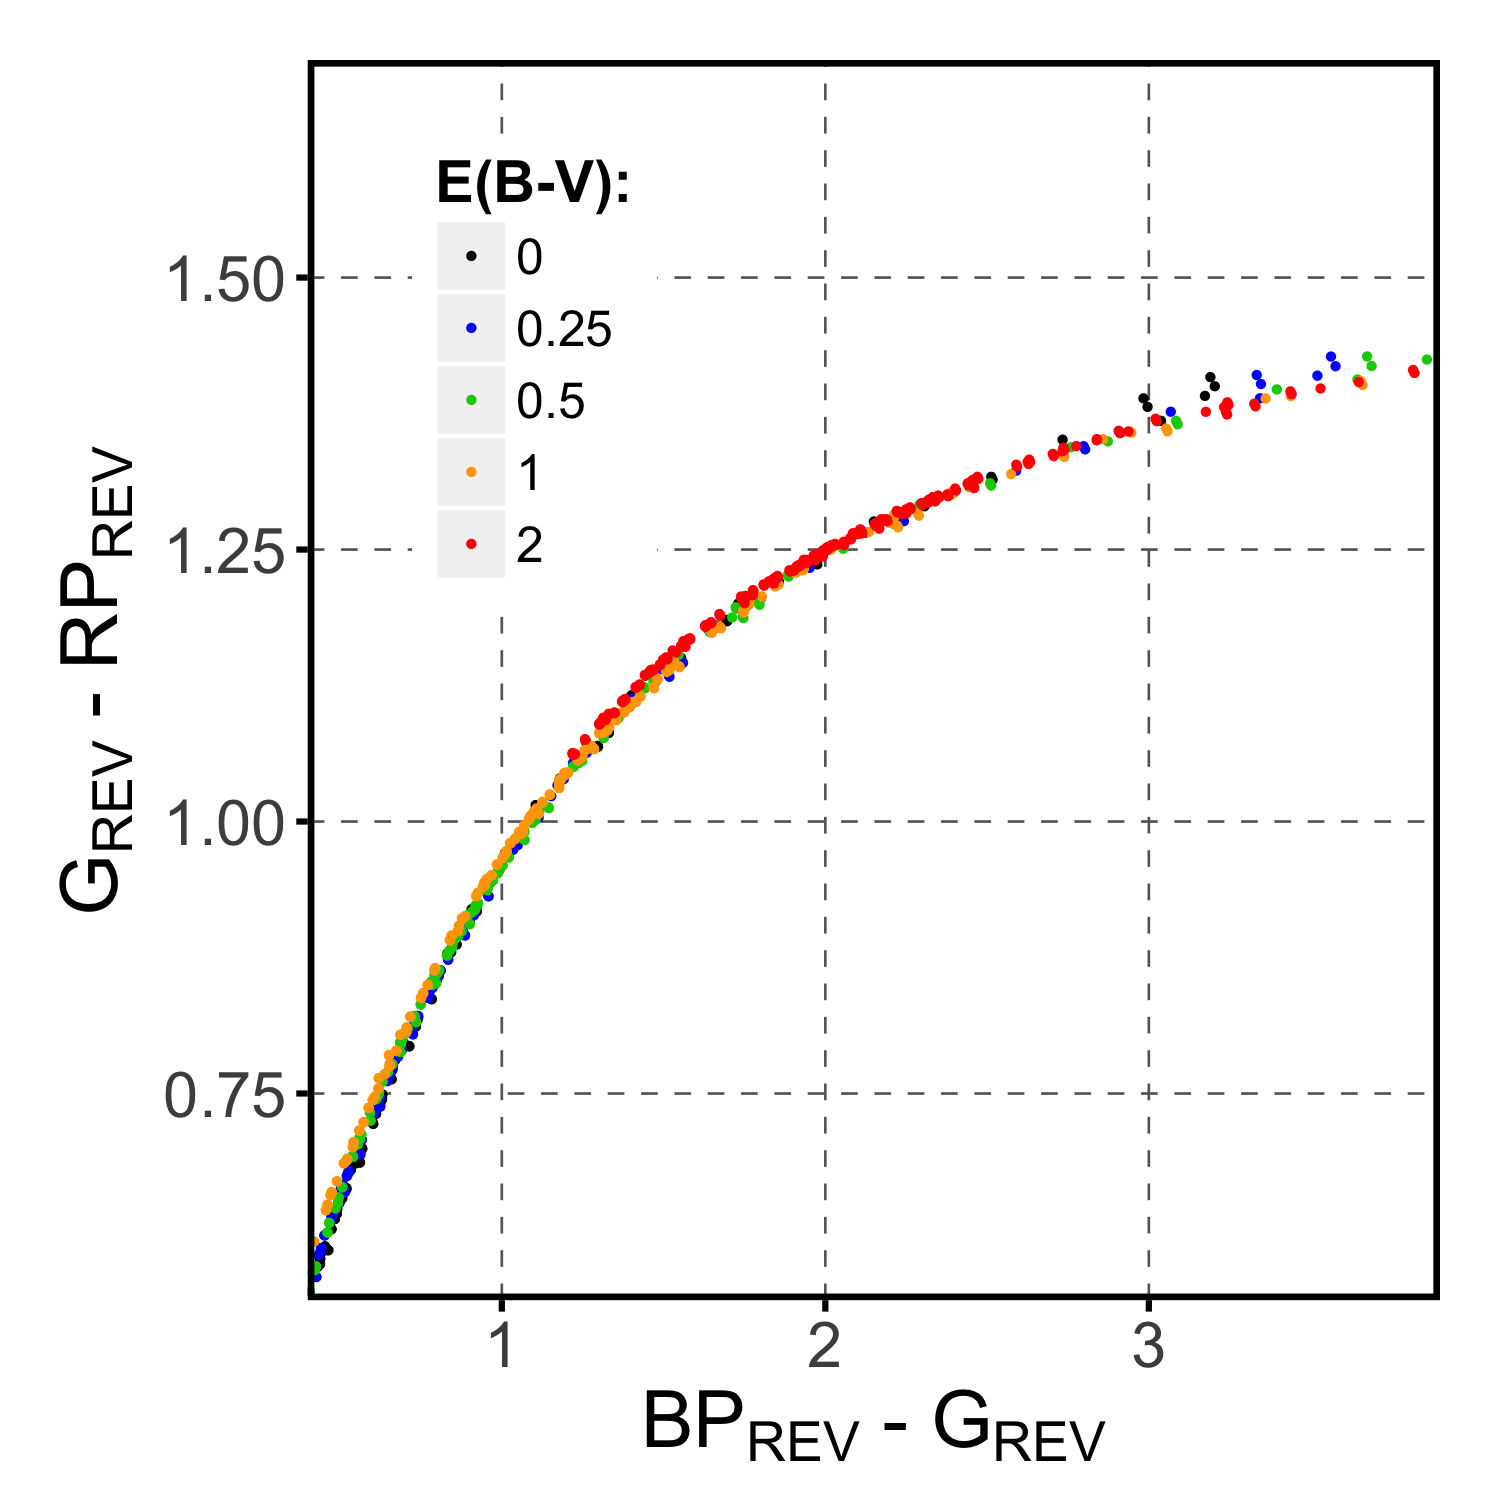
To find such an estimate for , we employ the random sampling introduced in Sec. 2.1, generating candidates for that result in smooth and physically reasonable passbands randomly, and comparing the synthetic colour-colour relation for the empirical and theoretical spectra with the one observed for Gaia DR2. In practice, we first determine the passband. We find this passband in good agreement with the pre-launch expectations, and therefore do not subject it to further modifications by changing its orthogonal component. In the next step we determine the passband. We compare the synthetic BP–RP versus BP–G colours with the observed distribution, and find a good agreement for all empirical and theoretical spectra similar to the calibration spectra. Finally, we determine the RP passband and refine it by selecting an orthogonal component that results in a good agreement between the empirical and theoretical spectra and the observational relation in the versus diagram for all spectral types.
2.3 Passband parameters
For each passband derived in this work, we provide a set of relevant parameters. These parameters include the following.
-
•
The zero point in the VEGAMAG photometric system. This photometric system uses the SED of Vega to compute the reference flux in each particular passband. For the SED of Vega, we use the spectrum alpha_lyr_stis_008, the latest CALSPEC spectrum for Vega, and we assume a magnitude of 0.023 for Vega (Bohlin, 2007).
-
•
The zero point in the AB photometric system (Oke & Gunn, 1983). This photometric system uses a constant SED of 3631 Jy at all frequencies to compute the reference flux in particular passbands.
-
•
The mean wavelength of the passband, defined as the weighted mean
(10) -
•
The pivot wavelength (Koornneef et al., 1986), defined as
(11) This quantity is convenient for conversion between fluxes expressed in frequencies and in wavelength.
-
•
The -norms of the parallel and orthogonal components of the passbands, and . These quantities are required to compute the angle defined as (Weiler et al., 2018)
(12) which serves as a measure of how well a given SPD is represented by the SPDs of the calibration spectra used in the derivation of the passbands. A value of of zero corresponds to a source whose synthetic photometry does not depend on the choice of , while a value of 90∘ corresponds to a source whose synthetic photometry does not depend on . It therefore serves as an indicator of how much the synthetic photometry of a given SPD depends on the choice of , and with it how sensitive it is to systematic errors resulting from an incorrect estimate for .
The values of these parameters are summarised in Table 1 for all passbands derived in this work. All passbands are tabulated with their parallel and orthogonal components in Table 2, which is available in electronic form only.
3 Calibration data
3.1 Observational spectral libraries
In this work, we consider four spectral libraries for calibration sources, namely the CALSPEC library (Bohlin et al., 2017), the Next Generation Spectral Library (NGSL) (Heap & Lindler, 2016), the spectral library by Stritzinger et al. (2005), and the set of spectrophotometric standard stars by Pancino et al. (2012).
The CALSPEC set consists of calibration sources for the instruments of the Hubble Space Telescope (HST), and provides a particularly wide coverage in magnitudes, from very bright down to about 17. The set of spectra selected for this work contains sources of spectral type O to K that fall in the suitable magnitude range to be used for Gaia DR2 calibration. The NGSL library is based on HST/Space Telescope Imaging Spectrograph (STIS) observations and covers magnitudes from very bright down to about 12, and also contains sources of the spectral types O to K. The wavelength coverage is from the ultraviolet to about 1030 nm, and we applied the same extension to 1100 nm as discussed in Weiler et al. (2018). The Stritzinger et al. (2005) set of spectra are obtained from ground-based observations, covering intermediate magnitudes roughly between 7 and 12 in . This data set contains spectra of spectral types B to K, plus one M-type source.
To calibrate Gaia data, a homogeneous set of approximately 200 spectrophotometric standard stars (SPSS) is being built (Pancino et al., 2012; Altavilla et al., 2015), covering the widest possible range in spectral types and the entire Gaia wavelength range (330 nm to 1050 nm), and calibrated on Vega (Bohlin & Gilliland, 2004; Bohlin, 2007, 2014) with errors within 1% to 3%. The SPSS set was also monitored for constancy within 10 mmag (Marinoni et al., 2016). Because the grid of calibration spectra is not yet complete and published, for this work we use the first post-Gaia-launch internally released version222Kindly provided by E. Pancino and the SPSS DPAC team., which was also used to calibrate the Gaia DR2 photometric data by Evans et al. (2018). More information on the SPSS can be found in the Gaia DR2 online documentation, Chapter 5: Photometry. The SPSS cover the magnitude range from about nine to 15. It contains calibration sources of spectral types O to K, including many white dwarfs. Additionally, the SPSS include several calibration sources of spectral type M1V and M2V, thus providing good means for an improved calibration for very red sources.
We only consider sources from these libraries that are not marked as variable in either the Simbad data base or the HIPPARCOS catalogue. For NGSL we exclude also stars for which no slit throughput correction could be applied. For the comparison with Gaia DR2 photometry we introduce a lower limit in magnitude. As reported by Evans et al. (2018), bright sources are affected by saturation effects. To exclude such effects from affecting the determination of the passbands, we restrict our calibration sources to magnitudes larger than 5.9. For brighter objects strong systematic effects in residuals due to saturation are detectible. For and , the dispersion of Gaia observations allows for the observation of brighter objects without notable saturation effects, and we chose a lower magnitude limit of 5.0. A slightly lower limit may still be possible, but to rule out saturation effects even for sources with extreme colours, we chose the conservative limit of 5.0.
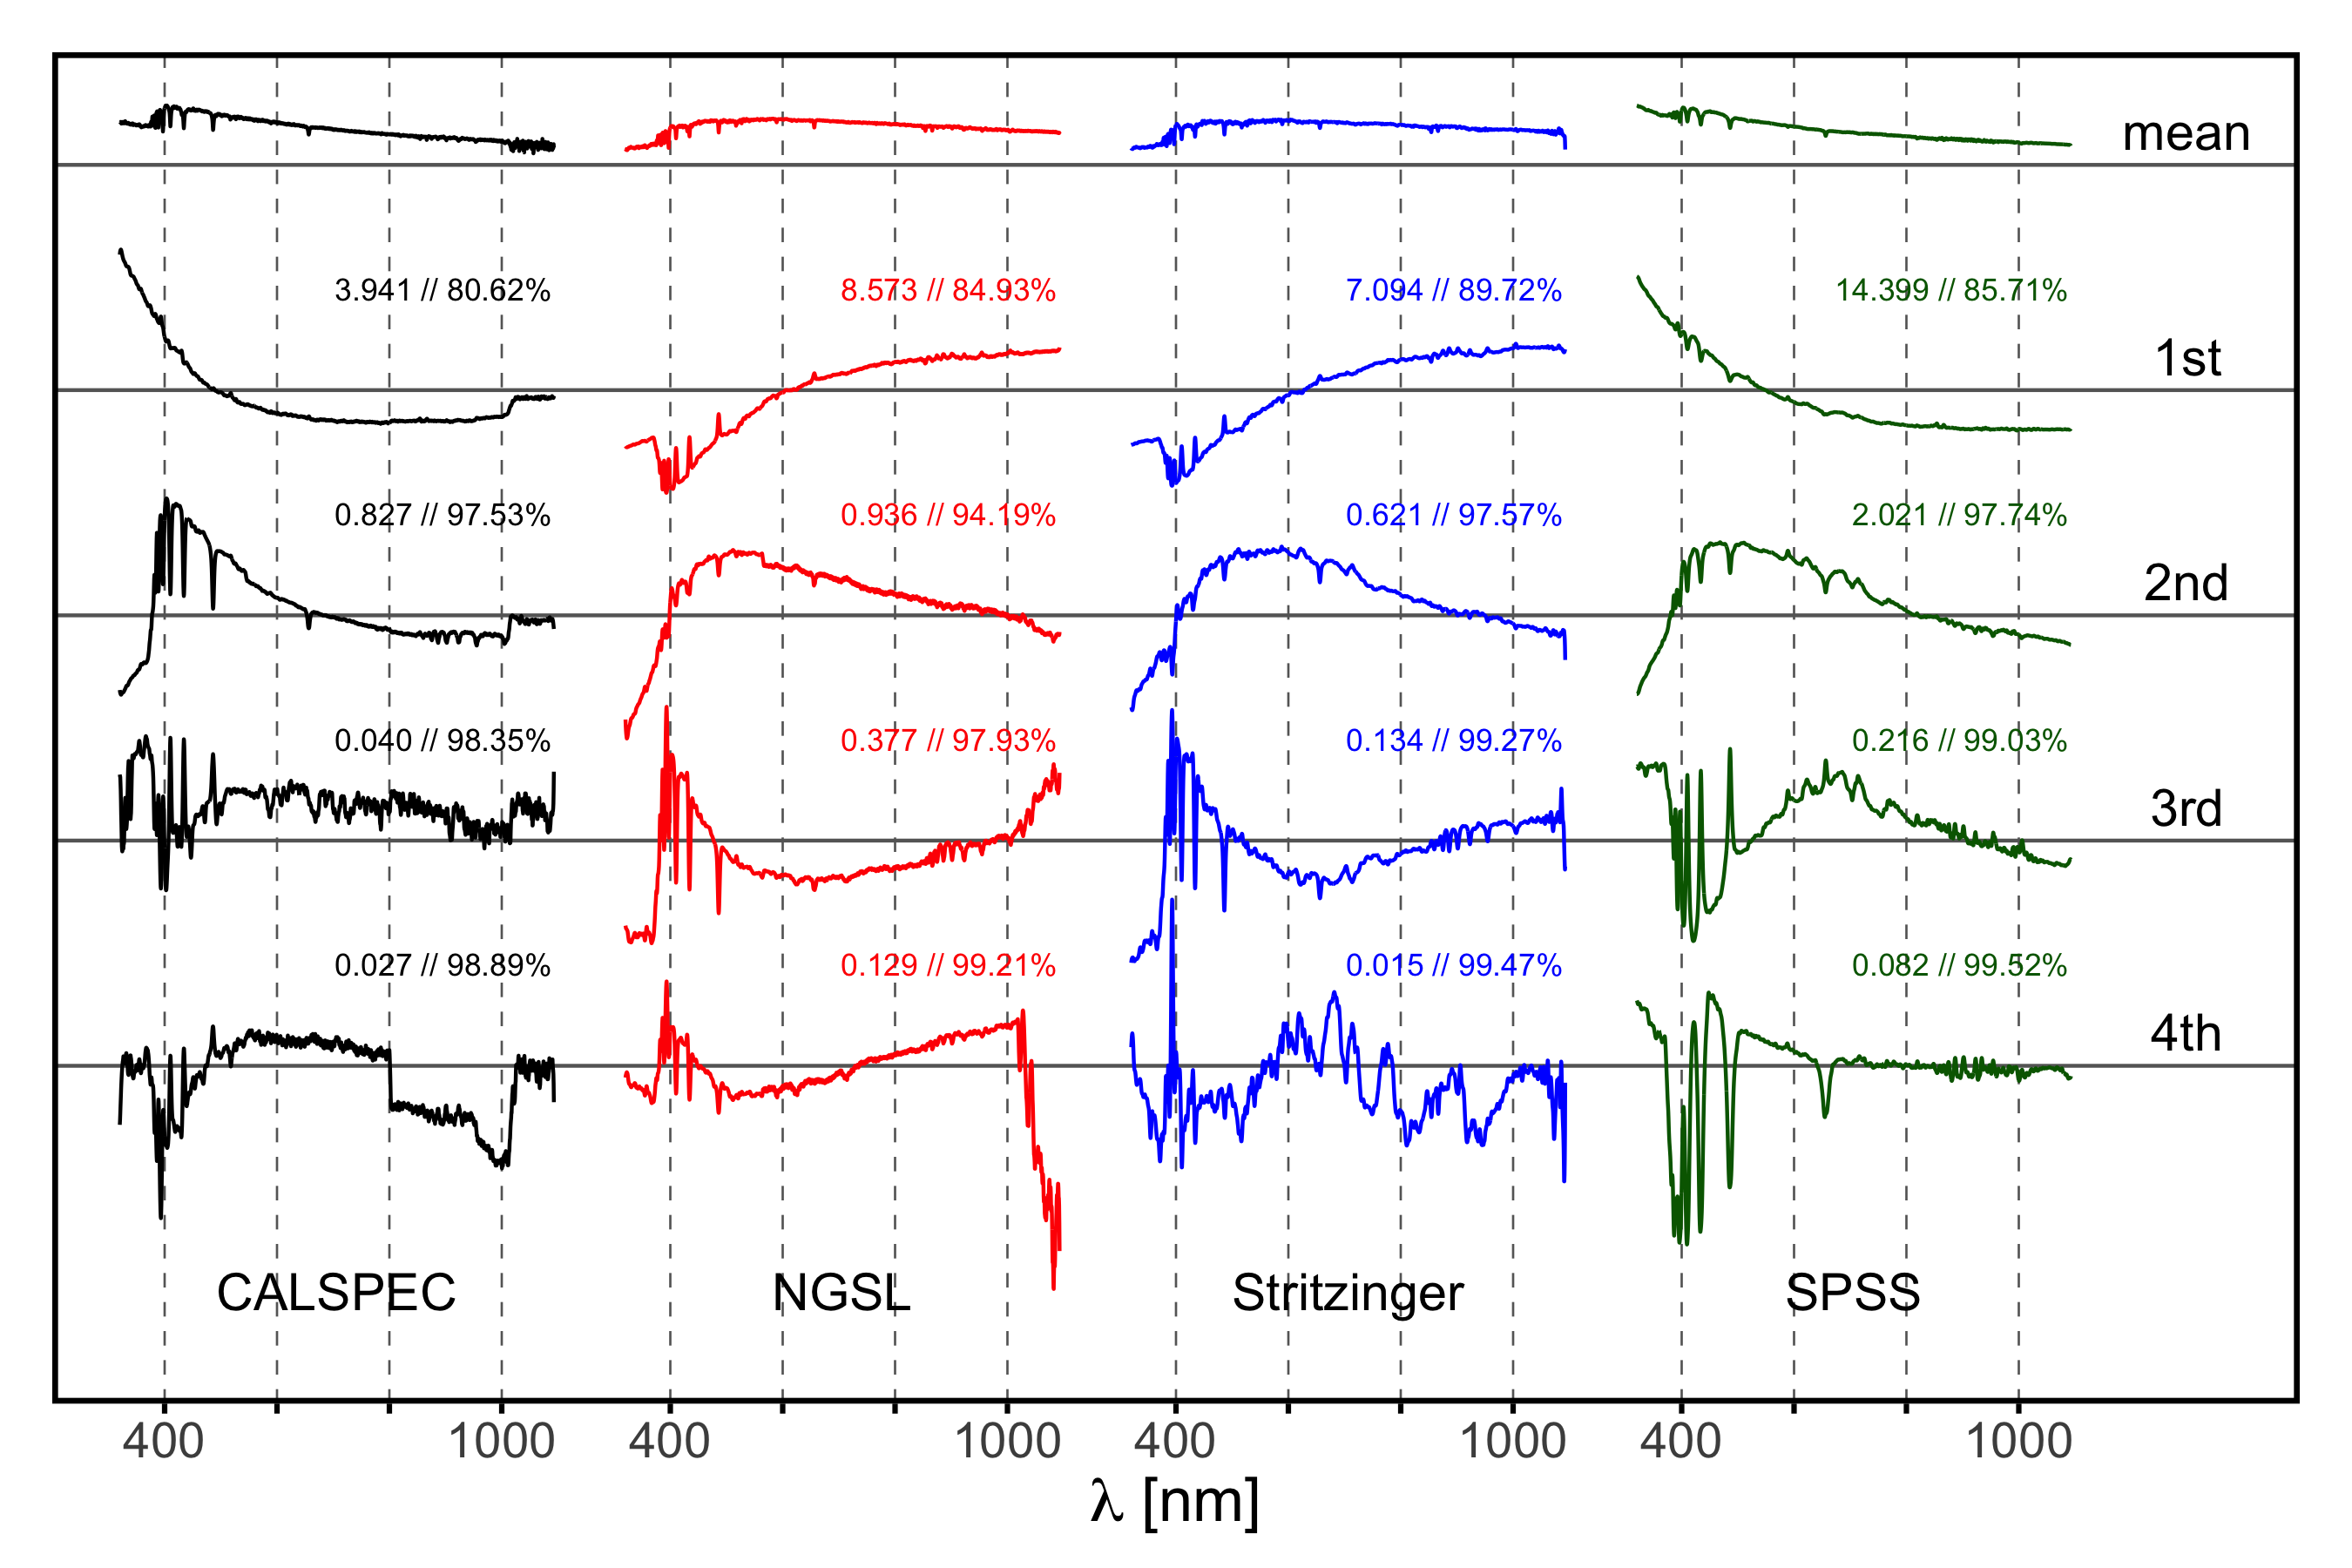
The selected stars were crossmatched with the Gaia DR2, resulting in a set of 45 CALSPEC sources, 210 NGSL sources, 72 Stritzinger sources, and 92 SPSS. Functional principal component analysis was then applied to each of these four sets of spectra independently to construct four sets of basis functions , analogous to Weiler et al. (2018). The mean function and the first four functional principal components are shown in Fig. 1 for the four data sets for illustration. The principal components are normalised with respect to the -norm, and the corresponding eigenvalues, displayed in Fig. 1, describe the weight each component has in describing the entire data set. Figure 1 also includes the cumulative fraction of variance explained (FVE), indicating the rather low dimensionality of the data set. With a linear combination of four principal components, a 99%-level in the capture of the variance of the spectral data sets is achieved.
The principal components show typical features of stellar spectra. However, they do not have any physical meaning in themselves, but rather provide a compact empirical description of the set of stellar spectra used to generate them. They thus depend on the underlying set of stellar spectra, which is different for the different spectral libraries, resulting in different functions. There are also features visible in the principal components that are most likely not of astrophysical origin, such as abrupt ”jumps” with wavelength in some of the principal components. Prominent features of this kind can be seen in the fourth principal component of the CALSPEC set, which shows a clear displacement between about 801.5 nm and 1015.5 nm, and a less prominent one at 565 nm in the second principal component of the NGSL set. These discontinuities result from combining spectra on different wavelength intervals into a single one. In the CALSPEC set, the discontinuity at 801.5 nm results from a single spectrum, for which the combination of spectral data on two wavelength intervals results in a strong abrupt change in the noise level. This change results in an artefact in the fourth principal component. The broader feature at around 1015 nm in the CALSPEC data set is also an artefact from the combination of different data to a single spectrum, but the combination occurs for many spectra and at slightly different wavelengths. As a consequence this artefact in the functional principal components is less localised in wavelength. The discontinuity in the second principal component for the NGSL data set is caused by a small discontinuity when combining spectra obtained with two different gratings to a single one. This effect is in fact very small in any individual spectrum, but it occurs systematically and is therefore already included in the second principal component. Although the discontinuities in the principal components have little impact on the SPD of any particular source, as the projection of the SPD onto these principal components is small, the projection of the passband onto these principal components may not be small. The artefacts may therefore become amplified and result in unphysical parallel components . These features do not pose difficulties in the estimation of the passband , as their effect can easily be compensated for by a suitable choice of the orthogonal component . The separation into parallel and orthogonal component, however, may become flawed. We therefore seek to avoid discontinuities in the passband determination. The SPSS data set is free from such effects, and together with the wide coverage in different spectral types, we consider the SPSS set of calibration sources the most suitable for the determination of the shape of the Gaia passbands. We therefore do not combine the different spectral libraries, but rather use the SPSS library as the ”default” set of calibration sources in the passband determination, and validate the results obtained with this data set by ensuring that the synthetic magnitudes for the remaining three sets of calibration sources are in good agreement with the observed magnitudes as well.
3.2 Empirical and theoretical spectral libraries
As a set of empirical spectra representative of different spectral types, we use the Pickles (1998) library of stellar spectra. This library includes SEDs for all spectral types from O5 to M10, and for luminosity classes I to V, which were derived from observational spectra. Different metallicities are also included for certain spectral types. Pickles (1998) presents two sets of SEDs, covering the spectral ranges from 115 nm to 1062 nm (the UVILIB library) and from 115 nm to 2.5 m (the UVKLIB library). In this work, we use both.
As a second set of spectra, we make use of the BaSeL 3.1 WLBC99 library of stellar spectra (Westera et al., 2002). This library provides theoretical spectra on a wide grid of effective temperatures, surface gravities, and metallicities. We refer to the colour-colour relations of both the empirical library by Pickles (1998) and the theoretical BaSeL library as the synthetic colour-colour relations. For the optimisation of the passbands, we only use the Pickles (1998) spectra in order to avoid an optimisation of the passbands with respect to any particular astrophysical parameters in the BaSeL library. The BaSeL spectra are rather considered as a test case for the result obtained with the Pickles spectra.
3.3 Gaia DR2 data
In order to compare synthetic colour-colour relationships with observational ones, we select a set of Gaia DR2 photometric observations. Several issues in the Gaia DR2 photometry that could affect the passband determination have been reported by Evans et al. (2018) and Arenou et al. (2018). When selecting Gaia DR2 observations for our passband determinations, we avoid these issues by applying filters in sky region and in magnitude. To reduce effects caused by crowding, we exclude the region around the galactic plane within 30∘ galactic latitude. To minimise effects introduced by inaccurate background correction in the Gaia DR2 calibration, we restrict the data set to relatively bright sources, with and magnitudes less than 17. To exclude the effects of saturation, as mentioned in Sect. 3.1, we furthermore introduce a lower magnitude limit of six in and five in and . Furthermore, we only include sources for which at least ten photometric observations in each band entered in the computation of the Gaia DR2 mean photometry.
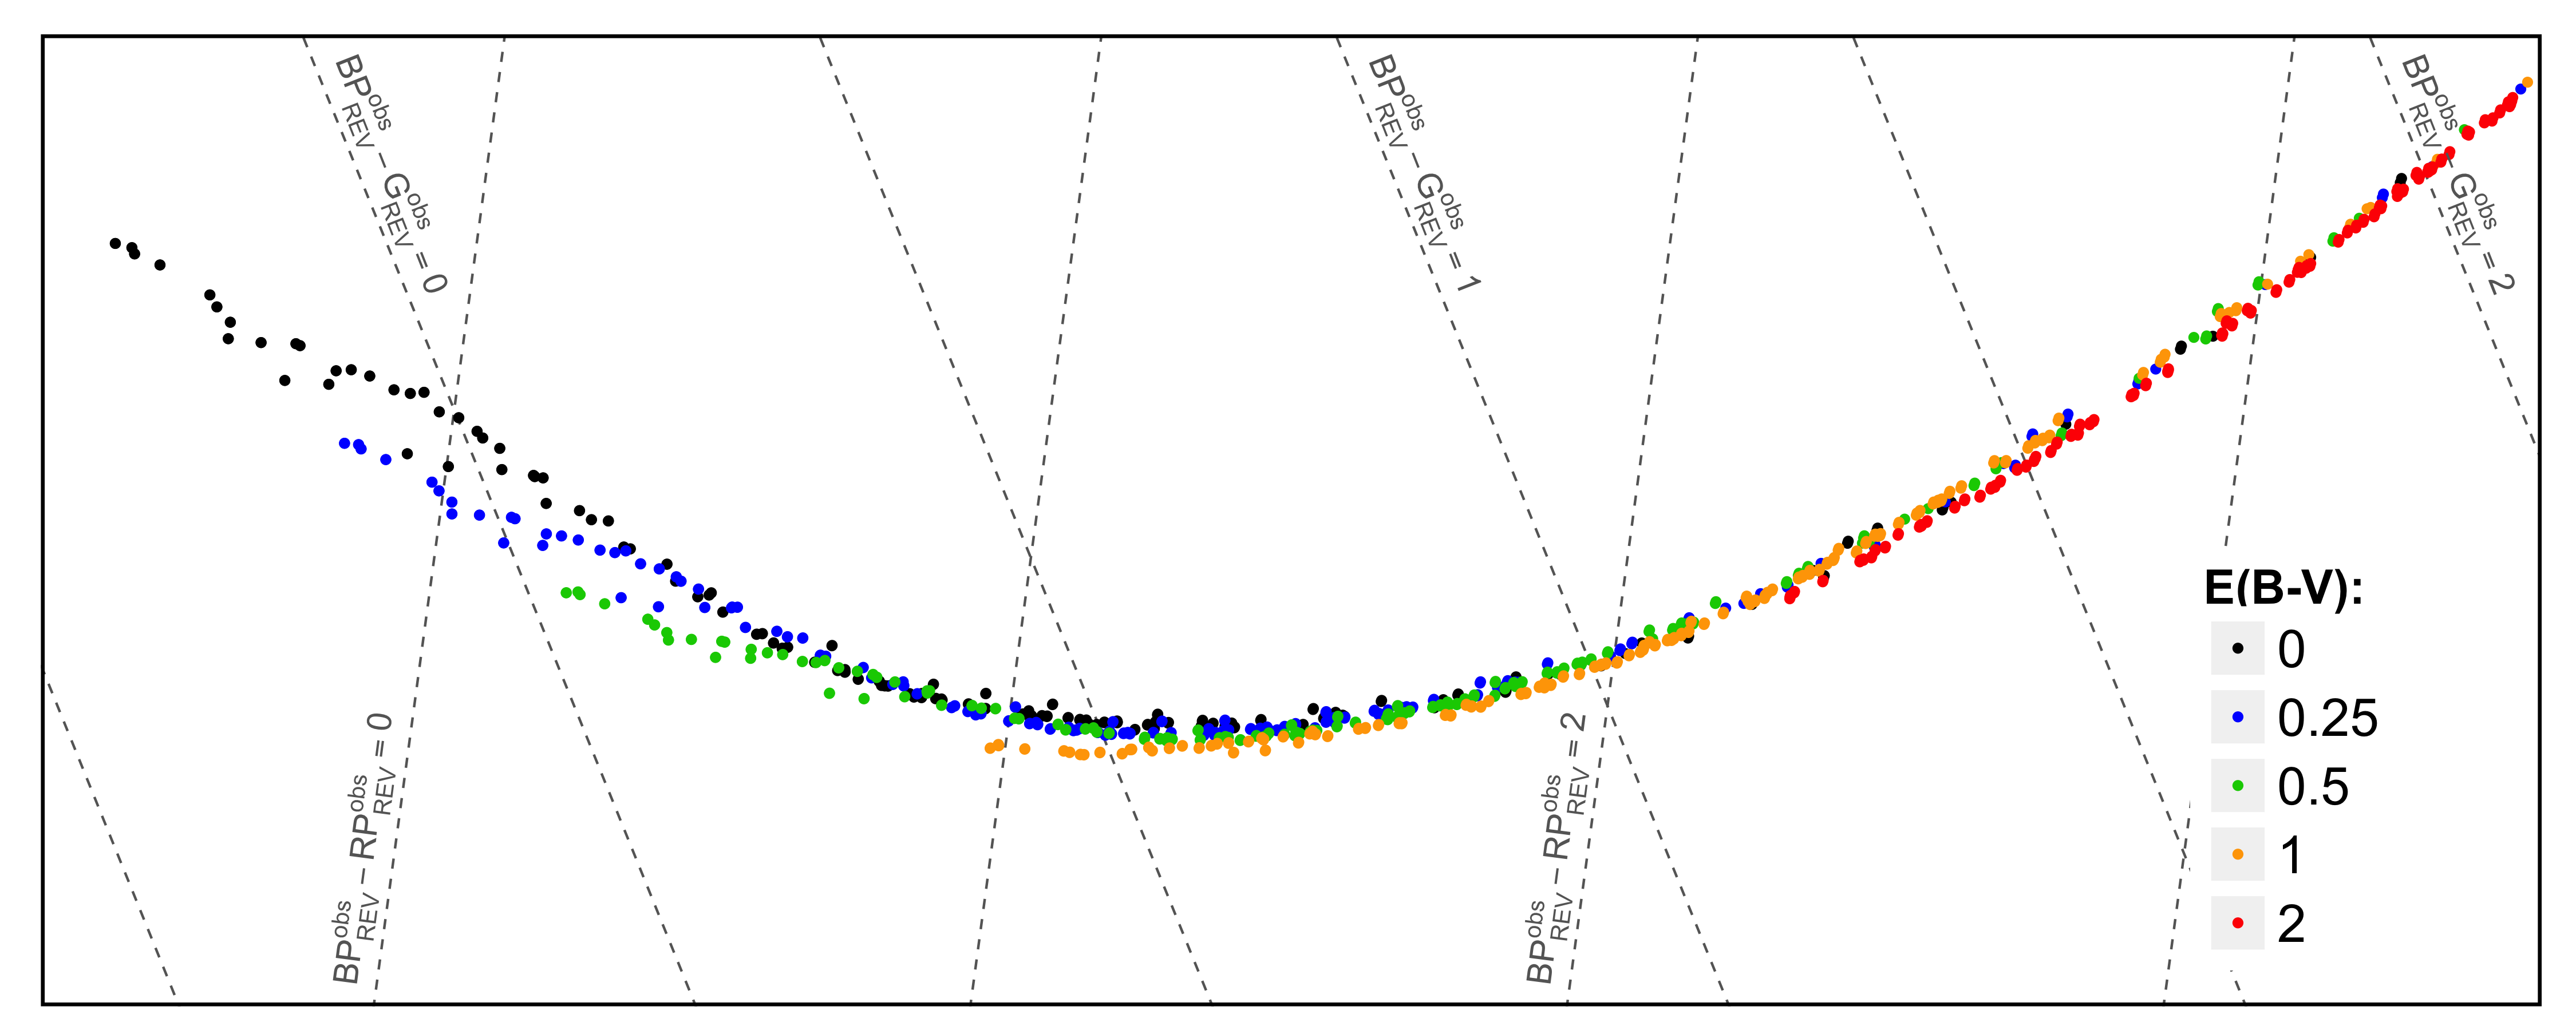
Excluding the galactic plane from our Gaia DR2 data set also avoids sources whose SPDs are extremely reddened by interstellar extinction. In order to estimate the influence of interstellar extinction on the colour-colour relations used in this work, we applied the extinction law by Cardelli et al. (1989) to the Pickles spectra, and computed the colour-colour relations resulting for different colour excesses in the regions of the colour-colour diagrams studied in this work. The results are shown in Fig. 2. For the versus case, stars follow a relatively narrow path running close to diagonal through the diagram. To avoid an inconveniently large figure with many white areas, we therefore rotate the diagram by 30∘ for a more convenient fit of the path within a rectangular plotting region. The main effect of extinction is a shift along the path of the un-reddened spectra in the colour-colour diagram, with only small displacements away from this path. The conclusions in this work drawn from comparisons between synthetic and observational colour-colour relations will therefore not be influenced by interstellar reddening.
4 G passband
4.1 Determination of the passband
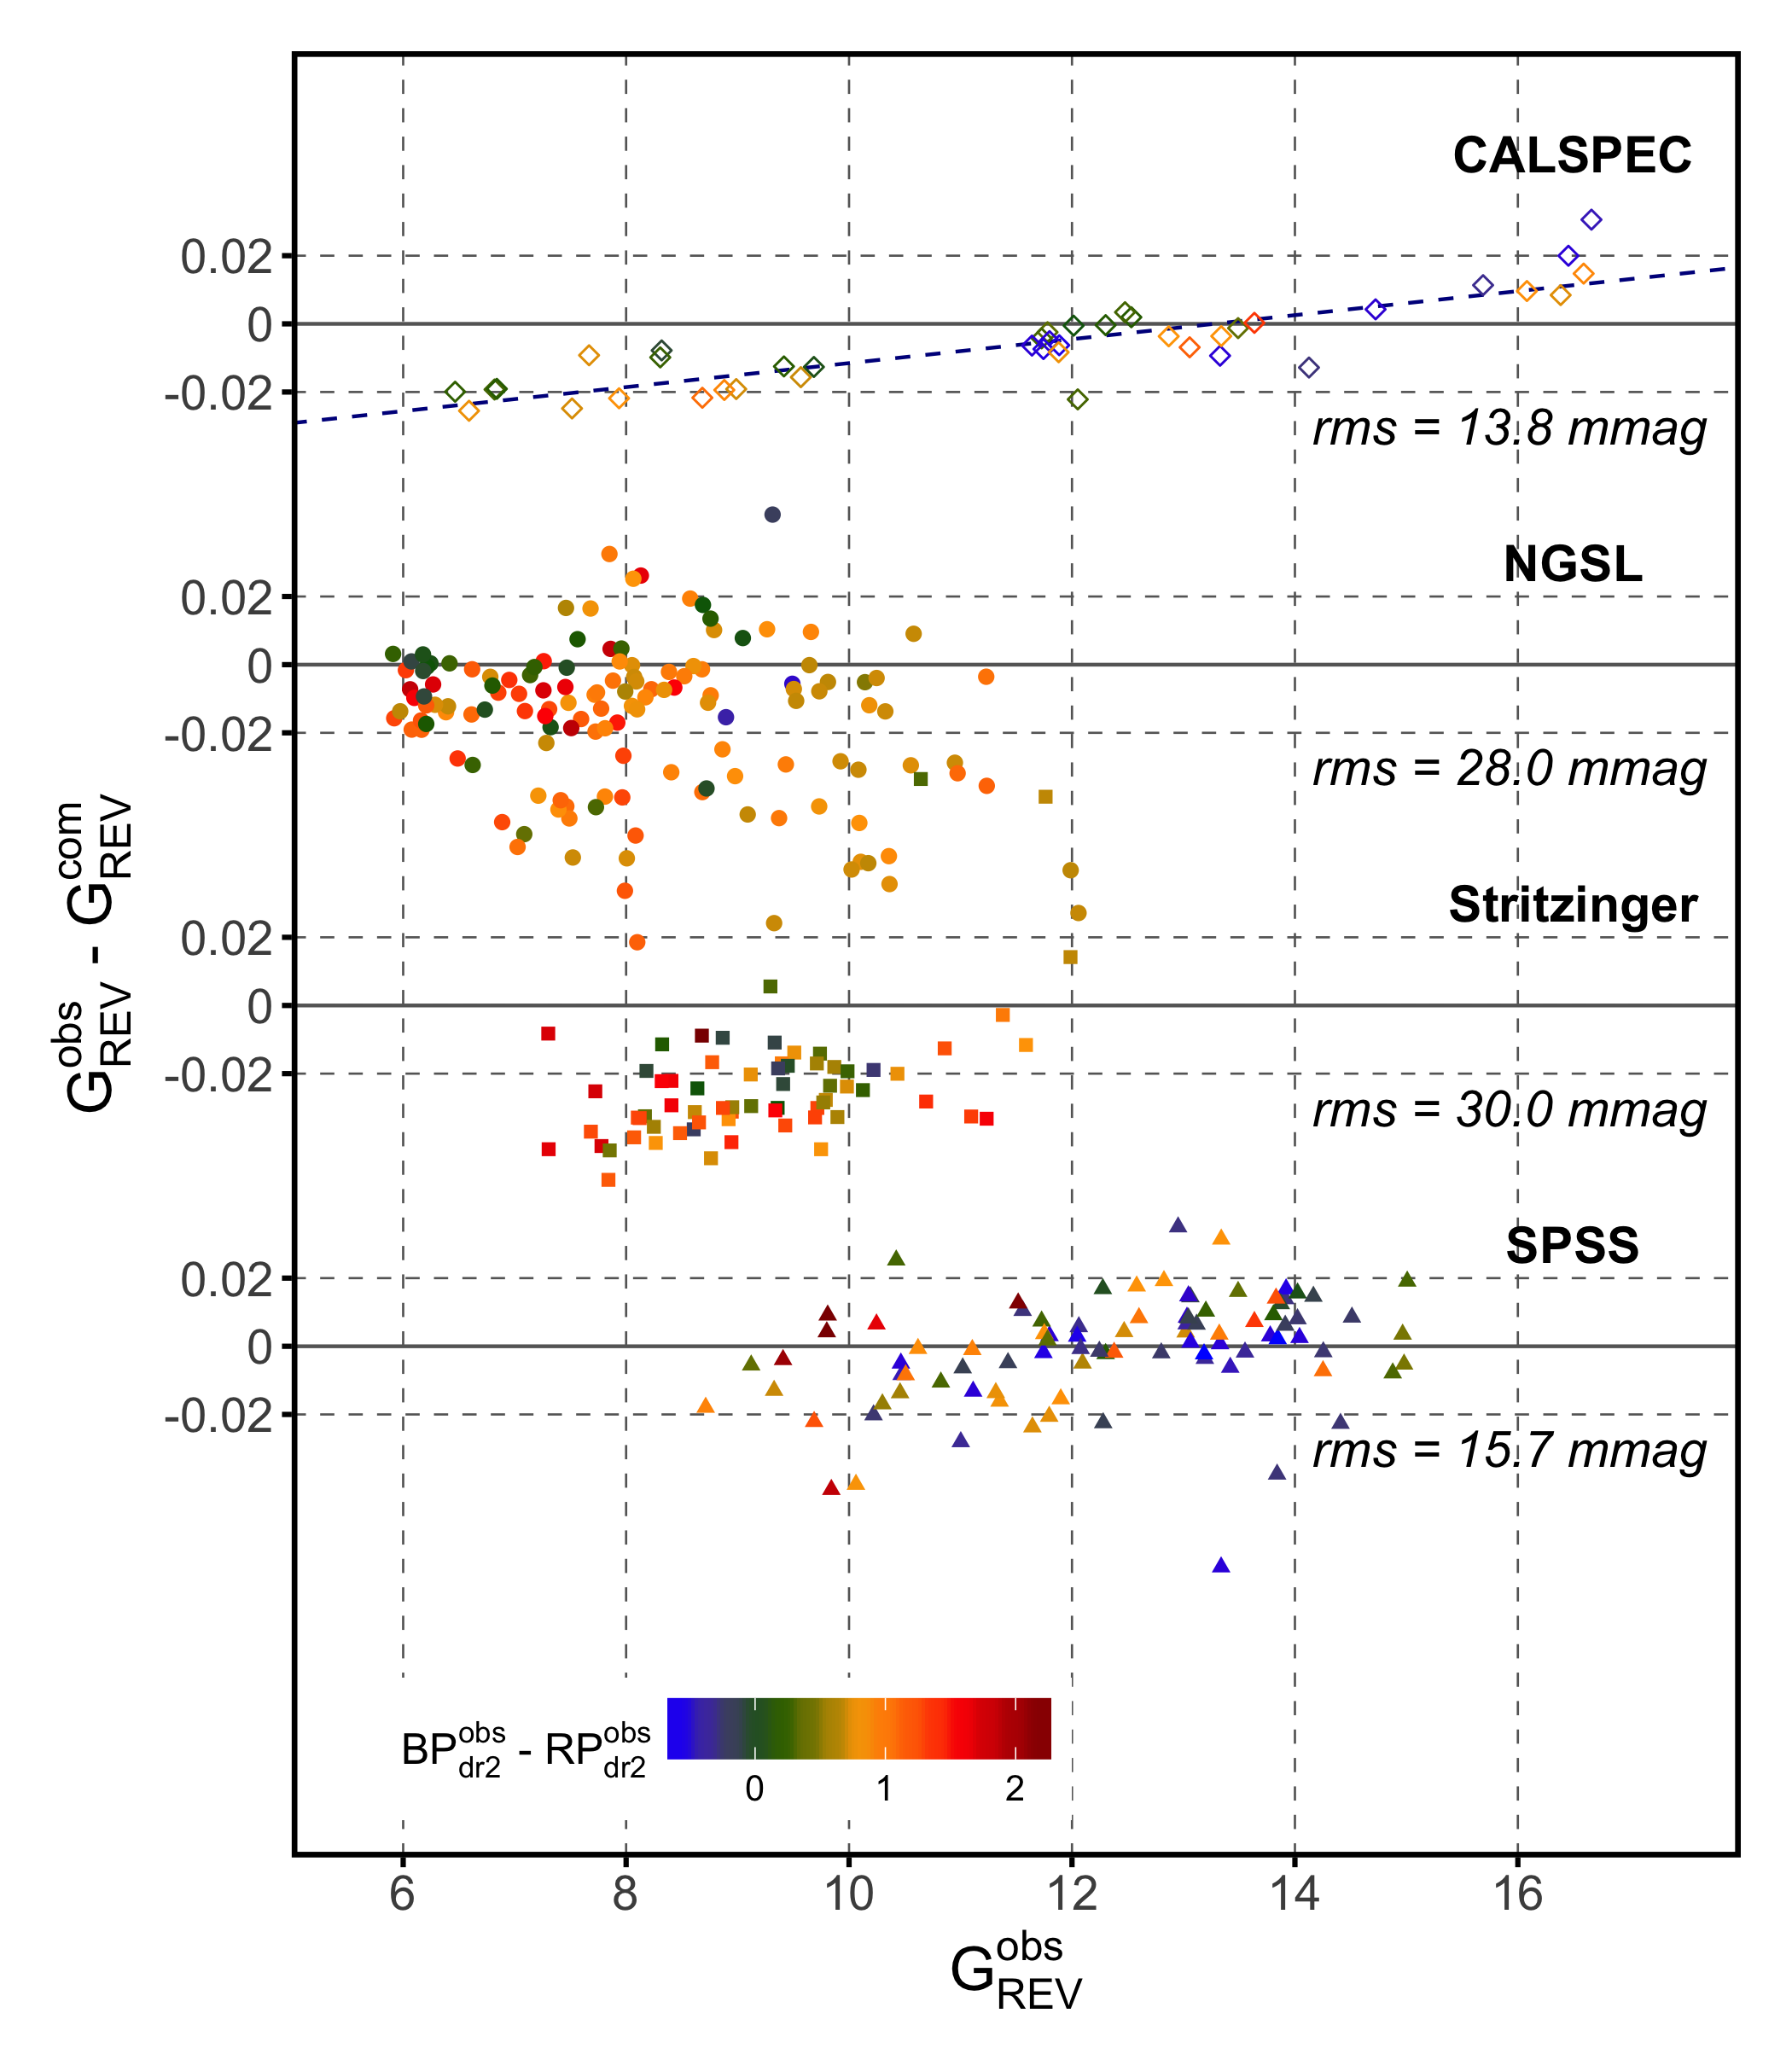
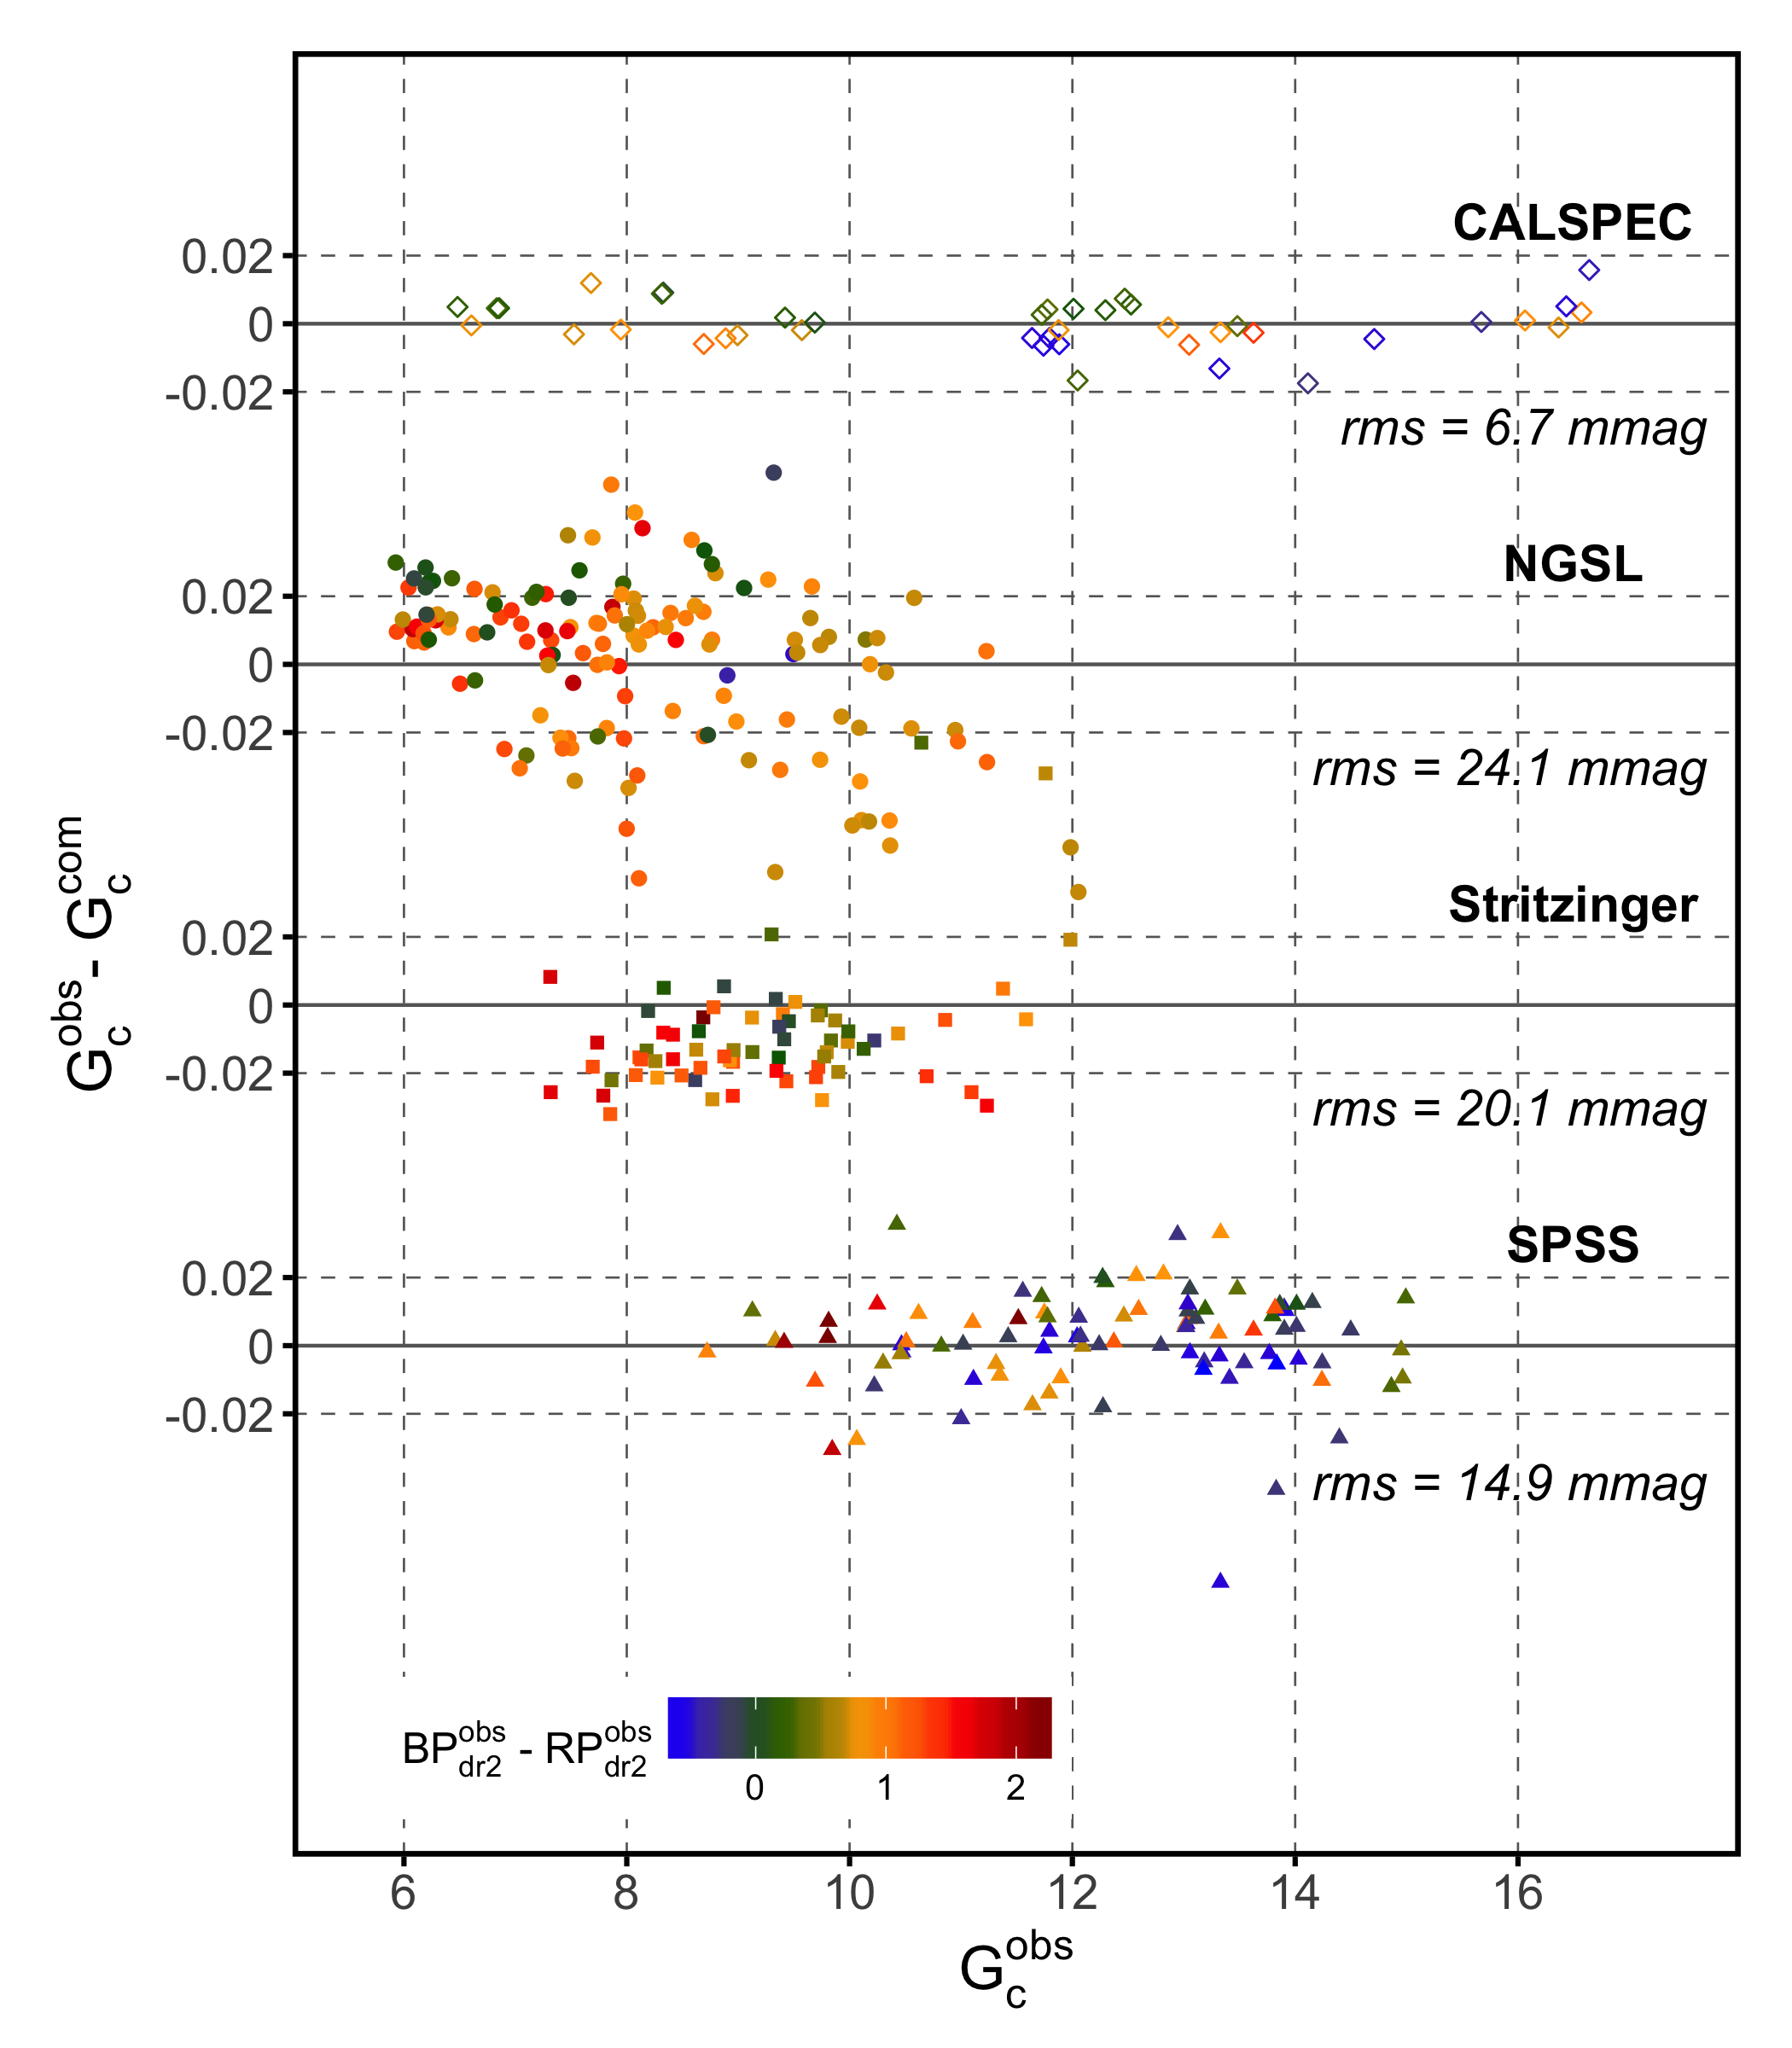
Using the passbands from Evans et al. (2018), one obtains the residuals for the four spectral libraries shown in Fig. 3, left panel, plotted versus magnitude. The colour of the sources is indicated by the colour coding. This plot differs from the corresponding plot in Evans et al. (2018) only because of the different criteria in the selection of sources that enter into the plot, and it is repeated here for easy direct comparison. The root mean square (rms) values of the residuals for the four different sets of spectra are included in the figure. The dominant feature in the residuals is a magnitude dependency, which is most clearly visible for the CALSPEC data set, as it has a low random noise and covers the widest range of magnitudes. A systematic trend in CALSPEC residuals with magnitude has already been mentioned by Evans et al. (2018), and Arenou et al. (2018) reported a trend in the residuals with magnitude in the order of a few milli-magnitudes per magnitude. We thus confirm this trend within a range of magnitudes between about six and 17. Using the CALSPEC data set, we find it well approximated with a colour-independent linear correction of mmag/magnitude, with an uncertainty of about 0.3 mmag/magnitude. As the correction is on the level of a few tens of a milli-magnitude, a linear correction in magnitude and a linear correction in flux is virtually equivalent, and we choose a correction in magnitude for its more convenient formulation in magnitude systems. An approximately linear drift in the photometric system with magnitude was already reported for the Gaia Data Release 1 (Weiler et al., 2018) and the reason for this remains unclear for the time being.
The drift in the magnitude may affect the determination of the passband, even if independent from the colour, as the calibration sources have a non-uniform distribution of colours with apparent magnitude, the red sources being in tendency brighter than the blue sources. We therefore correct the photometry by introducing a linear correction term in magnitude before determining the passband, that is, we assume a relationship of
| (13) |
between , the observed counts in the passband (in electrons per second within the Gaia aperture), and the magnitude. The factor of 0.9965 compensates for a linear tendency in magnitude corresponding to a fading of mmag per magnitude and denotes the zero-point of the passband, derived as described in Sect. 2.3. For synthetic photometry in the band, the factor 0.9965 is not required, as only the observational magnitudes have to be corrected for the observed trend.
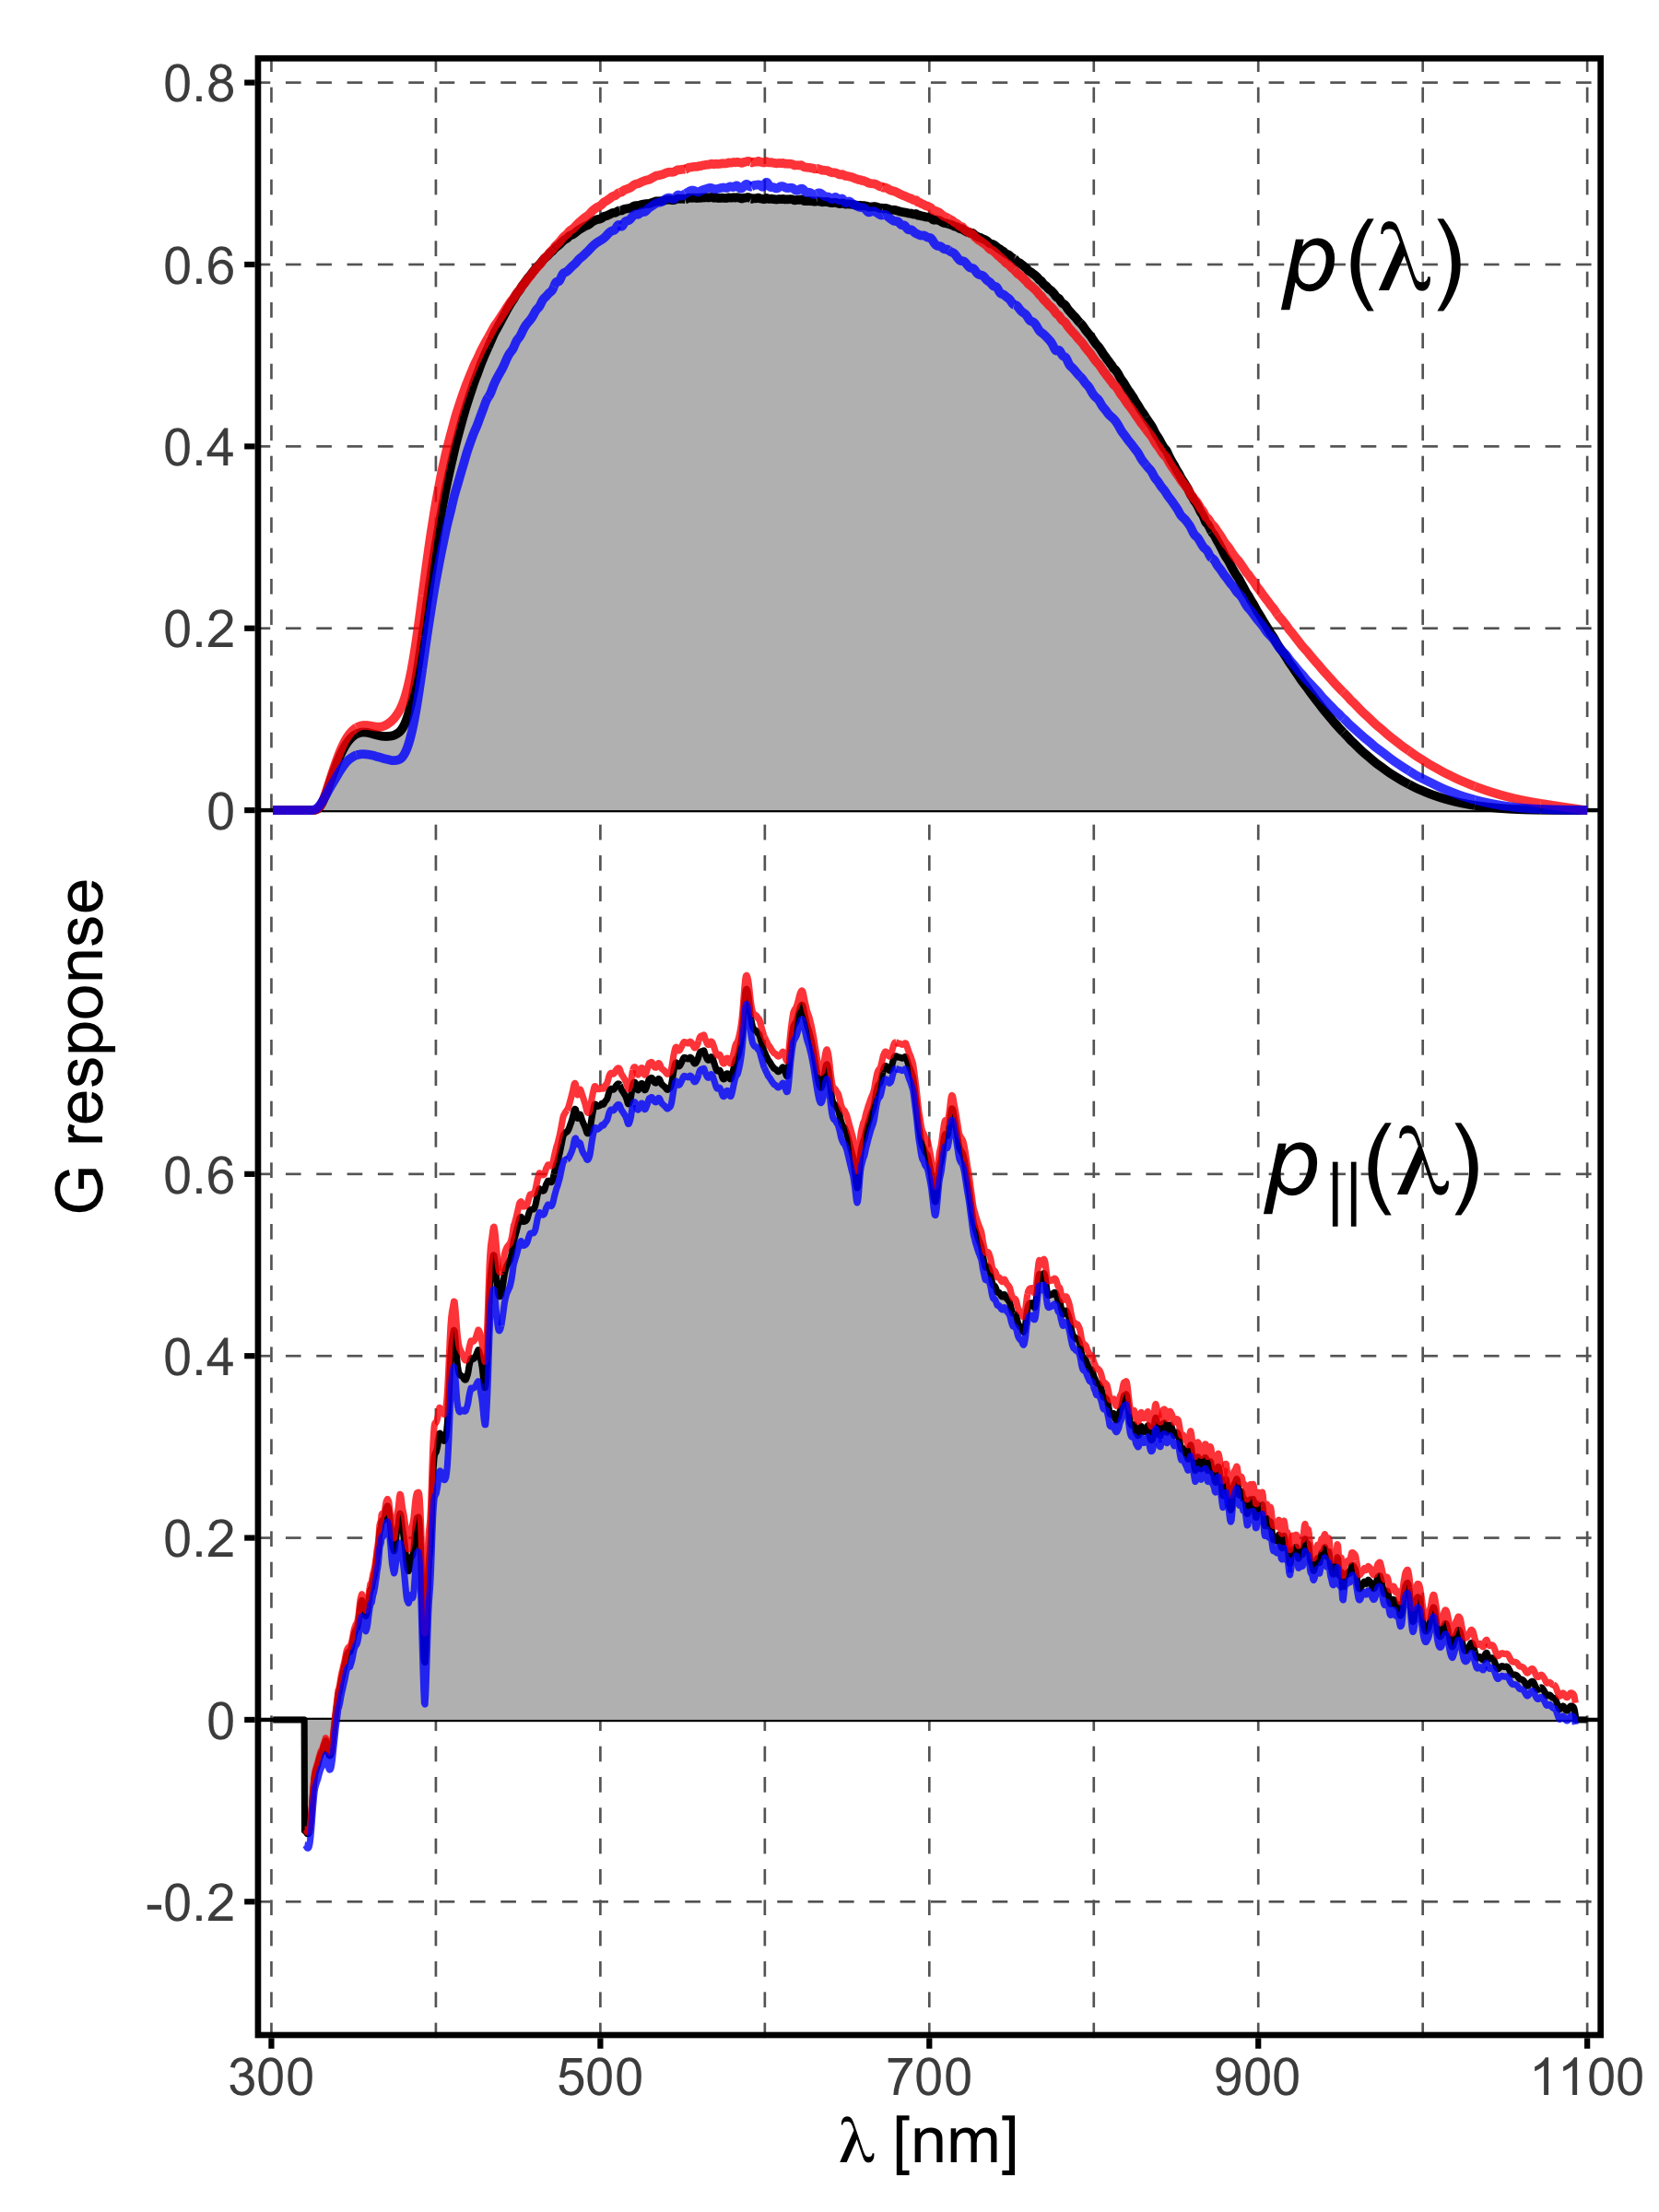
For the determination of we use the SPSS data set with basis functions. We solve Eq. (3) to obtain , and then estimate the full passband as outlined in Sect. 2.1. As the initial guess, we use the passband by Jordi et al. (2010). The residuals obtained with the passband solution derived in this work are shown in Fig. 3, right panel, together with the rms values of the residuals. The passband solution of this work is shown in Fig. 4, with the sum of the parallel and orthogonal component in the upper panel and the parallel component in the lower panel. Table 1 includes the passband parameters such as the zero points in the VEGAMAG and AB system, the mean and pivot wavelength, and the -norms of the parallel and orthogonal component. The passband derived in this work is tabulated in Table 2, separated into its parallel and orthogonal components.
4.2 Comparison with other results
The passband obtained in this work is similar to the one derived by Evans et al. (2018) and presented by Jordi et al. (2010), which is also presented in Fig. 4 for comparison. The solution of this work is slightly steeper at long wavelengths and flatter at intermediate wavelengths. Comparing the parallel component, the result of this work is again similar to the passbands by Evans et al. (2018) and Jordi et al. (2010). Given the uncertainties estimated from the residuals, all three passband solutions are essentially equivalent. We thus find the passband in close agreement with the pre-launch expectation and the solution presented by Evans et al. (2018). This is in contrast to the results for the Gaia Data Release 1, where significant deviations from the pre-launch expectation were reported by Maíz Apellániz (2017) and Weiler et al. (2018). The deviations from the pre-launch expectation was explained by the effect of contamination of optical surfaces in the Gaia instruments present in the early stages of data collection. The current result may therefore be an indicator of reduced contamination and of an improvement in the instrumental calibration. The major effect for the passband achieved in this work results from the linear correction of the tendency observed in magnitudes. The correction results in a reduction of the rms of the residuals for all four sets of spectra considered. As the improvement is achieved by correcting a systematic effect, the change in rms, however, depends on the sources considered, and the quantitative improvement cannot be generalised.
5 BP passband
5.1 Determination of the passband
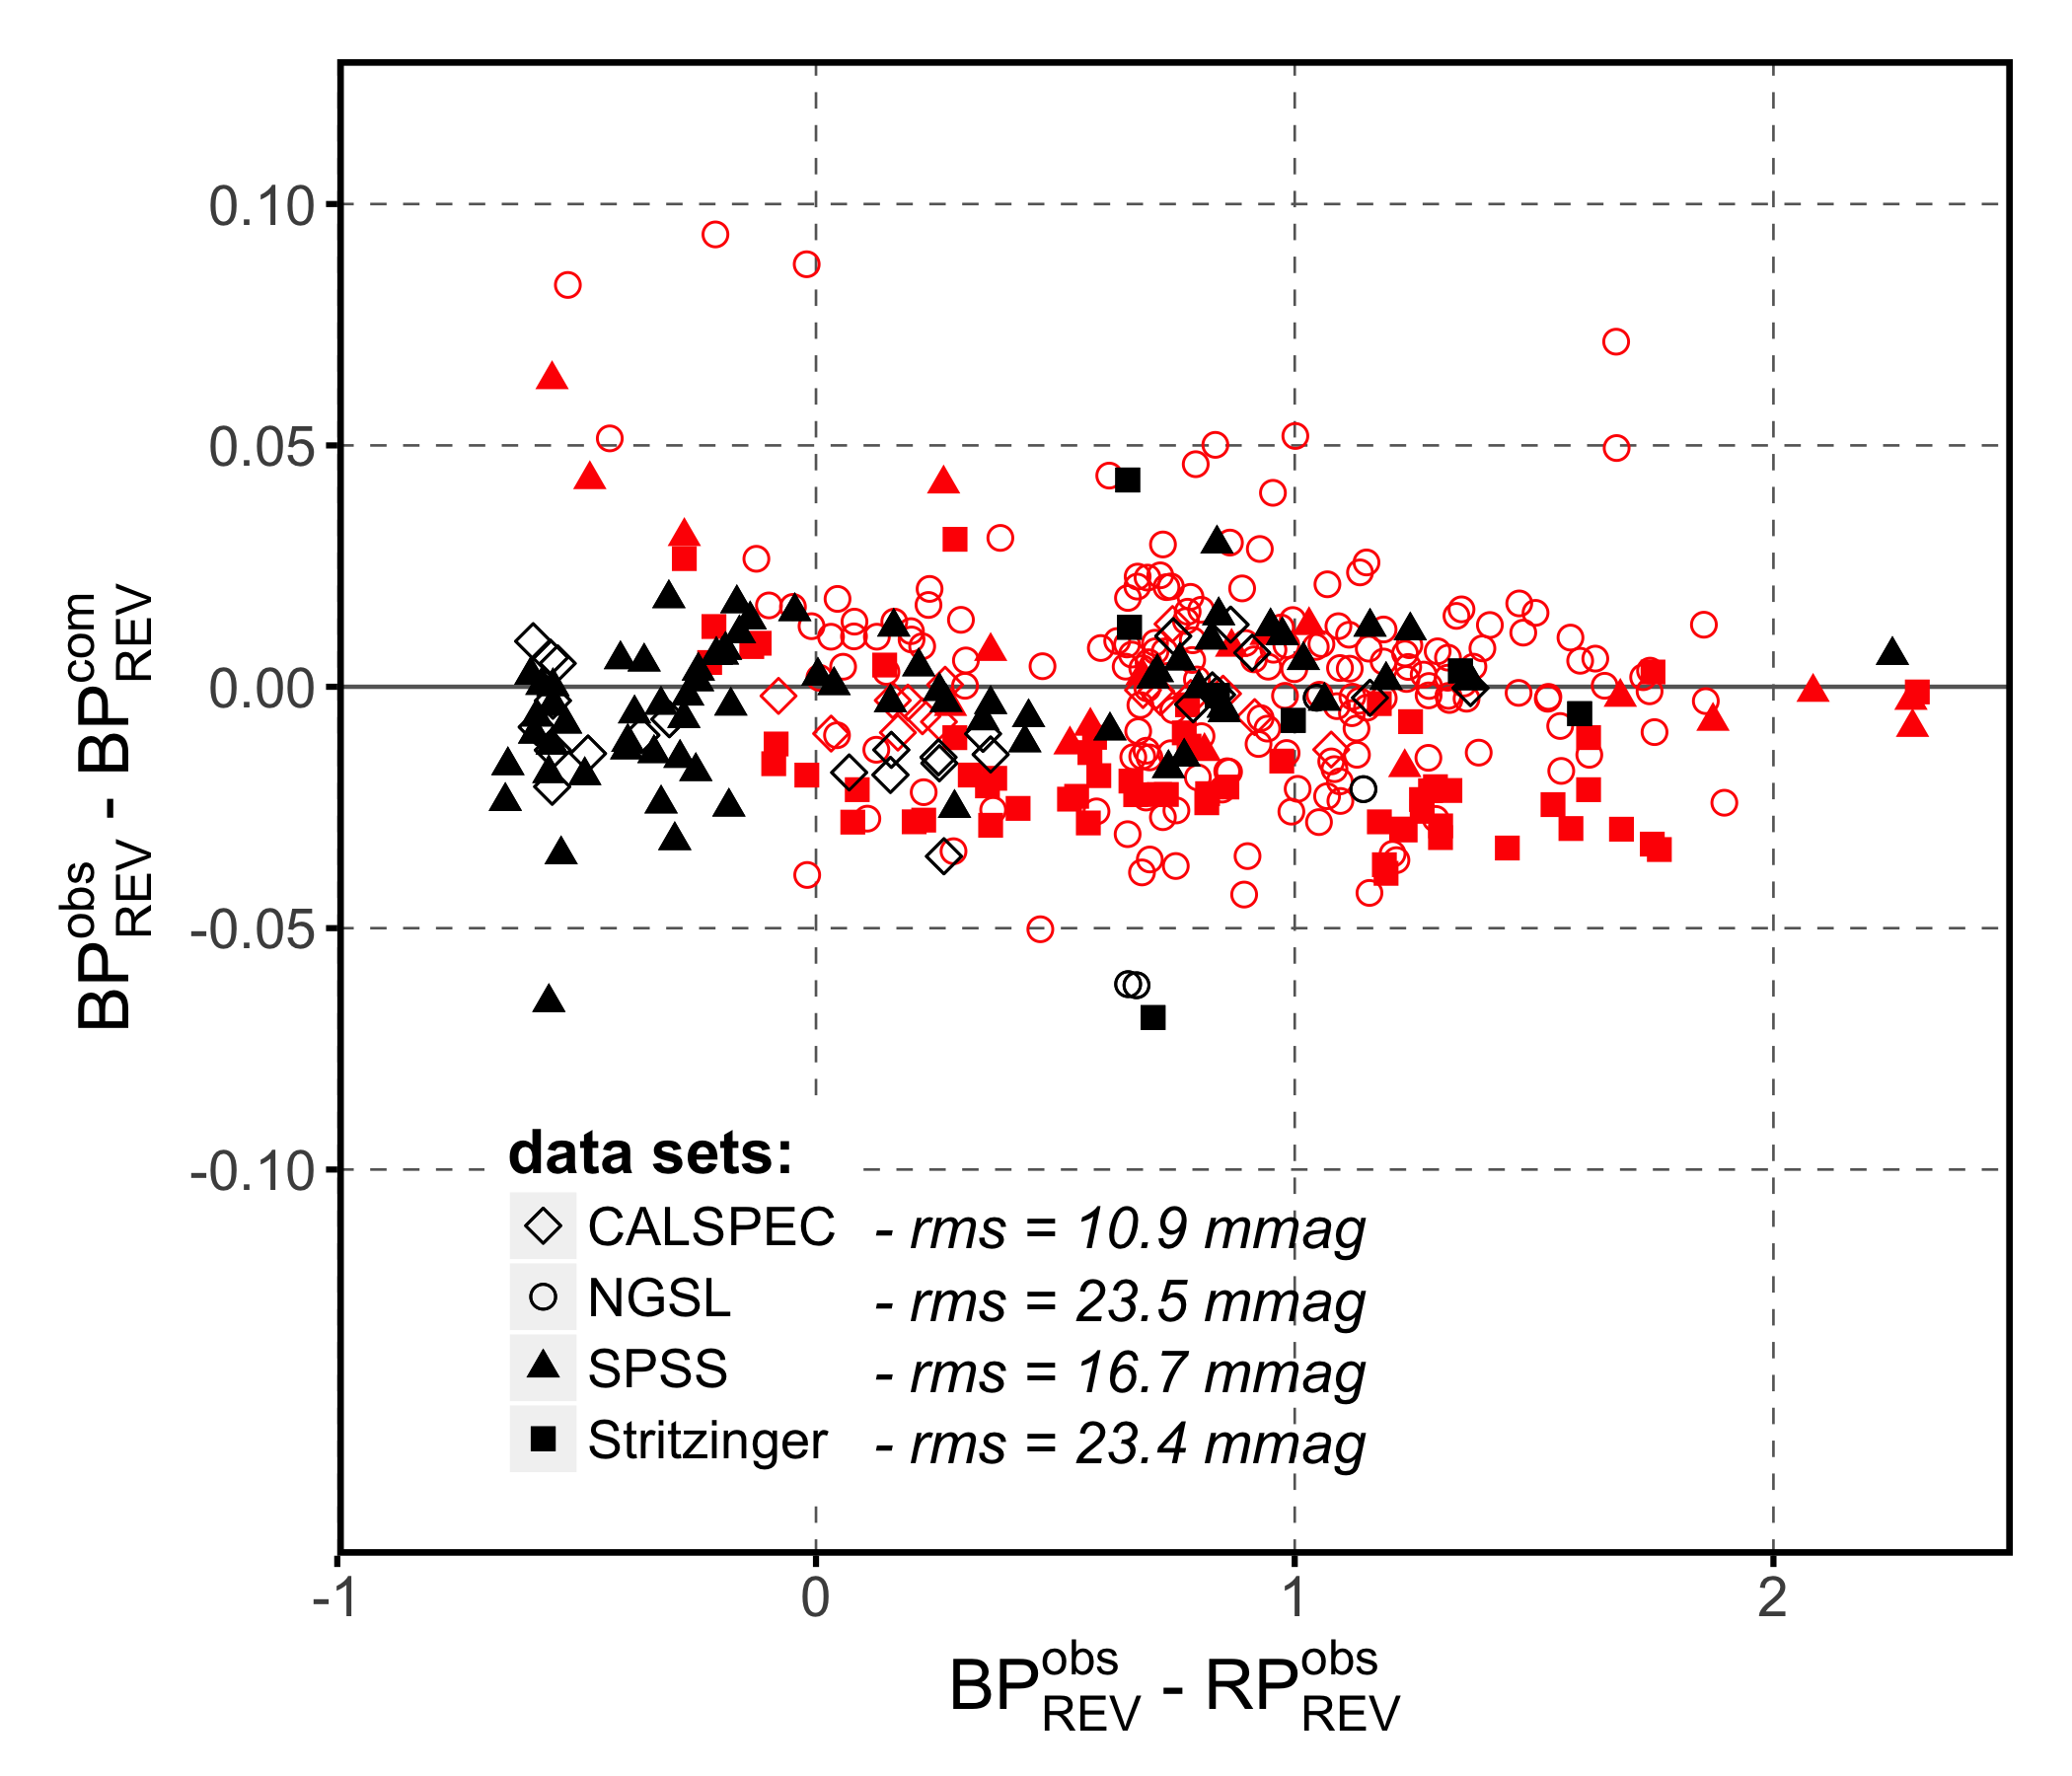
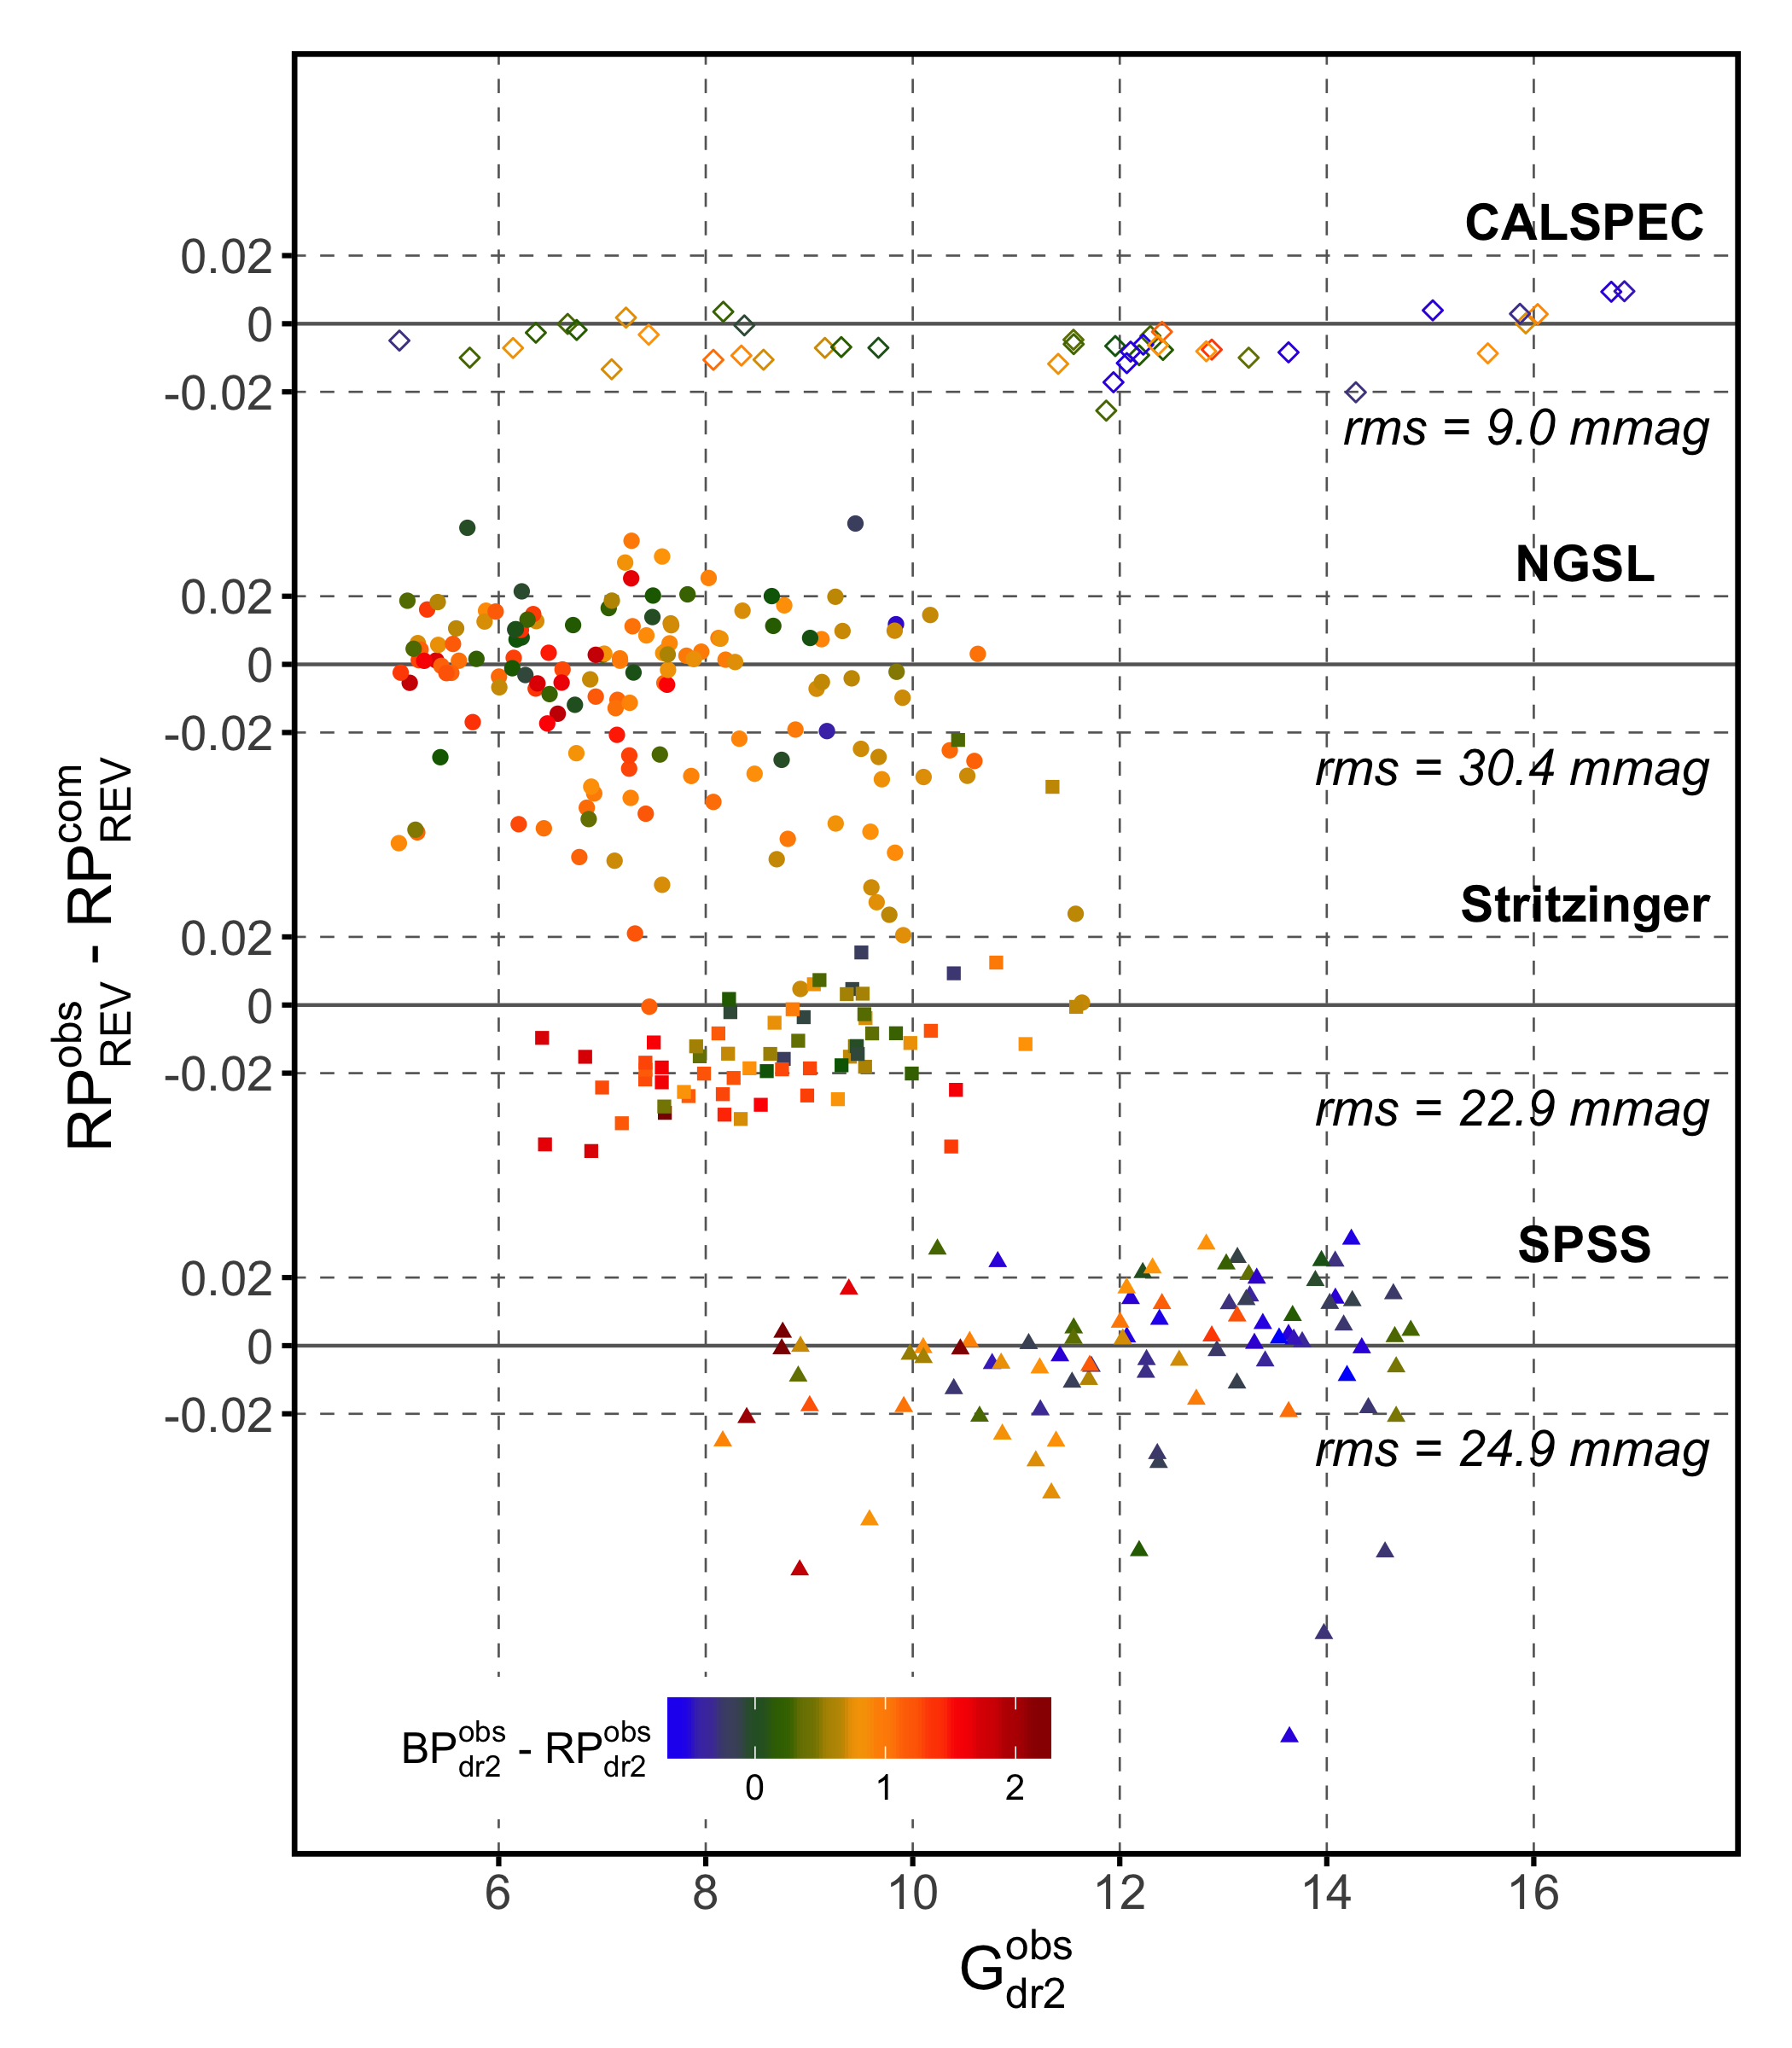
The residuals for the passband resulting from the use of the REV passband by Evans et al. (2018) are shown in the left panel of Fig. 5. The residuals are plotted versus BP – RP colour and grouped into two sets by magnitude. Sources fainter than 10.99 mag and brighter than 10.99 mag are plotted in different colours. A colour-dependent systematic behaviour in the residuals can be spotted, with blue sources brighter than 10.99 mag in band systematically rising upwards, while the residuals for the fainter sources slightly decreasing with decreasing BP – RP colour index. This separation, visible from a BP – RP colour of about zero downwards, is consistent with all four sets of calibration sources used in this work. For the CALSPEC data set, all sources in the colour range of BP – RP less than zero belong to the faint group, and their residuals all belong to the lower group. For the NGSL and Stritzinger sets, all sources in the blue part belong to the bright group, and all their residuals show the increasing tendency with decreasing colour index. For the SPSS, most sources in the blue range belong to the faint magnitude range, and the corresponding residuals fall within the lower group. Three of the SPSS with BP – RP, however, belong to the bright group with ¡ 10.99, and their residuals also follow the increasing trend. The precise location of the magnitude break cannot be determined within this work. For the calibration spectra available, the optimal separation occurs within the range of 10.47 and 10.99 in . Depending on whether we admit an ”outlier” from the bright or faint magnitude regime, even larger or smaller values are possible. Here, we adopt the value of = 10.99 as an estimate for the point of separation between the two regimes.
The observed behaviour can be explained by the sources fainter than 10.99 in not being in the same photometric system as the brighter sources. This inconsistency mostly affects very blue sources with a BP – RP colour index less than zero. Such an inconsistency may result from sources observed under specific instrumental configurations failing to converge to a common photometric system during the calibration process, since bright sources are rarer than faint sources while the complexity of the instrument that needs to be taken into consideration in the calibration process is the same for sources of all magnitudes. Extremely blue sources are also rare. As a consequence, it might be difficult to precisely link the photometric system of bright blue sources with the photometric system of faint sources if they are observed in different instrumental configurations. A possible change in instrumental configuration for sources in the observed magnitude range may be a change in CCD gate activation, a mechanism that is used by the Gaia instruments to adjust the effective exposure time for brighter sources (Carrasco et al., 2016). Another change in instrument configuration is the transition between two Gaia window classes, resulting in one-dimensional and two-dimensional spectra, respectively. These spectra are the basis for deriving the and magnitudes, and the change in window class is expected around (Carrasco et al., 2016). The exact reason for the discrepancy between blue sources in the two different magnitude regimes, however, remains unknown. Changes in the instrumental configuration, however, are driven by the on-board estimate of the magnitude, which is the reason why we specify the location of inconsistency in the BP photometric system by the G magnitude.
To account for this feature in BP magnitude, we separate the range of G magnitudes into two regimes, the ”bright” range for sources with ¡ 10.99 and the ”faint” range for sources with ¿ 10.99. We then derive the BP passband separately in the two magnitude ranges. We want to use only one set of calibration sources in both magnitude regimes in order to ensure a consistent solution between both. Only the SPSS and the CALSPEC libraries cover both regimes, and for the bright regime the number of sources is rather small. The CALSPEC data set provides a lower random noise for the bright spectra than the SPSS, and we prefer to use the CALSPEC spectra in this particular case. This set provides similar numbers of sources in the ”bright” and ”faint” regime, although with different coverage in spectral types. To compensate for this effect, we adjust the estimate for the orthogonal components of the two BP passbands such that a good result is achieved for the sources in the other three sets of spectra as well.
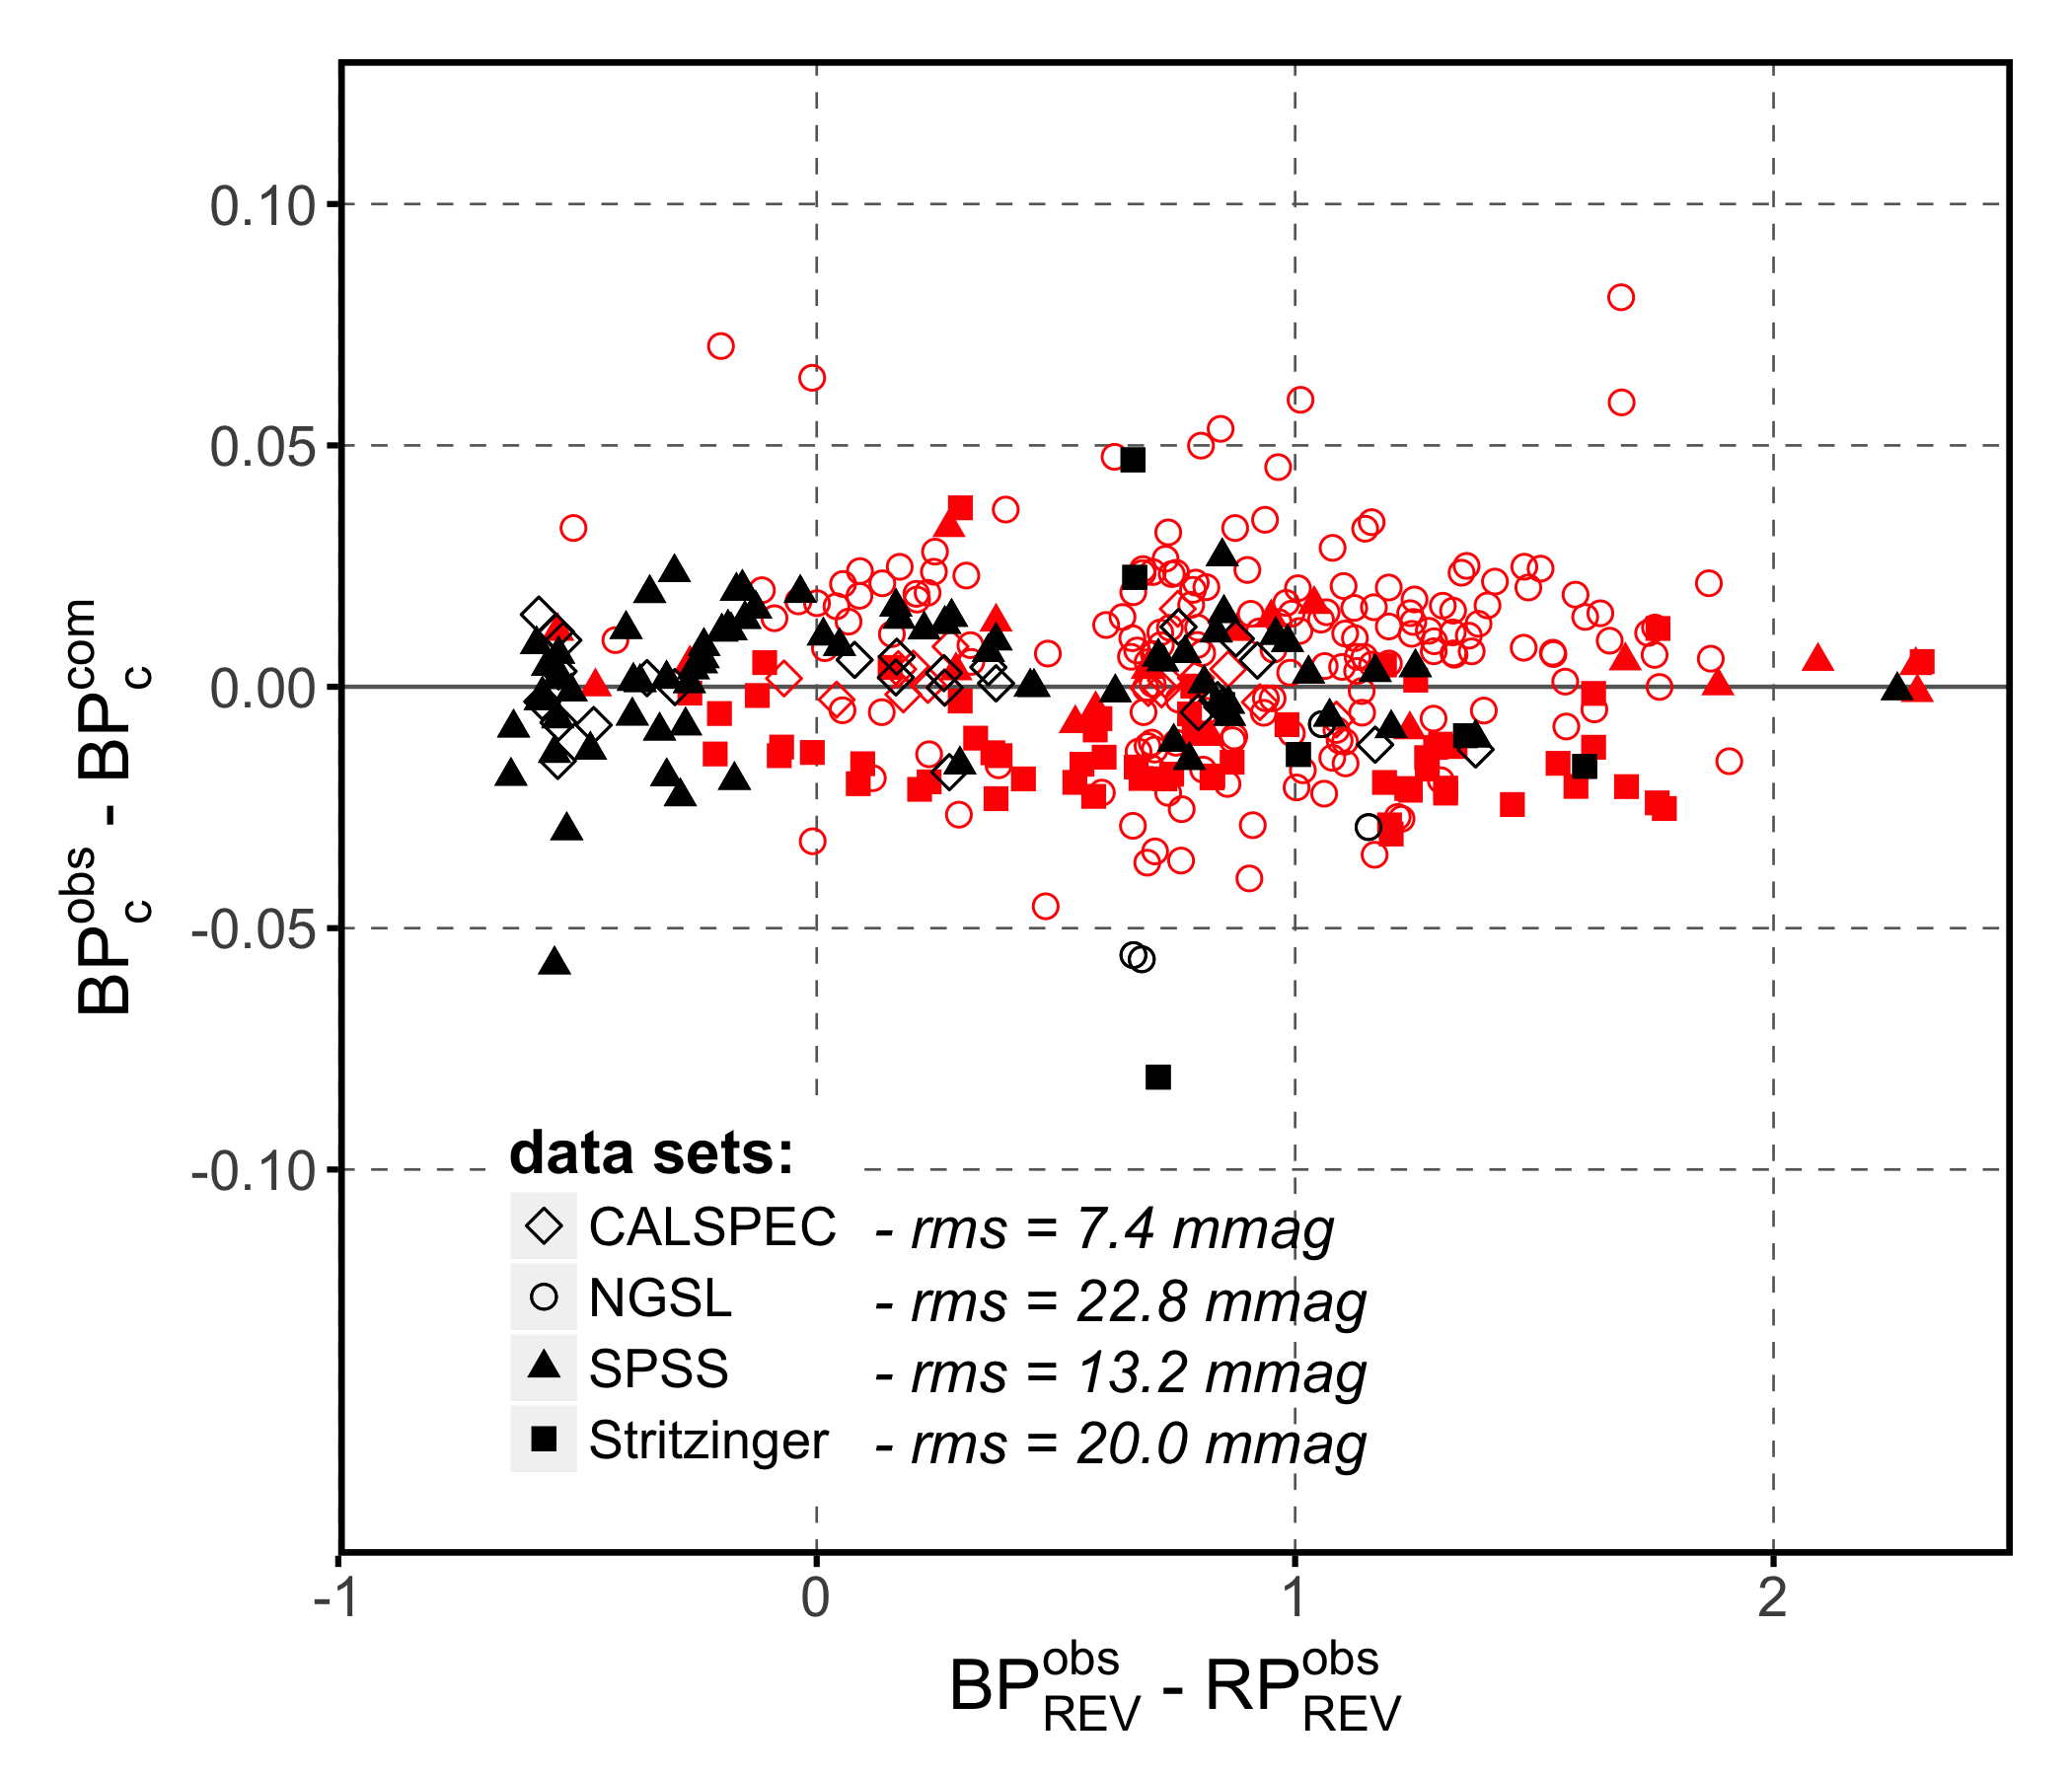
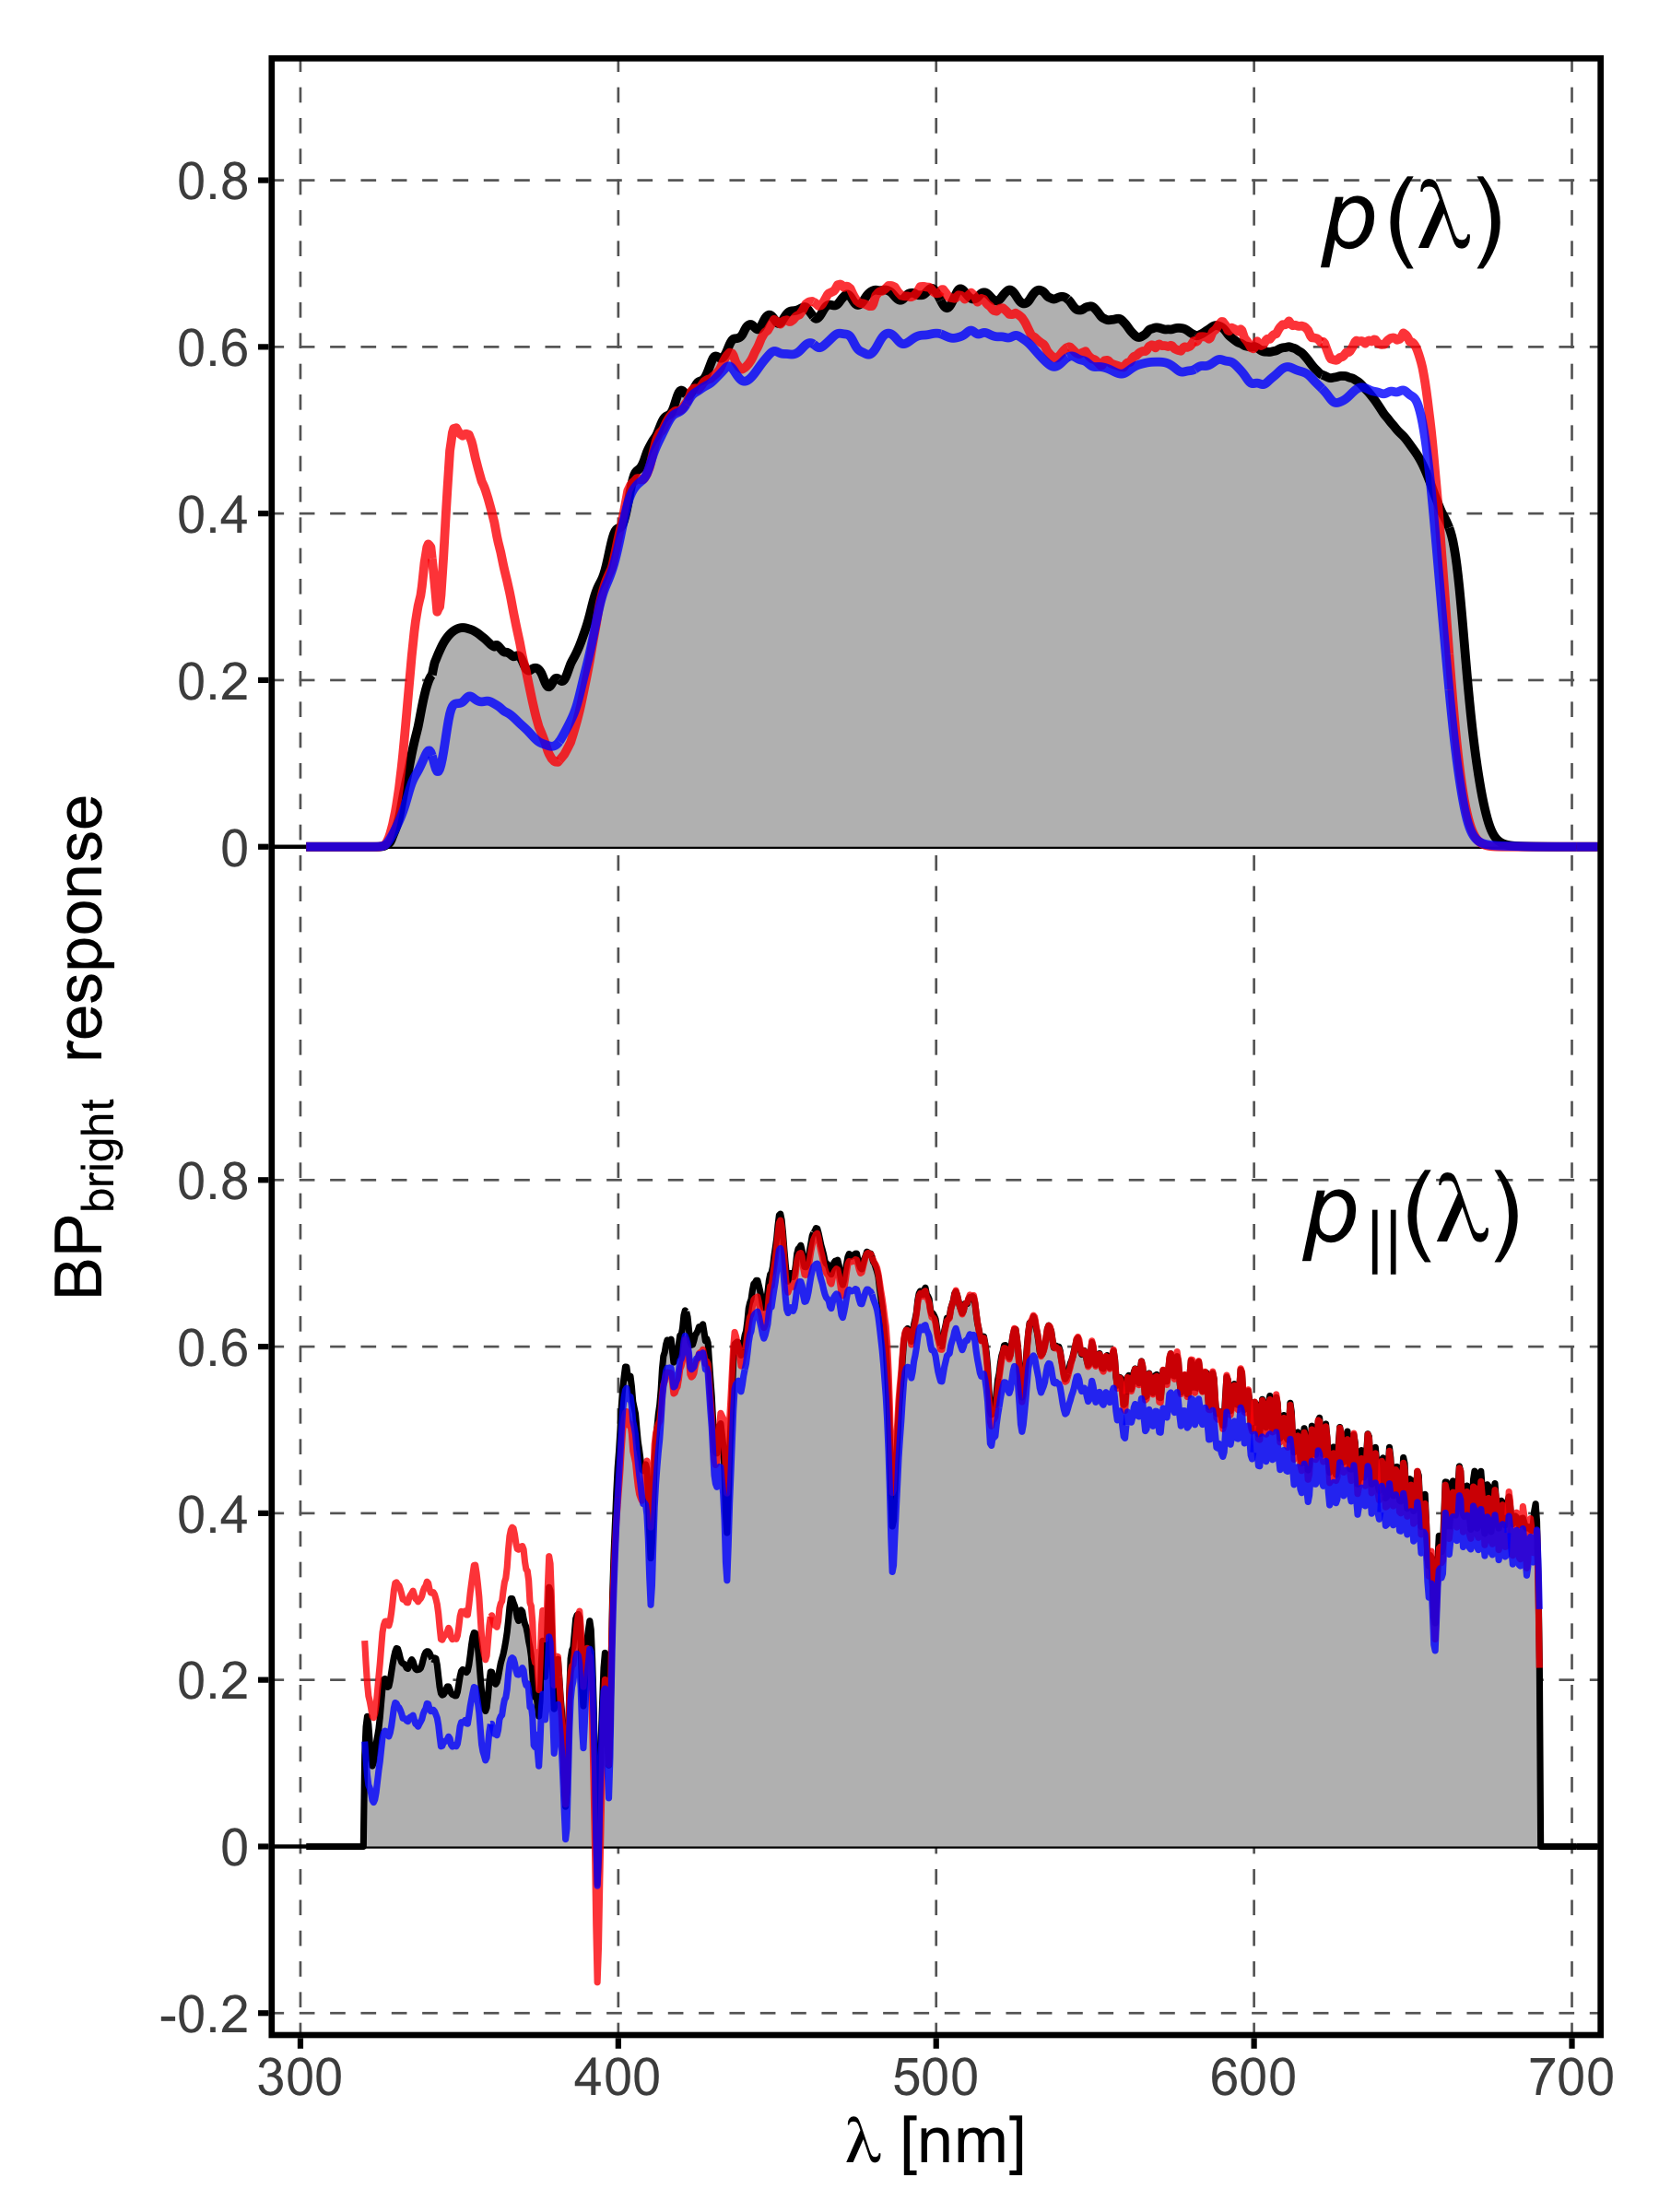
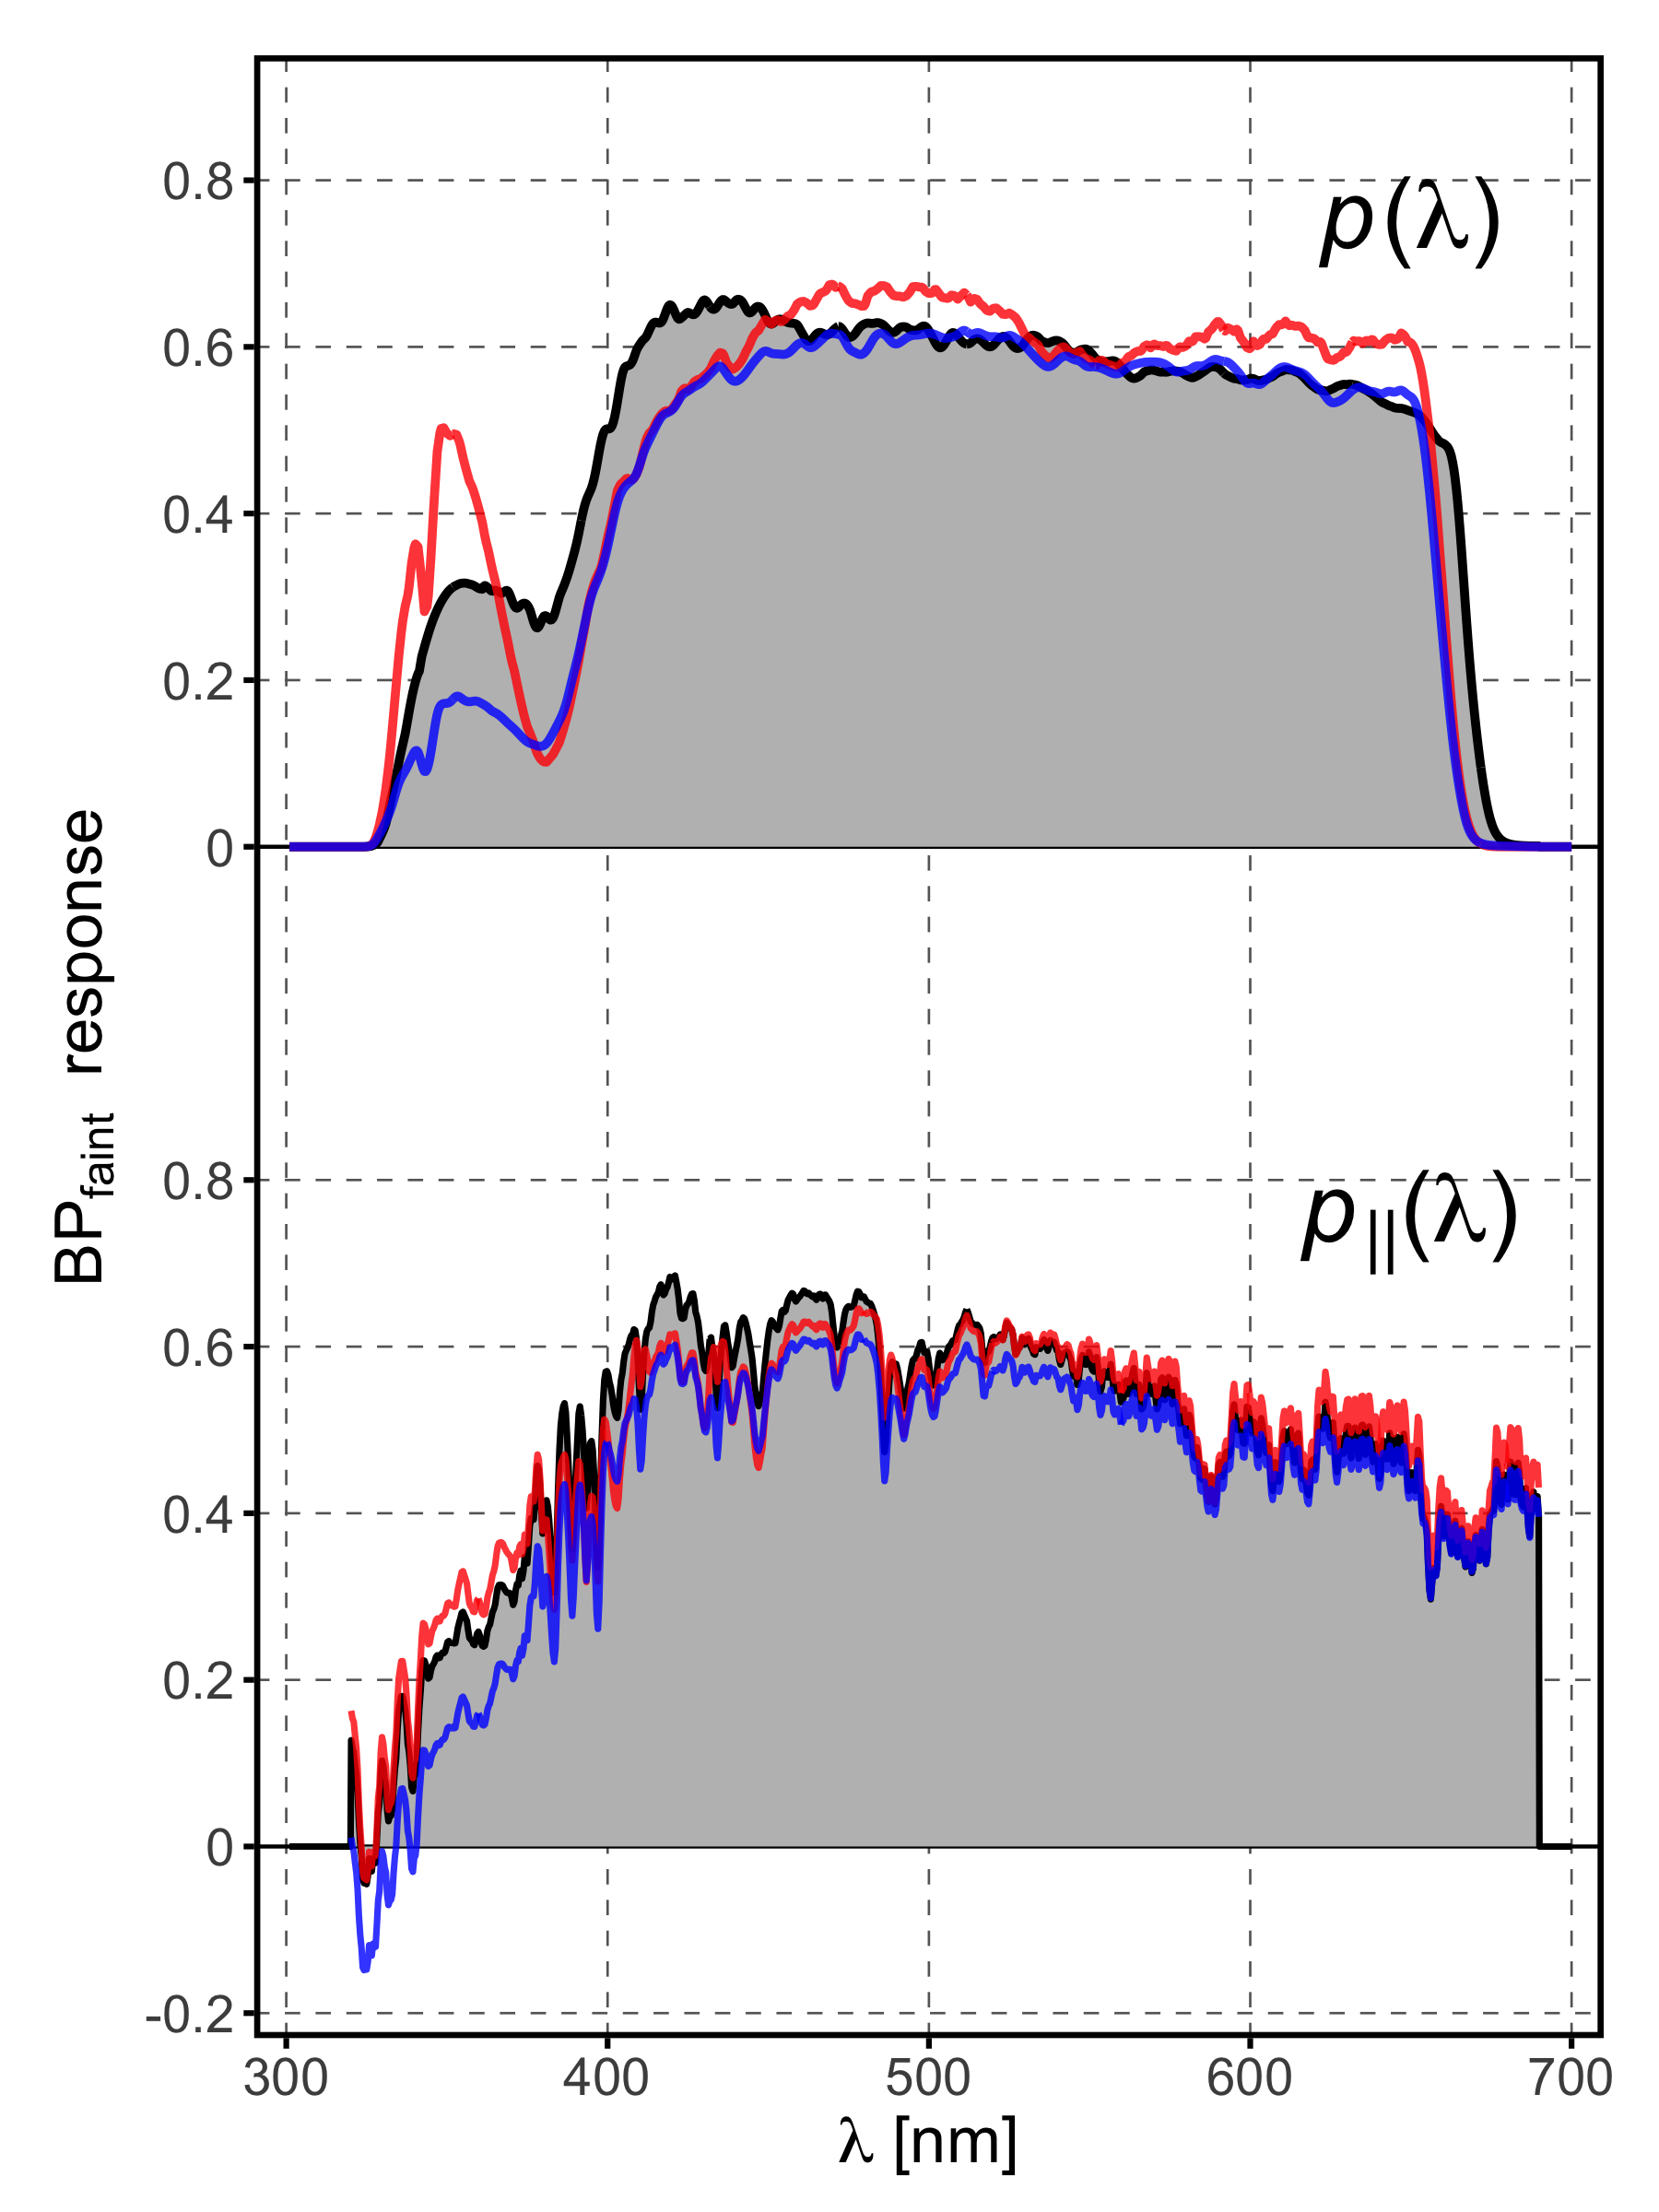
For both the bright and the faint regime in we use basis functions when computing the parallel component, and use cubic B-splines for the modification of the nominal pre-launch BP passband. The residuals obtained with the resulting passbands are also shown in Fig. 5, right panel. A significant improvement can be achieved with the two passbands. The rms values of the residuals, included in Fig. 5, improve for all four sets of spectra. Again, however, as the modifications introduced for the passband correct for systematic effects in the calibration, the resulting differences depend on the particular sources considered, and the quantitative improvement cannot be generalised. The passbands for the bright and faint magnitude regimes are shown in Fig. 6, together with the passband by Evans et al. (2018) and the BP passband by Jordi et al. (2010) for comparison. The basic parameters and zero points for the two BP passbands are listed in Table 1, the parallel and orthogonal components for both the bright and faint passband are tabulated in Table 2.
The orthogonal components of the passbands for the bright and faint regime were chosen in this work in such a way that the resulting passbands are similar to each other. Apart from the difference in shape, we find a difference of about 20 mmag in the zero points of the passbands for the two magnitude regimes.
5.2 Comparison with other results
Comparing the BP passbands derived in this work with previously published results, strong differences can be observed. Some of these differences occur only in the orthogonal component of the passband. Among these is the strong peak in the response of the passband around 350 nm. Such a strong, rather localised deviation between the initial expectation and the optimised passband is not required as far as the reproduction of the observed BP photometry is concerned. We therefore avoid such extreme peaks in the passband when estimating an orthogonal component, and give preference to less strong and, in wavelength space, less localised deviation from the initial guess for the passband. A second feature is the position of the wavelength cut-off position. This position is unconstrained by the calibration sources available in this work, and we obtained a solution that has a wavelength cut-off position slightly shifted towards longer wavelengths as compared to the passband by Evans et al. (2018) and Jordi et al. (2010). As we cannot constrain the exact position of the cut-off wavelength from the available photometry, and, as discussed in the following section, the passbands derived in this work allow also for a good agreement in colour-colour relations beyond the space spanned by the calibration sources available for this work, we give preference to these solutions with somewhat larger cut-off wavelength.
Considering the parallel components of the passbands shown in the lower panel of Fig. 6, we find significant differences which are, in contrast to the differences introduced by the choice of the orthogonal component, relevant for obtaining a better reproduction of the observed photometry of the calibration sources. These differences mainly affect the short wavelength part of the two BP passbands. The differences with respect to the REV passbands are most likely caused by the separation of the sources into the bright and the faint magnitude regime. Deriving a single passband for the whole magnitude range includes systematic effects and results in a different and less suitable result in the parallel component as compared to this work.
5.3 Colour-colour relations
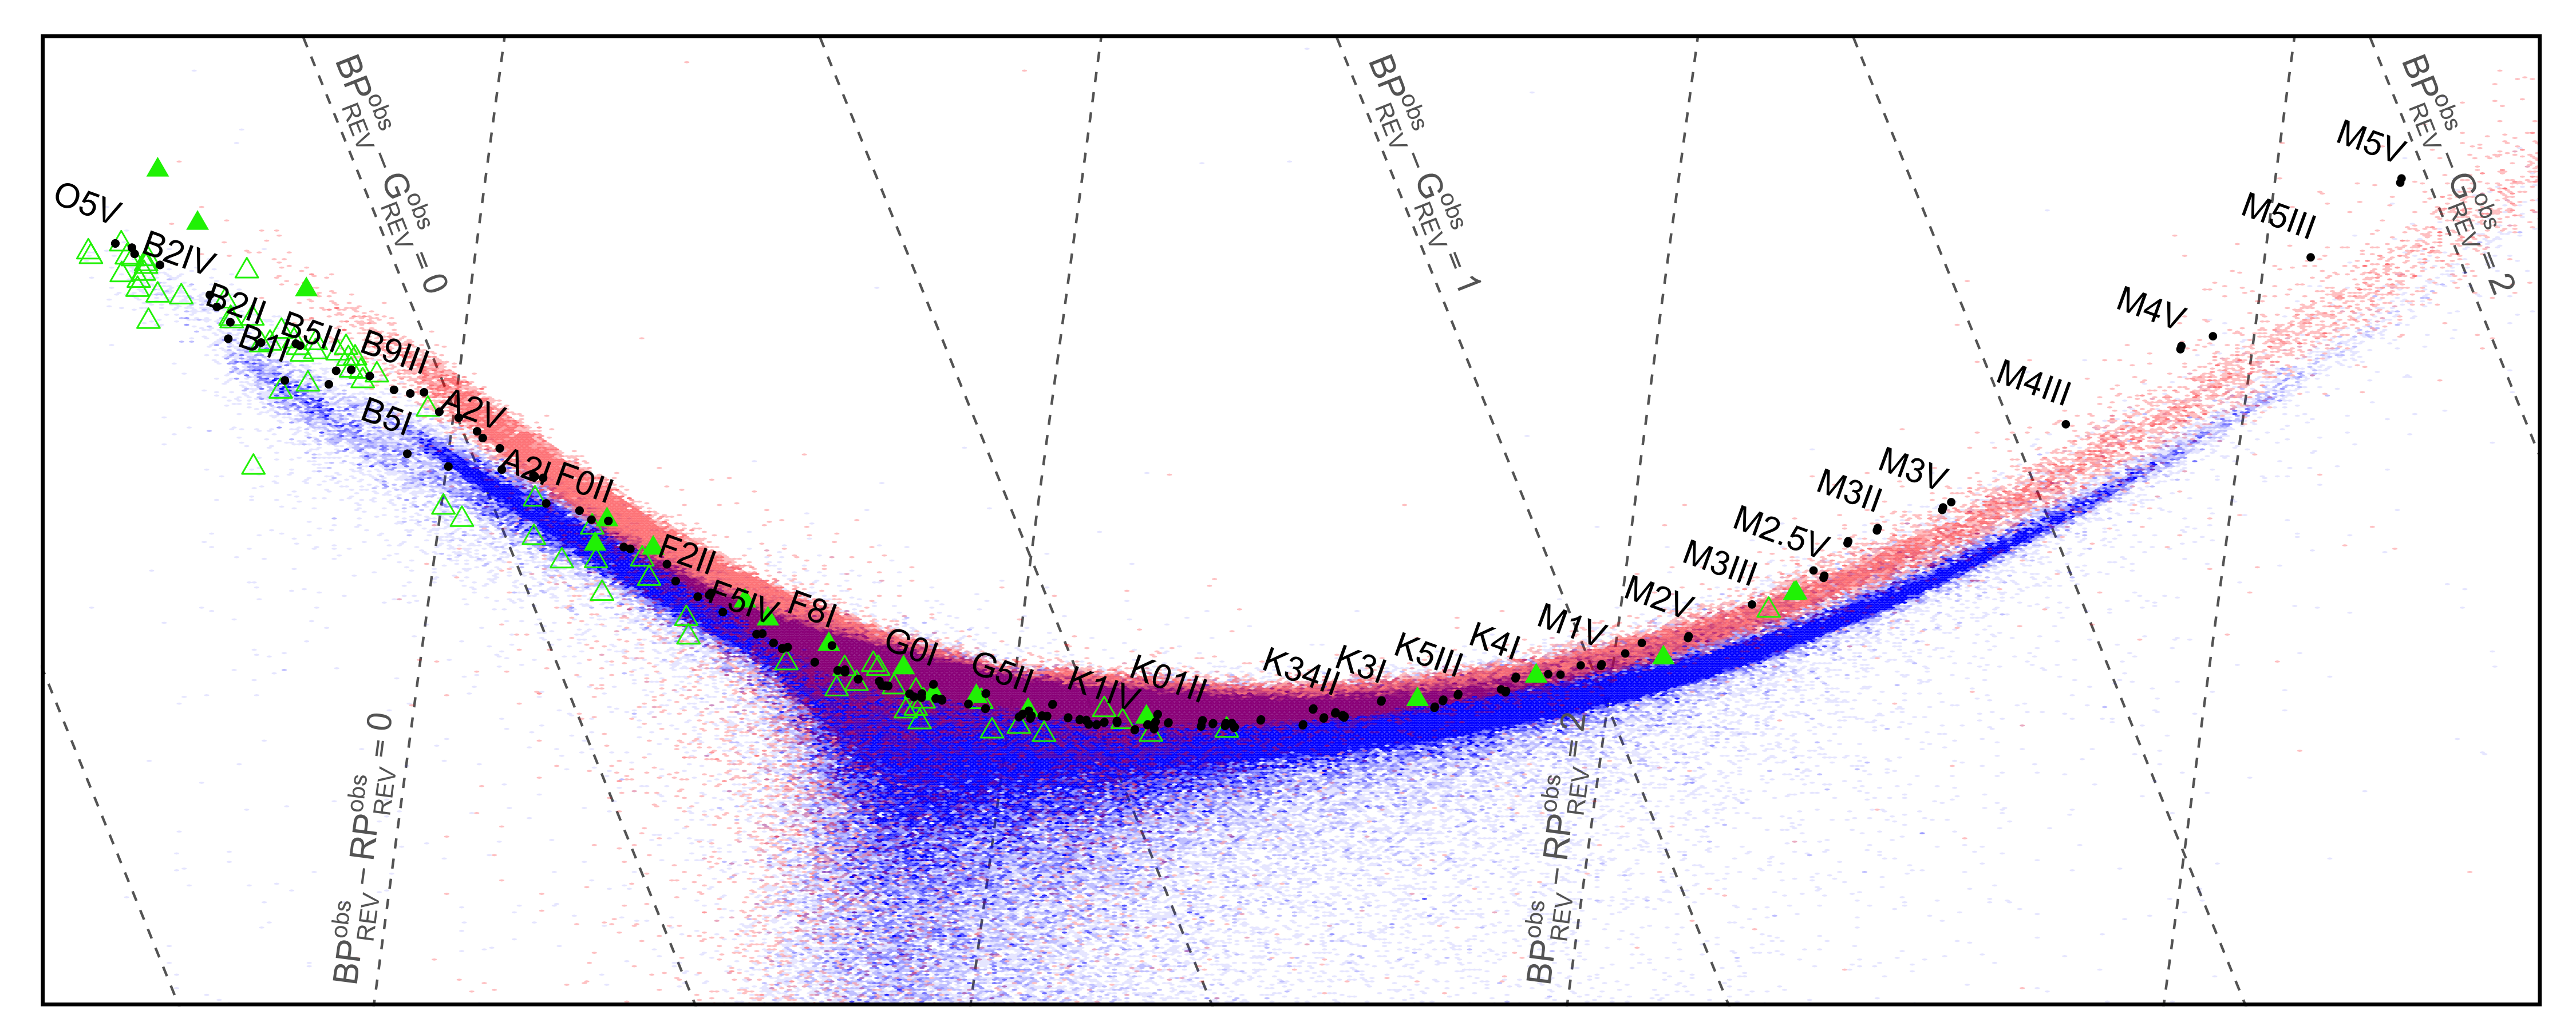
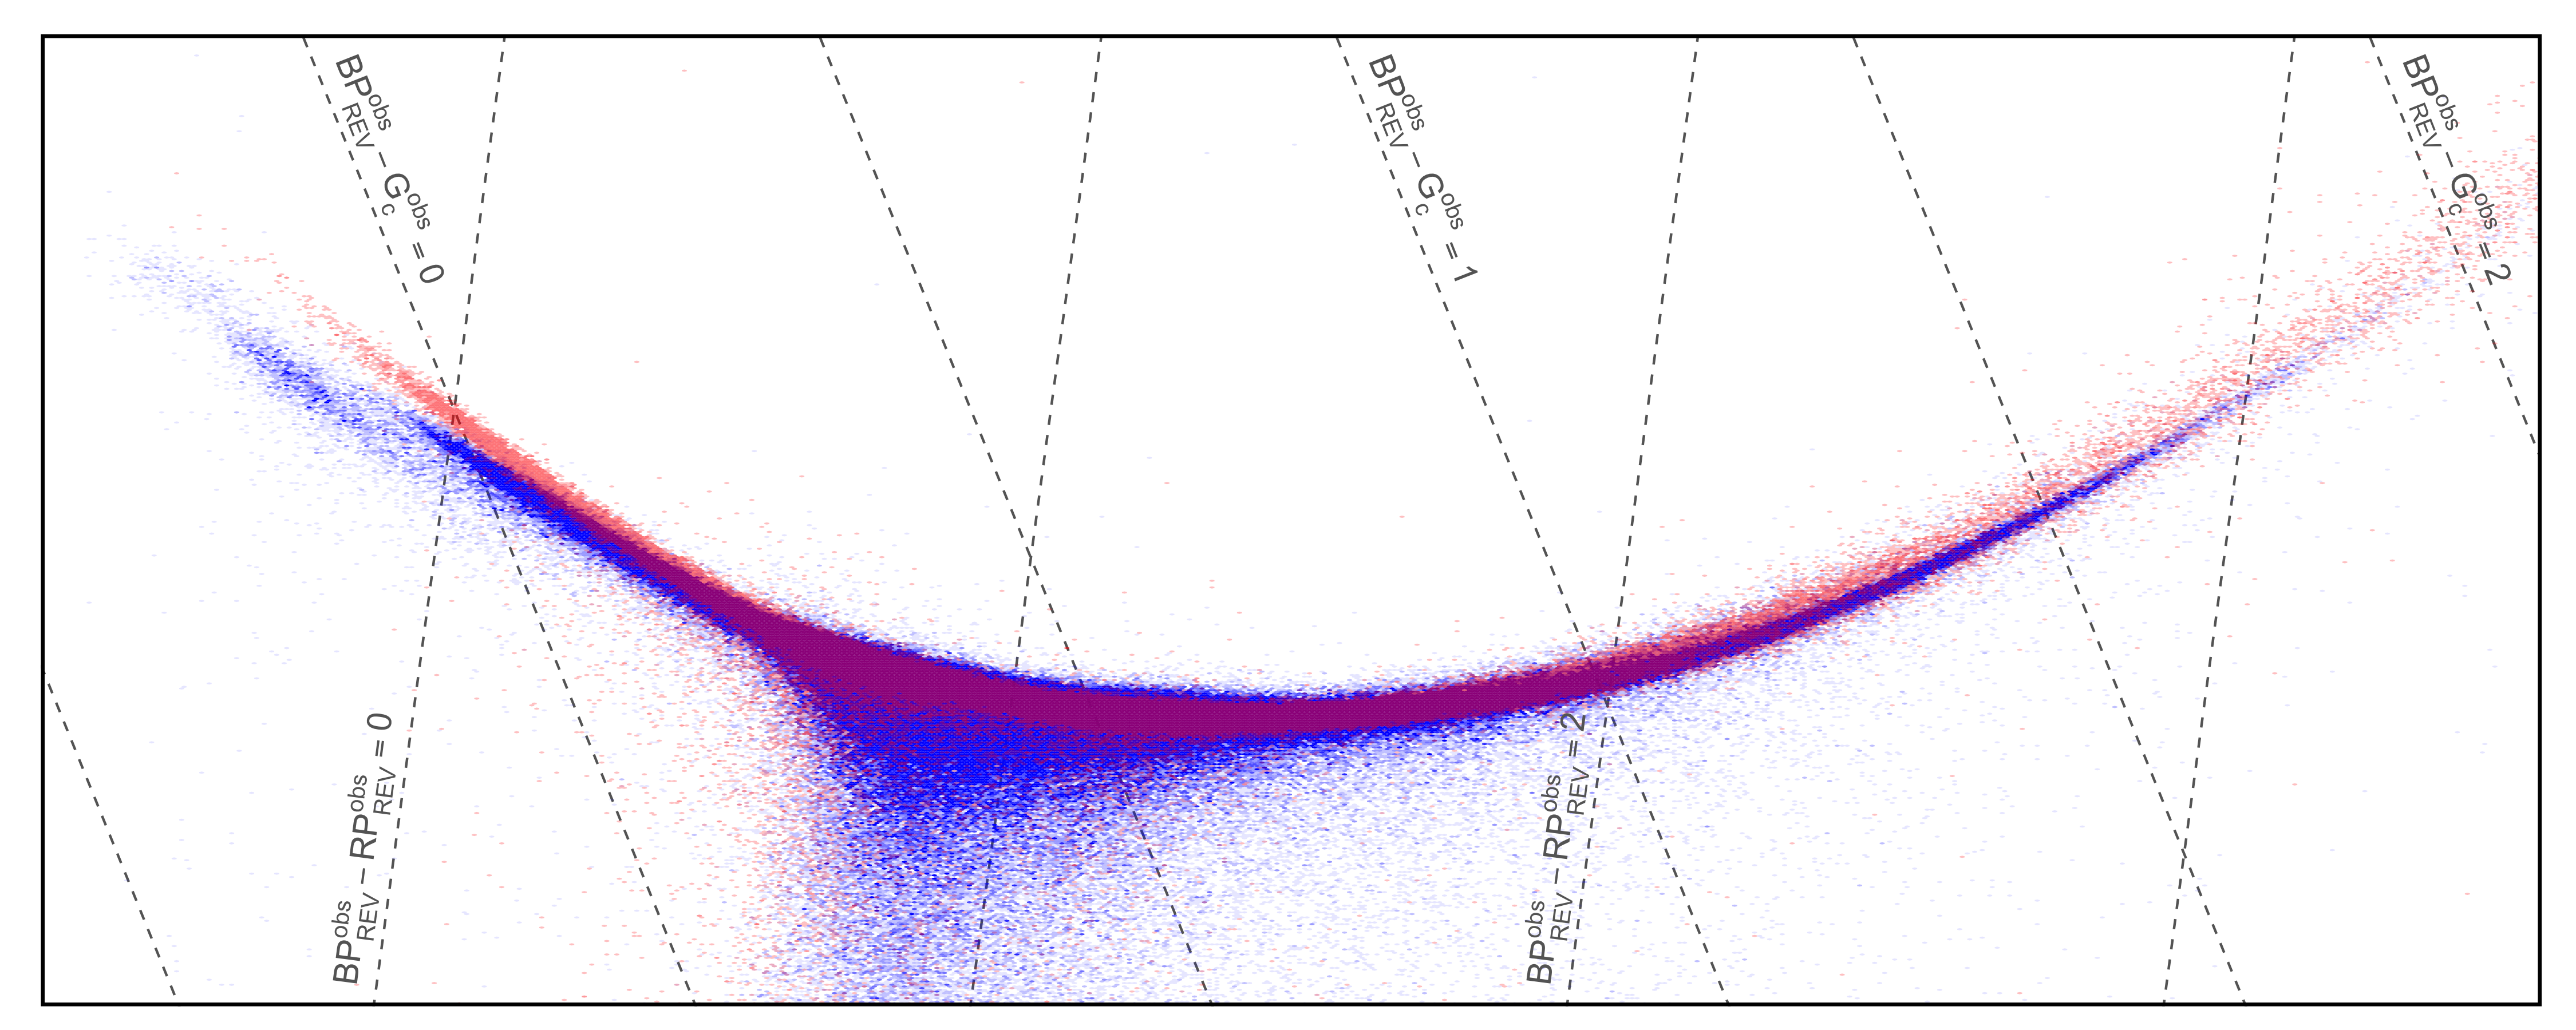
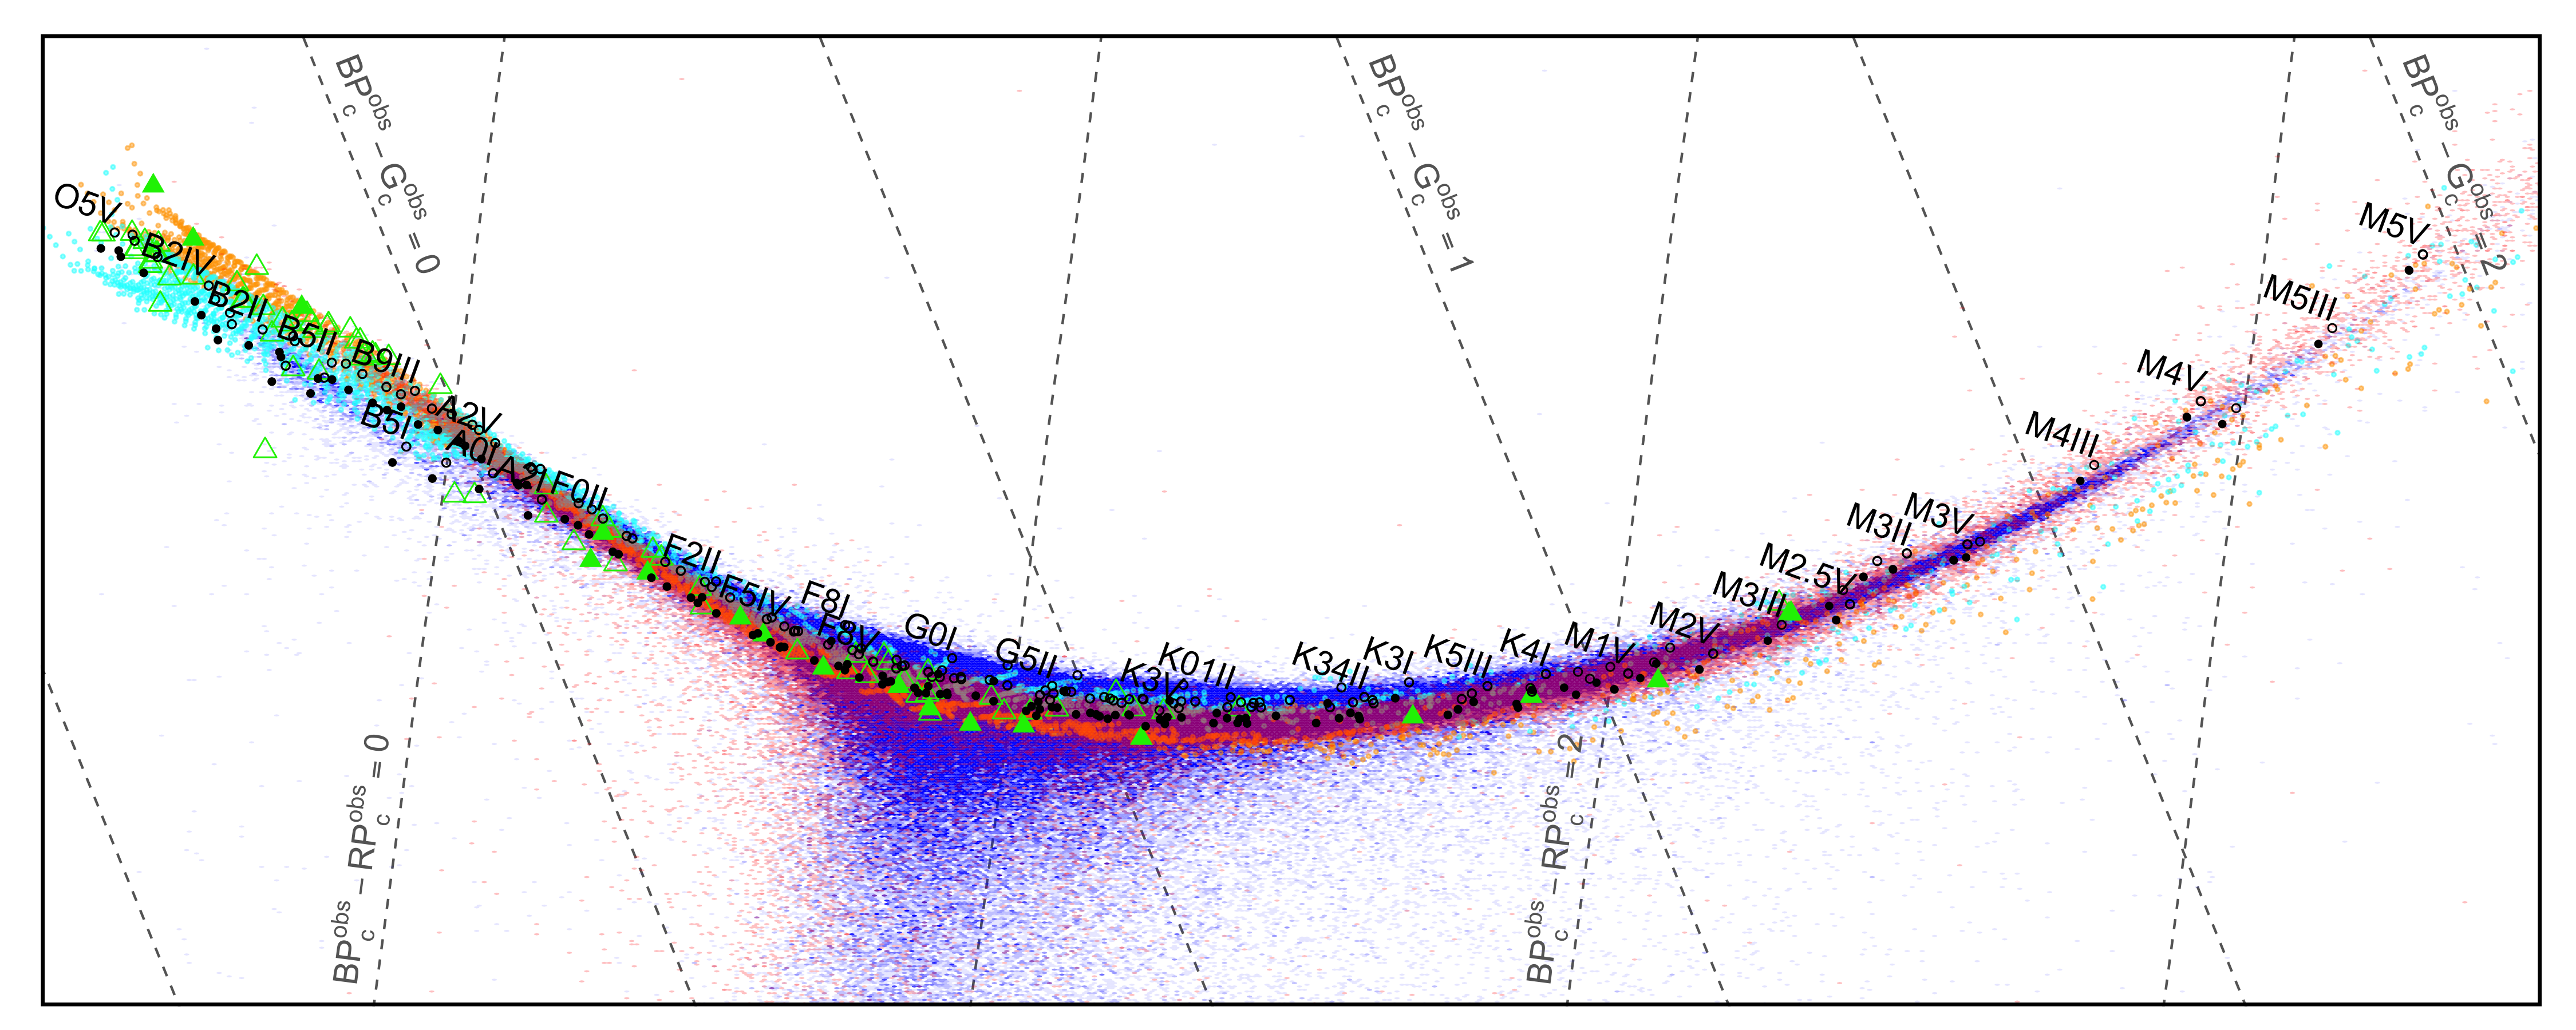
The split of the photometric system into two regimes also becomes visible in colour-colour diagrams. Figure 7 shows the versus diagram for the Gaia DR2 data set discussed in Sect. 3.3. For better fitting of the wide colour-colour diagram into the plotting window, it is rotated by 30∘ clockwise and the vertical axis is exaggerated by a factor of 11 as compared to the horizontal axis. The grid of dashed lines shows lines of constant values of and for orientation. Sources from the bright and the faint magnitude regions are plotted in different colours for comparison. The top panel shows the data in the REV photometric system. The position of the SPSS and the Pickles (1998) spectra are included in the plot for comparison. The most obvious difference in the distribution of the sources of the different magnitude regimes is an offset. This offset is mainly caused by the linear trend in described previously. Removing this trend reduces the differences between the colour-colour plots for the bright and faint sources strongly, as is shown in the central panel of Fig. 7. In this panel, the magnitude has been replaced by the magnitude. In the intermediate range of the diagram, the shape of the colour-colour relation of the bright and faint sources agrees very well. For very red sources, a slight difference between the relation of two magnitude regimes is present. The difference in trend for blue sources is obvious in this panel. Also the difference in zero point between the two passbands is visible. The convention in the VEGAMAG system requires that for all colour-colour diagrams, independently of the passbands, the main sequence runs through the point . This requirement implies the need to shift in particular the faint sources curve upwards in Fig. 7 to meet the origin of the plot. The difference in shift for the bright and faint regime amounts to approximately 20 mmag. The difference between the bright and faint blue sources has already been pointed out by Arenou et al. (2018), describing a larger dispersion for faint stars in the versus diagram, and a jump of about 20 mmag around a . Arenou et al. (2018) suspect the origin in the photometry but leave the reason for the observed effect unexplained. The results found in this work are thus in good agreement with previous findings. We attribute the larger dispersion for faint sources mainly to the linear drift in the photometry, and the jump of 20 mmag around to the photometry.
The bottom panel of Fig. 7 shows the colour-colour diagram for the , , and passbands derived in this work. This plot includes the correction for the zero points for the two passbands. The distribution of the Pickles and BaSeL spectra in this diagram depends significantly on the choice of the passband and is discussed in the following section.
| parameter | ||||
|---|---|---|---|---|
| [nm] | 639.74 | 516.47 | 511.78 | 783.05 |
| [nm] | 622.88 | 509.18 | 503.85 | 777.49 |
| zp [VEGA] | 25.6409 | 25.3423 | 25.3620 | 24.7600 |
| zp [AB] | 25.7455 | 25.3603 | 25.3888 | 25.1185 |
| 12.9612 | 9.7182 | 9.7241 | 11.5191 | |
| 2.0591 | 2.3606 | 2.1347 | 2.7351 |
6 RP passband
6.1 Determination of the passband
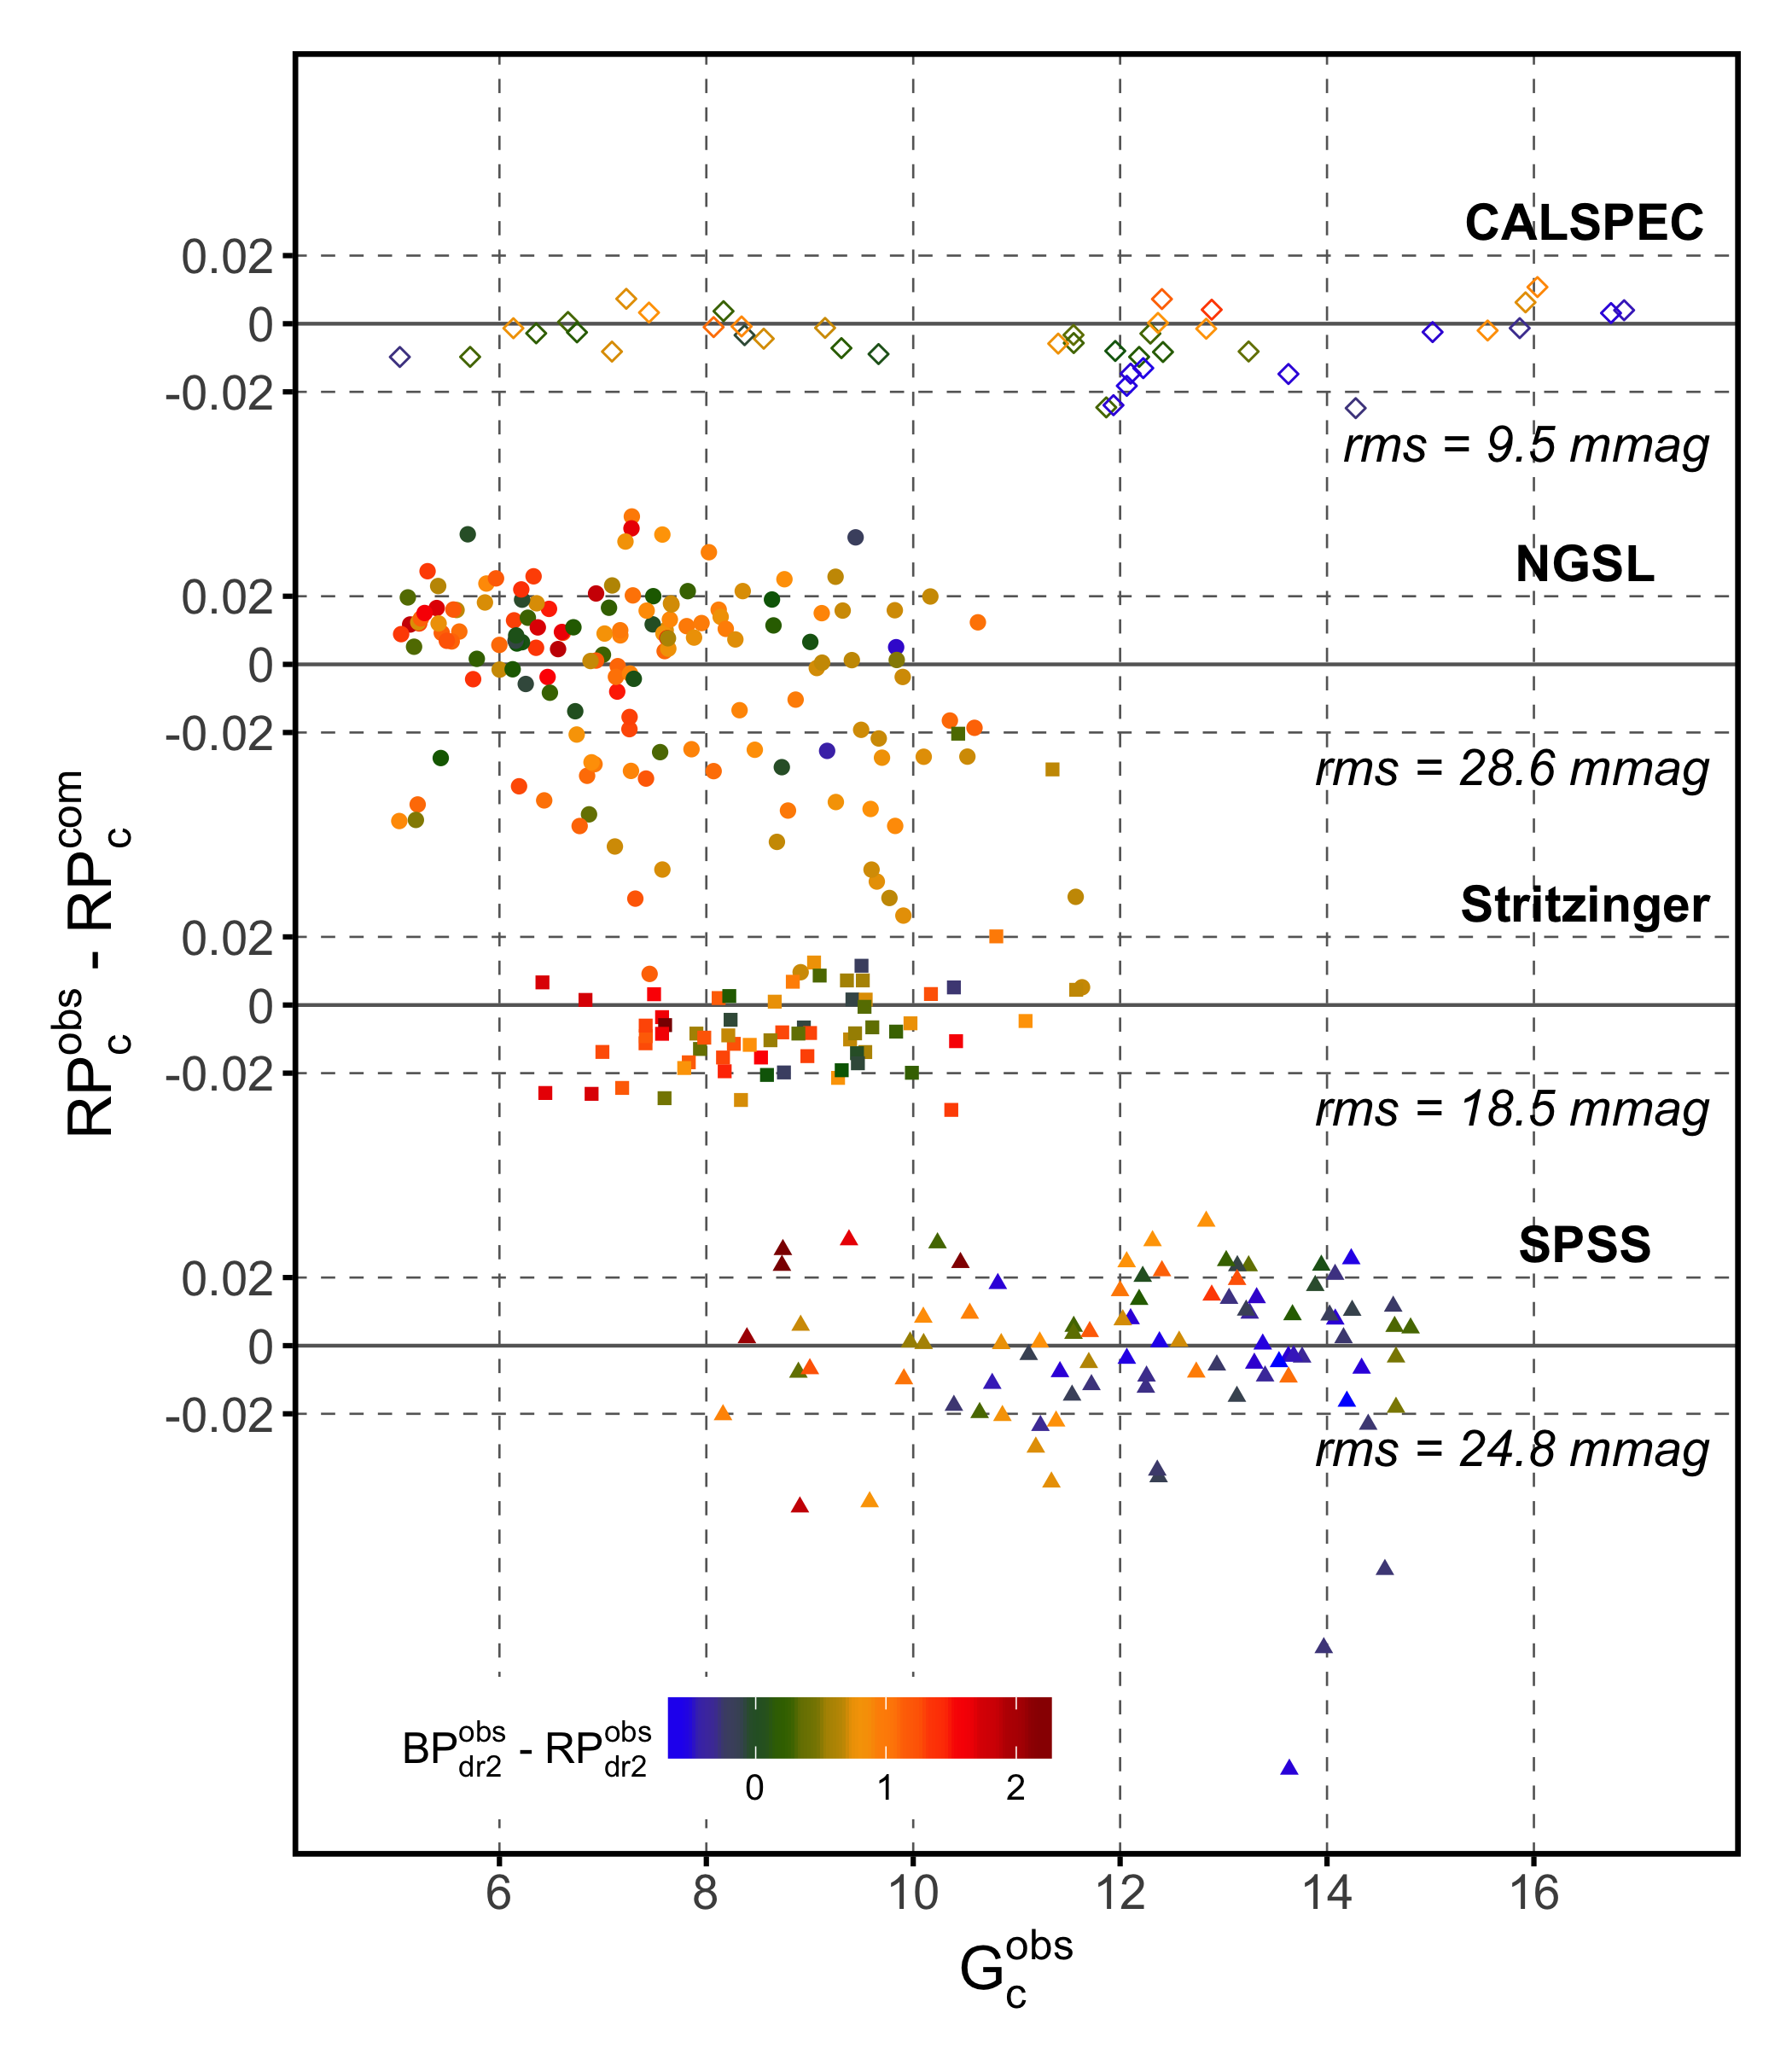
The residuals for the passband by Evans et al. (2018) are shown on the left panel of Fig. 8. There is a slight tendency towards higher residuals for very red sources visible for the SPSS and Stritzinger data sets. The and passbands were derived with the same set of SPSS calibration sources as used in this work. The modification of the initial passbands by Evans et al. (2018) was done by multiplication with a first degree polynomial (see Gaia DR2 online documentation). This choice for a modification model might be too simplistic, not allowing us to produce a modified passband that has the optimal parallel component with respect to the calibration sources. As a consequence, a slight colour dependency of the residuals may have remained.
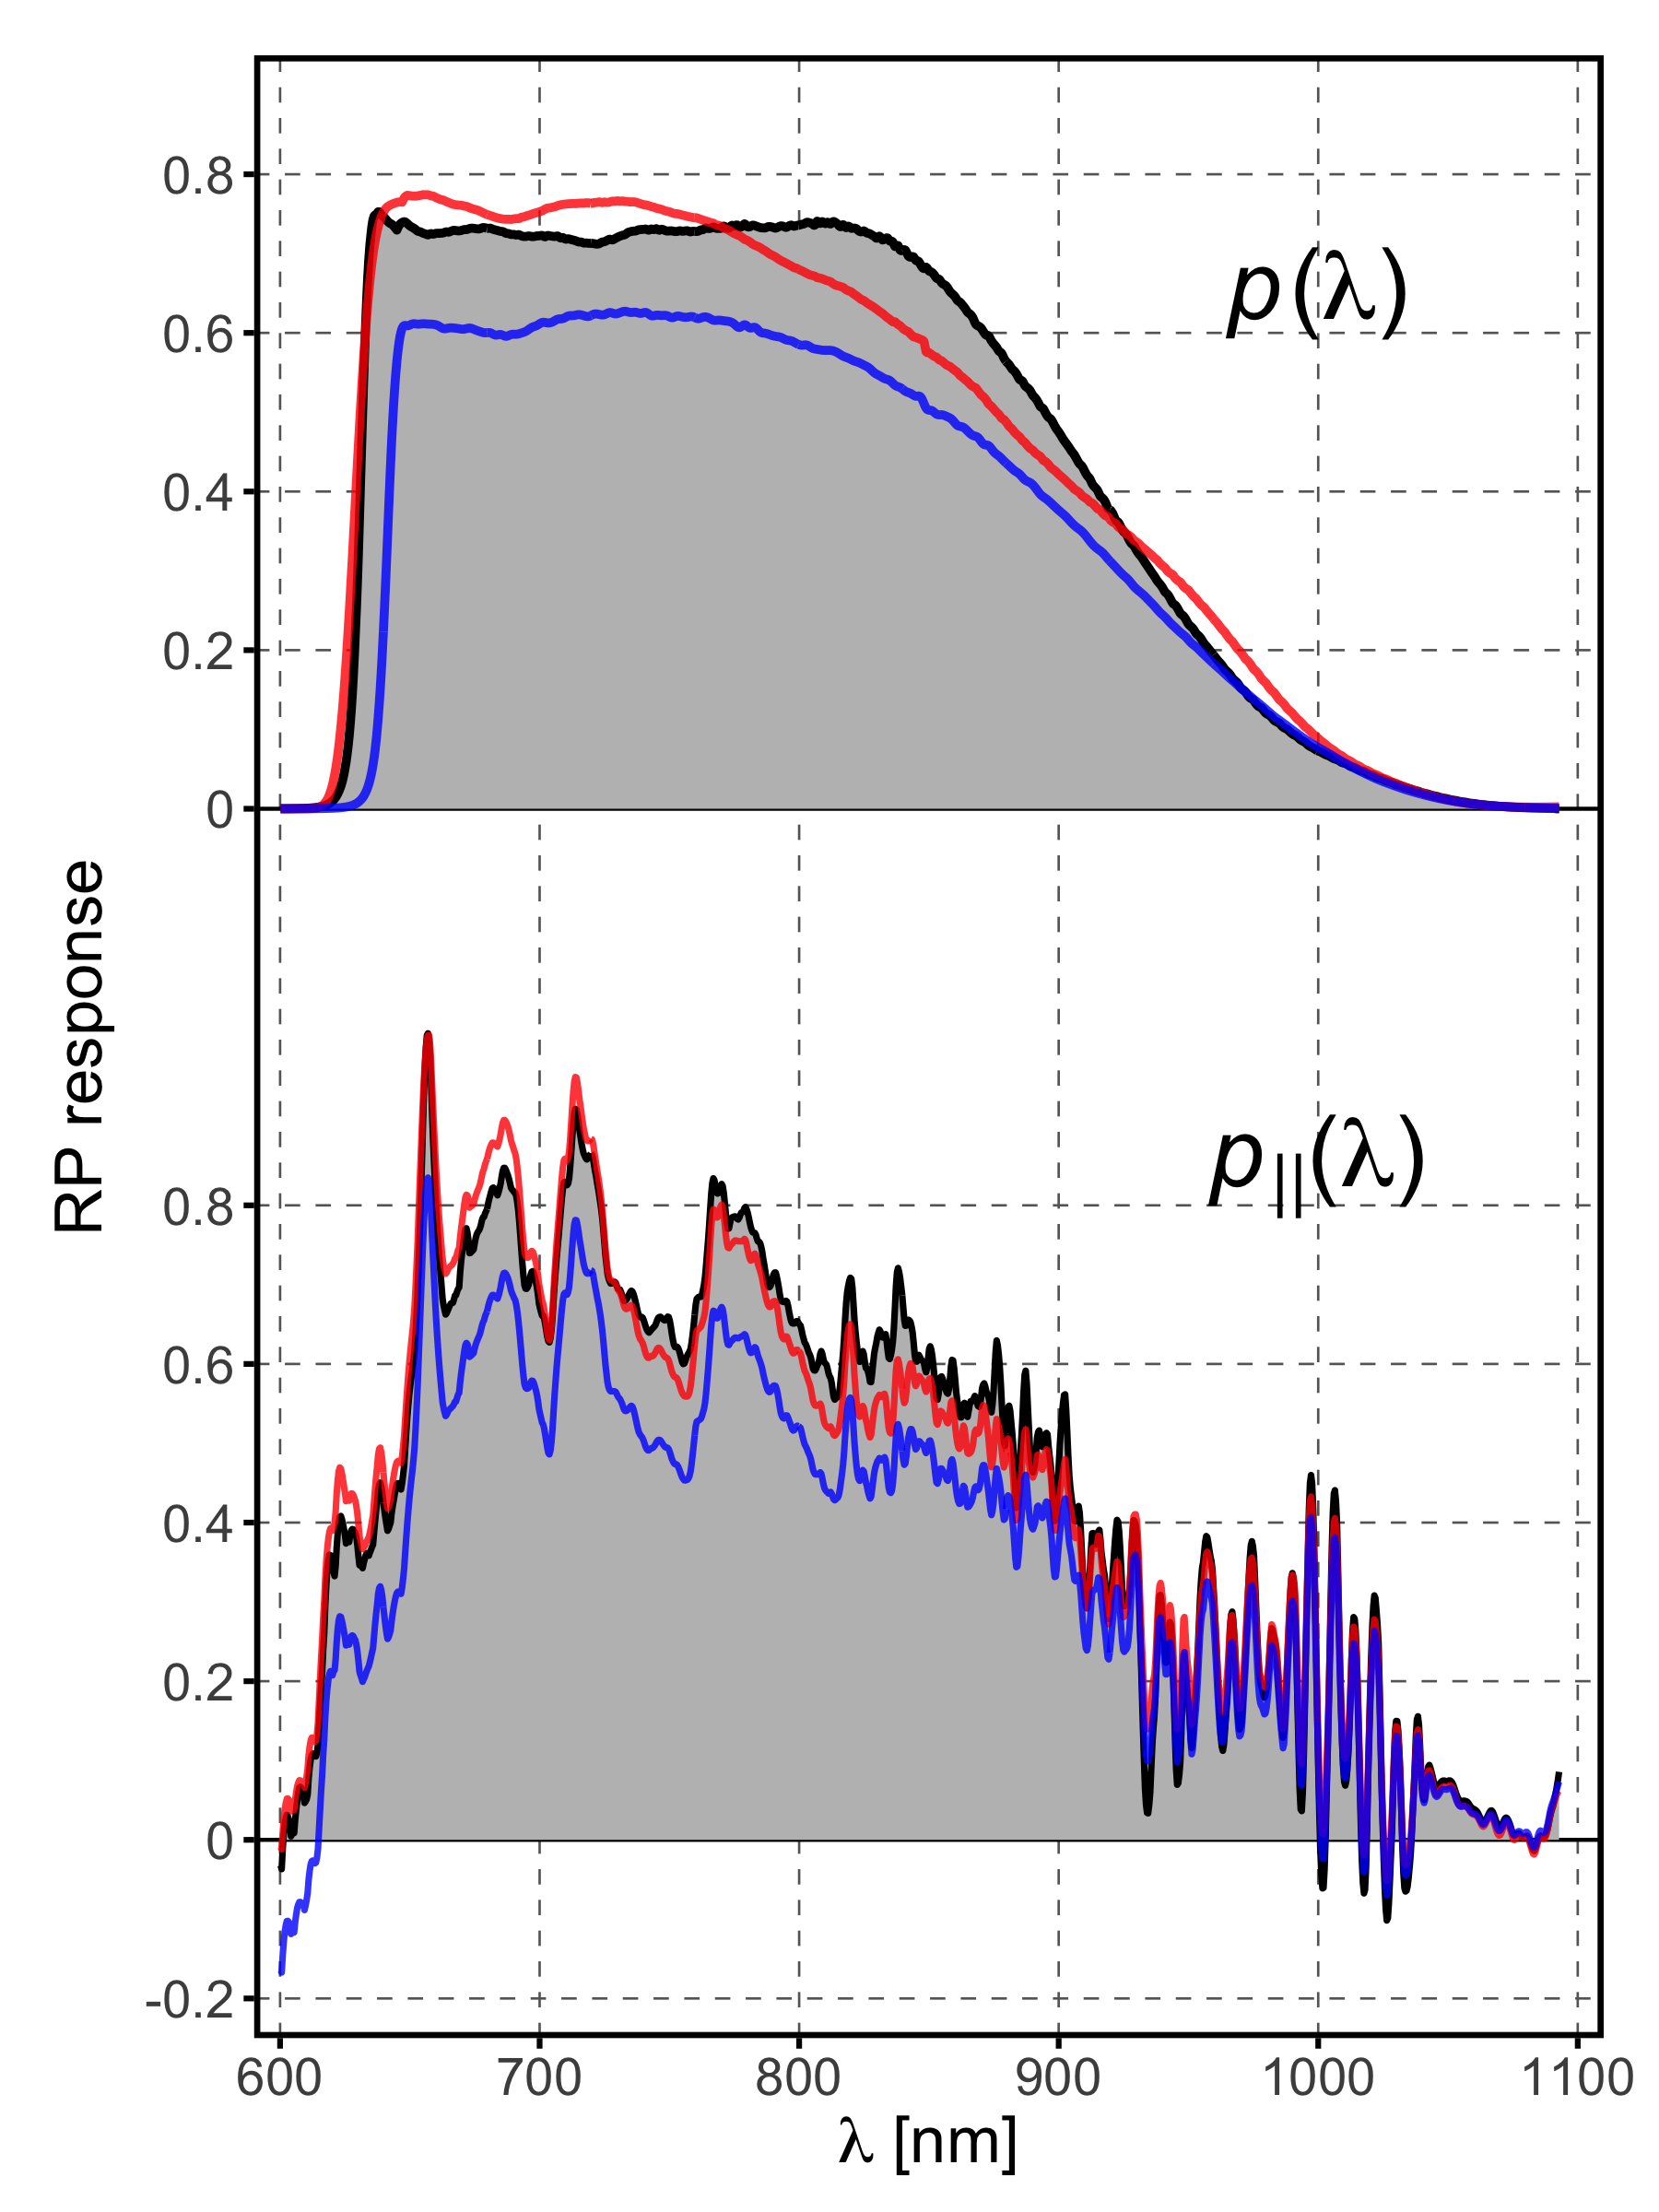
When computing the passband in this work, we cannot constrain the position of the wavelength cut-on position from photometry alone, as has already been the case for BP discussed before. As Evans et al. (2018) had spectroscopic observations from the Gaia RP instrument at hand before deriving the RP passband from the corresponding integrated photometry, the cut-on position of the passband could be constrained for the passband. We therefore chose an orthogonal component of the passband such that the wavelength cut-on position is the same as for the Evans et al. (2018) REV passband. We compute the parallel component of the passband in this work using the SPSS calibration set with basis functions. The orthogonal component was estimated requiring the passband to reproduce the observational colour-colour relations, as described in Sect. 2.2 and discussed in more detail in Sect. 6.3. The residuals for the solution of this work are shown in Fig. 8, right panel. The passband is shown in Fig. 9. The additional parameters for the passband are listed in Table 1, and the passband in Table 2. The passband solution derived in this work provides an improvement as compared to the REV passband, as it removes the systematic effect for very red sources in the residuals.
6.2 Comparison with other results
The RP passband derived in this work shows clear differences as compared to both the solution presented by Evans et al. (2018) and the pre-launch expectation. The differences affect both the parallel and orthogonal components of the passband. The RP passband derived in this work shows a steeper decrease at long wavelengths as compared to the other RP passbands presented before, and it is flatter at short and intermediate wavelengths. The parallel component derived in this work is lower than for the REV passband at short wavelengths, and larger at long wavelengths. The rms values of the residuals, listed in Fig. 8, improve slightly for the SPSS, and more strongly for the NGSL and Stritzinger spectra. Only for the CALSPEC spectra, the passband of this work results, for an unknown reason, in a slightly less good representation than the REV passband.
6.3 Colour-colour relations
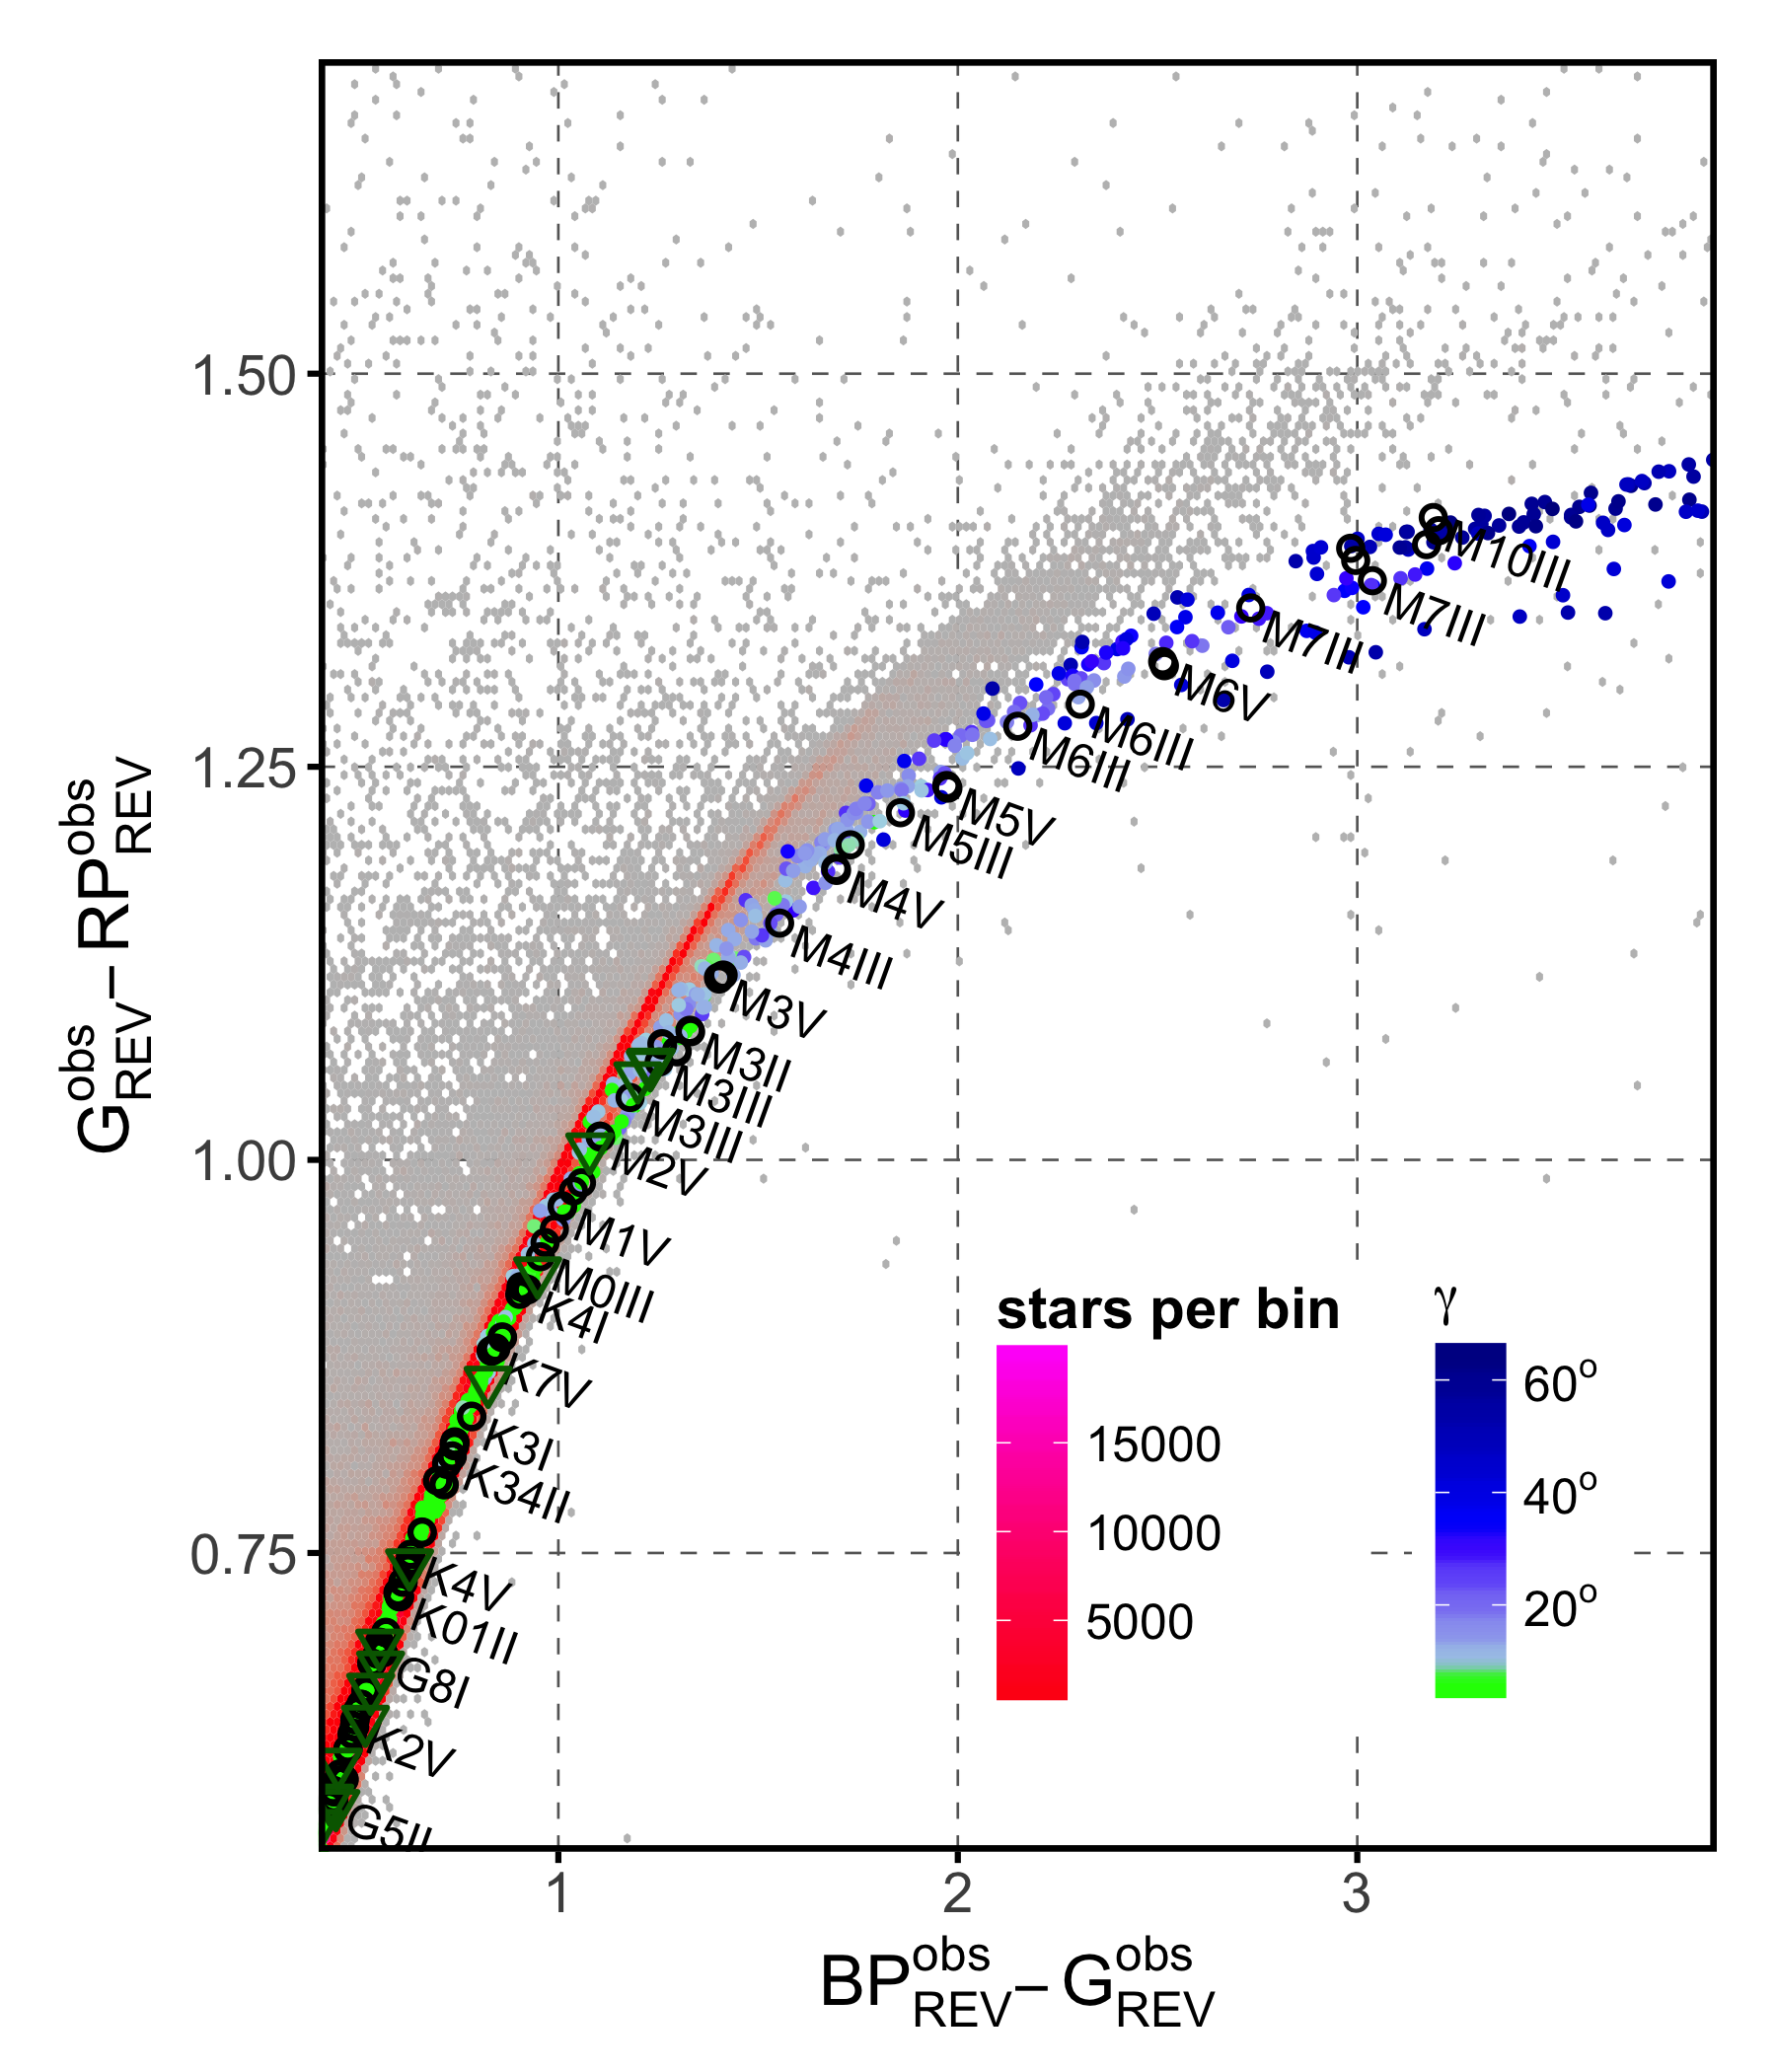
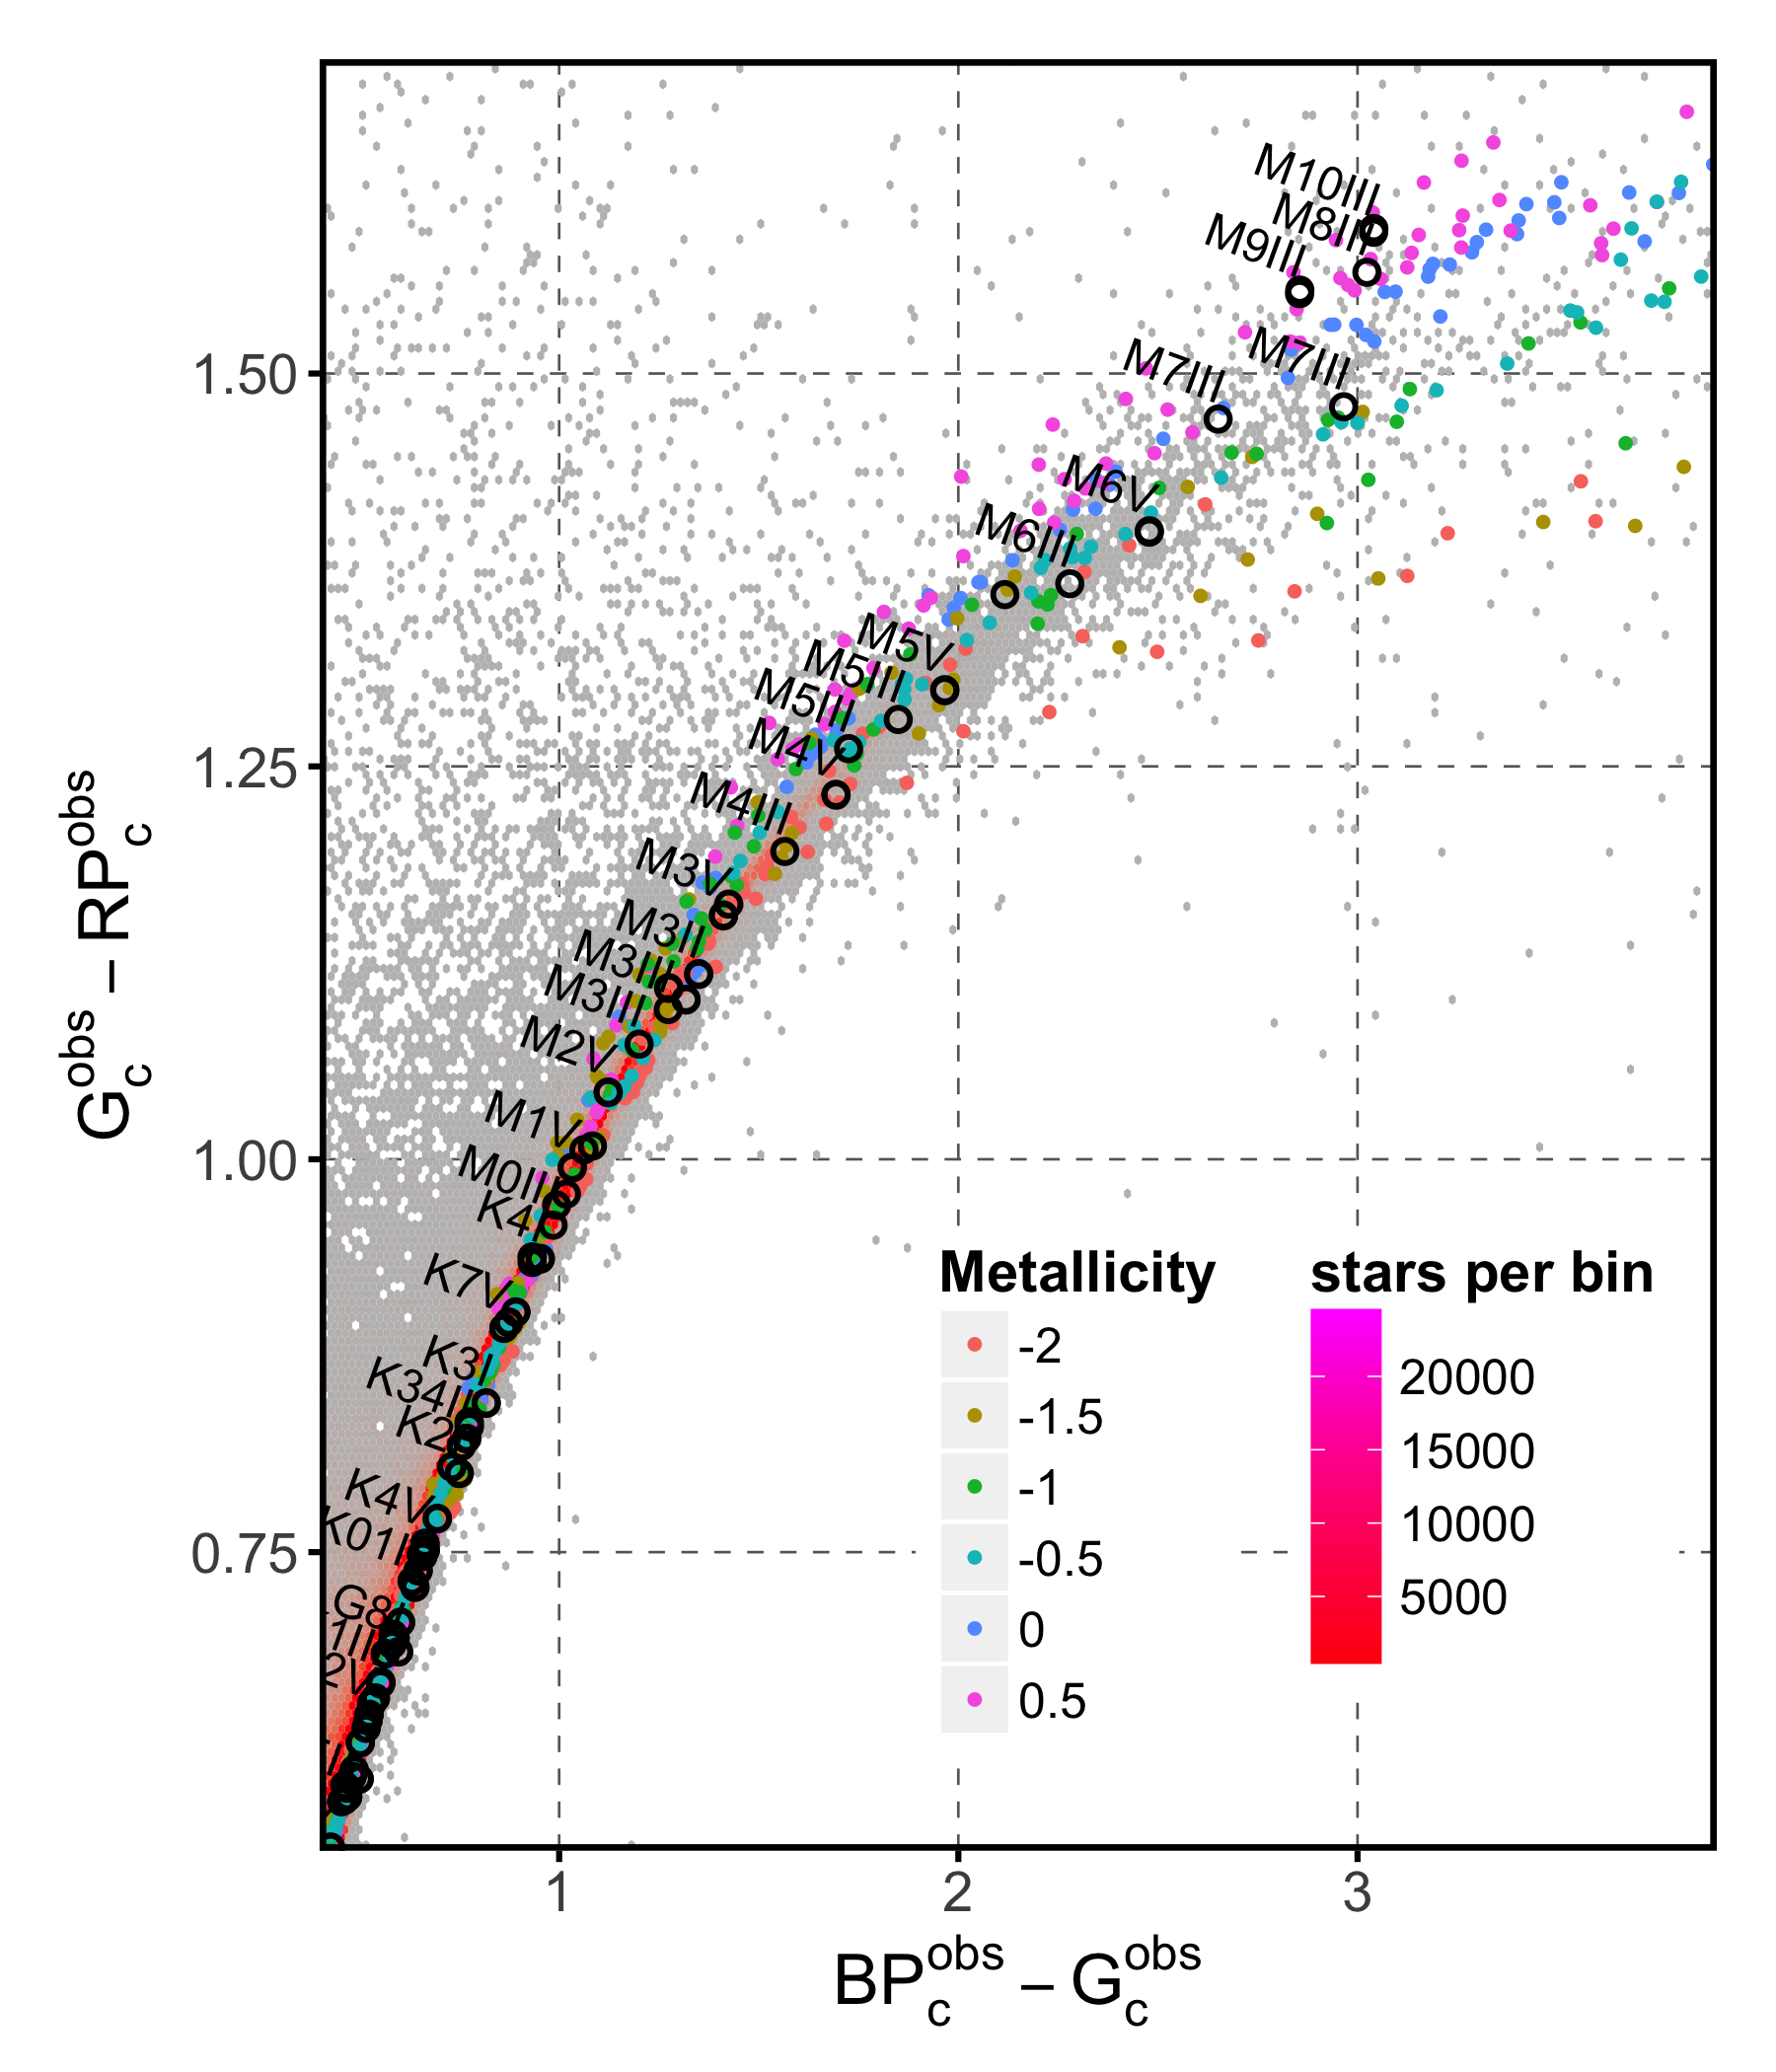
In Fig. 7 we compare the positions of the Pickles and BaSeL spectra in the versus diagram. For the REV passbands, the synthetic follow approximately the observed relations in the colour-colour diagram, except for the very red sources. For a colour index larger than approximately 1.25, a systematic deviation between the empirical and synthetic spectra and the Gaia DR2 observations occurs. This deviation starts for sources redder than the reddest SPSS available for calibration. This deviation can be explained by the influence of the orthogonal component of the passbands. M-type stars show strong variations in their SPDs, and very cool calibration sources are currently not available. As a consequence, the orthogonal component of the passband becomes increasingly important for the synthetic photometry of stars as their effective temperature becomes lower than the coolest calibration source. And if the guess for the orthogonal component is not optimal, this dependency on manifests itself in a progressive deviation of the synthetic colour-colour relations for Pickles and BaSeL spectra from the observed one. This effect may be quantified using the angle as defined in Weiler et al. (2018). For the Pickles and BaSeL spectra, however, the wavelength resolution of 500 is lower than the resolution of the SPSS spectra, which prevents an accurate computation of this quantity. For the BaSeL spectra, we introduced a colour coding according to nevertheless, in order to illustrate the principle, in the versus colour-colour diagram in Fig. 10. The numerical values are to be considered as approximations only.
The red end of the versus colour-colour is shown in Fig. 10, using the Gaia DR2 data set described in Sect. 3.3. The colour scale for the density of sources has been chosen to highlight the trend in the maximum of the distribution; all bins with lower star counts than indicated in the colour bar are presented in grey. This plot extends to even redder sources than Fig. 7. In the left panel, showing the observed colour-colour relation and the comparison with Pickles and BaSeL spectra for the REV passbands, one can see the bifurcation of the distribution caused by the change in the passband at . As the very red SPSS belong to the bright magnitude range, the SPSS, Pickles, and BaSeL spectra follow the bright range distribution; the trend for the faint range distribution is seen on top of them. The increasing deviation between the observed colour-colour relation and the relation for the synthetic spectra is also obvious, showing a systematic behaviour down to the coolest Pickles sources of spectral type M10. For the BaSeL spectra, the colour scale indicates the estimated angle. As three different angles are of relevance in the colour-colour diagram, which are the ones with respect to the , , and passbands, the largest value of the three has been used in the colour scale for each BaSeL SPD shown. For BaSeL SPDs with colour indices up to the redest SPSS, the agreements between the synthetic and observed colour-colour relations are good, and remains low. For SPDs redder than the reddest SPSS, the systematic deviation starts, and , indicating the dependence on the orthogonal components of the three passbands involved, increases progressively as the deviation increases. This illustrates the use of for estimating the sensitivity of a spectrum with respect to the choice of .
The right panel in Fig. 10 shows the same data set for the passbands derived in this work. The bifurcation is removed in this diagram by the use of the and passbands. As no calibration sources cooler than M2V, the coolest SPSS in the calibration data set, are available, we constrain the passband by requiring it not only to result in a good agreement between observed and synthetic colour-colour relations for the calibration sources, but also to result in an agreement between observed colour-colour relations and the relations for the Pickles spectra. The passband derived in this work achieved such an agreement for sources up to a spectral type of M7. For the Pickles spectra of types M8 to M10, a slight deviation from the observed relationships remains. The synthetic colour-colour relation of the BaSeL spectra also shows a better agreement with the observational relation. The scatter between the different BaSeL spectra, however, is very large for very red sources. This scatter mainly results from the differences in metallicity between the spectra, as is indicated by the colour coding of the BaSeL points in the right hand panel of Fig. 10. It remains uncertain if this spread according to metallicity of cool M-type sources is a real effect or whether it results from an inaccurate estimate of the orthogonal passband components. It is possible to derive passband solutions that reduce the spread among the BaSeL spectra, but only at the cost of either a worse agreement between the BaSeL and Pickles spectra in the colour-colour diagram, or by introducing a more complex shape in the passband. We chose in this work passband solutions that result in a simple shape of the passband and a better agreement between Pickles and BaSeL spectra, rather than reducing the spread according to metallicity for late M-type stars. This again illustrates the need for very cool calibration sources in order to allow for a reliable interpretation of the photometry of M-type stars.
7 Summary and conclusions
In this work, we determined the G, BP, and RP passbands for Gaia DR2. We used a functional analytic formulation of the problem of passband reconstruction to separate each passband into a sum of two functions. One of these functions, the parallel component is fully constrained by the calibration sources, while the other function, the orthogonal component is fully unconstrained. We derived the parallel component using sets of observational spectral libraries and the Gaia DR2 photometry of the sources included in the libraries. The orthogonal component is estimated based on two considerations. First, we use an initial guess for the passband, based on a-priori knowledge on the passband shape. This initial guess is then modified in such a way that the modified initial guess remains close to the initial guess while having in agreement with the determination. Second, we introduce an additional constraint on the choice of the orthogonal component by requiring the passbands to predict colour-colour relationships for model spectra of a wide range of spectral types to be in agreement with the observed colour-colour distributions in Gaia DR2.
For the passband, we found a solution for the shape of the passband that is basically in agreement with the shape of solutions published by Evans et al. (2018) and Jordi et al. (2010). An approximately linear trend in the photometry is however present on a magnitude interval from about 6 to 17. A trend in photometry has already been observed in Gaia Data Release 1 (Weiler et al., 2018), and it was already noticed for Gaia DR2 by Evans et al. (2018) and Arenou et al. (2018). The origin of this effect remains yet unknown. In this work, we introduce a correction for it by applying a linear correction in magnitude of mmag per magnitude. This correction results in a factor of 0.9965 in the computation of the magnitude according to Eq. (13). This correction applies to a magnitude interval from about 6 to 17 in band. For brighter sources, a deviation from this trend caused by saturation effects occurs, as reported by Evans et al. (2018). For magnitudes larger than 17, no suitable calibration sources are available for this work. Arenou et al. (2018), however, found indications for a more complex systematics in the residuals for sources fainter than about 17.
For we introduced two different photometric systems for stars brighter and fainter than 10.99 in the -band. By doing so, we take into account an inconsistency in the photometry, which occurs for a reason as yet unknown, but it may be connected to a change in instrumental configuration such as gate activation or windowing. The assumption of two passbands explains the differences between the and photometry previously reported by Arenou et al. (2018). We derive two passbands for , valid for sources brighter than 10.99 mag in , and fainter than this limit. The passbands derived for the bright and the faint magnitude range are rather similar to each other in shape, and differ in zero point by about 20 mmag from each other. However, they differ significantly from previously published passbands by Evans et al. (2018) and Jordi et al. (2010).
The passband for provides an improvement as compared to the passband by Evans et al. (2018), as it removes a systematic colour-dependent effect in reproducing the calibration sources. The passband is rather different in shape from the previously published passbands.
The passband solutions for , , and in this work have been chosen such that, when applying them together, the synthetic photometry from the Pickles (1998) spectral library is in good agreement with the colour-colour relations observed in Gaia DR2. The passbands presented in this work result in synthetic colour-colour relations that follow well the observed relations for stars from spectral type O5 to M7. For cooler sources than M7, the database becomes too sparse and the variation within synthetic colour-colour relations too large to draw definite conclusions. The different passbands derived in this work are thus consistent with each other within the limits set by the available calibration data.
We point out that the shapes of the passbands derived in this work are not unique, as is the case for the passbands derived by Evans et al. (2018). The limitation is introduced by the existence of the orthogonal component and is of a fundamental nature. There necessarily exist an infinite number of different passbands that describe all available calibration data equally well. In order to estimate the sensitivity of a particular SPD with respect to the orthogonal component, we suggest the computation of the contribution of and to the synthetic photometry independently. For this purpose, all passbands derived in this work are presented in Table 2 with their parallel and orthogonal components individually. The angle as defined in Eq. 12 may serve as an illustrative quantity for specifying the degree to which a particular SPD depends on the orthogonal component and, with it, how sensitive the synthetic photometry of the given SPD is to systematic errors that may arise from an inaccurate estimate of .
The passbands presented in this work allow for a better agreement between synthetic and observed photometry over a wide range of SPDs than previously published passbands, while at the same time being physically reasonable. Table 2 lists all passbands derived in this work as a function of wavelength and is available in electronic form at the Centre de Données astronomiques de Strasbourg, CDS. Applying them in the interpretation of the Gaia DR2 photometric data may therefore help to maximise the scientific outcome from the uniquely large and accurate astronomical data set that is Gaia DR2.
Acknowledgements.
This work was supported by the MINECO (Spanish Ministry of Economy) through grants ESP2016-80079-C2-1-R (MINECO/FEDER, UE) and ESP2014-55996-C2-1-R (MINECO/FEDER, UE) and MDM-2014-0369 of ICCUB (Unidad de Excelencia ”María de Maeztu”).This work has made use of data from the European Space Agency (ESA) mission Gaia (https://www.cosmos.esa.int/gaia), processed by the Gaia Data Processing and Analysis Consortium (DPAC, https://www.cosmos.esa.int/web/gaia/dpac/consortium). Funding for the DPAC has been provided by national institutions, in particular the institutions participating in the Gaia Multilateral Agreement.
I thank the Gaia DPAC SPSS team for providing the intermediate data products used for this work: E. Pancino, G. Altavilla, S. Marinoni, N. Sanna, G. Cocozza, S. Ragaini, and S. Galleti.
I furthermore thank C. Jordi, J. M. Carrasco and C. Fabricius for fruitful discussions during the preparation of this work.
References
- Altavilla et al. (2015) Altavilla, G., Marinoni, S., Pancino, E., et al. 2015, Astronomische Nachrichten, 336, 515
- Arenou et al. (2018) Arenou, F., Luri, X., Babusiaux, C., et al. 2018, ArXiv e-prints [arXiv:1804.09375]
- Bohlin (2007) Bohlin, R. C. 2007, in Astronomical Society of the Pacific Conference Series, Vol. 364, The Future of Photometric, Spectrophotometric and Polarimetric Standardization, ed. C. Sterken, 315
- Bohlin (2014) Bohlin, R. C. 2014, AJ, 147, 127
- Bohlin & Gilliland (2004) Bohlin, R. C. & Gilliland, R. L. 2004, AJ, 127, 3508
- Bohlin et al. (2017) Bohlin, R. C., Mészáros, S., Fleming, S. W., et al. 2017, AJ, 153, 234
- Cardelli et al. (1989) Cardelli, J. A., Clayton, G. C., & Mathis, J. S. 1989, ApJ, 345, 245
- Carrasco et al. (2016) Carrasco, J. M., Evans, D. W., Montegriffo, P., et al. 2016, A&A, 595, A7
- Evans et al. (2018) Evans, D. W., Riello, M., De Angeli, F., et al. 2018, ArXiv e-prints [arXiv:1804.09368]
- Gaia Collaboration et al. (2018) Gaia Collaboration, Brown, A. G. A., Vallenari, A., et al. 2018, ArXiv e-prints [arXiv:1804.09365]
- Gaia Collaboration Prusti et al. (2016) Gaia Collaboration Prusti, T., de Bruijne, J. H. J., Brown, A. G. A., et al. 2016, A&A, 595, A1
- Heap & Lindler (2016) Heap, S. R. & Lindler, D. 2016, in Calibration and Standardization of Missions and Large Surveys in Astronomy and Astrophysics, ed. S. Deustua, A. Allam, D. Tucker, & J. A. Smith (ASP Conference Series, Vol. 503)
- Jordi et al. (2010) Jordi, C., Gebran, M., Carrasco, J. M., et al. 2010, A&A, 523, A48
- Koornneef et al. (1986) Koornneef, J., Bohlin, R., Buser, R., Horne, K., & Turnshek, D. 1986, in Highlights of Astronomy, ed. J.-P. Swings
- Maíz Apellániz (2017) Maíz Apellániz, J. 2017, A&A, 608, L8
- Marinoni et al. (2016) Marinoni, S., Pancino, E., Altavilla, G., et al. 2016, MNRAS, 462, 3616
- Oke & Gunn (1983) Oke, J. B. & Gunn, J. E. 1983, ApJ, 266, 713
- Pancino et al. (2012) Pancino, E., Altavilla, G., Marinono, S., et al. 2012, MNRAS, 426, 1767
- Pickles (1998) Pickles, A. J. 1998, PASP, 110, 863
- Stritzinger et al. (2005) Stritzinger, M., Suntzeff, N. B., Hamuy, M., et al. 2005, PASP, 117, 810
- Weiler et al. (2018) Weiler, M., Jordi, C., Fabricius, C., & Carrasco, J. M. 2018, ArXiv e-prints [arXiv:1802.01667]
- Westera et al. (2002) Westera, P., Lejeune, T., Buser, R., Cuisinier, F., & Bruzual, G. 2002, A&A, 381, 524