11email: dwe@ast.cam.ac.uk 22institutetext: Institut del Ciències del Cosmos (ICC), Universitat de Barcelona (IEEC-UB), c/ Martí i Franquès, 1, 08028 Barcelona, Spain 33institutetext: INAF – Osservatorio di Astrofisica e Scienza dello Spazio di Bologna, via Gobetti 93/3, 40129 Bologna, Italy 44institutetext: Institute for Astronomy, University of Edinburgh, Royal Observatory, Blackford Hill, Edinburgh EH9 3HJ, UK 55institutetext: Kavli Institute for Cosmology Cambridge, Madingley Road, Cambridge, CB3 0HA, UK 66institutetext: INAF - Osservatorio Astronofisico di Arcetri, Largo Enrico Fermi 5, 50125, Firenze, Italy 77institutetext: Space Science Data Center - ASI, Via del Politecnico SNC, 00133 Roma, Italy 88institutetext: STFC, Rutherford Appleton Laboratory, Harwell, Didcot, OX11 0QX, UK 99institutetext: INAF-Osservatorio Astronomico di Roma, Via Frascati 33, 00078, Monte Porzio Catone (Roma), Italy 1010institutetext: Leicester Institute of Space and Earth Observation and Department of Physics and Astronomy, University of Leicester, University Road, Leicester LE1 7RH, UK 1111institutetext: Leiden Observatory, Leiden University, Niels Bohrweg 2, 2333 CA Leiden, The Netherlands 1212institutetext: INAF-Osservatorio Astronomico d’Abruzzo, Via Mentore Maggini SNC, 64100 Teramo, Italy 1313institutetext: Laboratoire d’Astrophysique de Bordeaux, Univ. Bordeaux, CNRS, B18N, Allée Geoffroy Saint-Hilaire, 33615 Pessac, France 1414institutetext: Department of Astronomy, University of Geneva, Ch. des Maillettes 51, CH-1290 Versoix, Switzerland 1515institutetext: Department of Astronomy, University of Geneva, Ch. d’Ecogia 16, CH-1290 Versoix, Switzerland 1616institutetext: McWilliams Center for Cosmology, Carnegie Mellon University, 5000 Forbes Ave, 15213, USA 1717institutetext: Institut d’Estudis Espacials de Catalunya (IEEC), C/ Gran Capità 2-4, E08034 Barcelona, Spain 1818institutetext: Department of Astrophysics/IMAPP, Radboud University, P.O. Box 9010, 6500GL Nijmegen, The Netherlands 1919institutetext: Warsaw University Astronomical Observatory, Al. Ujazdowskie 4, 00-478 Warszawa, Poland
Gaia Data Release 2
Abstract
Aims. We describe the photometric content of the second data release of the Gaia project (Gaia DR2) and its validation along with the quality of the data.
Methods. The validation was mainly carried out using an internal analysis of the photometry. External comparisons were also made, but were limited by the precision and systematics that may be present in the external catalogues used.
Results. In addition to the photometric quality assessment, we present the best estimates of the three photometric passbands. Various colour-colour transformations are also derived to enable the users to convert between the Gaia and commonly used passbands.
Conclusions. The internal analysis of the data shows that the photometric calibrations can reach a precision as low as 2 mmag on individual CCD measurements. Other tests show that systematic effects are present in the data at the 10 mmag level.
Key Words.:
Astronomical data bases; Catalogues; Surveys; Instrumentation: photometers; Techniques: photometric; Galaxy: general;1 Introduction
The launch of the ESA Gaia satellite mission (Gaia Collaboration et al. 2016b) in December 2013 marked the start of an exciting period for more than 400 people that are part of the Data Processing and Analysis Consortium (DPAC) and for the astronomical scientific community in general. The first catalogue, released in September 2016 (Gaia DR1 Gaia Collaboration et al. 2016a), already showed the enormous potential of the Gaia astrometric and photometric data, leading to the publication of almost 300 refereed papers in the first year after the release. The Gaia DR1 photometric catalogue contained a measurement of the average flux in the band for over 1.1 billion sources (van Leeuwen et al. 2017). No colour information was released at that time, with the consequence that many photometric investigations required cross-matching the Gaia catalogue with other photometric catalogues to acquire photometry in some additional bands, with the effect of reducing the number of usable sources and possibly introducing some inconsistencies due to the different origins of the photometry.
The second data release (Gaia DR2) in April 2018 (Gaia Collaboration et al. 2018) presents a significant advance in all photometric investigations by providing photometry in the band for approximately 1.7 billion sources and in the integrated and bands for approximately 1.4 billion sources calibrated to a consistent and homogeneous photometric system. The release also includes the results of two applications of the Gaia photometry: a catalogue of astrophysical parameters (effective temperature and line-of-sight extinction for stars brighter than and luminosity and radius whenever good parallaxes were available, see Andrae et al. 2018) and epoch data for a sample of variable stars (more than 0.5 million sources classified as RR Lyrae, Cepheids, Delta Scuti, LPV, and SX Phe type stars, see Holl et al. 2018). Additional validation covering other aspects of the data release can be found in the general validation paper (Arenou et al. 2018).
This paper focusses on the photometric aspects of Gaia DR2. In Sect. 2 we present the photometric content of the data release. Section 3 provides an overview of the data that contributed to the generation of the photometric catalogue with a focus on the differences with respect to Gaia DR1. The following sections show various aspects of the internal validation activities and provide a detailed view of the quality of the photometric data. Sections 4 and 5 focus on the results of the calibration process. Section 6 presents a statistical analysis of the source photometry. Section 7 shows the results of the validation of the Gaia photometry with respect to other catalogues. Some known issues are also described, and guidelines for users are given in the final sections. A metric that can help identifying sources that may be affected by blending due to image crowding, and faint-end biases linked to background effects, is presented in Sect. 8. The Gaia DR2 passbands and zeropoints and their validation is the topic of Sect. 9. The statistical properties of the three subsets of the photometric catalogue produced by slightly different calibration procedures are described in Sect. 10. Section 11 describes a few aspects of the epoch photometry released for variable sources. Appendix A presents colour-colour transformations between the Gaia passbands and other photometric systems as implemented in various surveys. An approach to correct the Gaia magnitudes for effects of saturation at the bright end is recommended in Appendix B. Finally, Appendix C contains a list of acronyms and Gaia-specific terminology used in this paper.
2 Photometric content of Gaia DR2
The second Gaia photometric catalogue contains the latest -band photometry for all sources and and photometry for 80% of them. The mean photometric measurements have been obtained by processing epoch photometry collected over a period of about 670 days of mission operations.
The broad passband covers the range nm, and its definition is optimized to collect the maximum of light for the astrometric measurements. The and photometry instead are derived from the integration of the blue and red photometer (BP and RP) low-resolution spectra covering the ranges nm and nm. These wavelength ranges are those defined in the pre-mission specification (Jordi et al. 2010). The numerical values corresponding to the three passbands are part of Gaia DR2 together with the definition of the photometric zeropoints. The passband definition is distributed in electronic tabular format as part of this paper and is available via the VizieR service.
One of the main challenges in the Gaia photometric processing is due to the large number of different instrument configurations that are possible during the acquisition of an observation (Riello et al. 2018). This results in effectively different instruments that need to be calibrated to a homogeneous system. As of today, no external catalogue is available that would offer the accuracy and amount of data required for calibrating such a complex instrument. For this reason, the definition of a reference system that is homogeneous over the entire set of instrument configurations must rely on the Gaia data itself. External data are only used to link the internal photometric reference system to the absolute one. For a detailed description of the principles of the photometric calibration and the difference between internal and external calibration see Carrasco et al. 2016.
The -band photometry included in Gaia DR2 is the result of a new reduction and is based on a much extended period of mission operations (more than eight additional months) in comparison with the Gaia DR1 catalogue. The internal photometric system was re-initialised using the available data and is therefore expected to be different from the system defined for Gaia DR1. In particular, a colour term between the two systems is expected. The passbands published in Gaia DR2 are only applicable to the Gaia DR2 photometry.
It is important to keep in mind that the actual source catalogue is different and should be treated as a new catalogue superseding the one published in Gaia DR1. Even though the two catalogues will have many source identifiers in common, the corresponding sources may be defined by different lists of epoch measurements, effectively leading to different sets of astrometric and photometric properties (Castañeda et al. 2018).
Figure 1 shows the all-sky view of the colour distribution based on the Gaia DR2 photometric catalogue. Each pixel in the colour sky map is colour-coded according to the median colour () of all sources brighter than falling in the corresponding area in the sky.
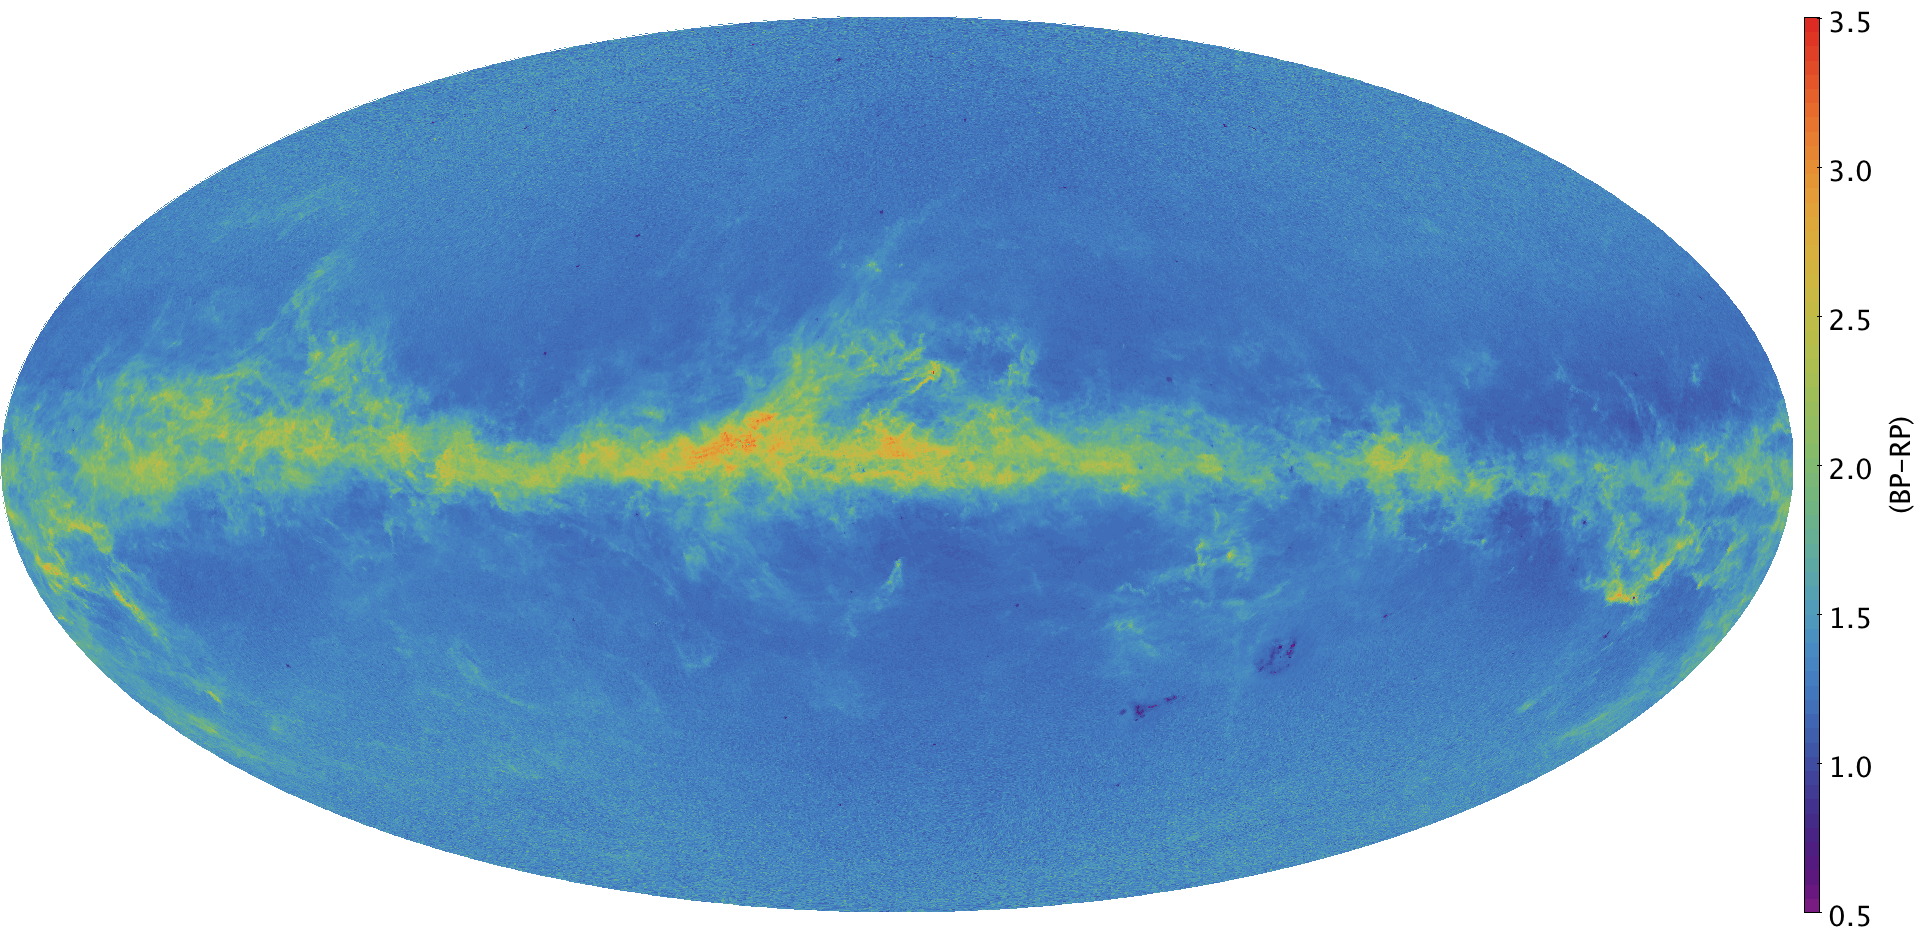
The colour sky distribution offers a taste of the extraordinary potential and quality of the photometric data released in Gaia DR2. High-extinction star-forming regions close to the Galactic plane stand out in the colour map as a result of reddening effects.
3 Input data
To facilitate the understanding of the rest of this paper, we briefly introduce some characteristics of the Gaia satellite and instruments. Many more details are provided in Gaia Collaboration et al. 2016b. The Gaia satellite scans the sky approximately along great circles. The scanning strategy has been optimised to maximise the scientific performance of the mission and does not cover the entire sky homogeneously: different areas will be observed with different frequency and will have more observations than other regions in the sky. The fields of view (FoVs) of the two telescopes on board overlap onto the focal plane of all charge-coupled devices (CCDs) used for the photometry. The light is integrated while it crosses a CCD in the along-scan (AL) direction. Gates have been implemented on the Gaia CCDs to reduce the effective exposure time of an observation in the case of bright sources by limiting the area of the CCD in which integration takes place. Twelve different gate configurations (including the no-gate case) can be activated in configurable magnitude ranges. Observations are limited to a small area (window) centred on the detected sources. Different window sizes and shapes are used on board, depending on the on-board estimated magnitude. These are referred to as window classes. Different gate and window class configurations effectively constitute different instruments that need to be calibrated to the same system.
The photometric data in the three bands , , and come from different CCDs on the focal plane: measurements in the broad band are taken in the astrometric field (AF) CCDs, while the and fluxes are integrated over the low-resolution spectra collected in the BP and RP CCDs.
The rest of this section describes the input data, focussing on the differences with respect to Gaia DR1. Many more details on the input data and on the processing leading to Gaia DR2 are available in Riello et al. 2018.
The Gaia processing within DPAC is organized in cycles. At each cycle new, recent data are added to the processing, and improved algorithms and models are deployed in all systems feeding each other, thus potentially leading to higher quality results. This applies in particular to the second cycle of operations (leading to Gaia DR2), where the input data covered a significantly longer period of operations, results from other systems became available to the photometric processing, and updated and more sophisticated algorithms were adopted in the data processing to produce a more accurate and complete catalogue than the one released in Gaia DR1.
The data entering the process of calibrating the -band photometry are the image parameters, that is, flux and centroid location within the window, that are part of the Gaia intermediate data. These are first determined on a daily basis as soon as the data are downloaded from the satellite in the system; this is known as initial data treatment (Fabricius et al. 2016). A further, more sophisticated and consistent, image parameter determination (IPD) runs at the beginning of each cycle of operations and covers all data from the start of operations (intermediate data update, IDU, see Lindegren et al. 2018, and the online Gaia DR2 documentation at this link111http://gaia.esac.esa.int/documentation/). While for Gaia DR1 the daily image parameters were used, Gaia DR2 is purely based on the updated cyclic values. This also implies a more complete input dataset, eliminating the various interruptions in the daily systems particularly in the first months of mission when operations were still being established. An additional improvement coming from the usage of cyclic image parameters is due to the better handling of saturated data for as compared to what was done in the daily chain.
The and photometric processing uses the raw data directly (i.e. the unpacked telemetry) and therefore requires some pre-processing steps to be performed to generate the input data for the calibration process. The algorithms and procedures used in the pre-processing for Gaia DR2 are similar to those in place for Gaia DR1, the only exception being the usage of the astrophysical coordinates of the sources determined from Gaia data itself (Lindegren et al. 2018). The source astrometry, together with the satellite attitude and the geometry of the instrument, are used to predict the location of each source within the observing window. This is particularly important when a wavelength calibration of the positions along scan within a spectral window is required. As the photometric calibration is based on detailed colour information extracted from the low-resolution spectra by integrating in specific bands within the wavelength range covered by the BP and RP instruments, it is clear that an accurate wavelength calibration is necessary (Carrasco et al. 2016). In the processing that led to Gaia DR1, an extrapolation of the source position from the astrometric field onto the BP and RP CCDs was adopted for the geometric and wavelength calibration. For Gaia DR2, this has been replaced by a prediction based on the source astrophysical coordinates, the satellite attitude, and an assumed nominal geometry thanks to the high accuracy of the AGIS (Lindegren et al. 2018) results available at the start of photometric processing. The resulting geometric calibration consists of a set of corrections to the adopted nominal geometry.
A much improved cross-match algorithm (Castañeda et al. 2018) led to a cleaner source catalogue and a better removal of detection artefacts. The Gaia cross-match is unusual in the sense that it is not simply assigning observations to a pre-defined list of sources, but is also creating the source list and continuously adding new sources as required, starting from the data itself. This is necessary given the much higher resolution and efficiency at detecting faint sources by Gaia in all sky regions. This difficult task is complicated by the presence of a significant number of spurious detections. For Gaia DR2, the algorithms in place for cleaning the input observations from such artefacts and for performing the clustering analysis that eventually lead to the generation of the source catalogue have been improved thanks to the experience gained in the previous processing cycle.
In terms of the photometric processing itself, several improvements were made with respect to the processing done for Gaia DR1. Most of these were triggered by the results of the validation and various investigations based on the results of the first cycle of operations. In the following, we list the most relevant changes. For more details on the photometric processing improvements in Gaia DR2 with respect to the first release, see Riello et al. (2018).
A significant improvement in the photometric catalogue was achieved by a more robust accumulation of the epoch photometric measurements to generate the mean source photometry, with outlier rejection driven by a careful statistical analysis (see Section 4.5 in Riello et al. 2018).
The validation of the Gaia DR1 photometry showed systematic differences in the internal photometric system at magnitude and which correspond to configuration changes in the windowing scheme adopted on board (i.e. causing differences in window shape and size for different observations). The systematic differences arose because only a small fraction of sources were observed in more than one configuration. Their magnitude is sufficiently close to the magnitude boundary of each configuration to be observed with different configurations in different transits. The precision of the on-board magnitude estimate at and means that the useful range of magnitude is rather small. This implies that the calibration process may initially converge to different photometric systems for different configurations and that a consistent system over the entire set of configurations may only be reached with very many iterations. A first attempt at calibrating out the offsets in the photometric systems defined for each configuration was made in the first cycle of operations and showed promising results. This was further improved for Gaia DR2 by introducing time dependency in the calibration of the links between different instrumental configurations (see Section 4.3 in Riello et al. 2018).
The period of operations covered by Gaia DR1 was heavily affected by rapid and discontinuous variations in the satellite throughput due to water-based contamination of the satellite instrument components (Gaia Collaboration et al. 2016b). The increased level of systematics in the input data constituted one of the main challenges for the photometric calibration in the first cycle of processing. The input data for Gaia DR2, however, contain a long stretch of more than one year in which the contamination effect was quite low and stable. The photometric processing strategy was therefore adapted to take advantage of this period for the initialisation of the reference system (see Section 4.2 in Riello et al. 2018).
Finally, a full external calibration of the internal system onto the absolute Vega photometric system allowed reconstructing the true passbands. These constitute an important addition to the release.
At this stage in the mission, the processing is still unable to handle some non-nominal data. Observations obtained with more than one gate activated at different times within the window have not been processed. These situations occur when a bright source is observed at a time sufficiently close to another (fainter) source to trigger the activation of a gate for a period that only partly overlaps the observation period of the fainter source. Truncated windows are currently also excluded from the stream of input data. These are caused by the overlap on the CCD of two or more windows and are likely to happen in particularly dense regions. As described before, the two FoVs of Gaia are both projected onto the same focal plane and therefore non-dense regions may experience a high number of complex gate or truncated window cases if the other FoV points towards a dense region. BP and RP observations are also more likely to be collected in these non-nominal configurations given the much longer windows assigned to them.
At this stage, the data available are in some cases not sufficient or not of sufficient quality to produce a reliable calibration. This is especially true for some combination of gate and window configurations that are in principle not expected but occur nevertheless because sources of different magnitudes are observed simultaneously. In some cases, this also affects the bright end of the data, where the very limited number of sources makes the calibration process more challenging. This will affect the completeness of the epoch data, but is not expected to significantly affect the mean photometry, except possibly for very bright sources ().
Some short periods of observations have been excluded from the input data because the scientific quality of the corresponding data is poor. These periods correspond to the activities of refocus and of decontamination, when several components of the instruments where heated to vaporise the water-based contaminant, thereby compromising the thermal stability of the instrument. The exact ranges are given in Riello et al. (2018). These gaps do not affect the completeness of the mean photometric catalogue, but will cause short gaps in the epoch photometry.
4 Study of LS and SS calibration coefficients
The photometric calibration is defined by two sets of calibrations that describe different instrumental effects. These are referred to as large- and small-scale calibrations: the large-scale (LS) calibration describes features that vary smoothly across the focal plane but vary rapidly, while the small-scale (SS) calibration takes into account effects that change slowly but may only affect a small section of the CCD, even a single pixel column. It is convenient to separate these effects because many more data need to be accumulated to calibrate out the response of a single pixel column than what is needed to determine the overall response of a CCD with respect to others. On the other hand, the overall response can change quite rapidly (and at times in a discontinuous fashion, as in the case of decontamination or refocus events), and therefore our LS calibration needs to be able to quickly adjust to these changes.
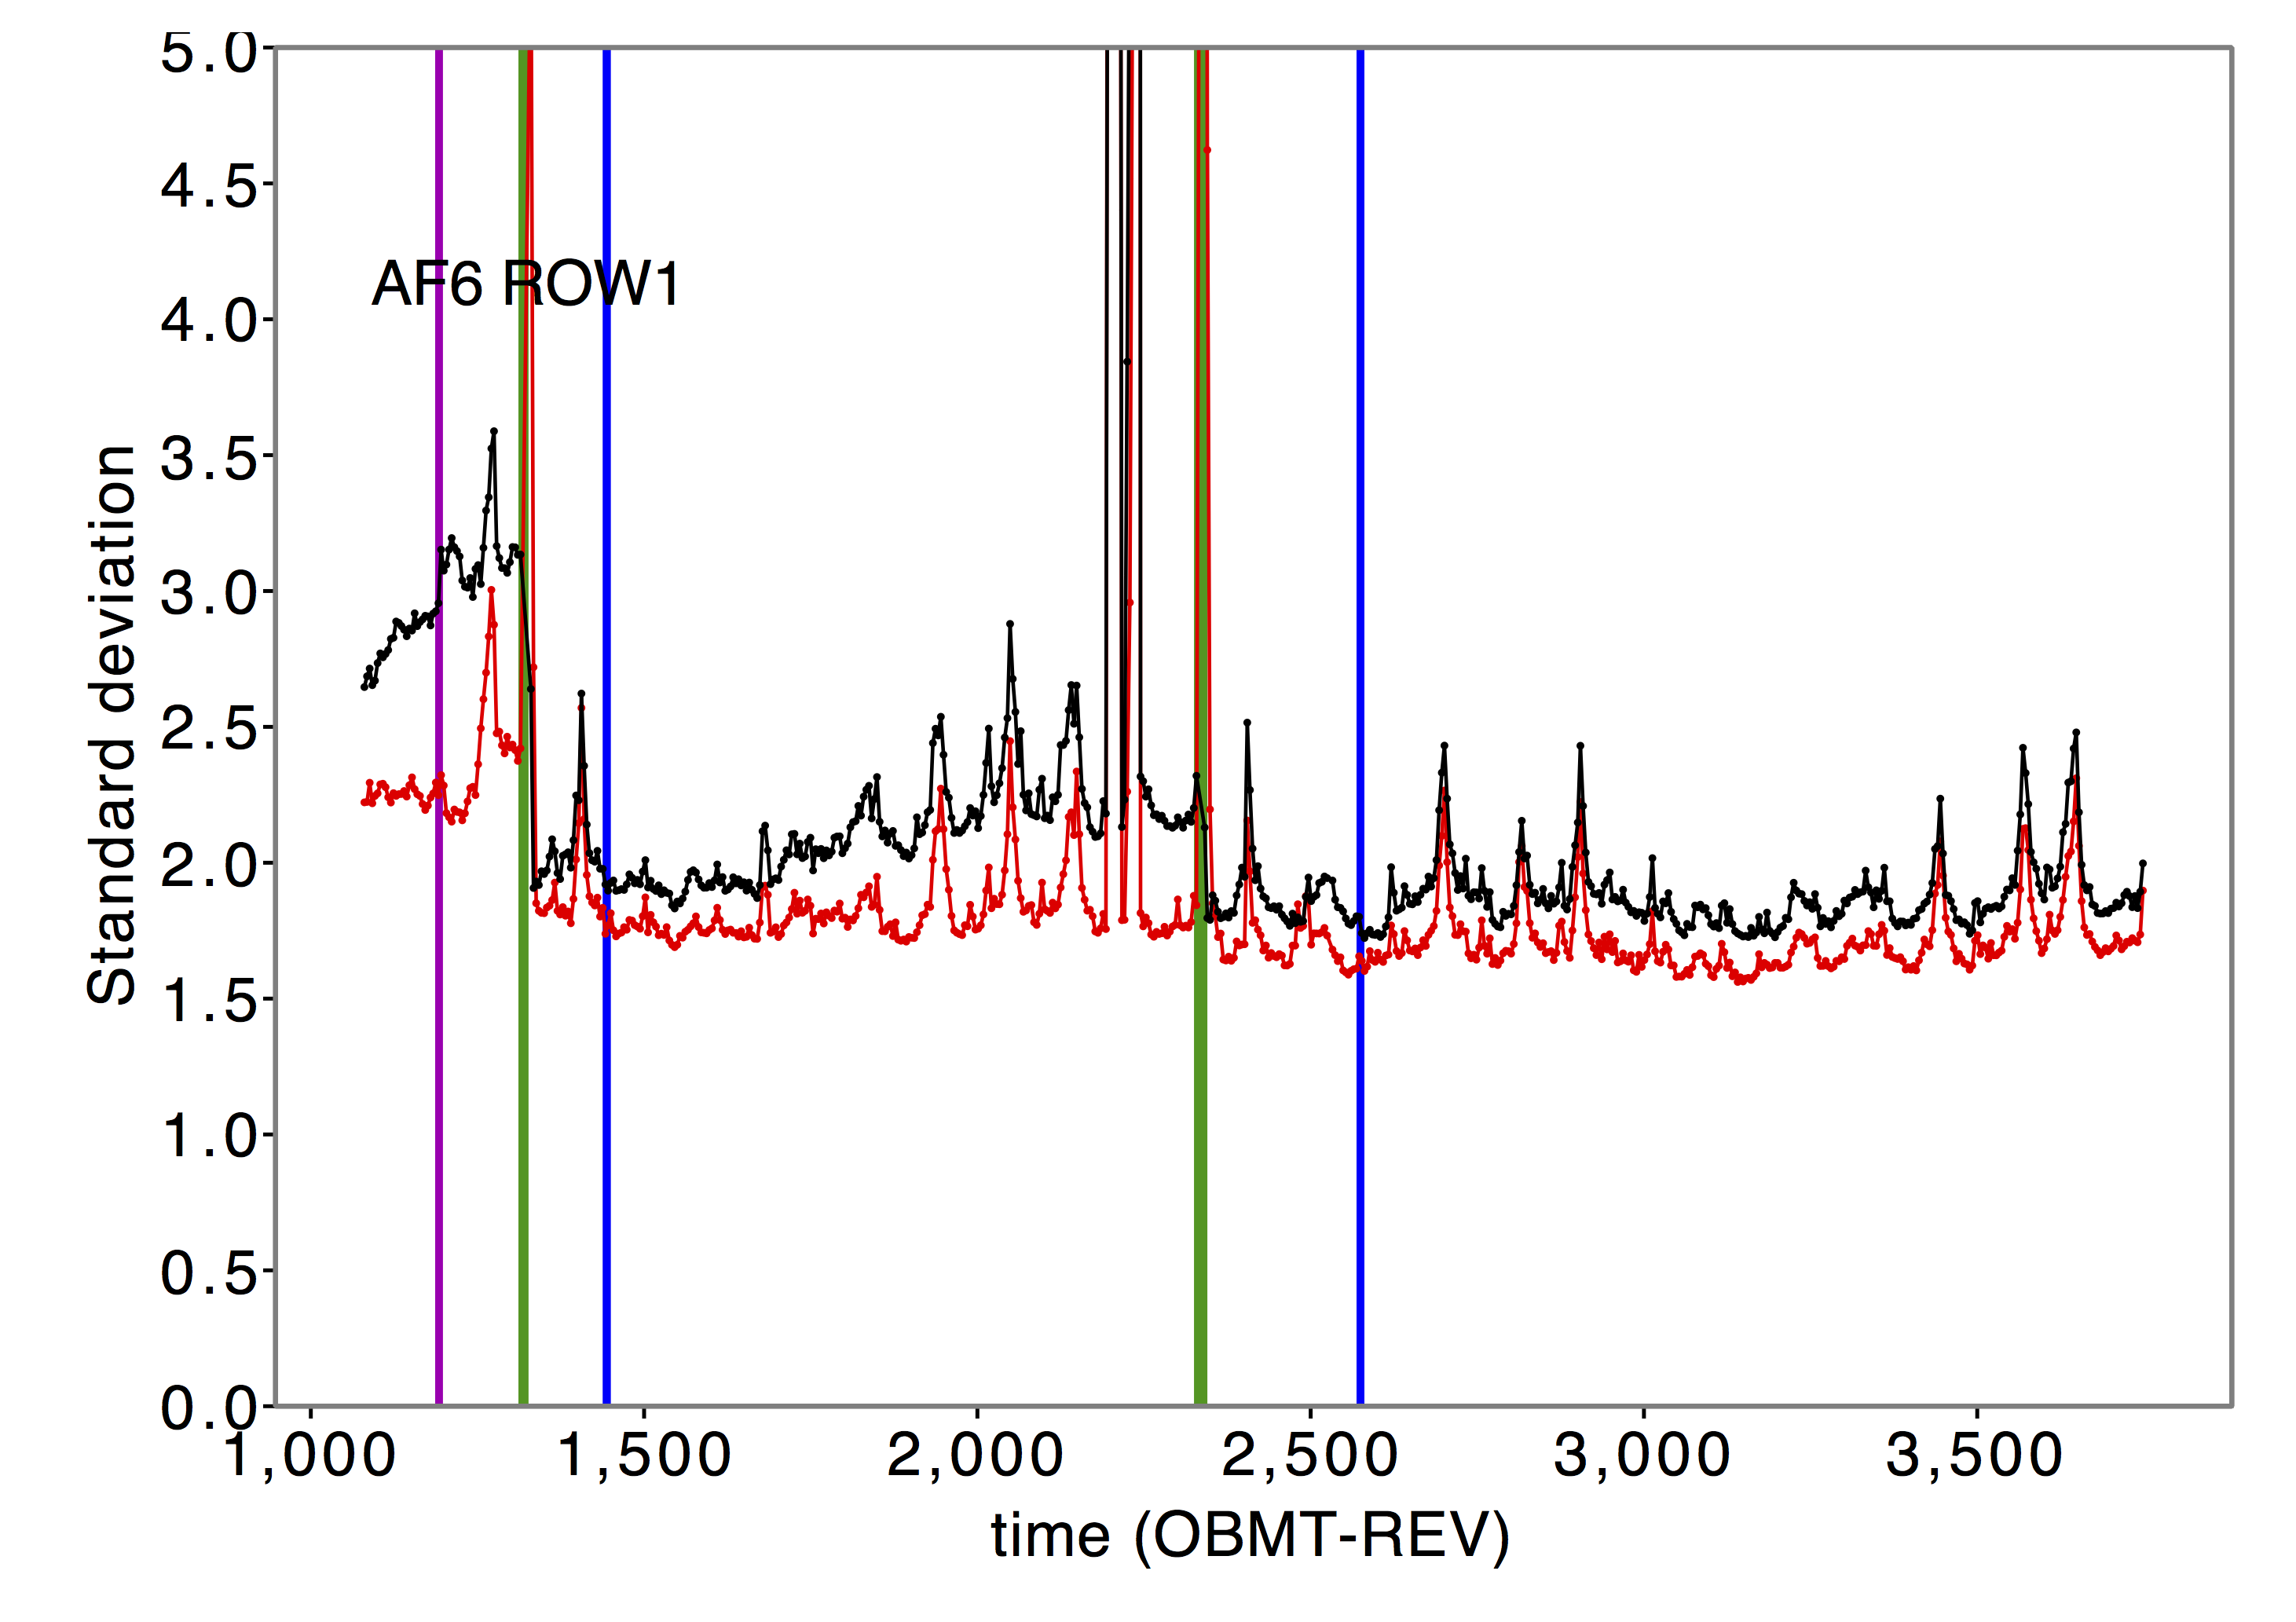
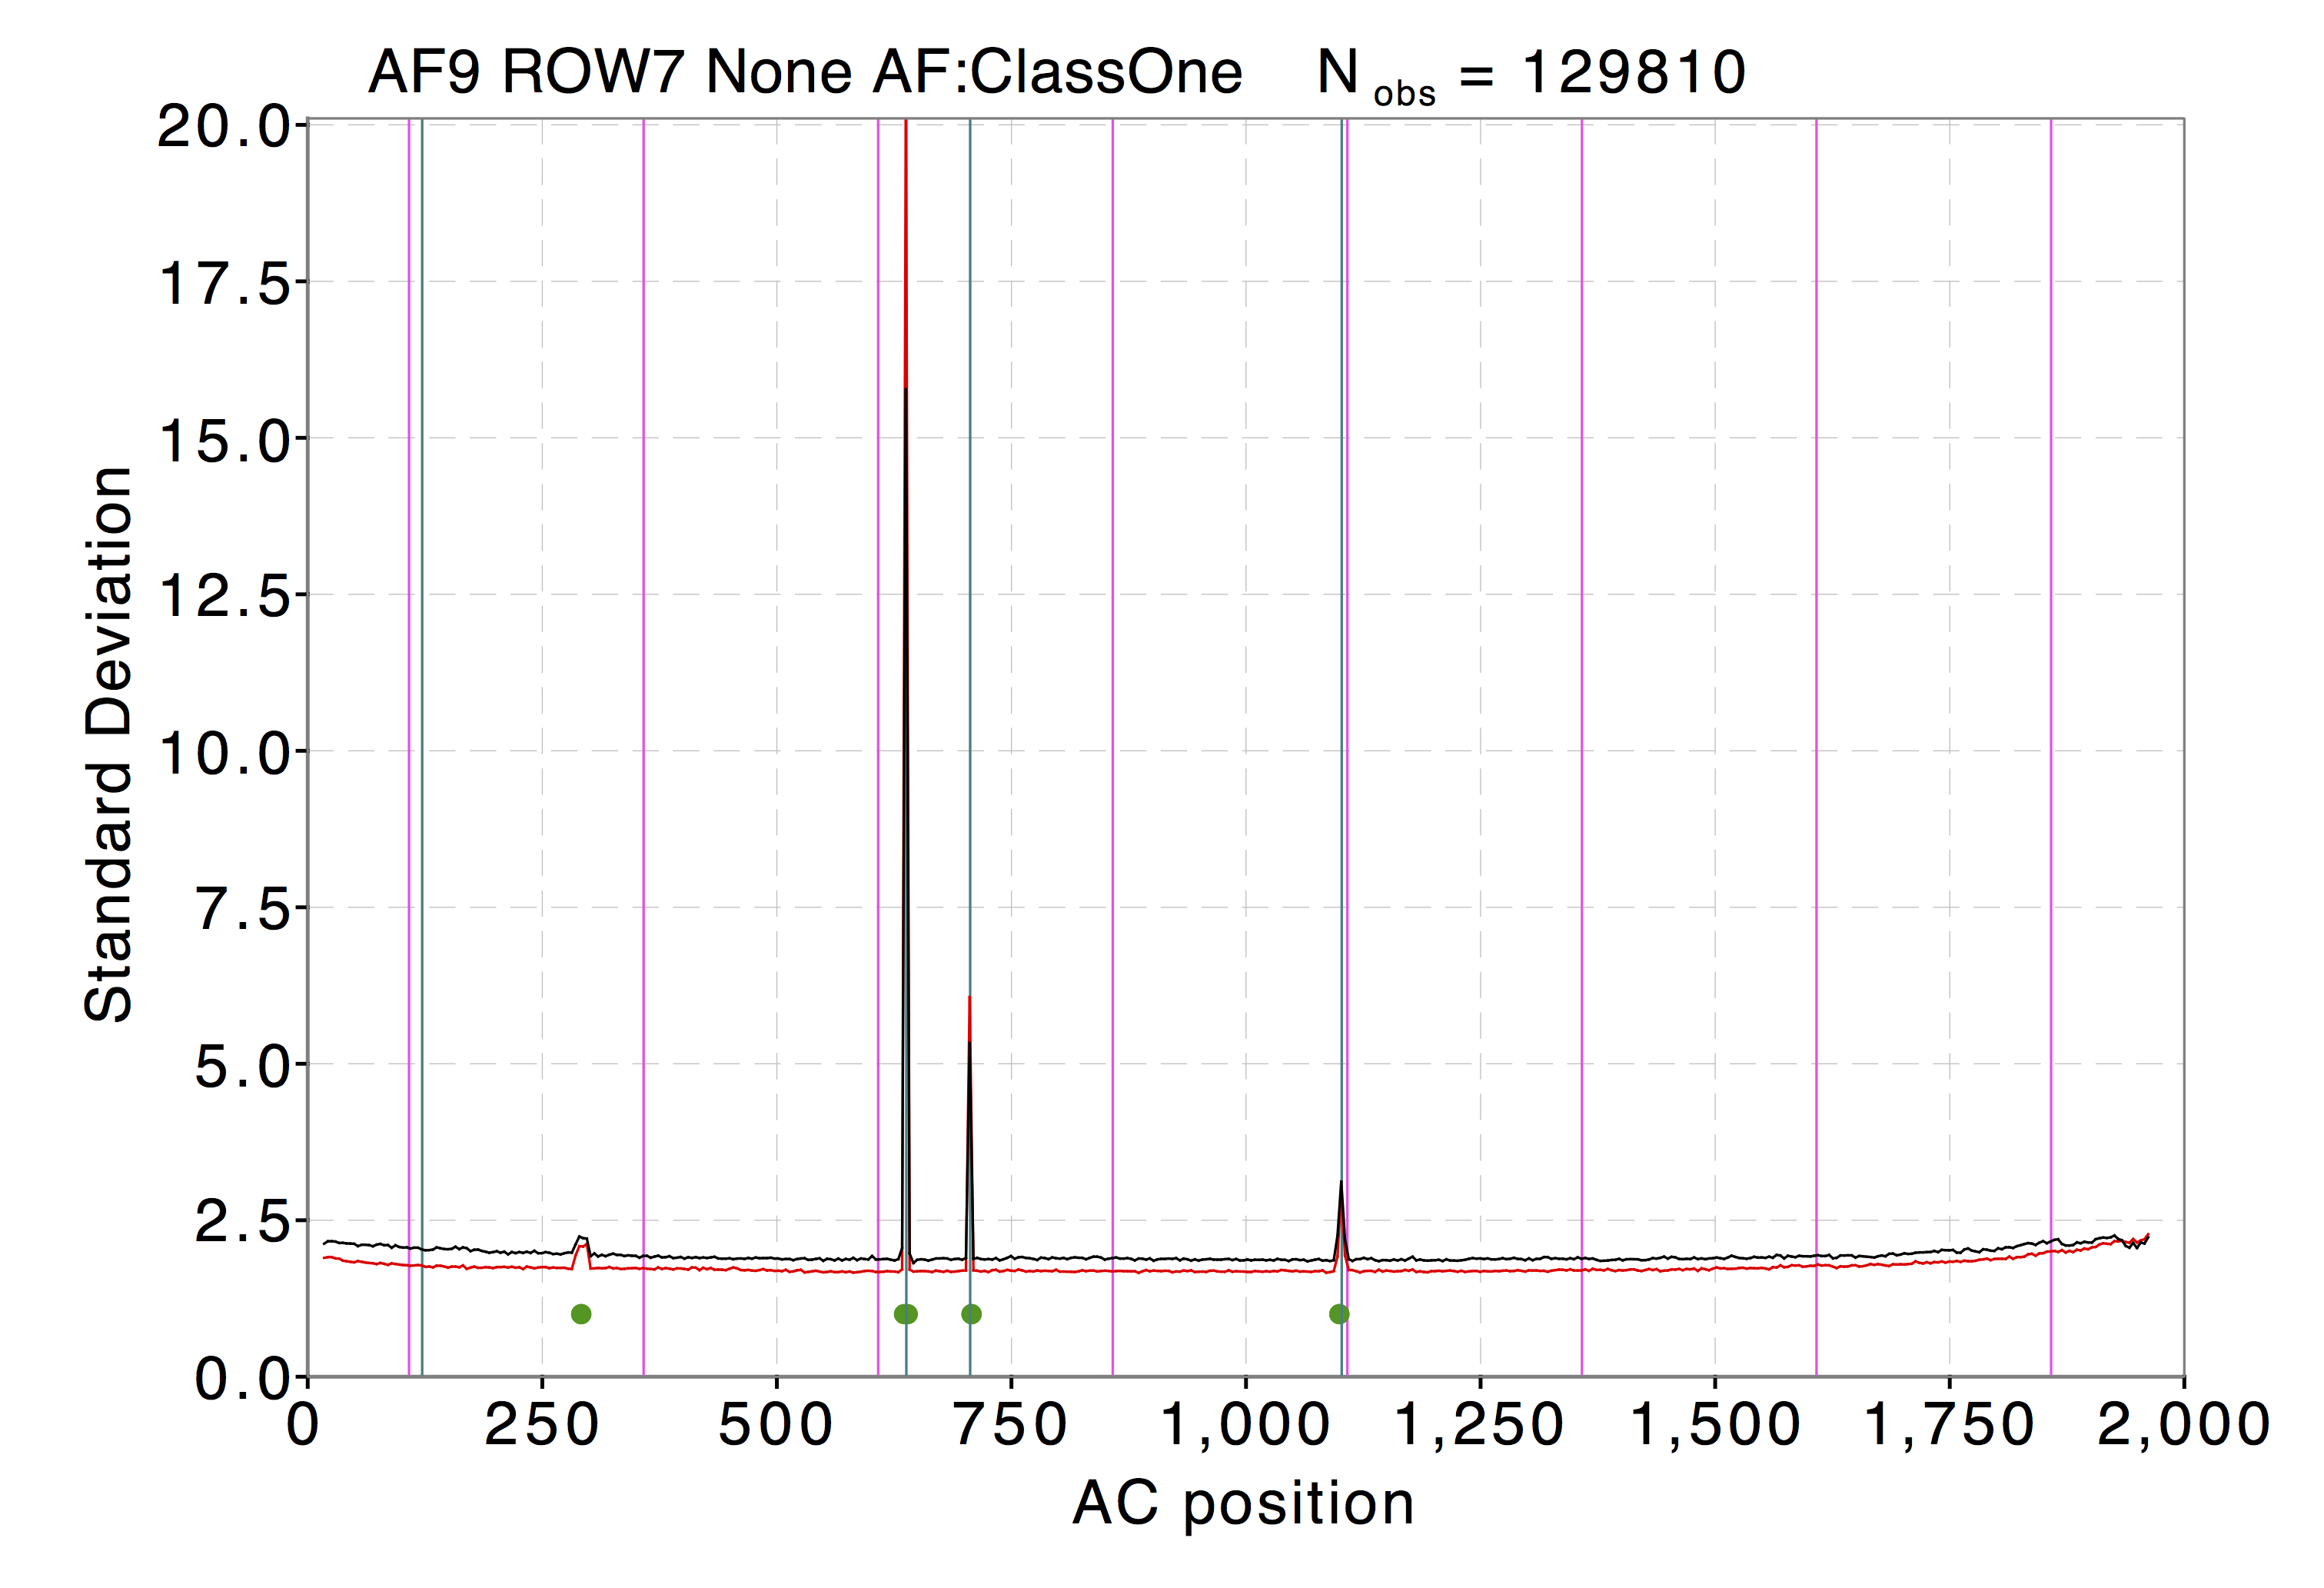
Similar to the processing carried out for the first data release, the calibration coefficients and quality statistics for the LS and SS calibrations were analysed to assess the overall quality of the photometry and to indicate where improvements might be necessary. Updated versions of the plots in Evans et al. (2017) are shown in Figs. 2 to 5. The unit-weight standard deviation is defined as the square root of the normalised chi-square (van Leeuwen 2007) and gives an indication of how good the solution model is. When the systematic effects have all been removed and the quoted errors are representative of the underlying distribution, this value should be around 1.0.
The significant change that has occurred in the standard deviation plots is that the overall levels have improved. This is a consequence of the better handling of the formal uncertainties on the image parameters and within the calibrations. There is also consistency between the median standard deviation values of the LS and SS calibrations for comparable magnitude ranges. This is to be expected since the most recent iteration of the SS calibration is applied to the observations used by the LS calibrations, and vice versa (Carrasco et al. 2016). For Window Class 1222see Gaia Collaboration et al. (2016b) and Gaia Collaboration et al. (2016a) for more details on the windowing and gating strategy used for the Gaia observations., which has a magnitude range of , the median standard deviation is 1.8 compared to an average of 5.0 for the LS calibrations in Gaia DR1. The value being higher than the expected value of 1.0 indicates that either the formal uncertainties are underestimated or that additional terms are needed in the calibration models. This does not affect the uncertainty on the weighted mean fluxes since the measured scatter is taken into account in the calculation, as described in Carrasco et al. (2016) and Riello et al. (2018).
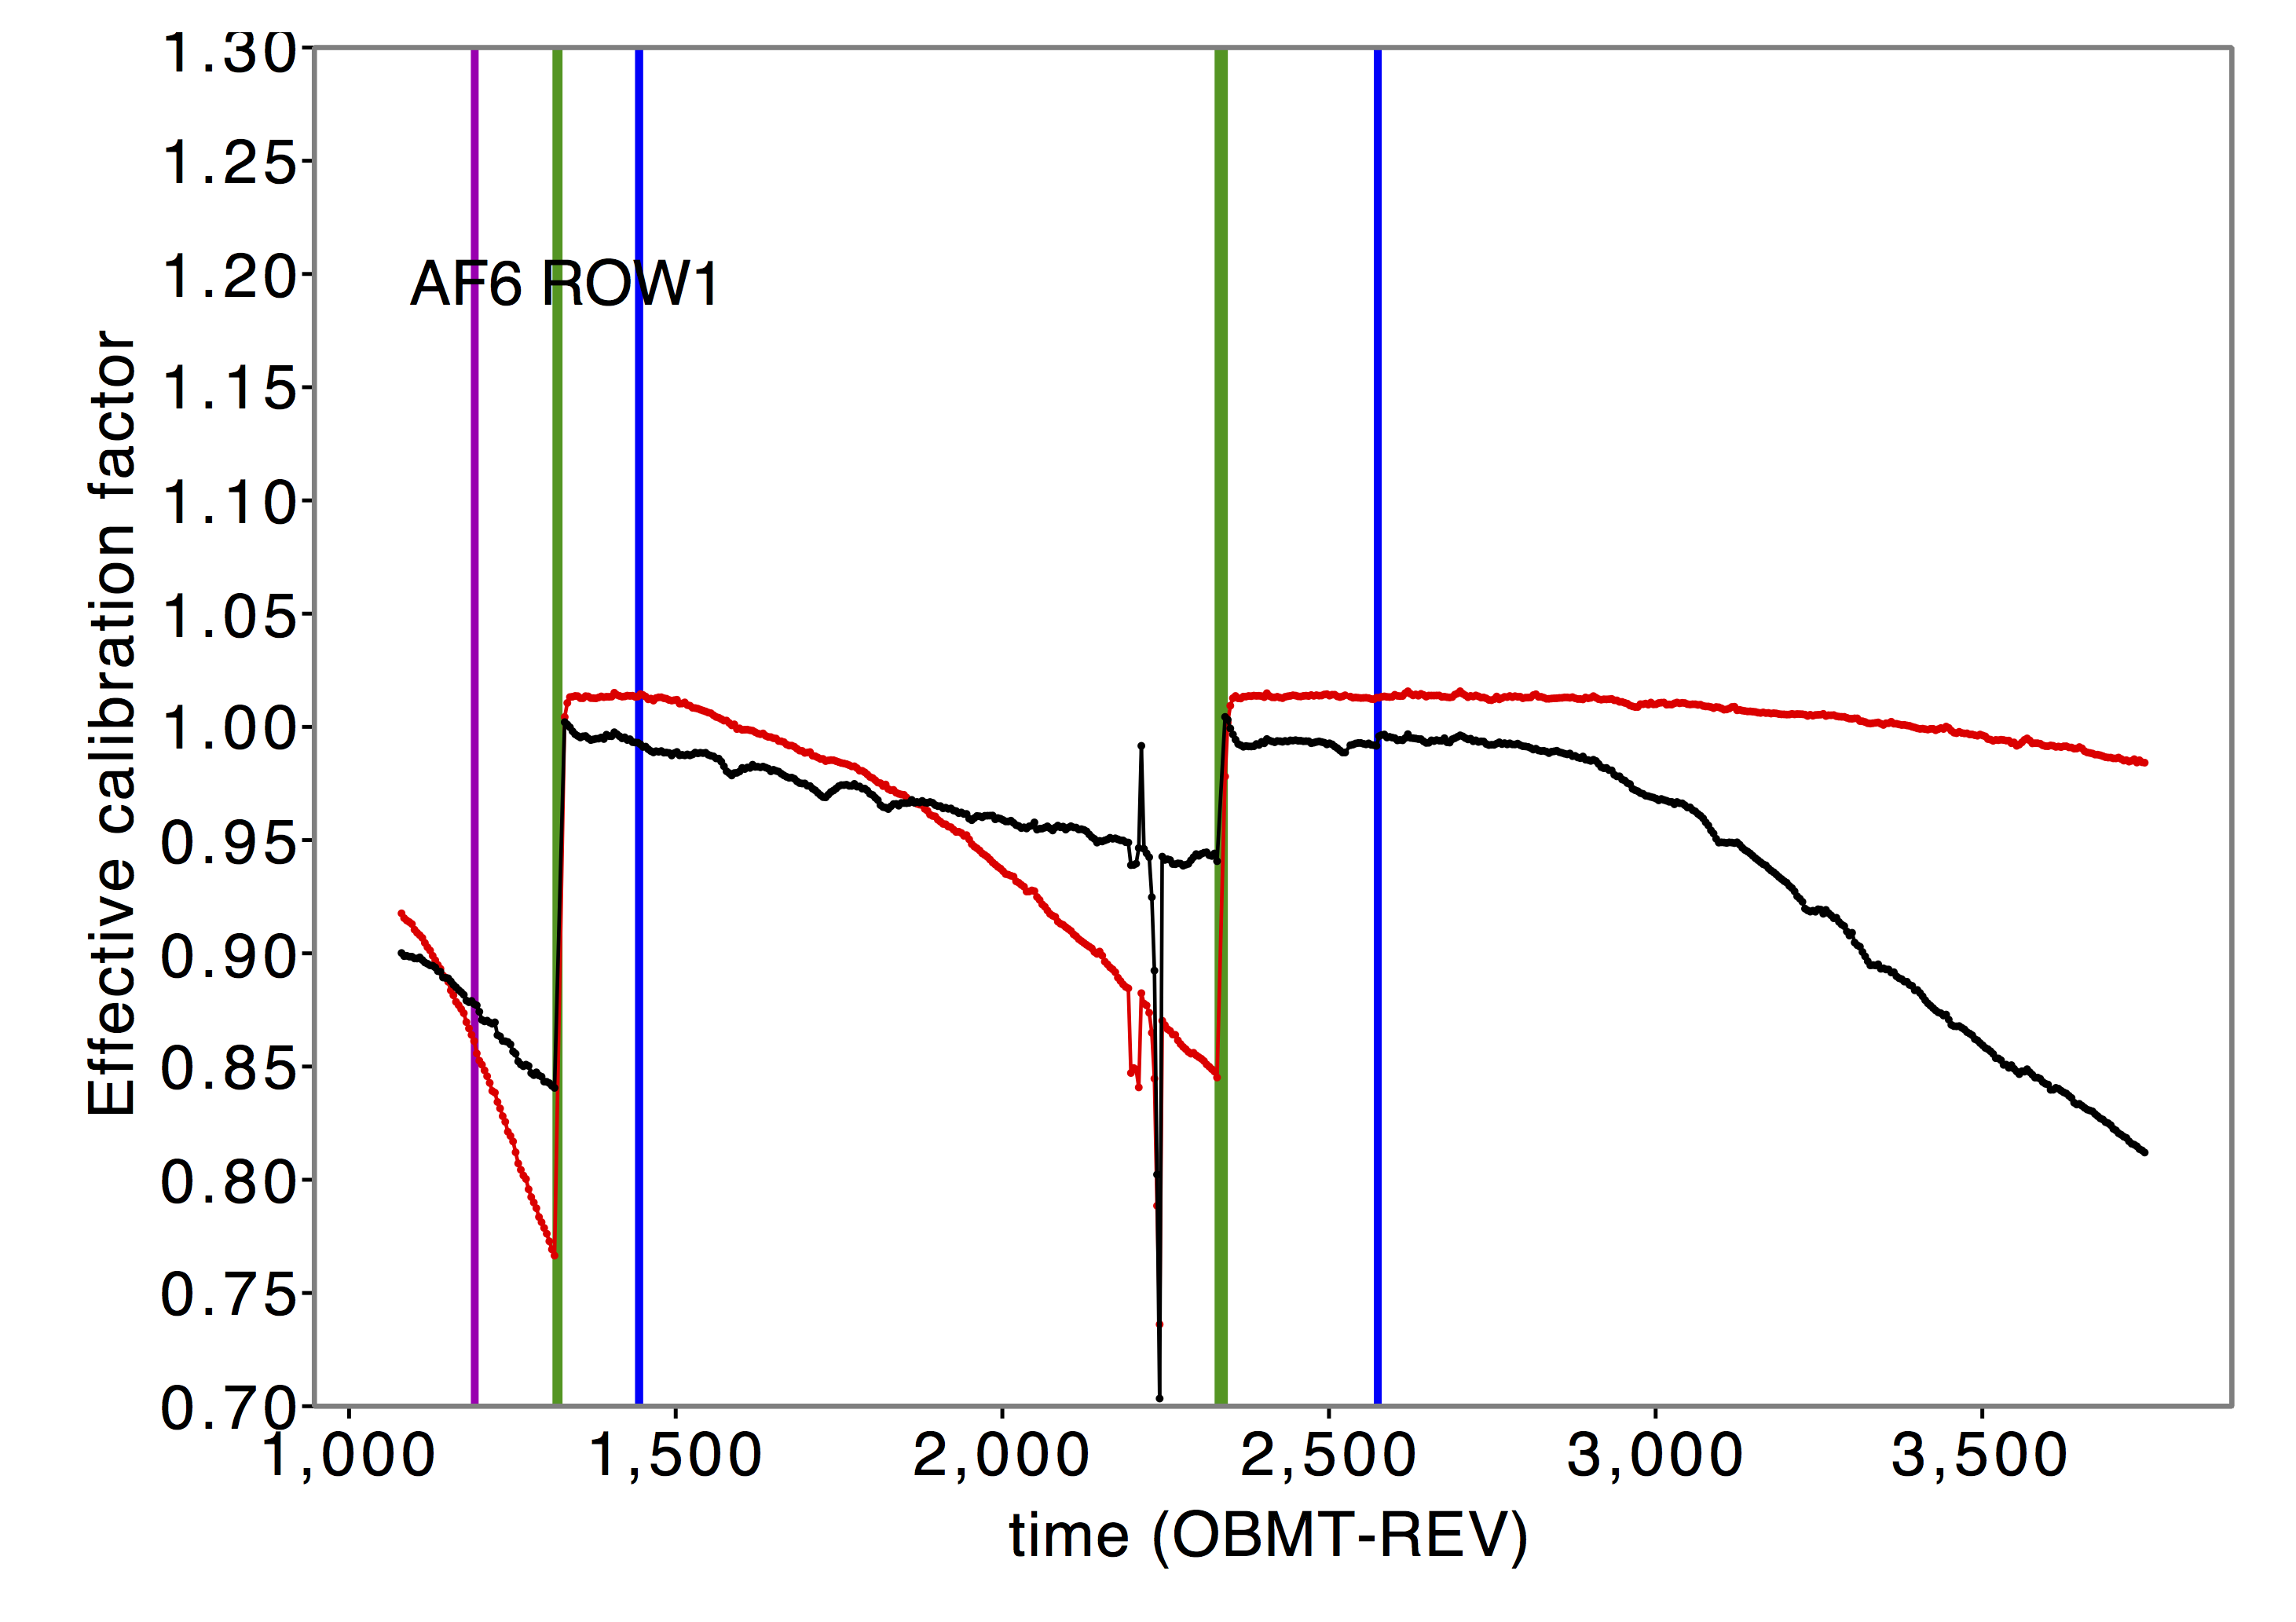
For the LS calibration, more features can be seen in Fig. 2 compared to the previous release because the standard deviation values are improved (Evans et al. 2017). While some of the peaks correspond to anomalous calibrations that are still causing problems, the majority of the peaks seen are caused by major planets in the FoV. By comparing the standard deviation in Fig. 2 with the calibration factor in Fig. 4, it can be seen that the planet crossings that caused the three large peaks in the standard deviation around OBMT-REV 2000 have not affected the derived calibration factors.
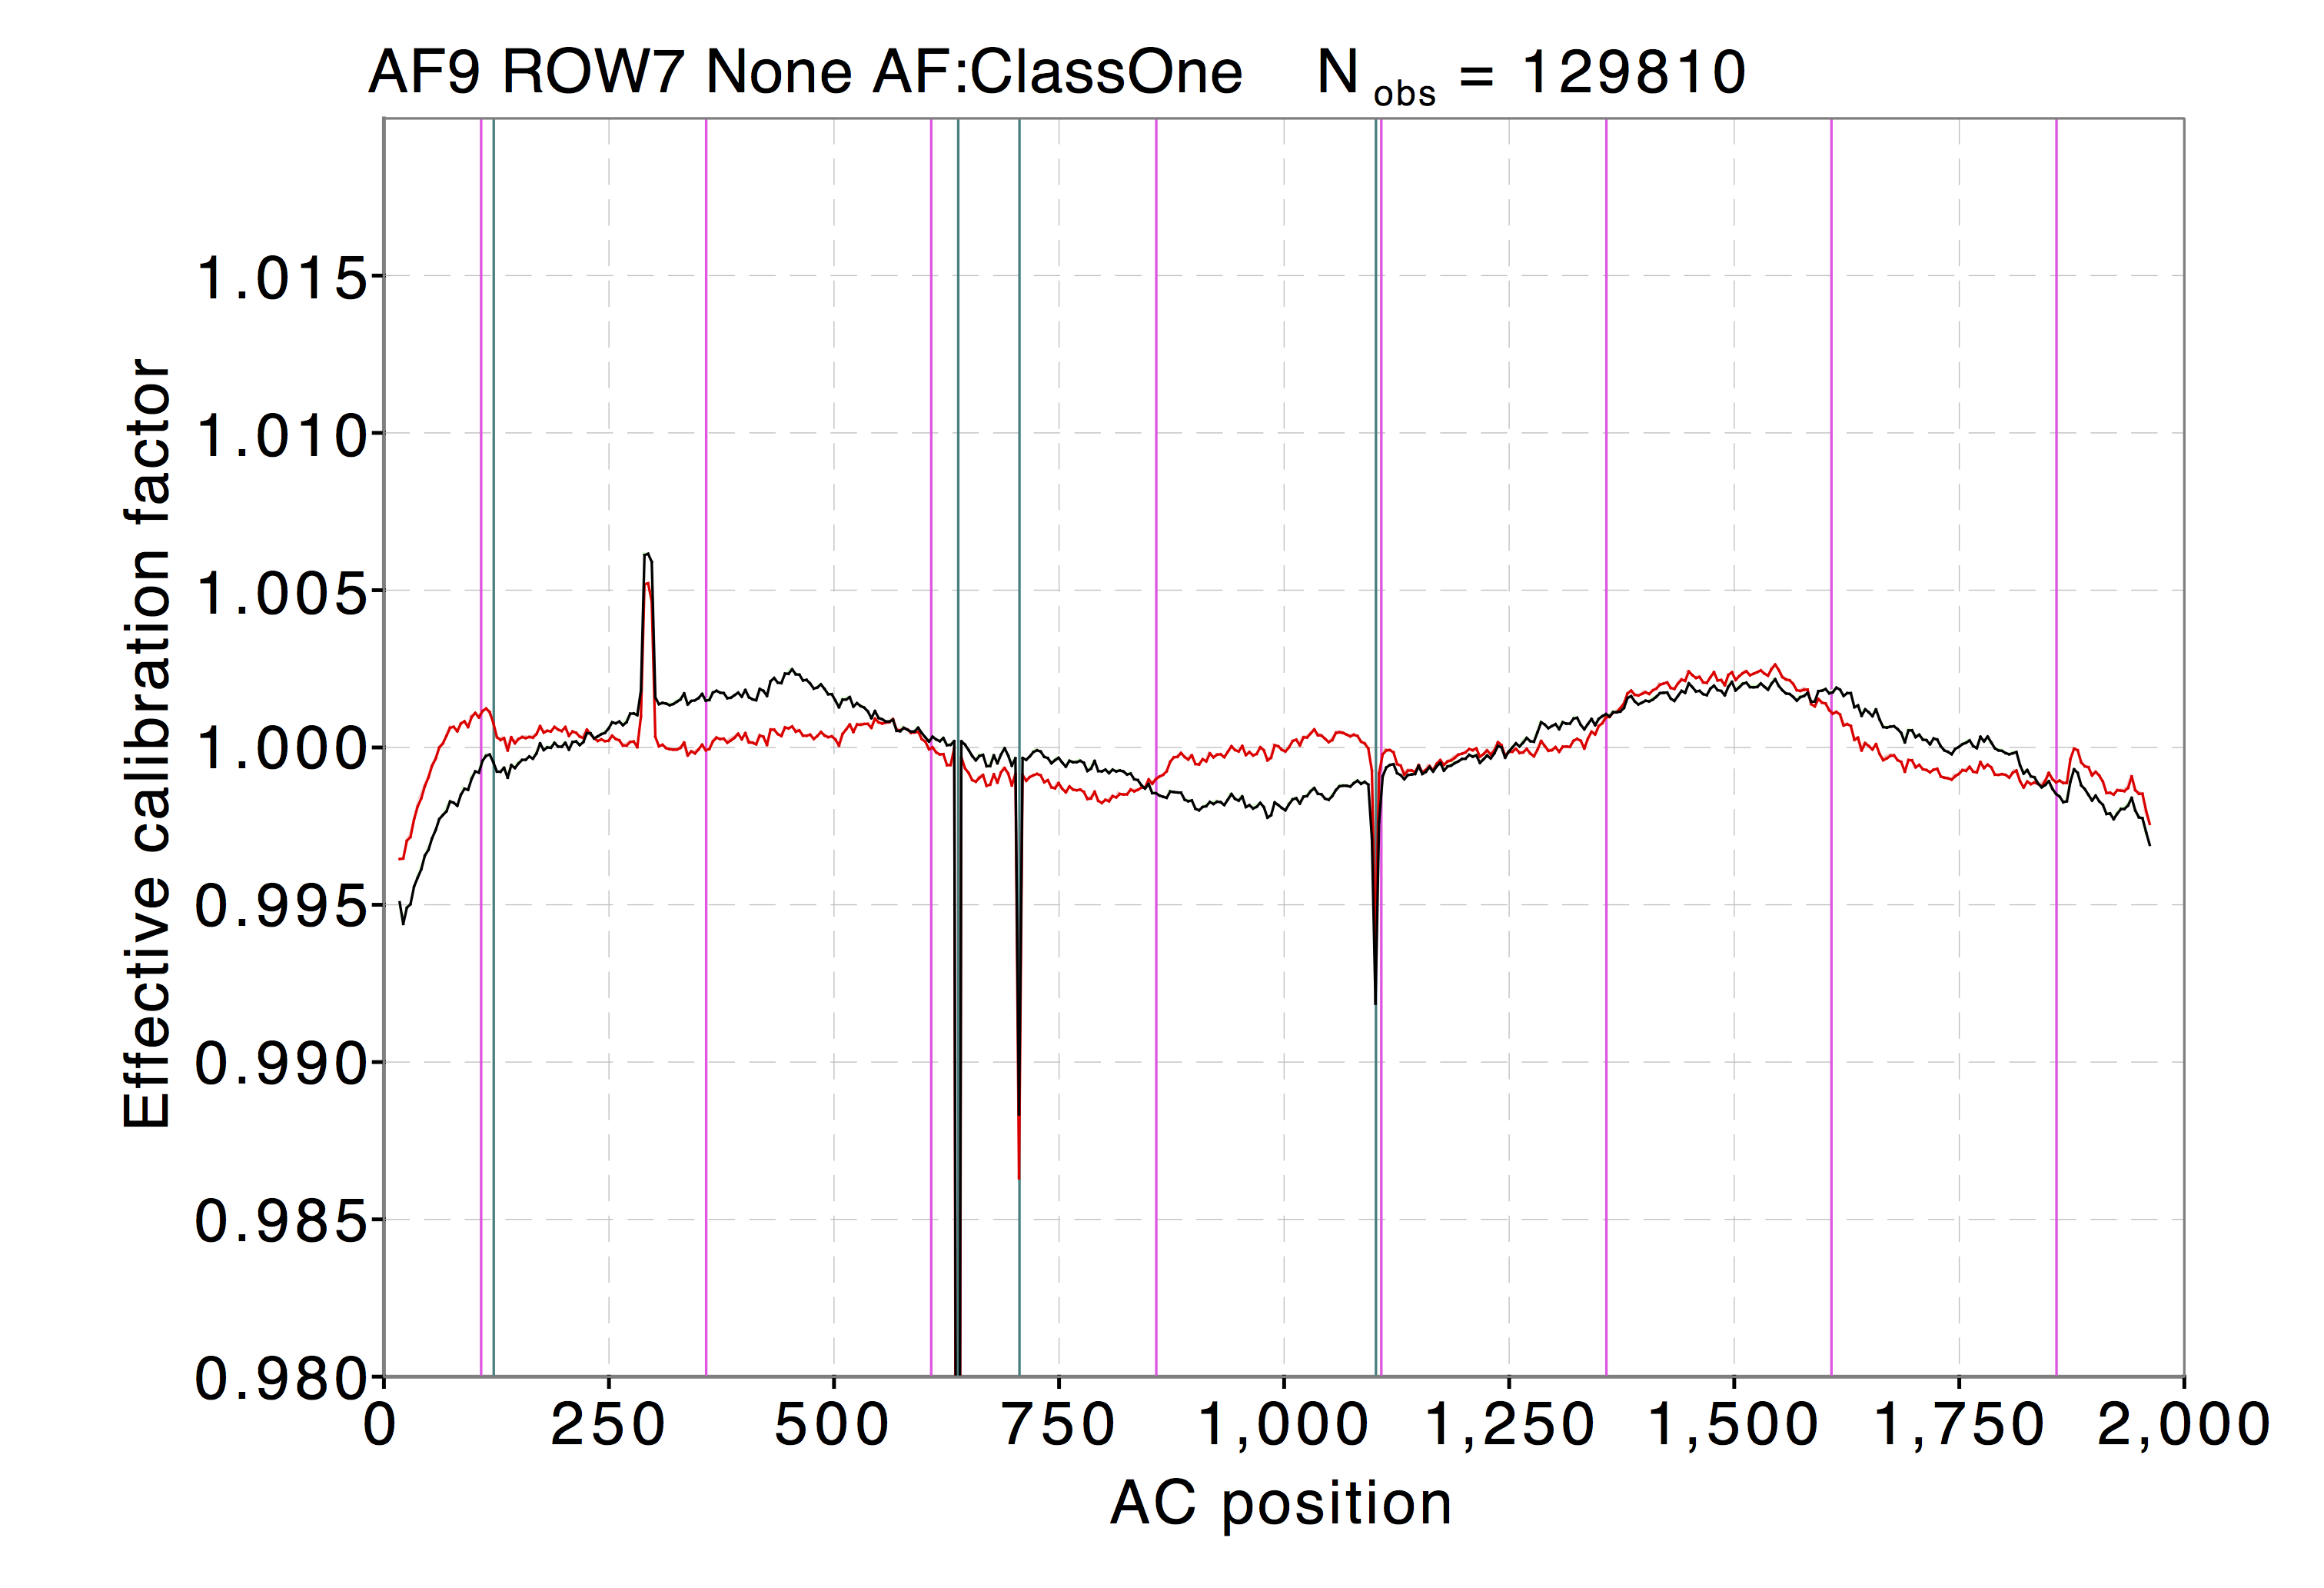
In Fig. 3, the only difference compared to Gaia DR1 is the small peak at about an across-scan (AC) position of 300. At this position, a feature is seen in the dark signal calibrations and might indicate that some slight improvement could be made. However, this is a very small effect and has been mainly accounted for by the SS calibration, see Fig. 5.
Figure 4 shows an example of the time evolution of the effective calibration factor from the LS calibrations. This is defined as the multiplicative factor to be applied to the observed flux to obtain its calibrated value. The factor is different for sources with different colour and for different AC coordinates; the effective value shown here corresponds to a default set of colour terms and the centre of the CCD. The main features seen here are the effect of the change in response that is due to the changing levels of contamination on the mirrors and CCDs, see Gaia Collaboration et al. (2016b). Just before the second decontamination (green line), the contamination is worse in the following FoV, while at the end of the period used for Gaia DR2, the contamination is worse in the preceding FoV.
As pointed out in Evans et al. (2017), the effective calibration factor from the SS calibrations, see Fig. 5, is equivalent to a 1D flat field. While there is an overall slowly changing difference between the two FoVs, many of the detailed low-level peaks are in common, indicating that the SS calibration measures the CCD response variation at the sub-millimagnitude level and that these peaks are not due to noise.
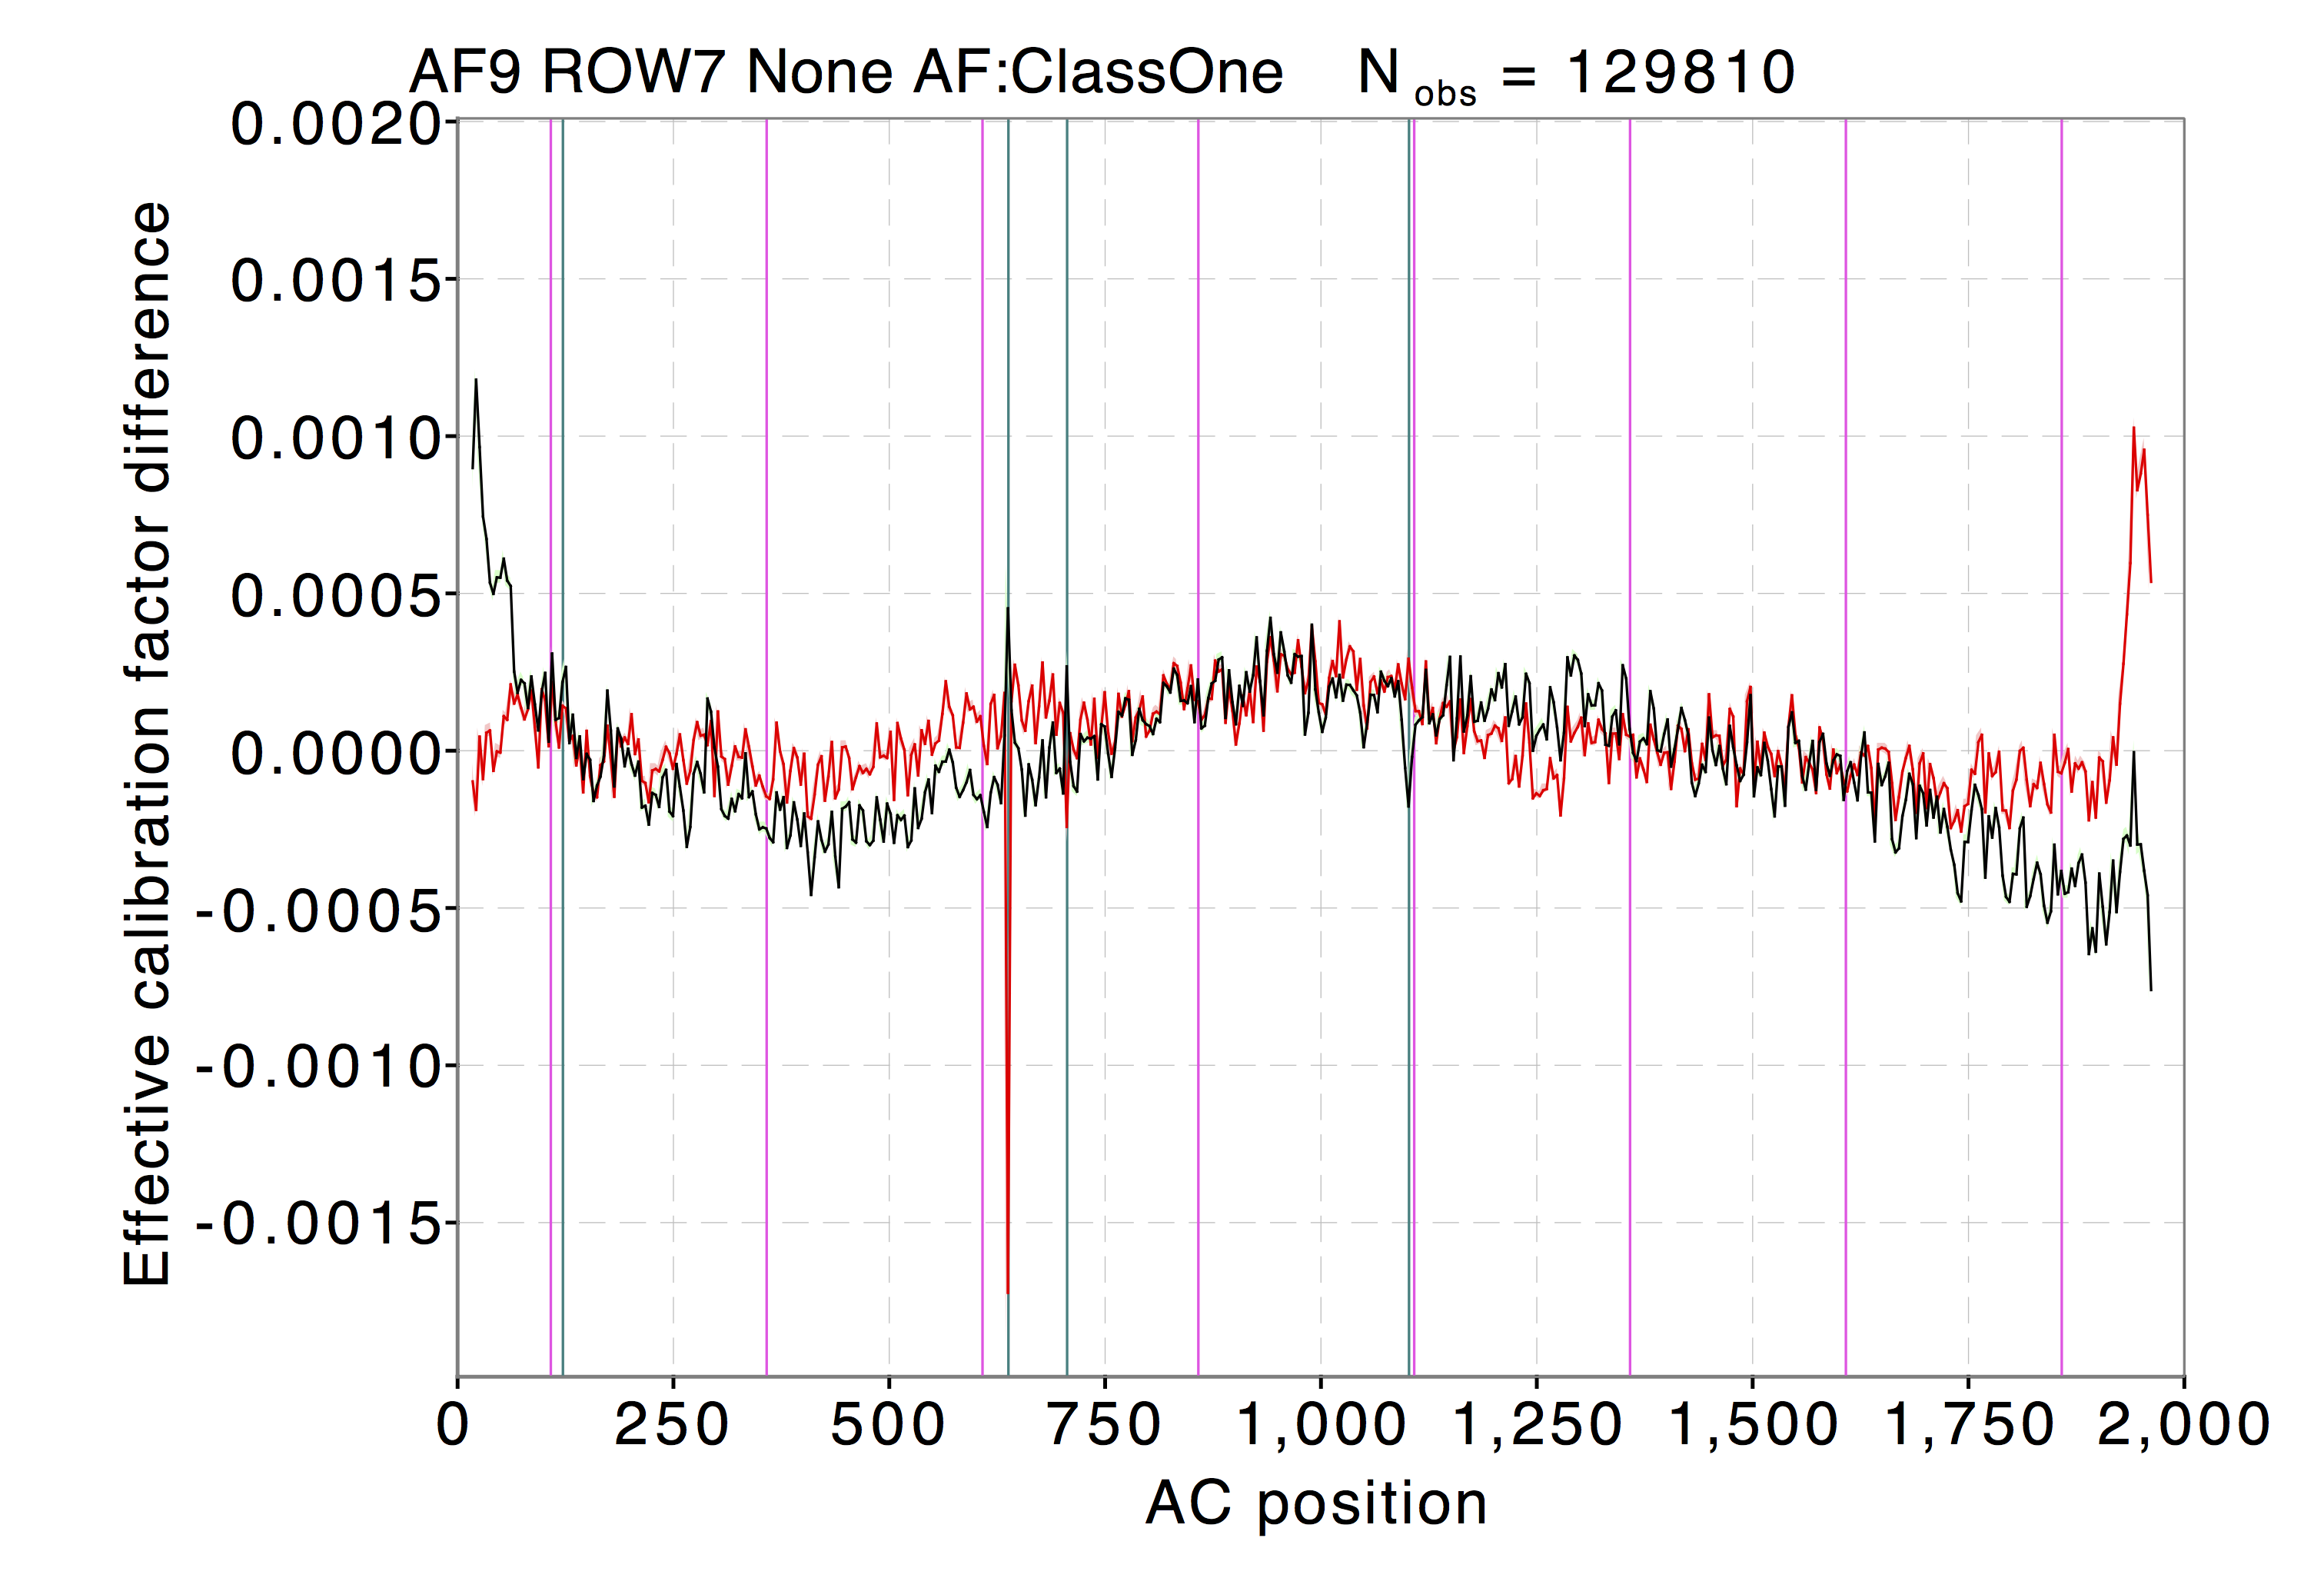
For the SS calibrations, the observations were split into two periods, see Riello et al. (2018). Figures 3 and 5 refer to calibrations from the initialisation period following the second decontamination. Figure 6 shows the difference between two sets of calibrations from the two periods and shows that the magnitude of the differences is very small. Some features between the two FoVs appear to be in common, indicating that these are real changes in the CCD response on the timescale of one year. However, this is approaching the noise level of these calibrations. The standard deviation of the difference between the two sets of calibrations is less than 0.5 mmag for all Window Classes and thus does not raise concerns about the frequency of the SS calibrations.
5 Convergence of the large-scale calibrations

As described in Carrasco et al. (2016) and Riello et al. (2018), a series of iterations of the LS and SS calibrations are carried out in order to establish the internal photometric system. To check the convergence of the system, an L1 norm metric is used, as described in Evans et al. (2017). Figure 7 shows this convergence metric as a function of iteration number for -band Window Class 2 calibrations, covering the fainter magnitudes (). The black line shows the usual metric using a representative range of colour parameters. Although this drops to a low value (1.2 mmag), it does not converge to zero as might be expected. This is probably due to the noise level in determining the calibrations and represents a limit in the achievable calibration precision. To test this idea further, the L1 norm metric was also calculated using a default colour system formed from an average set of colour parameters (red line in Fig. 7). In this case, the noise associated with the colour terms of the LS calibrations does not contribute to the metric, and thus it drops to a lower level (0.3 mmag) as expected. The convergence results for Window Class configurations brighter than Window Class 2 show marginally better results.
In future development cycles, it is intended to develop a metric based on the changes in the reference fluxes between iterations since this would directly measure the stability of the photometric system. The current system shown here effectively measures this by proxy.
6 Analysis of source photometry statistics
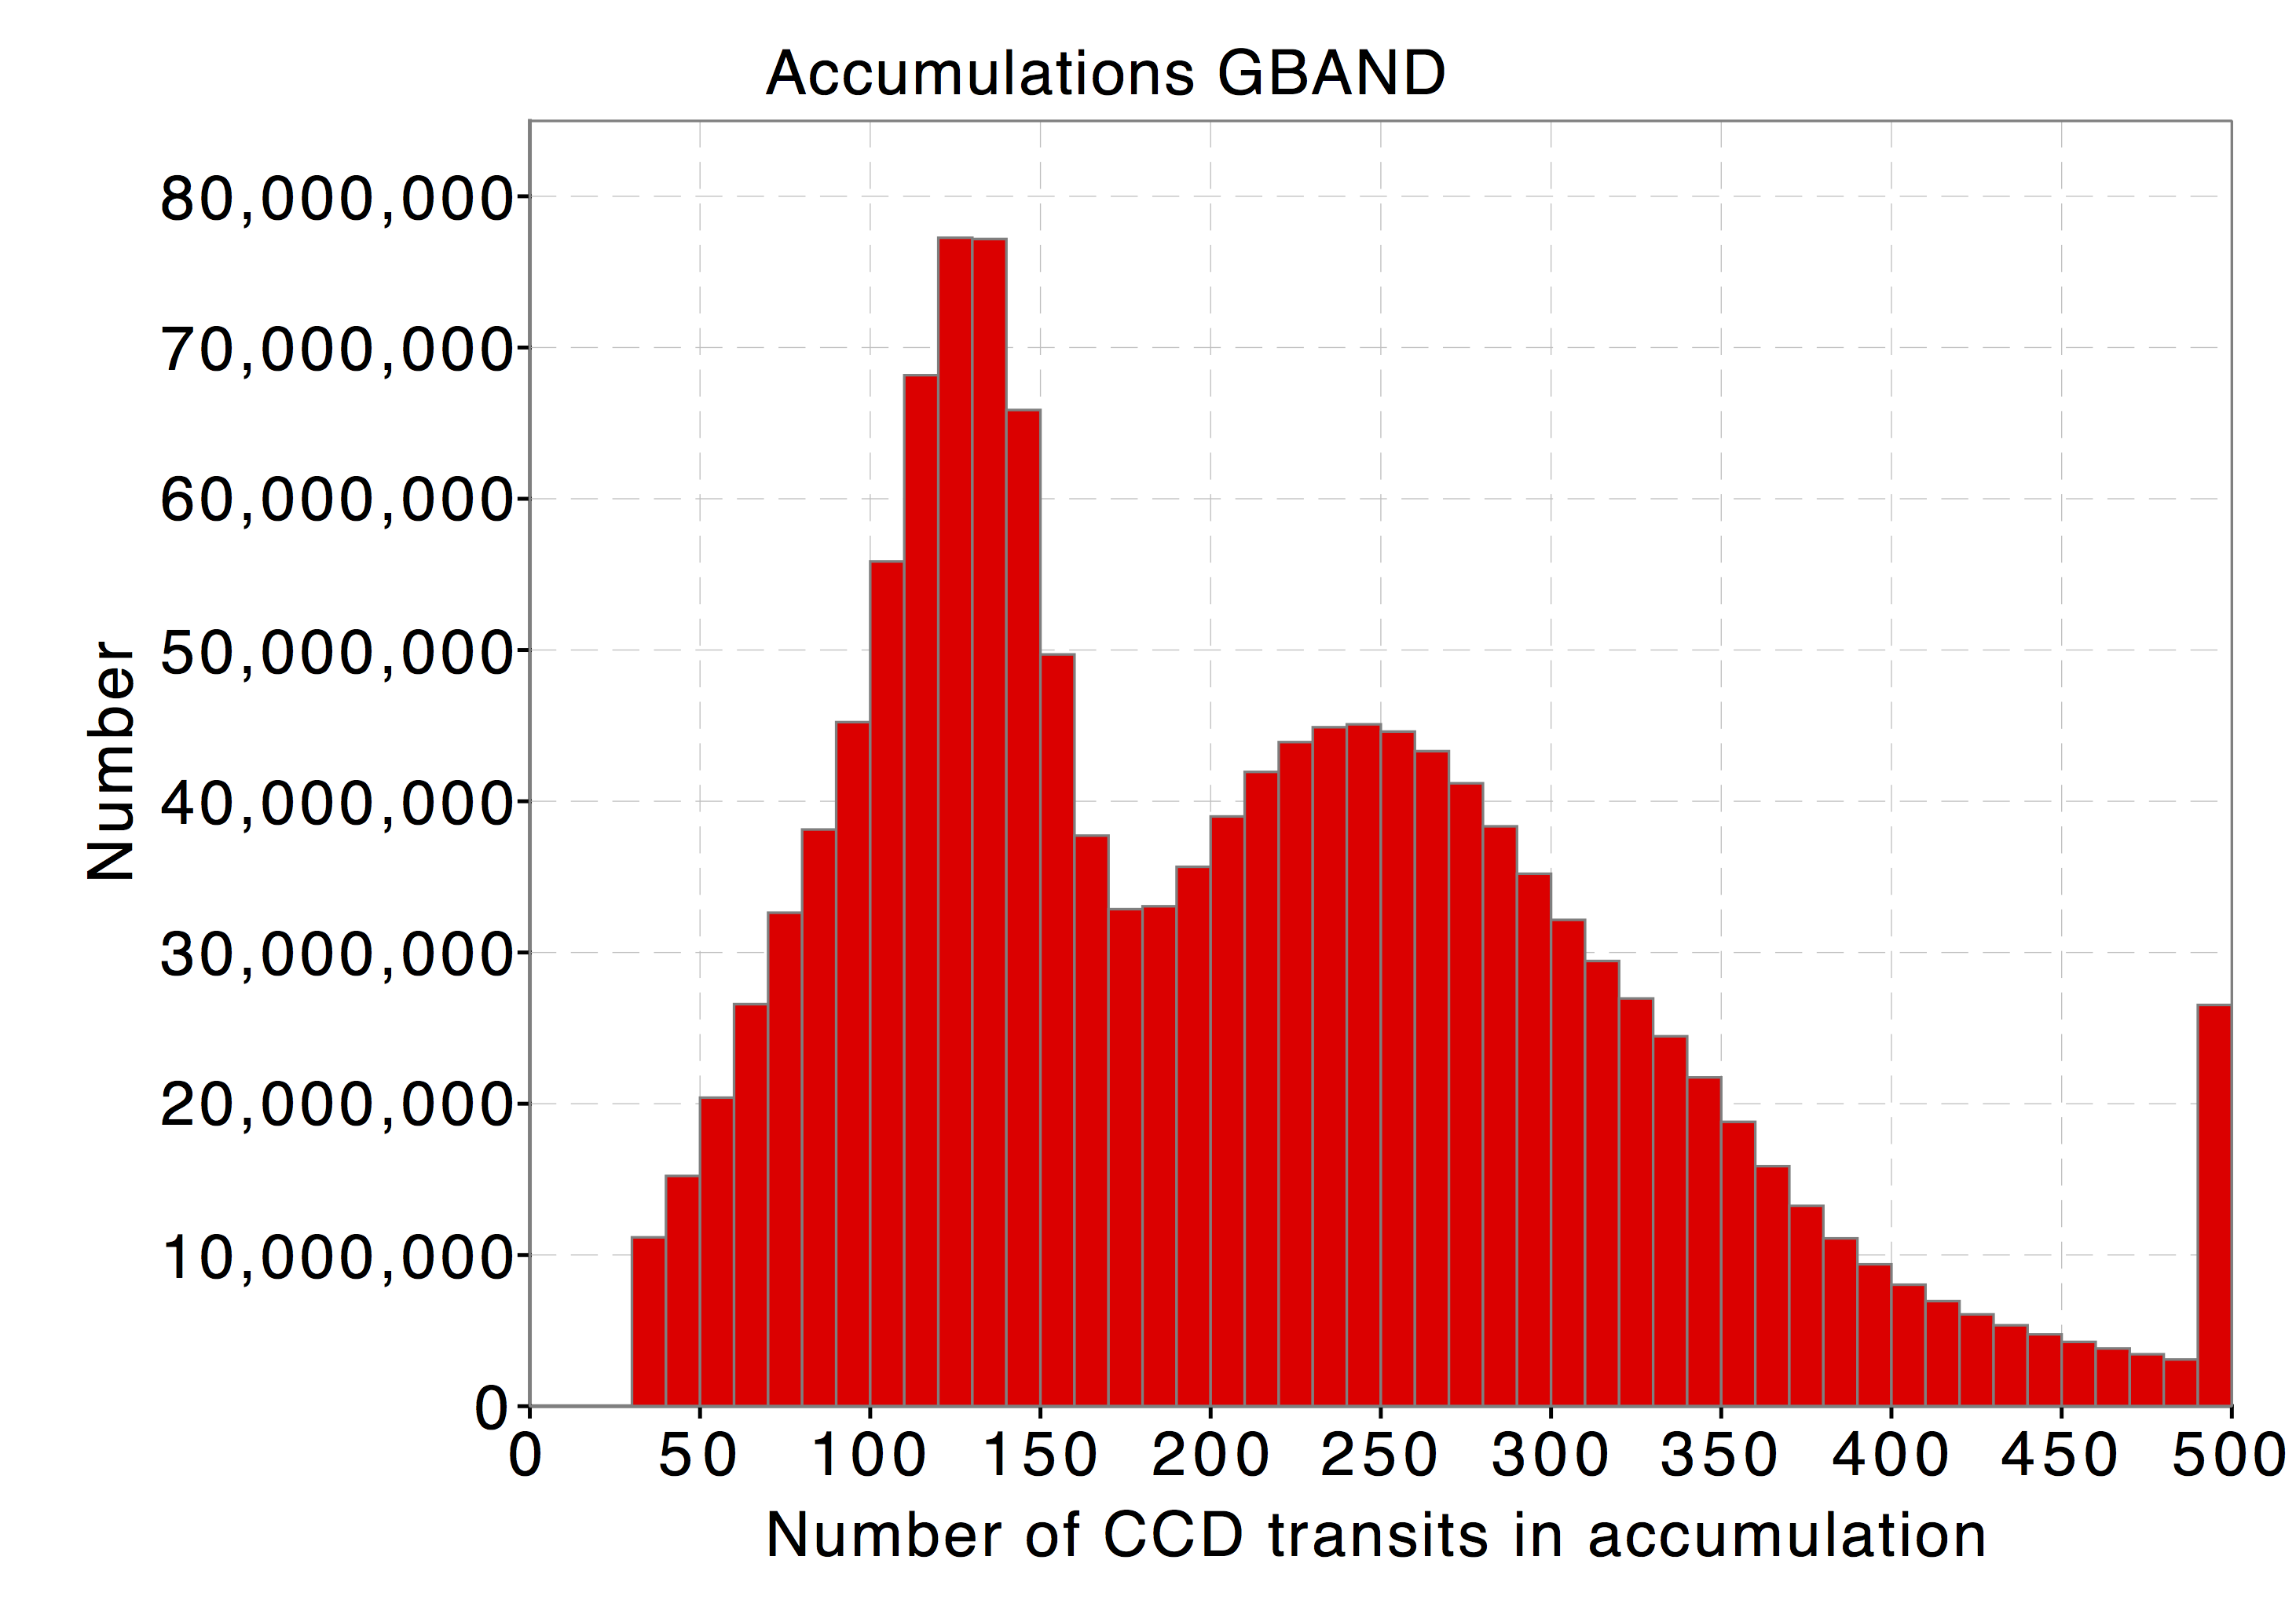
As in Evans et al. (2017), the analysis of the accumulation data for Gaia DR2 has a restriction on the minimum number of observations. For observations, this is 30, while for and , it is 3. The reason for this restriction is to minimise the effect of spurious detections, which will tend not to be cross-matched with other observations and therefore not have many observations. Figure 8 shows the distribution of the number of observations for each source. The mean and median values are 209 and 196, respectively, which is approximately twice the number of observations contributing to the first data release. As can be seen from Fig. 8, the distribution is broad and bimodal, which is a consequence of the scanning law. The distribution of the number of and observations is similar, but reduced by a factor of approximately 9.
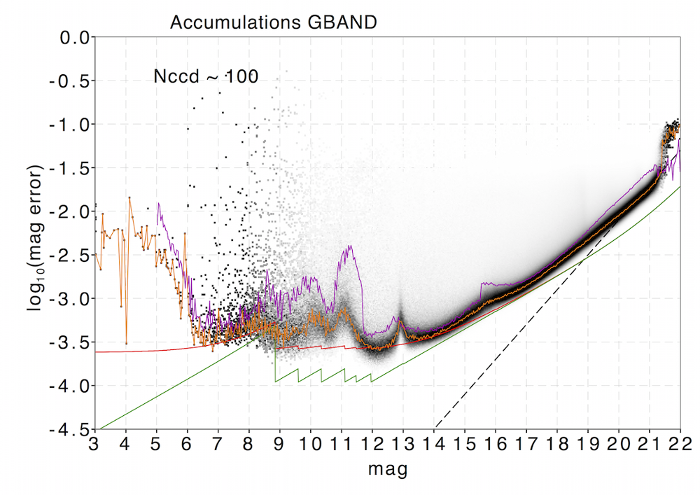
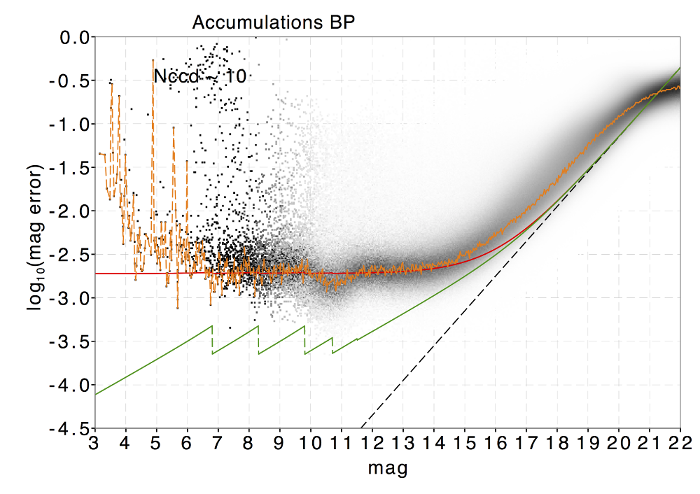
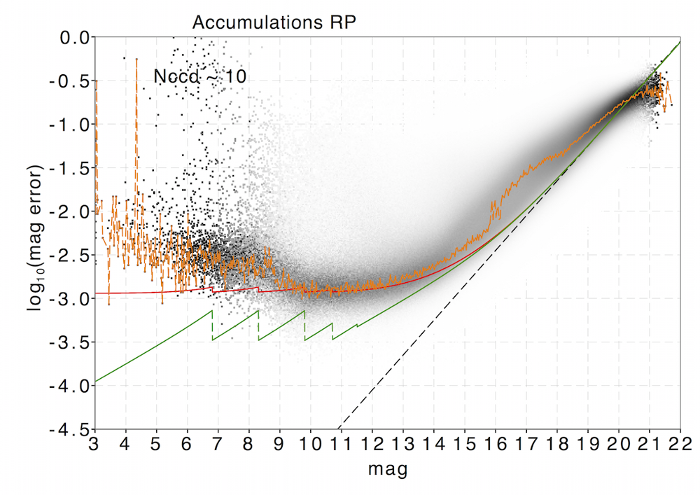
Figures 9 to 11 show the distribution of the standard uncertainty on the weighted mean as a function of magnitude. These plots are restricted to sources with approximately 100 CCD transits in (equivalent to about 10 and transits) so that they can be compared to predictions of the uncertainty using the formulation that can be found in Jordi et al. (2010). The value of 100 was chosen so that the results from Gaia DR1 for the band could be compared with these results. For future releases, a higher value will be chosen.
The green lines in these plots show the predicted uncertainties using nominal mission parameters for sources with 100 CCD observations. The red lines show the same predictions, but with a calibration floor added in quadrature. The estimated calibration floors are 2, 5, and 3 mmag for , , and , respectively. For the band, this represents an overall improvement in the calibrations from the 3 mmag level attained in the first data release. No and photometry was released for Gaia DR1 to be compared with the current results. We also show in Fig. 9 the results from Gaia DR1 (magenta line), which indicate an overall improvement in the calibrations and image parameter determination (IPD) in this data release over all magnitude ranges. A number of features in these plots require further comment, however, since many of these features were present at a higher level in Gaia DR1; more detail about their causes can be found in Evans et al. (2017).
At the faint end, , the performance has improved as a result of changes in the IPD. This is not as good as the predicted values because stray light levels are higher than expected. The faintest sources, , are probably spurious detections or have unreliable photometry. These number a few million, but are visible in Fig. 9 because the distribution is normalised along the magnitude axis.
The features in Fig. 9 seen at around and 16 are related to changes in the window class of the observations. Improvements in the Gate/Window Class link calibrations (Riello et al. 2018) have reduced the size of these features with respect to the first data release. Although the peak at has almost gone, the peak at remains, but is narrower. Another reason for the performance gain at is that the determination of the line spread function (LSF) has been improved and thus does not provide a possible calibration floor at the bright end of this window class configuration.
There are considerable improvements in the performance for sources brighter than , where saturation becomes important. This is attributed to an improved masking of saturated samples as part of the cyclic IPD process. A further improvement in this data release for the brighter sources comes from a better calibration of the point spread function (PSF).
The data for the and photometry shown in Figs. 10 and 11 are very different and show far fewer features. There is only one window class configuration change for these observations; this occurs at . Even though the windows for the brighter sources are transmitted to the ground as 2D windows, the photometric processing treats them as aperture photometry in the same way as for the 1D windows. This means that it is unlikely that a jump is introduced into the photometric system during the initialization process. This is confirmed by the external catalogue comparisons, see Fig. 14, and by there being no peak at in Figs. 10 and 11. Moreover, because the light is spread by the prisms, saturation is much less of a problem in and . Simulations have shown that saturation only occurs for for the brightest and reddest sources.
The most noticeable feature seen in these plots is the broadening of the distributions in the range between and 19. This change in the distribution also moves the mode (orange line) away from the expected uncertainties (green line). The explanation for this is that the sample of sources used for this analysis is restricted to certain areas of the sky, which in turn is due to the combination of the selection on number of observations and the scanning law. One of these areas contains the Galactic centre and has strong crowding effects, where the observations are contaminated by near neighbours and thus will have a larger scatter than normal. Because of this, some of the sources will have a larger uncertainty on the weighted mean through this increased scatter than sources in other non-crowded areas. These effects are more prominent in and because of the larger window size. That at the faint end () the uncertainties in and seem to be smaller than expected might be due to an underestimated background, implying a higher signal-to-noise ratio (S/N) than what would be expected for the magnitude.
Figures 9 to 11 also show black dashed lines with a 0.4 slope that match the distributions at the faint end, thus indicating that the observations there are sky dominated. While this was expected for the BP and RP instruments, the observations were intended to be source dominated (green line in Fig. 9). The observations are sky dominated because additional stray light enters the telescope. This is described in detail in Gaia Collaboration et al. (2016b).
Another potentially useful statistic derived from the source-based photometry are the P-values, which can be used to identify variable sources. The P-value is the probability that a set of observations is consistent with the null hypothesis. In this case, the null hypothesis is that the source is constant and that the data are well calibrated, including the errors. The performance of the Gaia DR2 P-values is similar to that reported in Evans et al. (2017) for Gaia DR1, even though the estimation of the fluxes and formal uncertainties on individual CCD transits has improved, as have the calibrations. The P-value test is extremely sensitive to underestimation or overestimation of uncertainties or calibration problems. For Gaia DR2, it is likely that the formal uncertainties on the CCD transits are slightly underestimated. However, the calculation of the weighted mean accounts for this and the estimation of the uncertainty on this quantity is realistic. The and photometry is not affected by this. It should be pointed out that the uncertainties quoted on the mean values are showing precision from a random perspective: systematics that are a function of source-based parameters are significantly larger, as described in other sections.
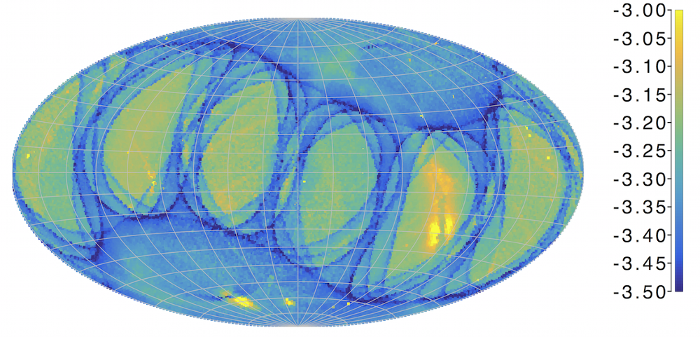
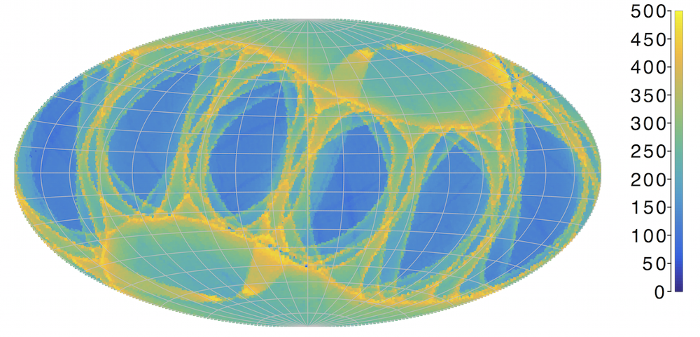
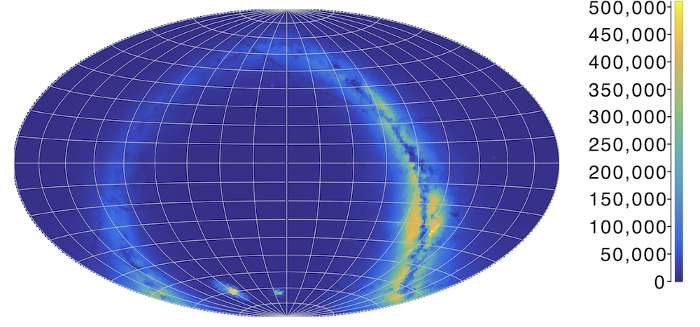
The left plot in Fig. 12 shows the variation with sky position of the uncertainty on the weighted mean for for sources that generally are observed in Window Class 1, that is, a magnitude range of . The other plots in this figure show the distribution of the number of observations per source and the source density. As can be seen in these plots, the uncertainty improves with more observations and degrades in areas of high density through crowding effects. The density plot shown in Fig. 12 covers the faintest magnitude range that is analysed since this is the most relevant for the assessment of crowding. The variation seen in the other passbands and Window Classes is very similar.
7 Comparisons with external catalogues
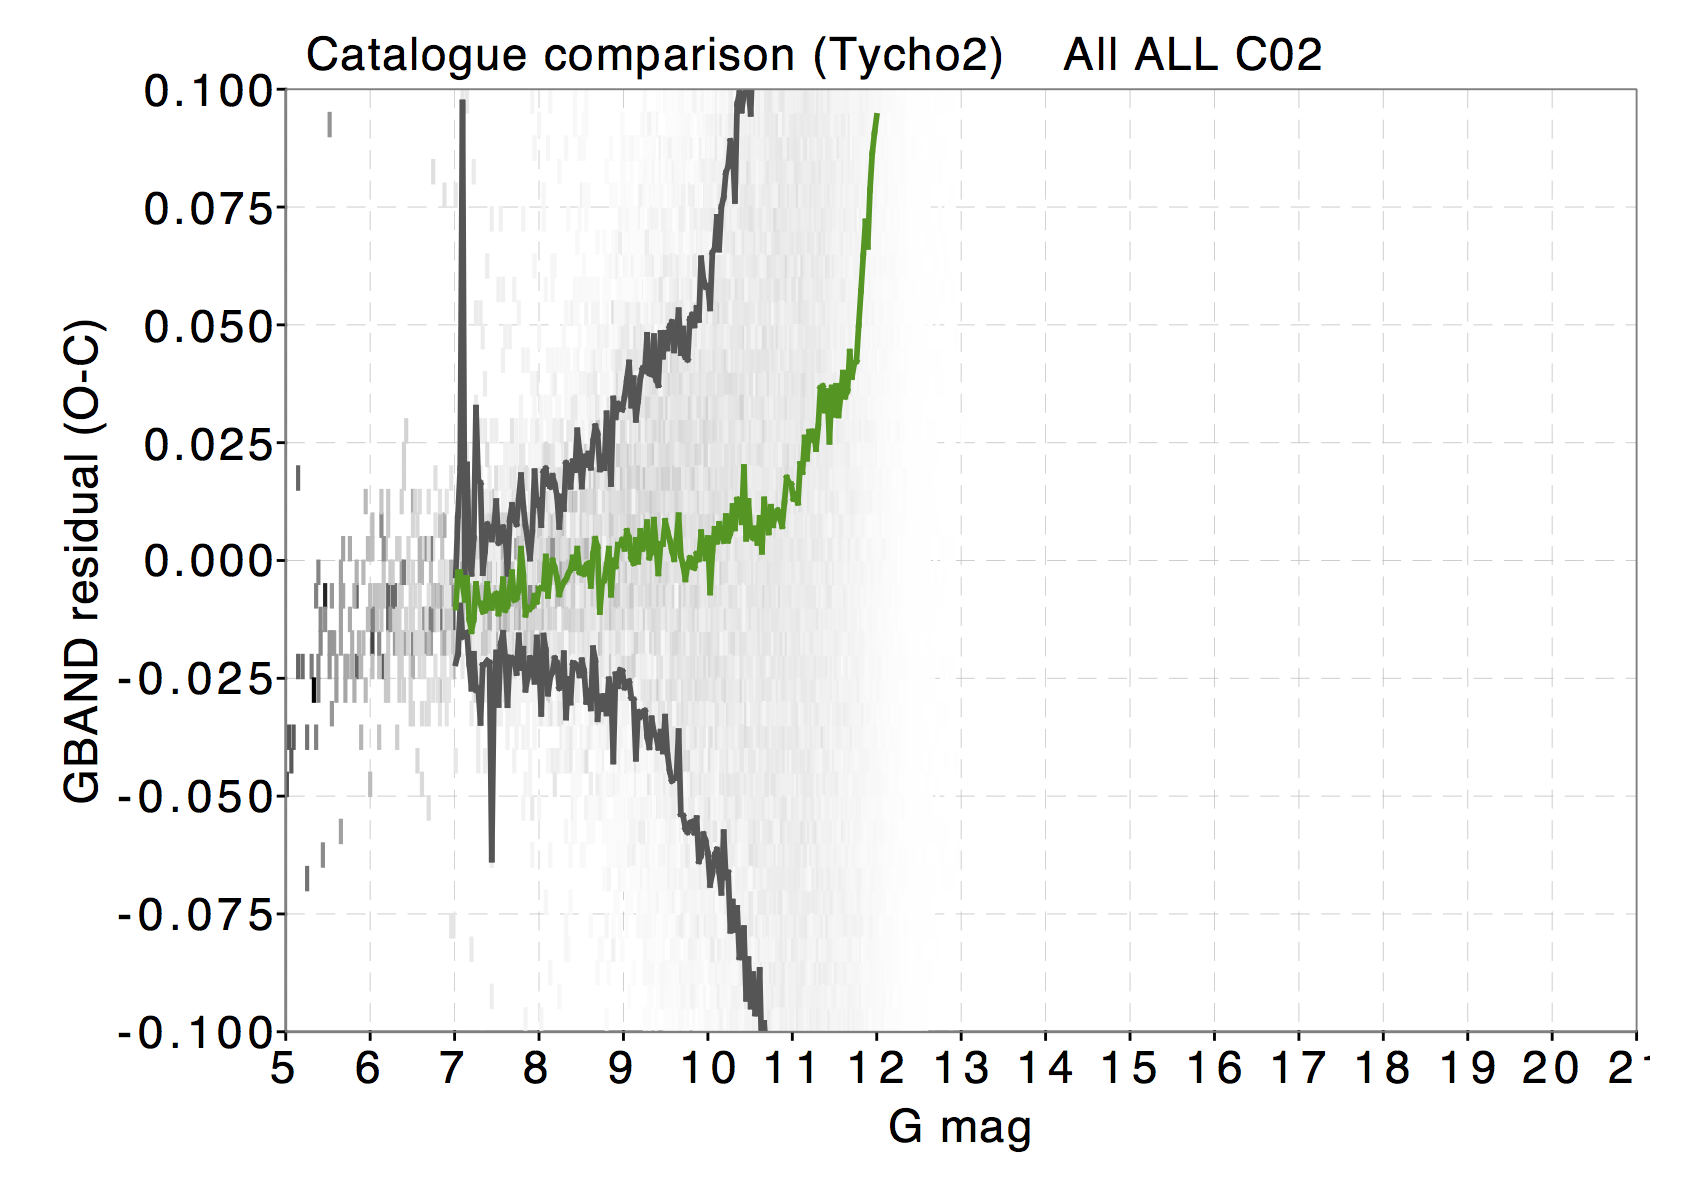
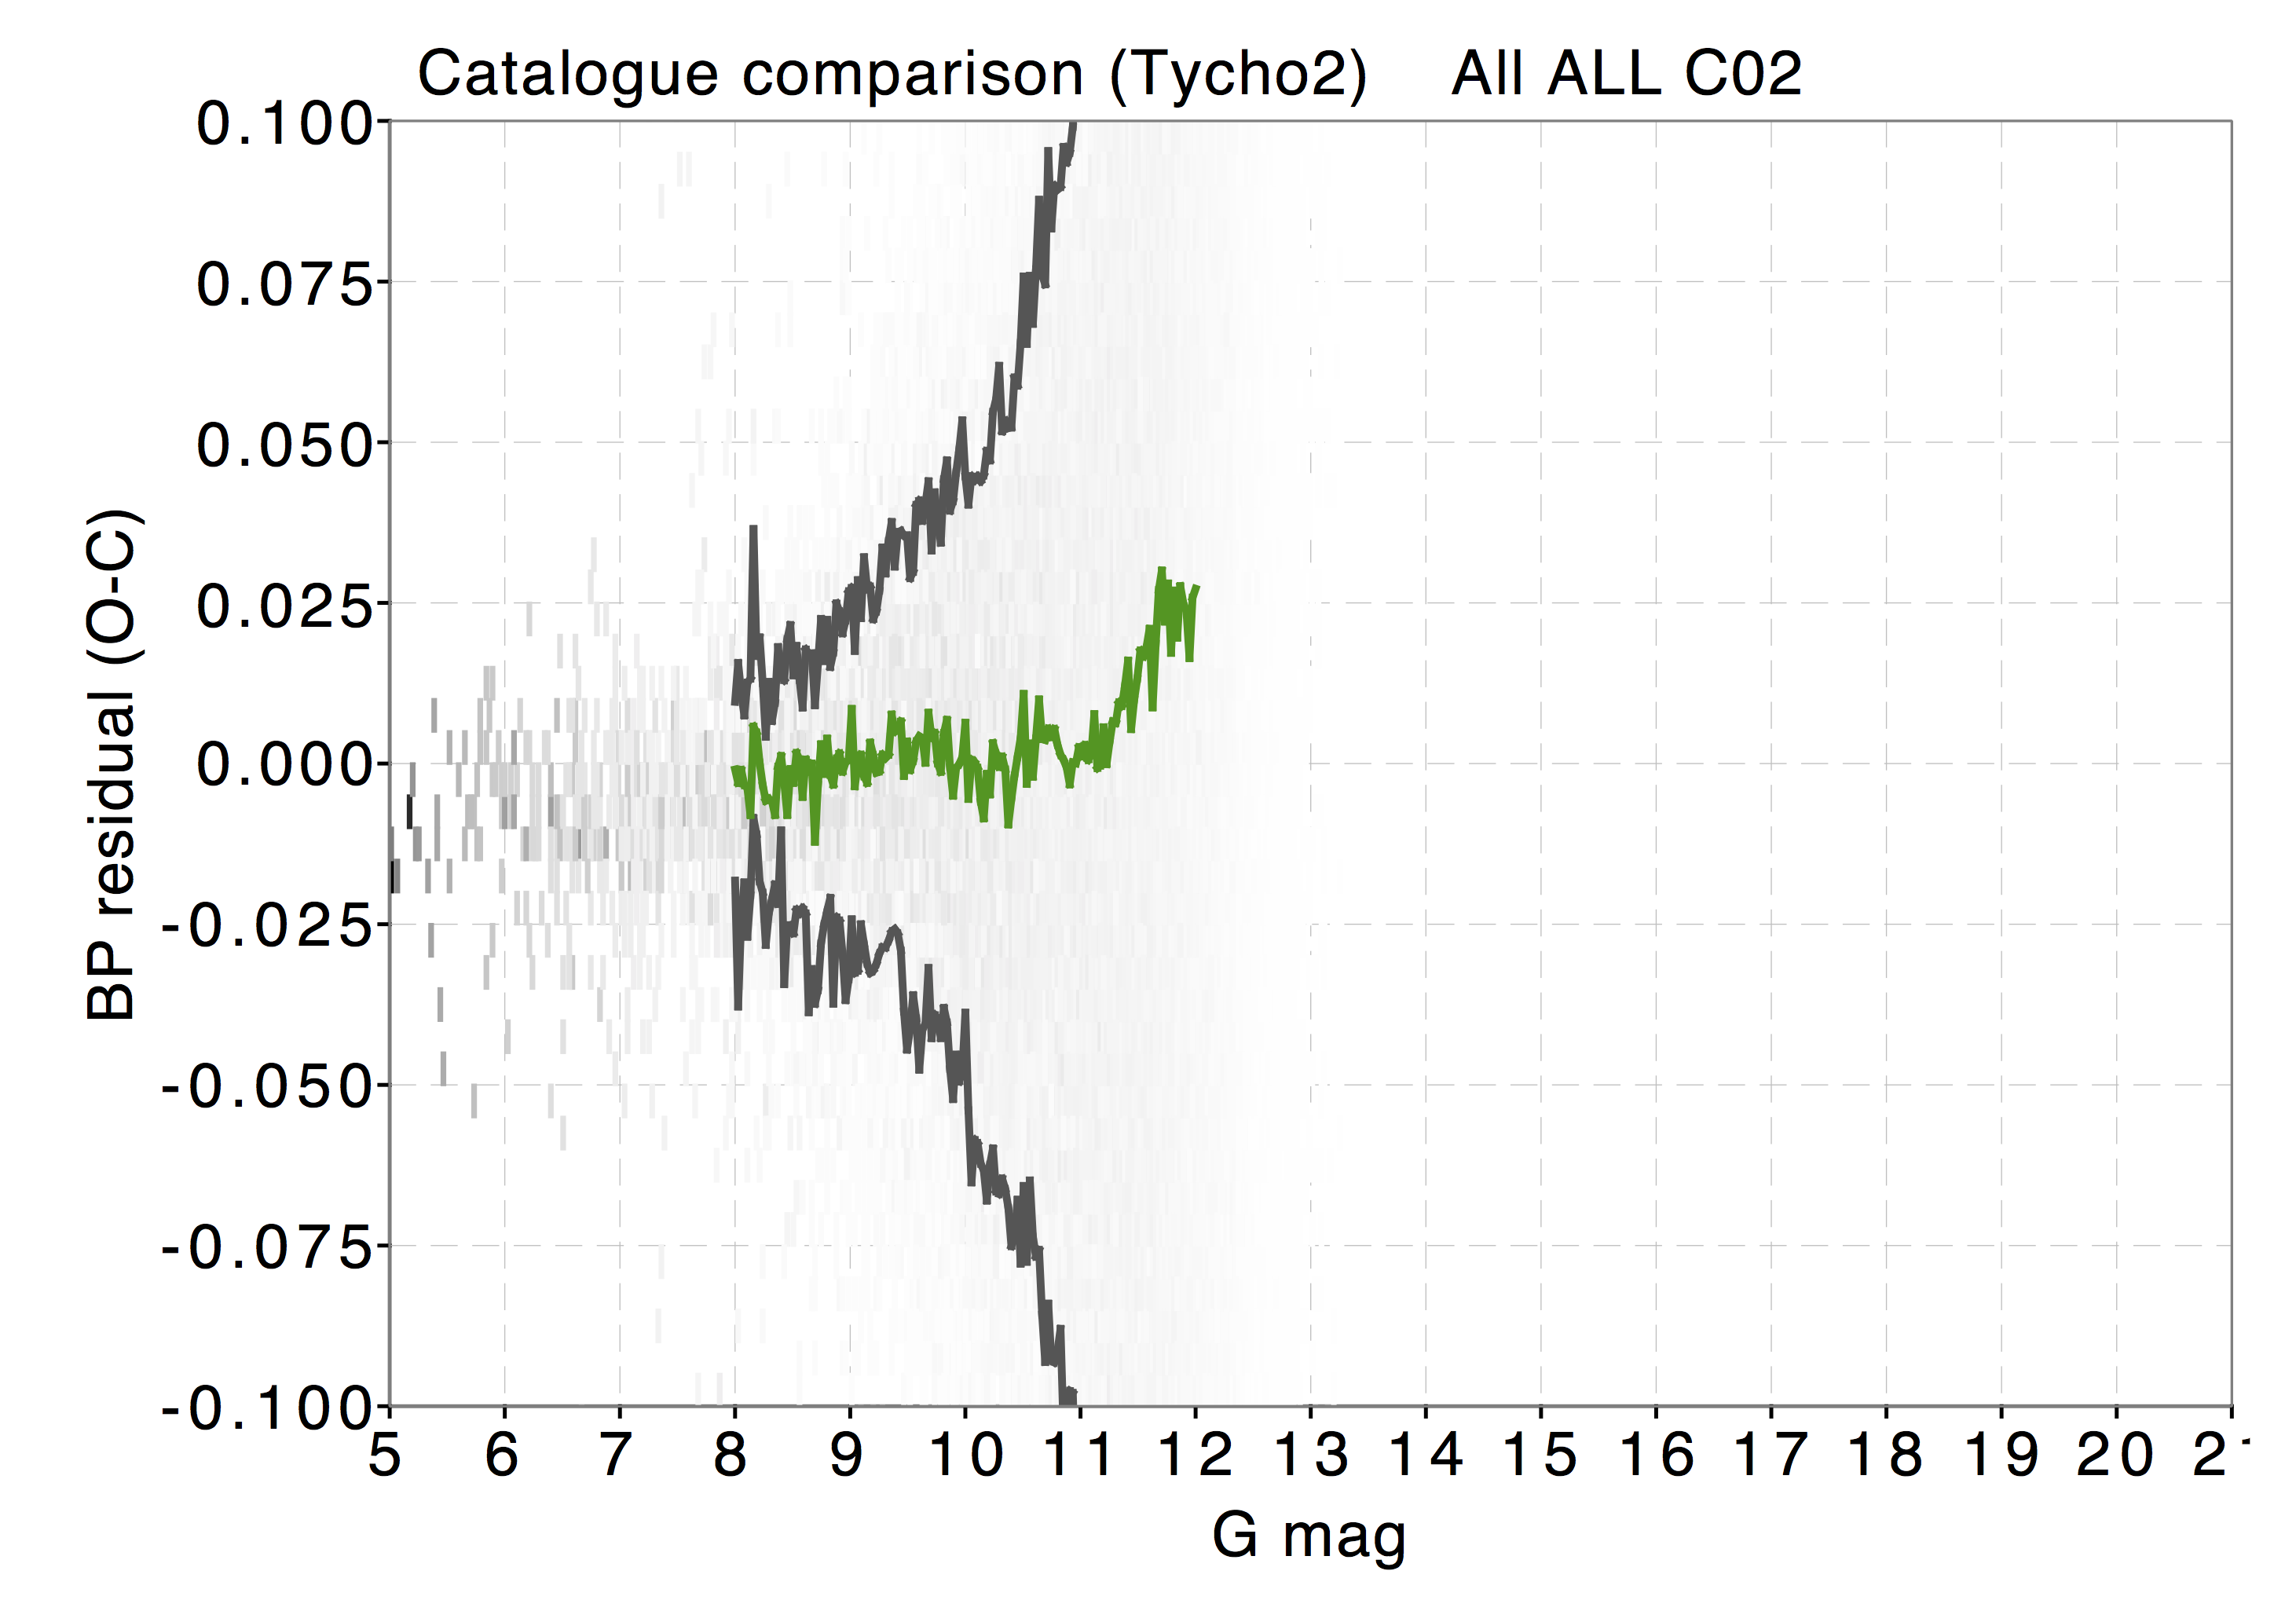
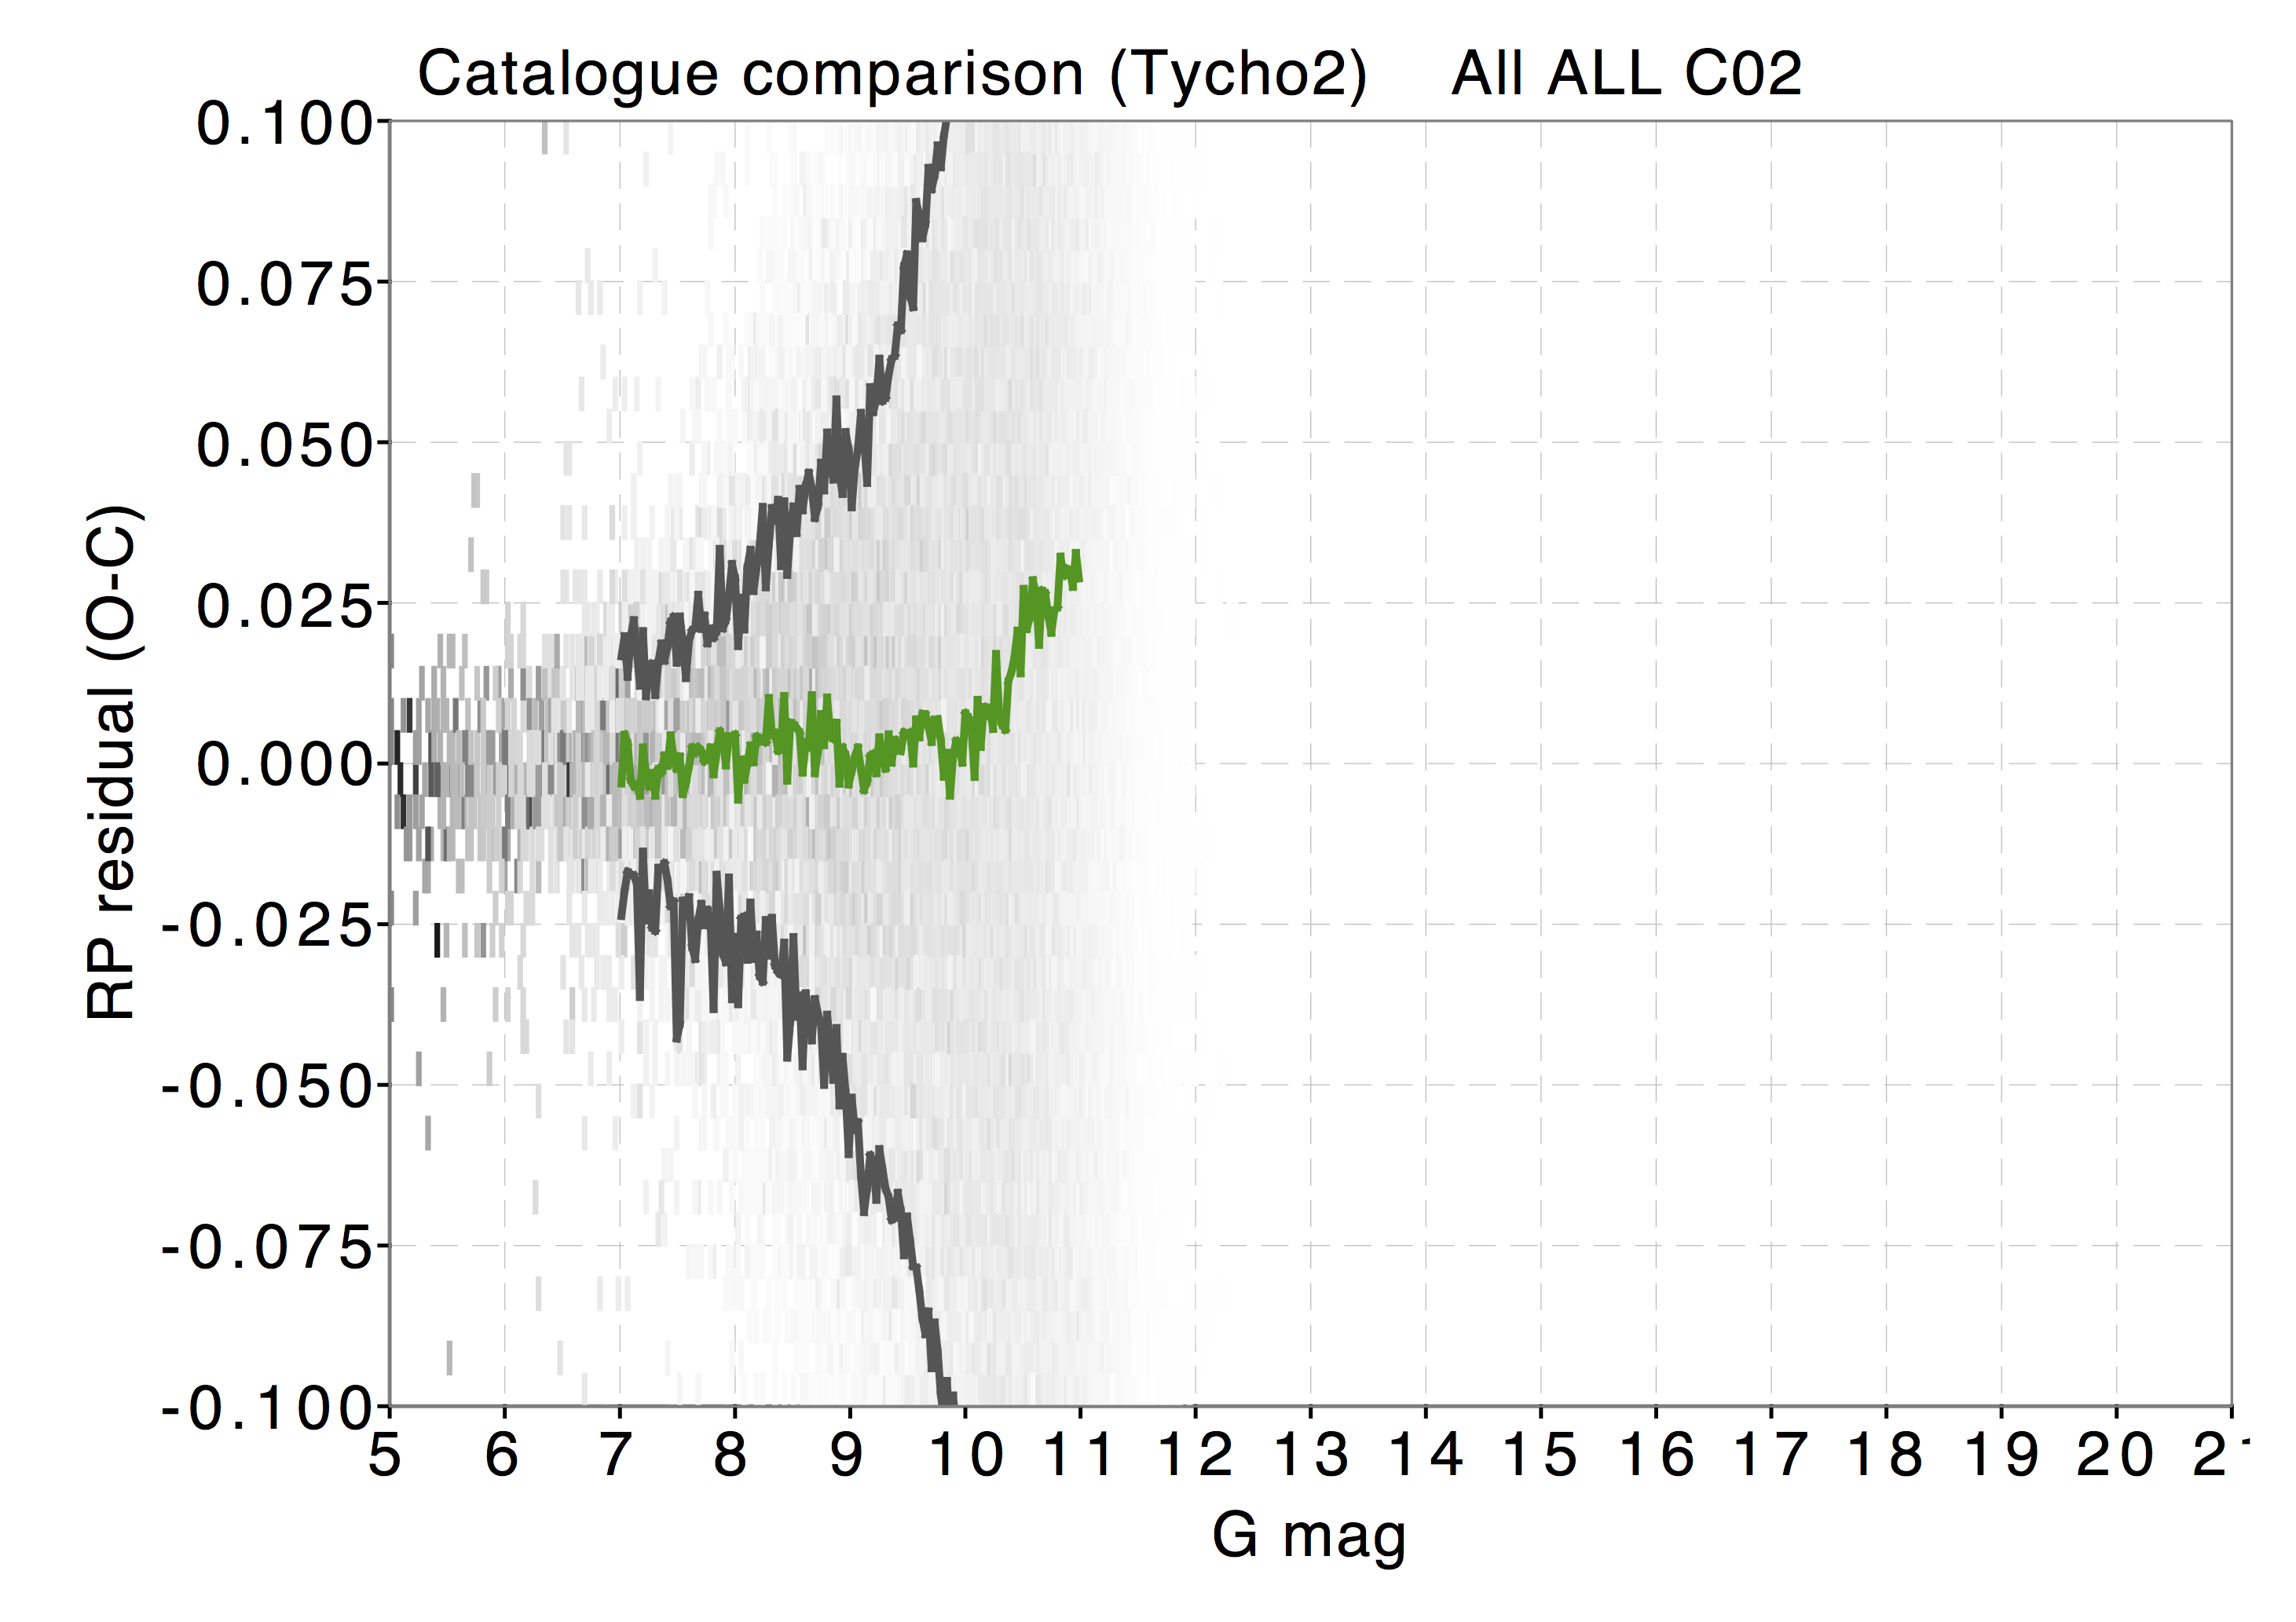
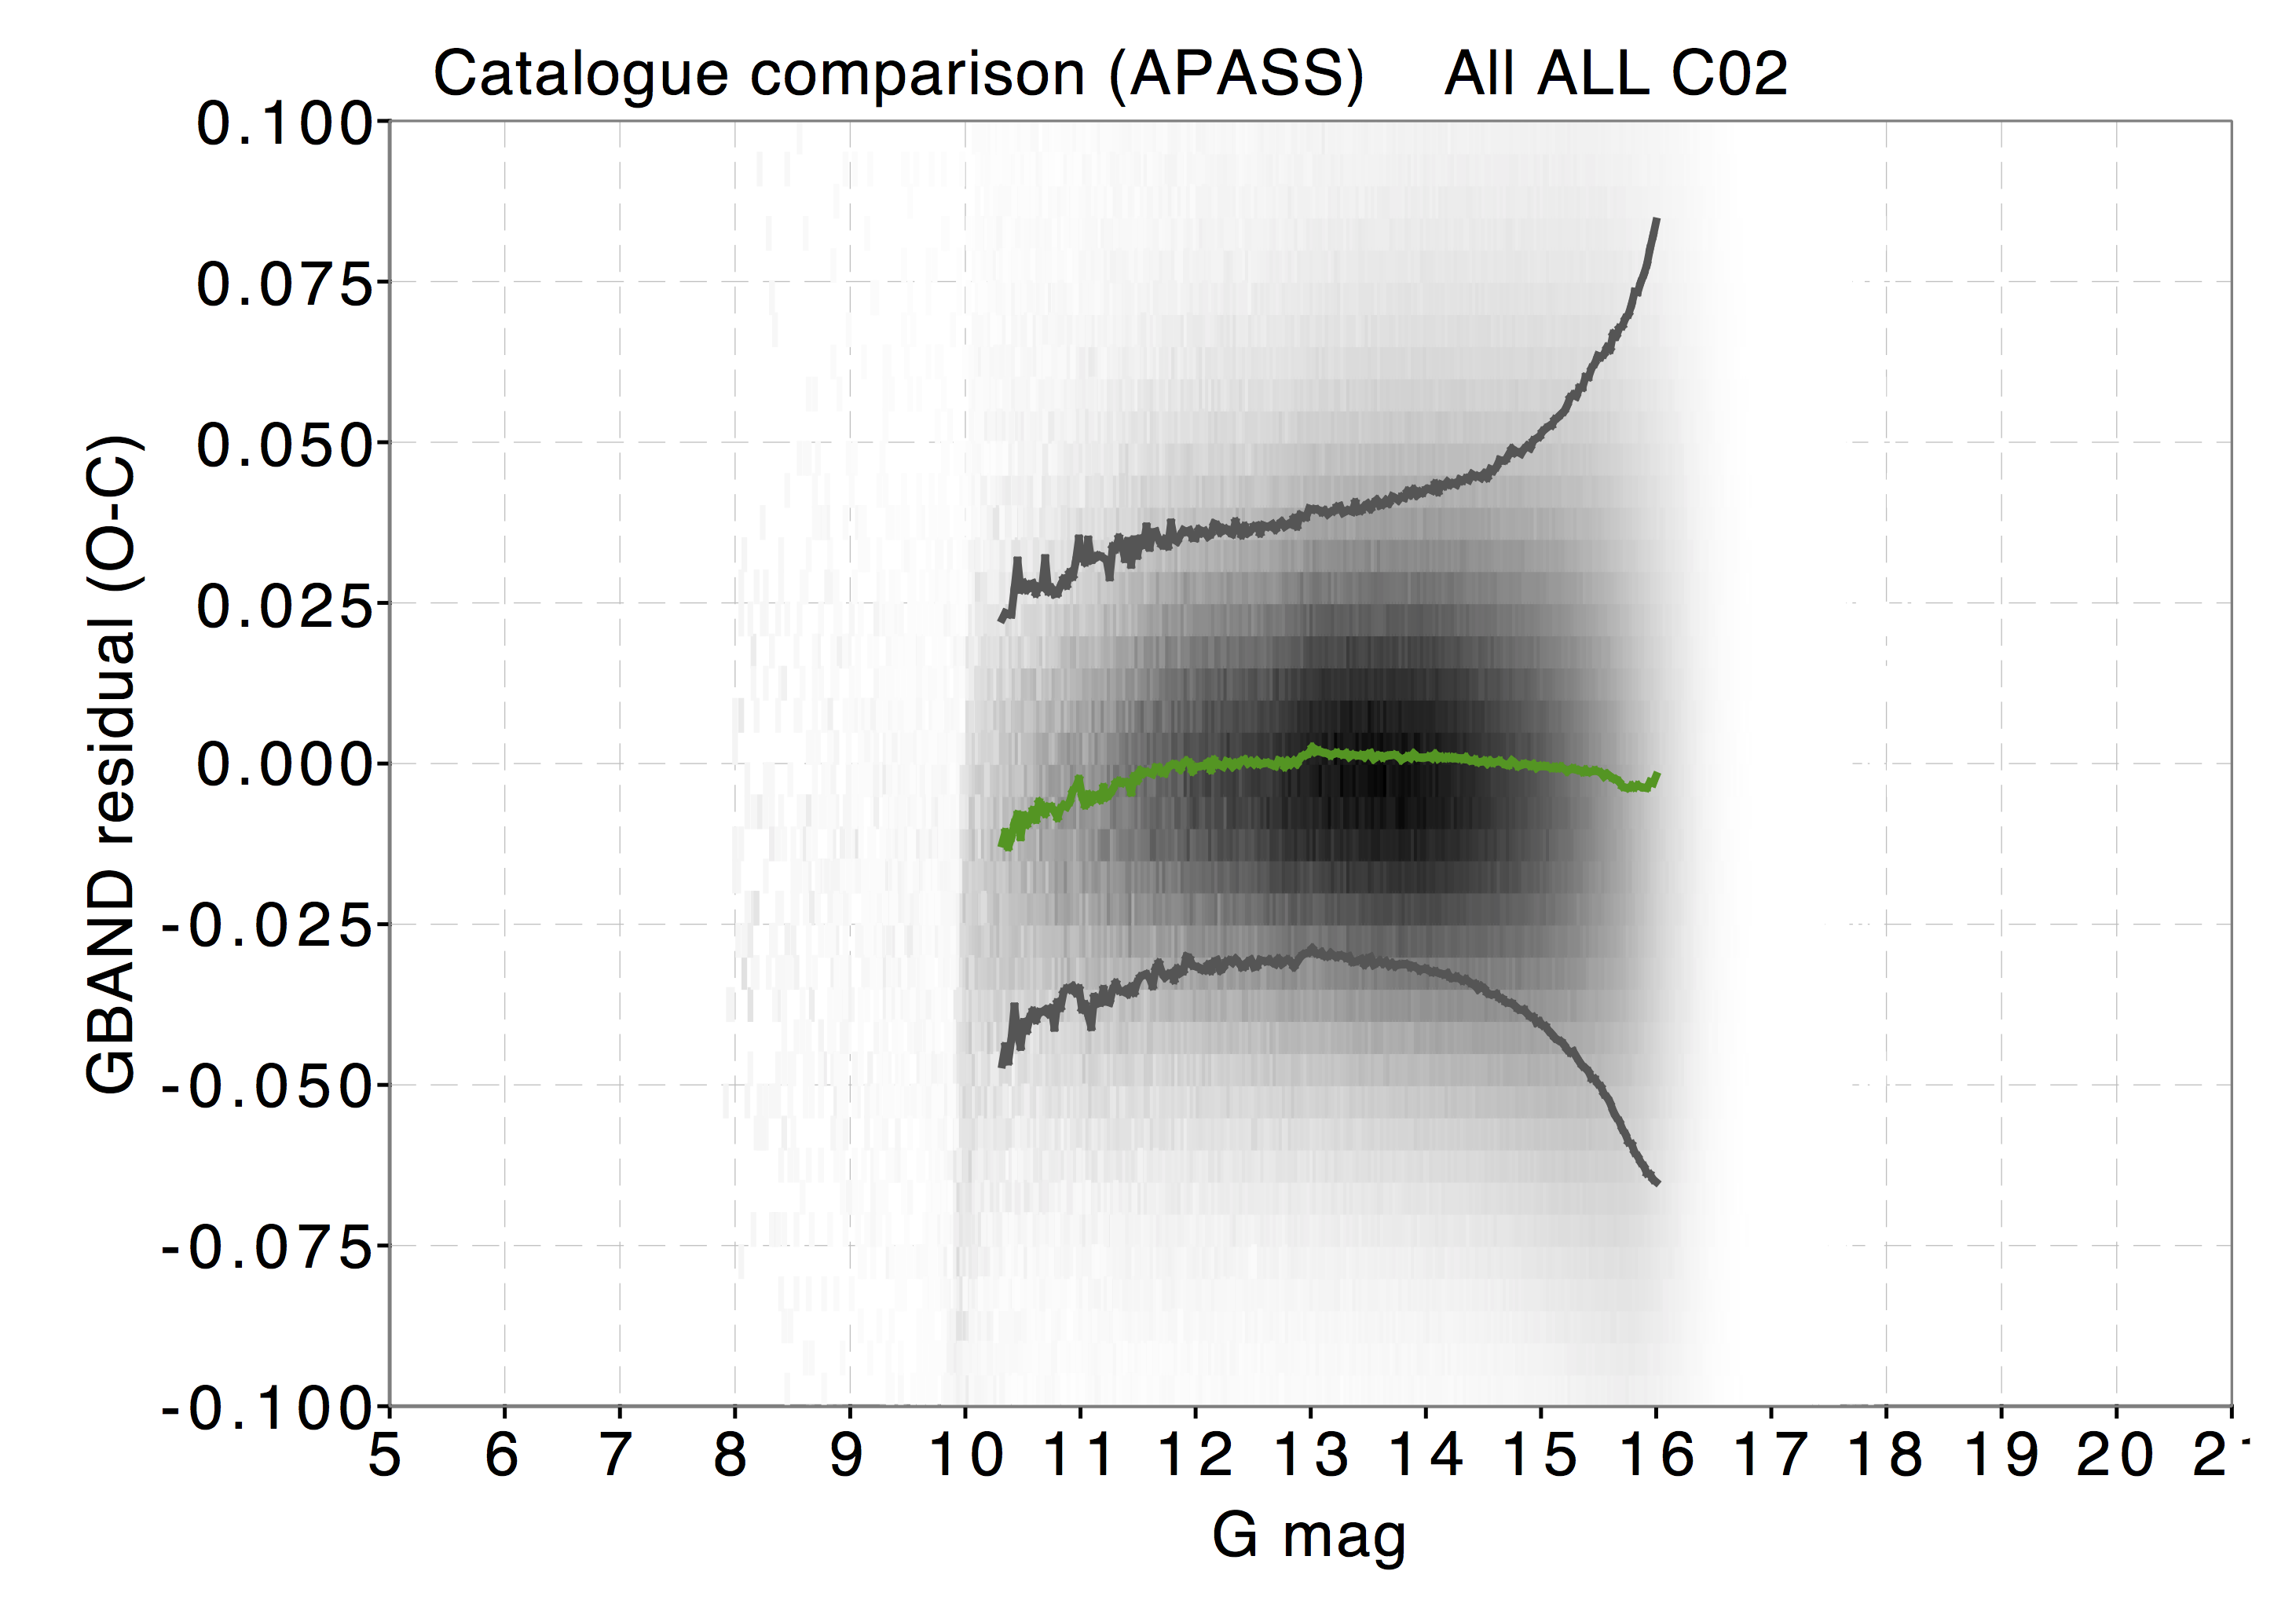
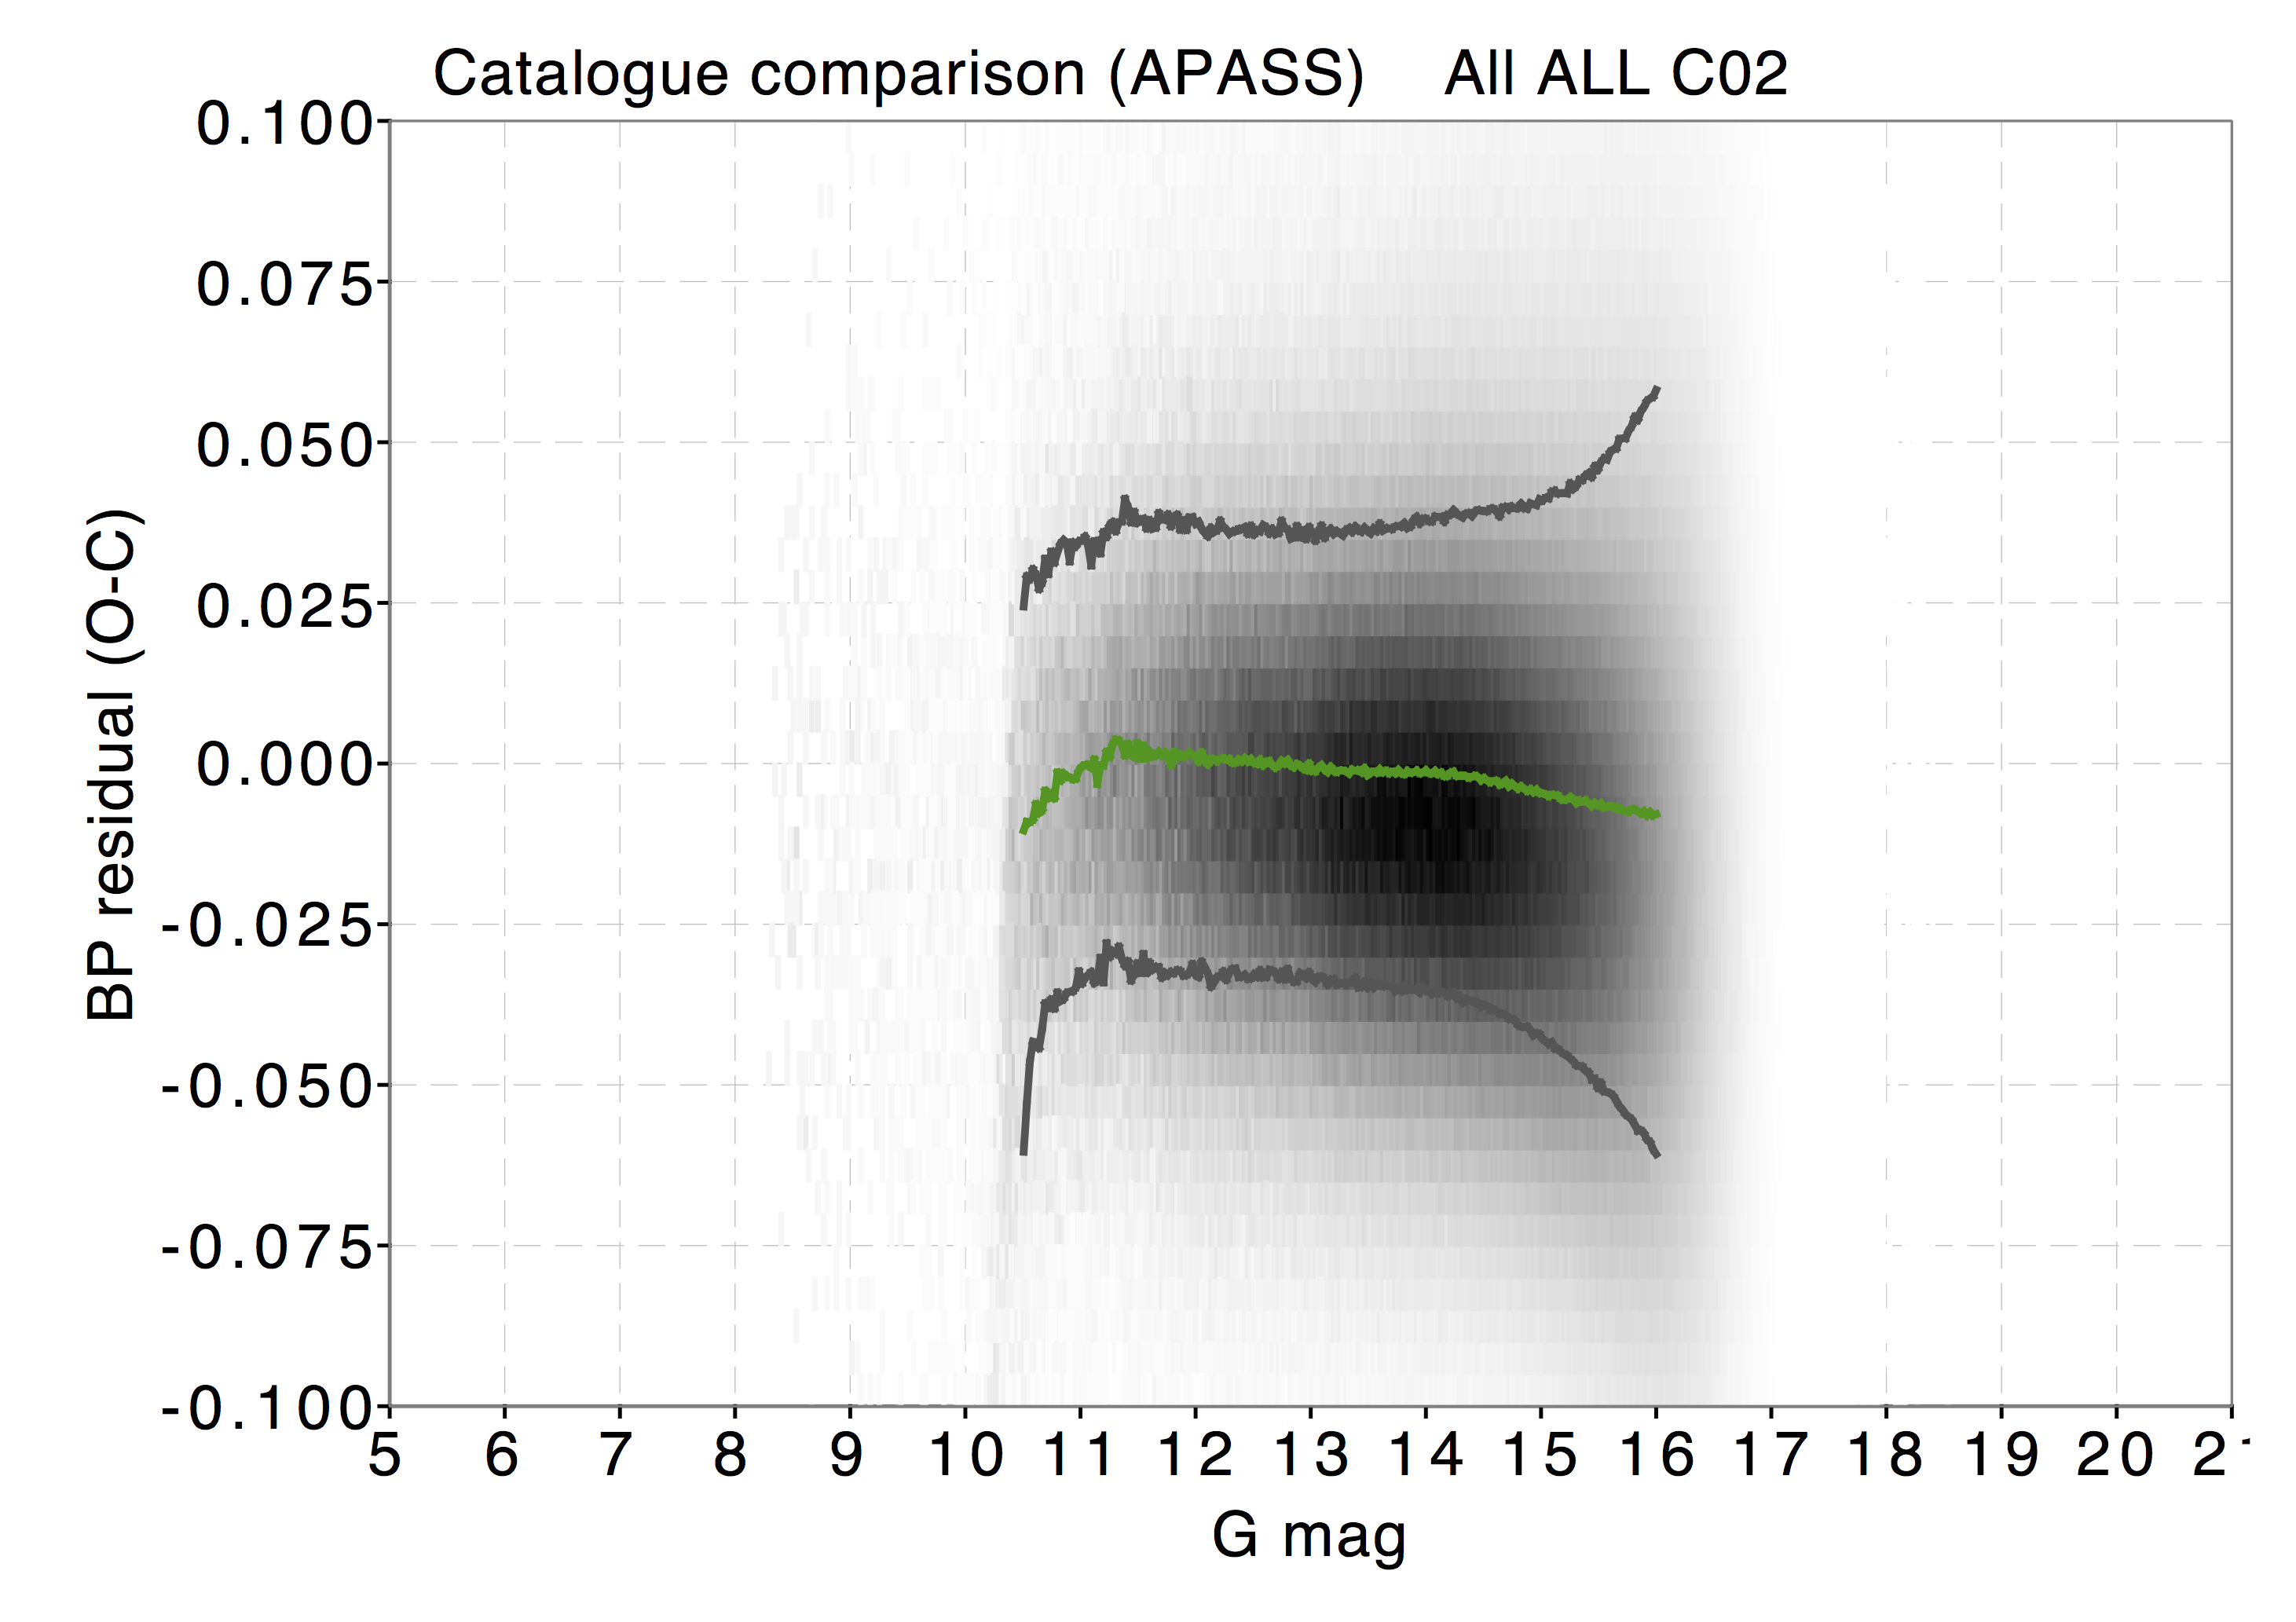
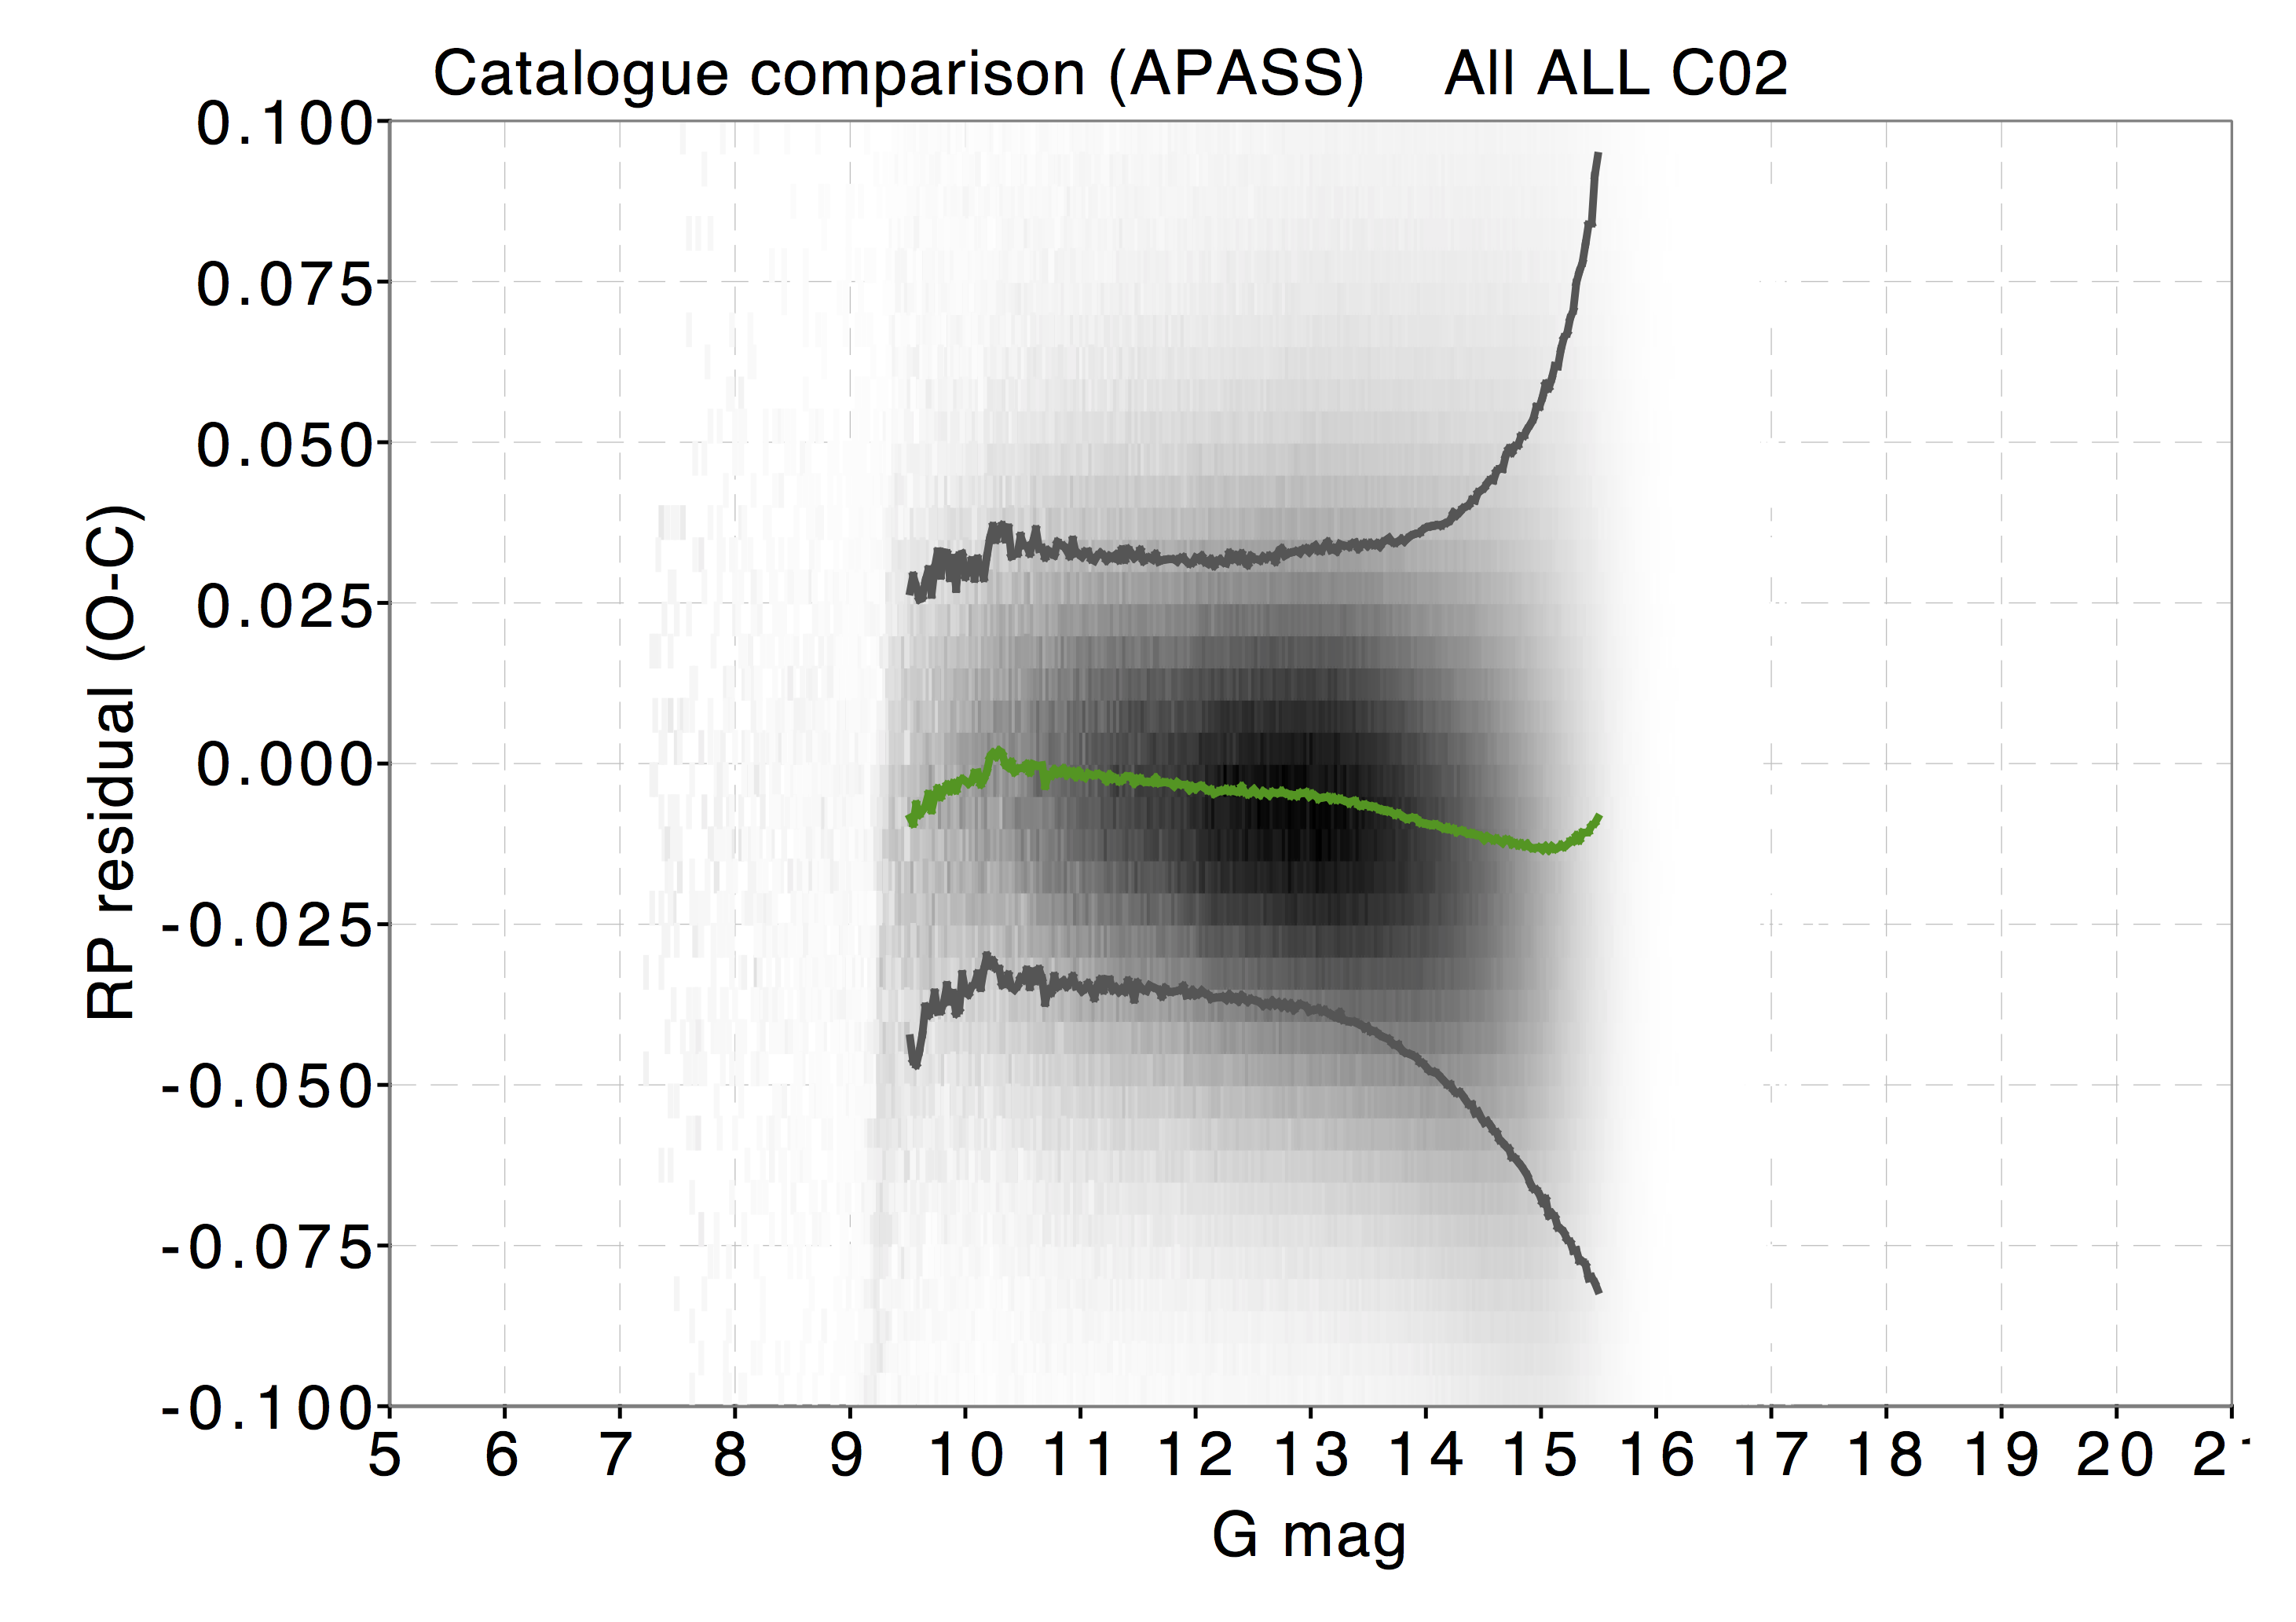
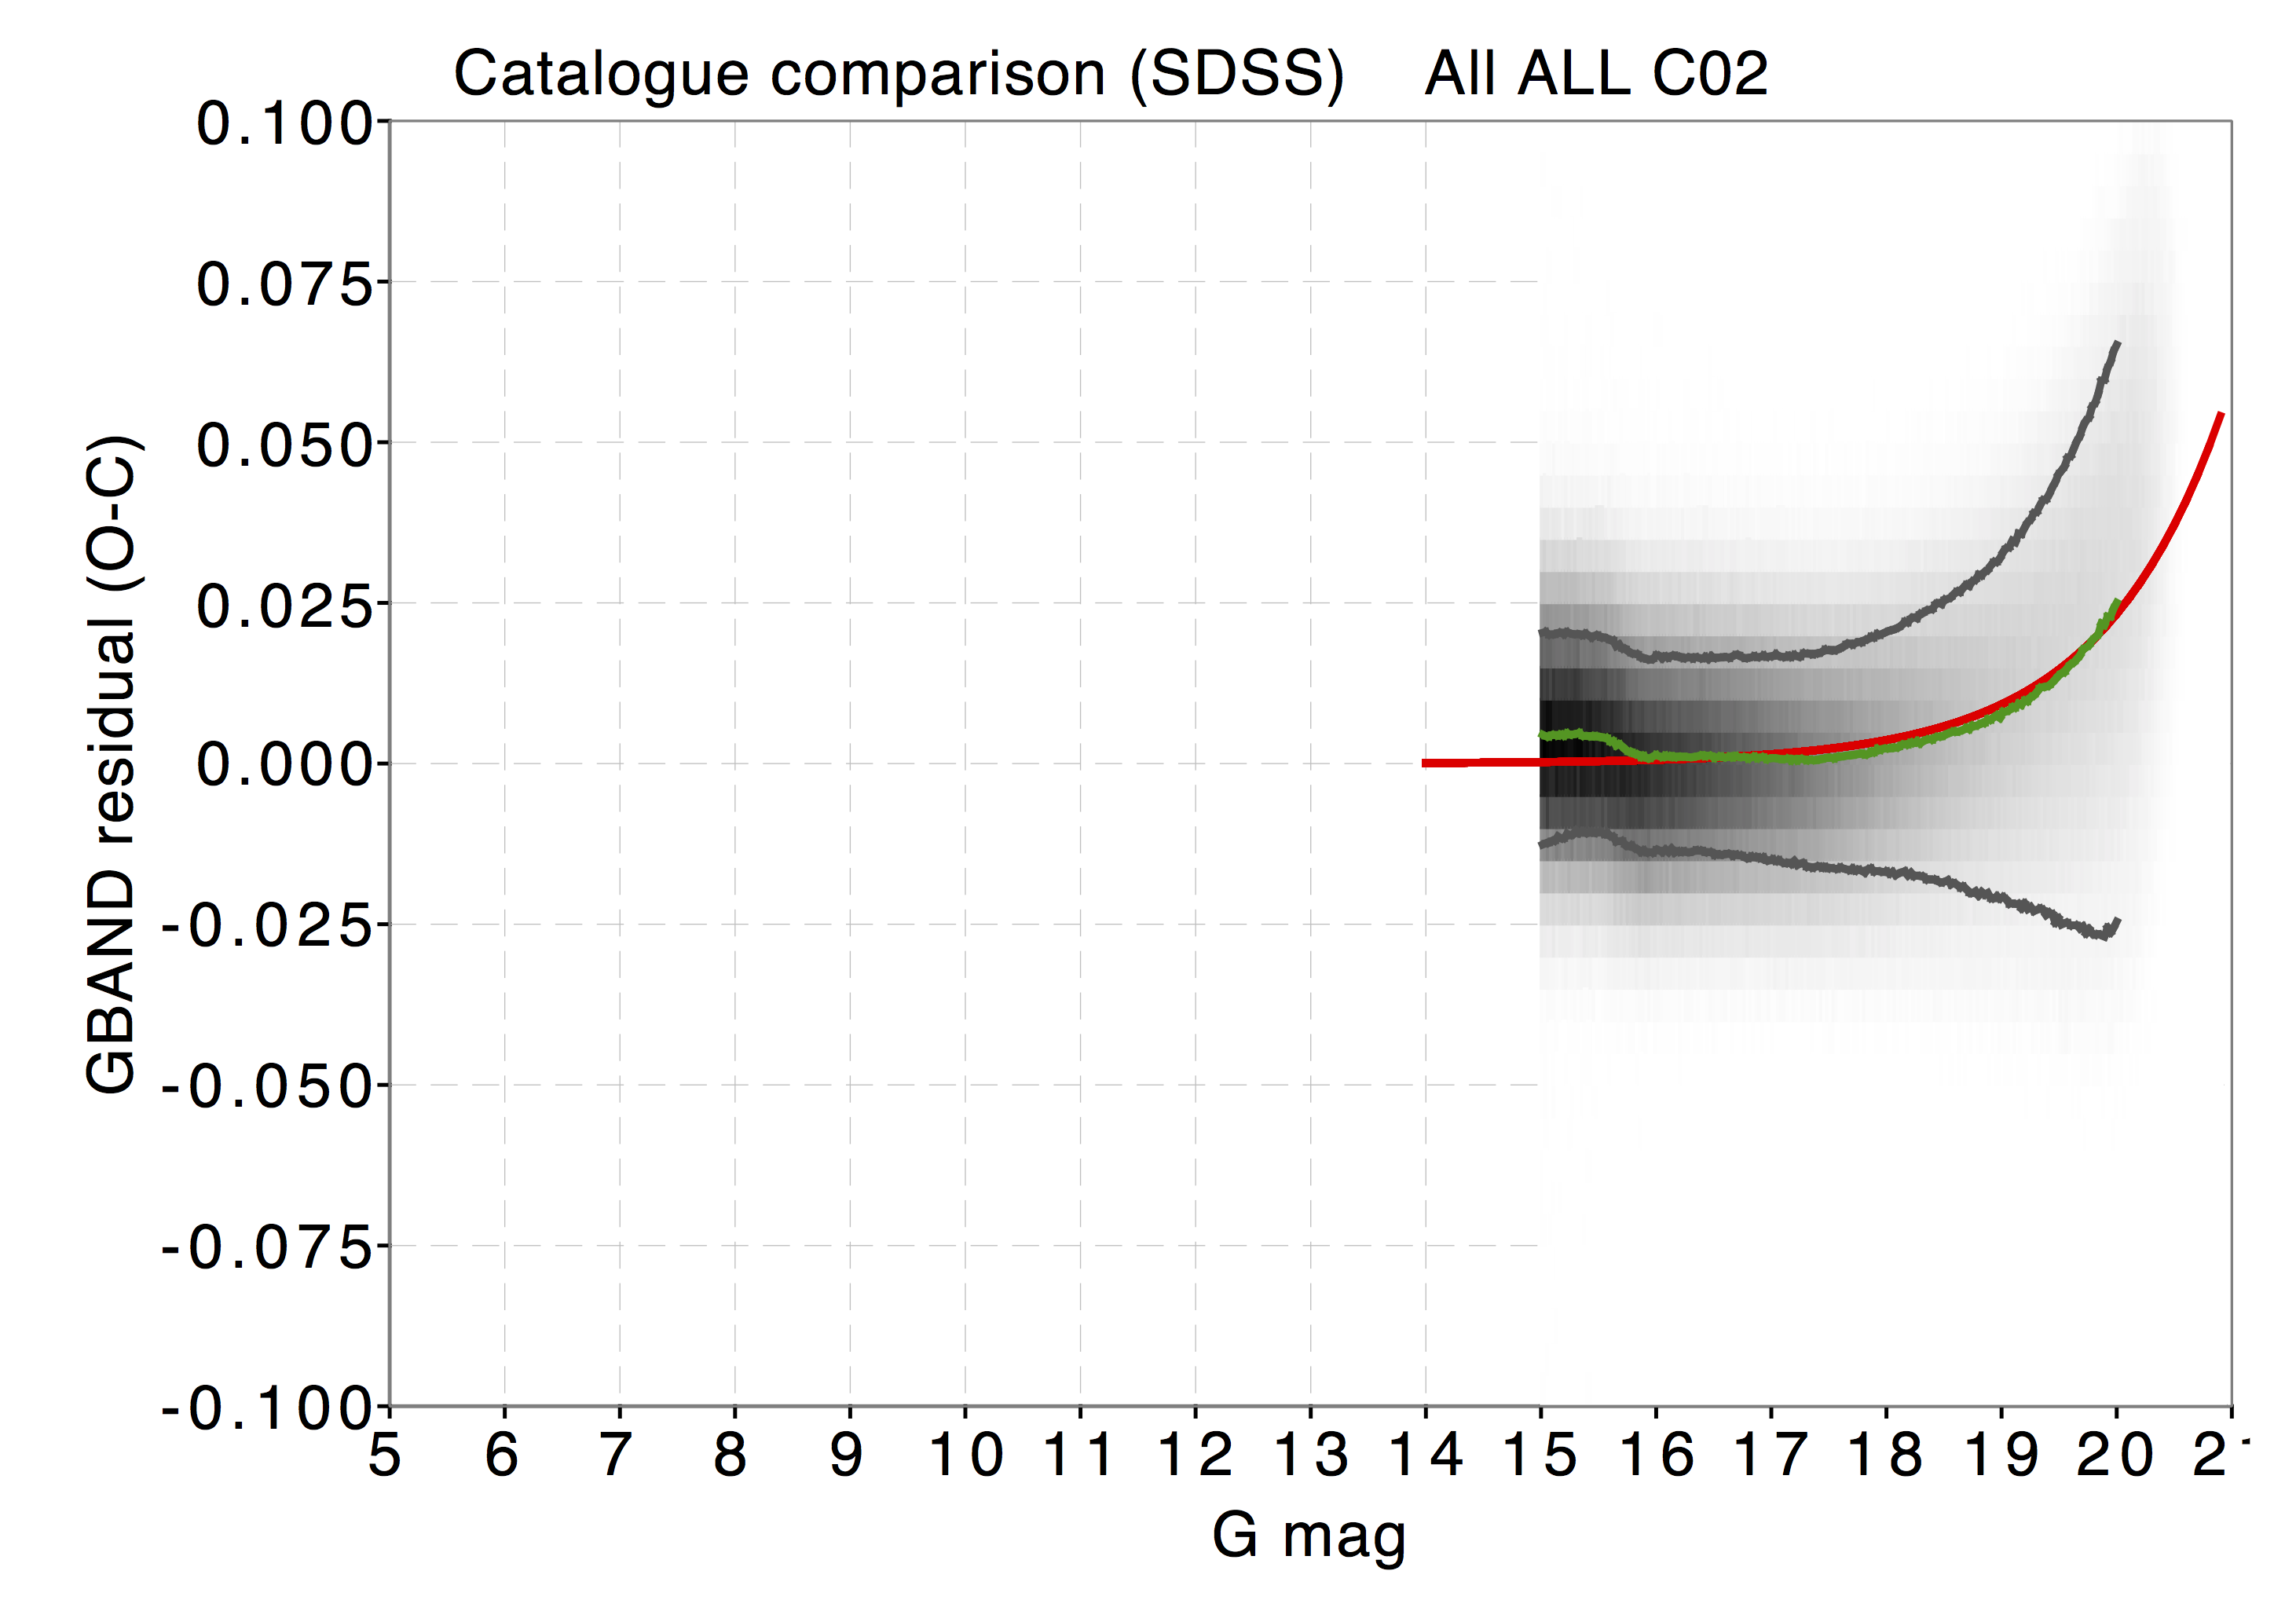
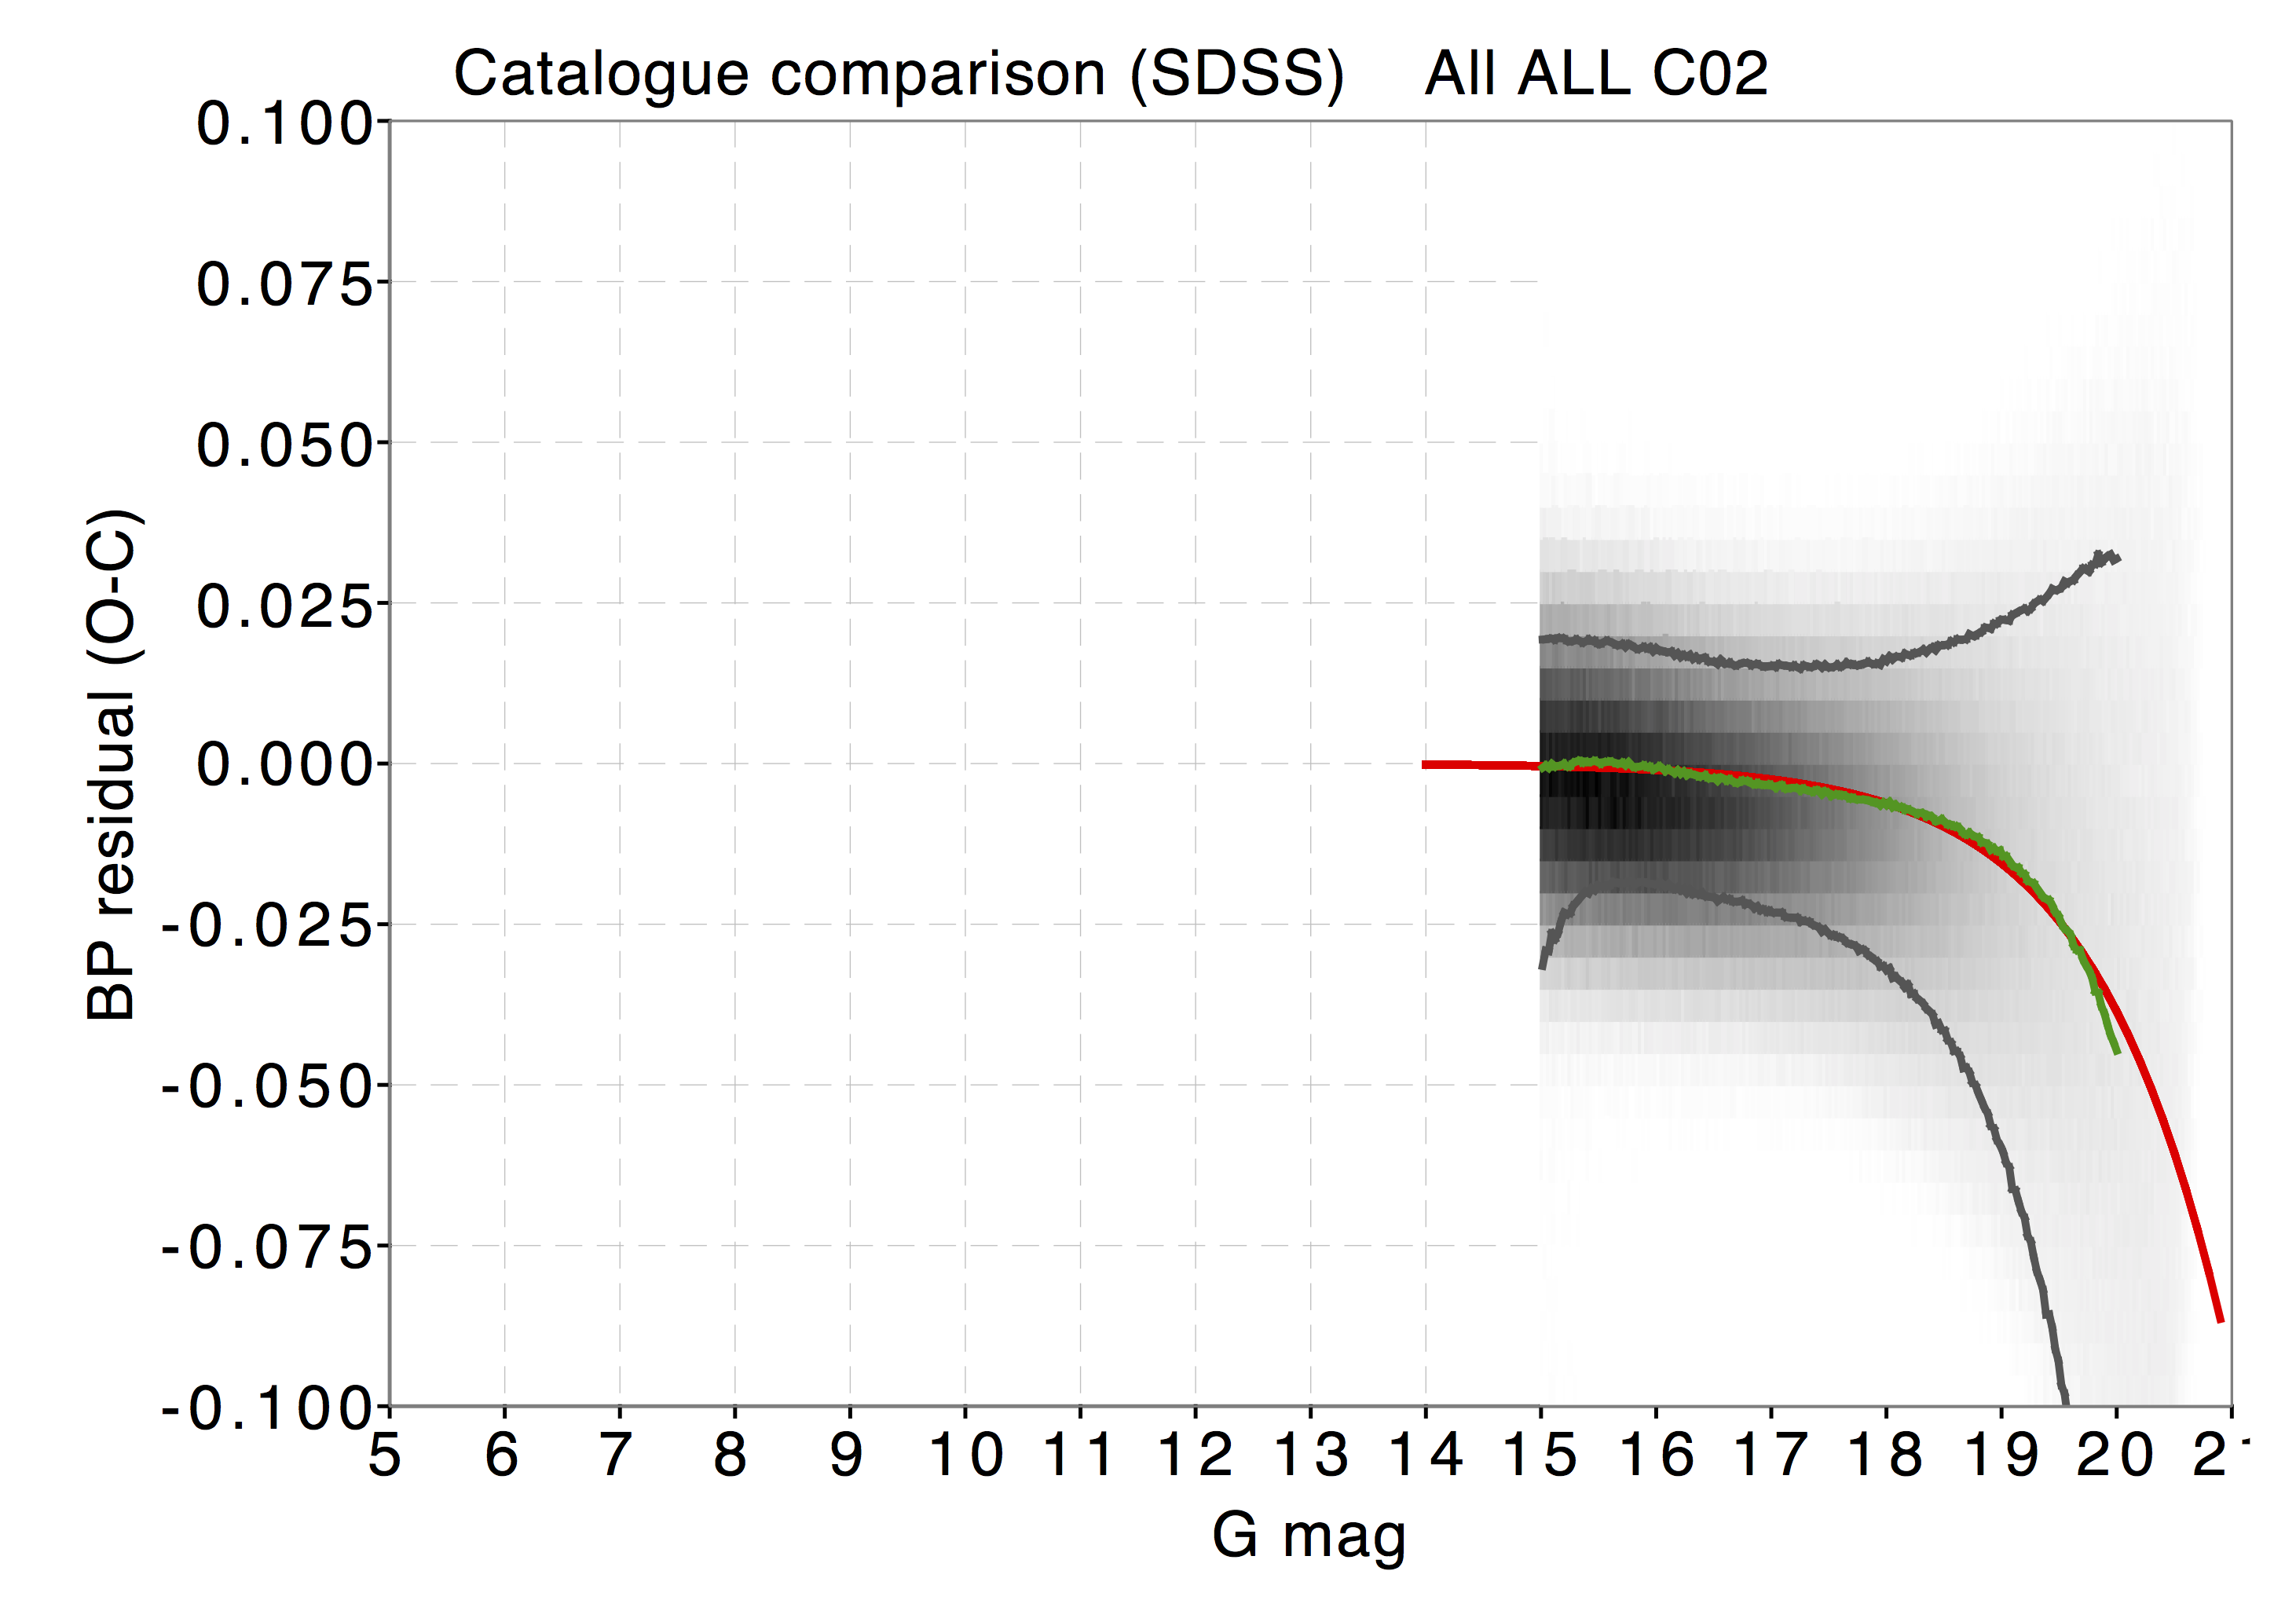
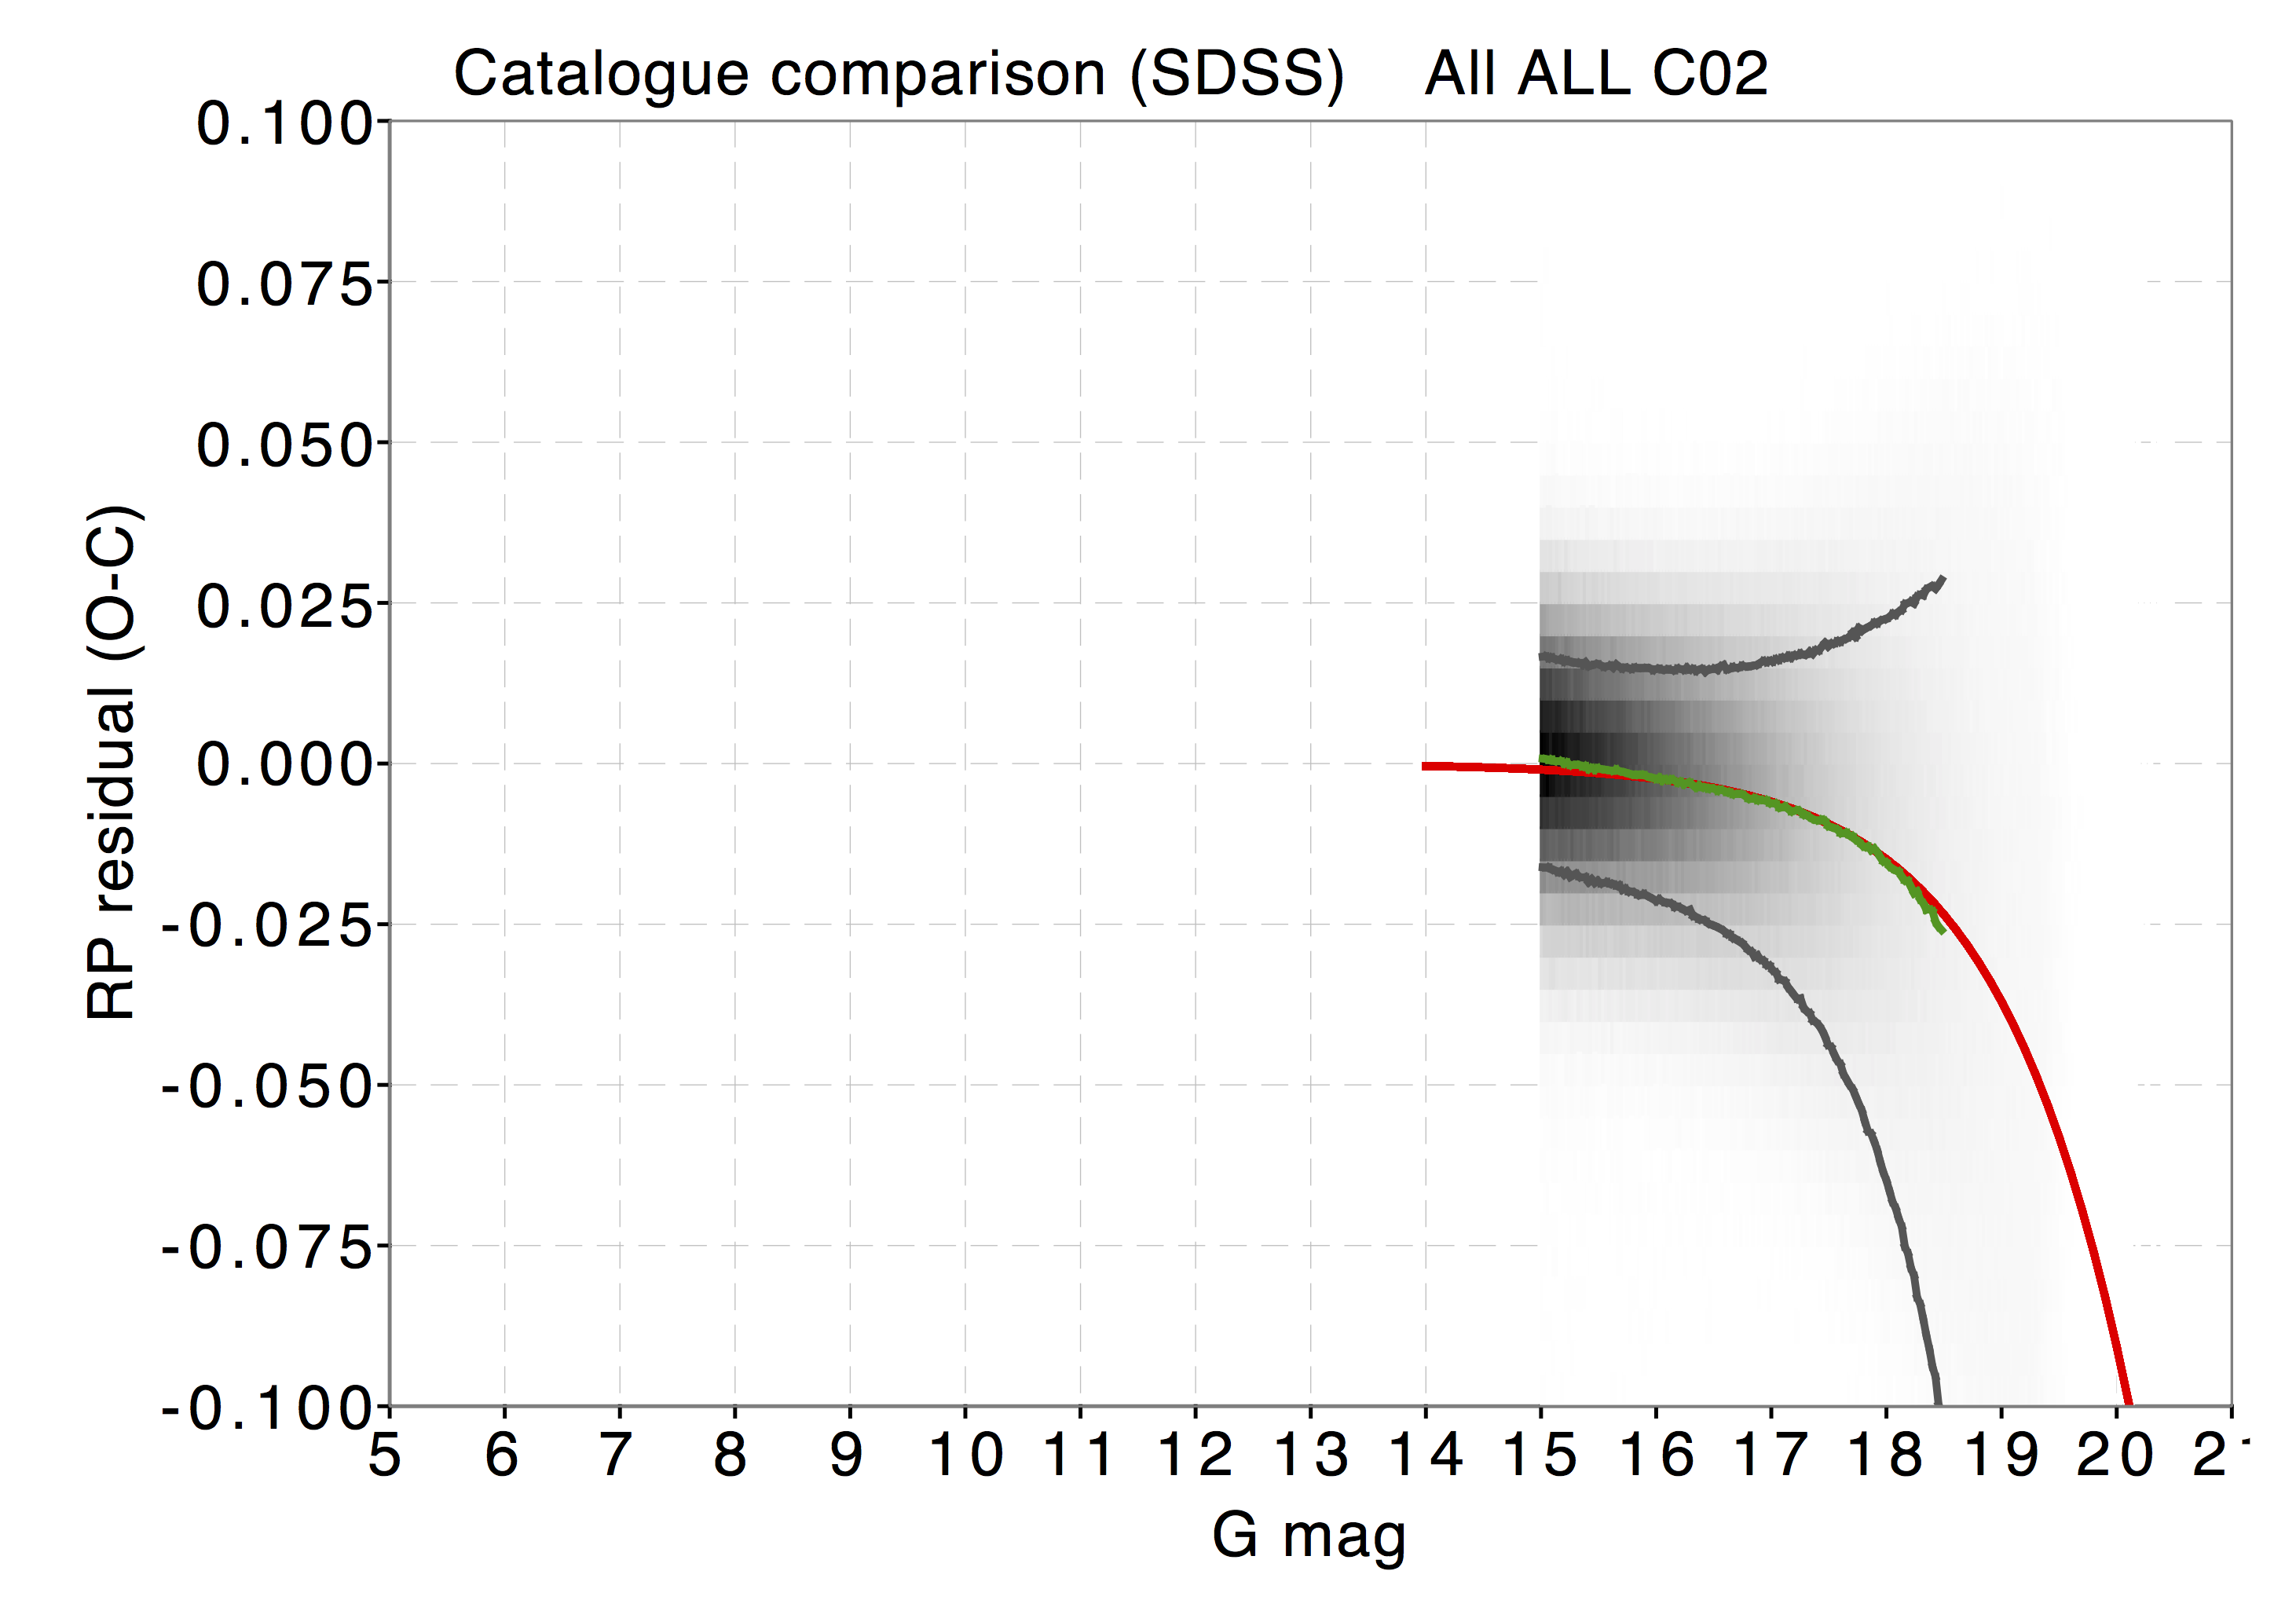
As pointed out in Evans et al. (2017), comparisons with external photometric catalogues can prove useful, but care must be taken that any differences are attributed to the correct source. The photometric precision of Gaia is usually much better than that of the external catalogues, so that the width of the distribution of differences between Gaia magnitudes and those coming from other external catalogues will be dominated by the uncertainties in the external catalogue photometry. The average difference and its variation with magnitude are the most useful indicators when validating Gaia photometry versus other catalogues. It should also be noted that the angular resolution of Gaia is better than that of ground-based catalogues, and in order to avoid high-density regions, where crowding may be a problem, sources close to the Galactic plane () have been excluded from these comparisons. This also reduces any problems linked with reddening in these comparisons.
The main comparisons made for DR2 have been made with respect to Tycho-2 (Høg et al. 2000), APASS (AAVSO Photometric All-Sky Survey, Henden et al. 2015) and SDSS DR12 (Sloan Digital Sky Survey, Alam et al. 2015). In the Gaia DR1 analysis, only a -band comparison was required. In order to avoid complications linked to absorption, luminosity class, and population, a simple approach was used in which the external passbands were compared directly with and no transformations were used. This method was aided by the comparison being out of the Galactic plane, thus avoiding most extinction effects, and it was restricted to the colour range 1.01.2. In this narrow colour range, the colour term between the and bands is very small and contributes very little to the overall width of the comparison. However, for Gaia DR2, comparisons must be made with the and photometry, where the assumption of a small colour term is invalid. Using transformations given in Appendix A, the and photometry from the external catalogues was converted into the three Gaia passbands. The narrow colour restriction was maintained, thus avoiding any problems with the transformations at extreme colour. A zeropoint offset was also applied to aid the comparisons.
Figure 13 shows the comparison with the Tycho-2 catalogue. In the comparison, a small gradient is seen between and 11, resulting in a systematic of up to 10 mmag. This matches the consistency results in Arenou et al. (2018). The and comparisons in the same magnitude range are consistent with no significant differences between the two catalogues. The upturn seen at the faint end in all three comparisons is probably due to a bias in the Tycho-2 data, especially since this upturn is not seen in the APASS comparison.
Figure 14 shows the comparison with the APASS catalogue. The small jump of 2 mmag seen at =13 in the band comparison is probably linked to a Window Class change in Gaia. Although the Gate/Window Class calibration is specifically run to solve this problem, see Carrasco et al. (2016) for more details, it does not remove this effect entirely, and the performance is similar to that of Gaia DR1 at this magnitude. For and , the corresponding Window Class change occurs at =11.5, and the above comparisons show that the calibration has worked very well in this case.
The systematic differences seen at the bright end are likely to originate in the APASS photometry since they are seen in all three comparisons. Comparisons with the Gaia DR1 performance shown in Sect. 10 of Evans et al. (2017), where a bump was seen at =11, indicate that the handling of saturation effects have been improved.
Figure 15 shows the comparison with the SDSS catalogue. The 3–4 mmag jump seen at =16 is associated with another Window Class change in Gaia and indicates that the Gate/Window Class calibration has not fully succeeded in this case. The size of the jump is about half that seen in Gaia DR1.
At the faint end, “hockey stick” features are seen in all three passband comparisons. Assuming that this has a Gaia rather than an SDSS origin, a possible explanation for these trends is that the background subtraction has not been fully successful. In order to estimate the size of these effects on the three passbands, lines have been drawn on the plots in Fig. 15 that represent the effect of a single flux offset that might be representative of an erroneous background determination. These flux offsets are not fits to the data, but representative values. It is still unclear whether a single value can be used for all sources. Additionally, the trends seen at the faint end could also be affected by catalogue incompleteness caused by the magnitude detection threshold in the Gaia data.
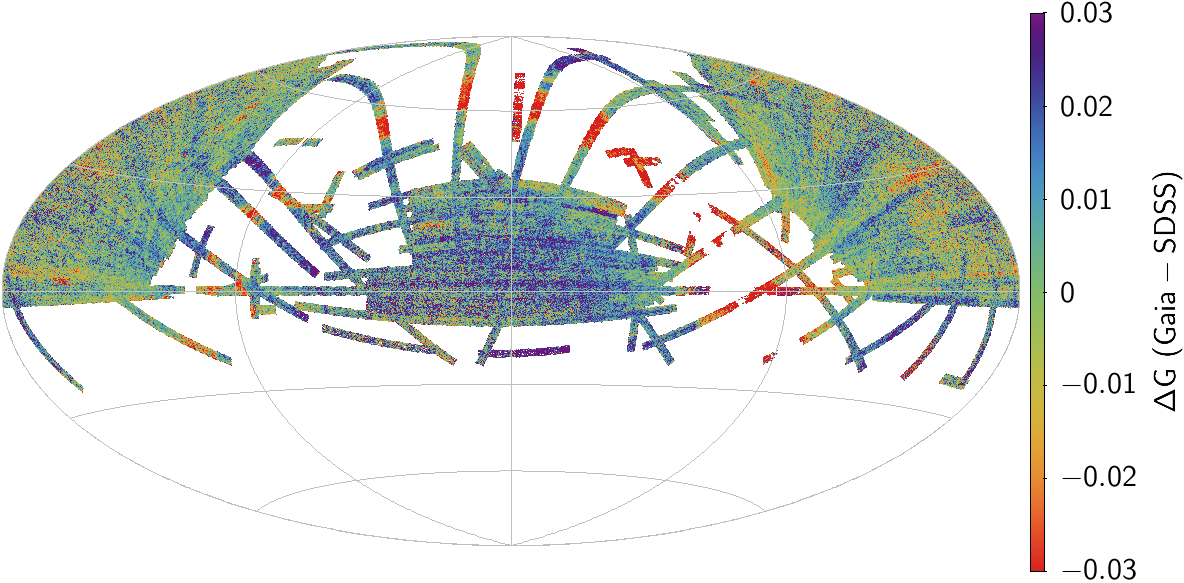
A sky distribution of the median difference in the band between Gaia photometry and SDSS is shown in Fig. 16. All SDSS sources with a cross-match to the Gaia DR2 catalogue and with photometric errors in the and bands lower than were considered for this plot. The -band photometry for the SDSS catalogue was derived from and photometry using the photometric transformations presented in the Appendix A. An additional zeropoint offset of mag was removed to centre the distribution of residuals around zero. Only sources with a colour within the range , well within the validity range of the photometric transformation, were selected. The Galactic plane stands out with larger differences between Gaia and SDSS magnitudes. Beyond the Galactic plane, the systematics are dominated by the SDSS photometry, as proven by the fact that the most prominent features are aligned with the SDSS scans through the sky.
8 BP/RP flux excess
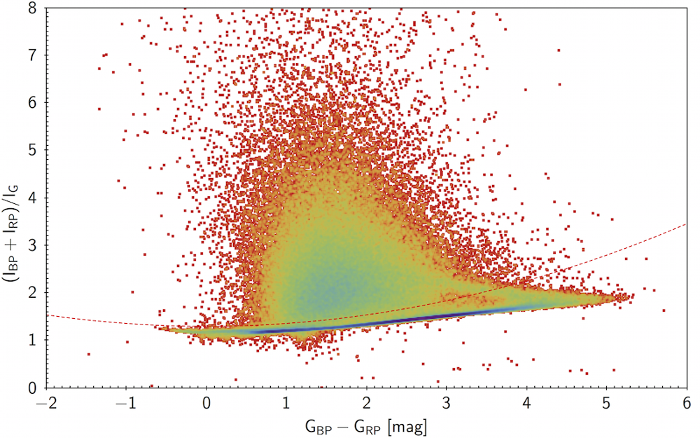
For most sources we have flux estimations in three bands: , , and . The flux, , is determined from a profile-fitting to a narrow image, while the and fluxes, and , give the total flux in a field of arcsec2. These fluxes are therefore much more susceptible to contamination from nearby sources or an unusually bright sky background than the flux. For Gaia DR2, no deblending was applied, and we may expect that the colour information for a source often suffers from contamination. It is therefore recommended to check that the fluxes in the three bands are consistent with the assumption of a source being isolated if accurate colour information is required.
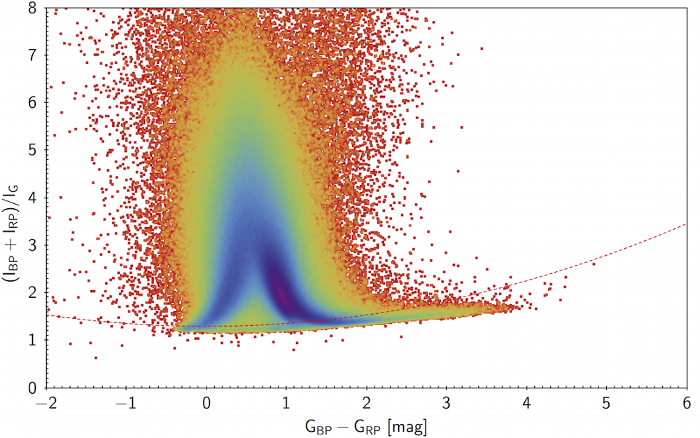
The and passbands overlap slightly and have a somewhat better response in their respective wavelength ranges than , so to a first approximation, we expect the sum of the and fluxes to exceed the flux by only a small factor. We define the phot_bp_rp_excess_factor in the Gaia DR2 archive as the simple flux ratio . Figure 17 shows this factor versus the observed colour for nearby sources in the top panel and for sources towards the centre of the Large Magellanic Cloud (LMC) in the bottom panel. Most of the nearby sources are confined to a narrow band slightly below the dotted line (). We interpret this band as the well-behaved single sources. We also note a cloud of points with excess around 2–3, however, which must be heavily affected, plus points with very low or very high values. The full range extends from 0.02 to more than 700. For the very crowded LMC area, the narrow band of well-behaved sources is still visible, but now more like a lower envelope. The affected sources here cluster at much bluer colours than for the general nearby sources.
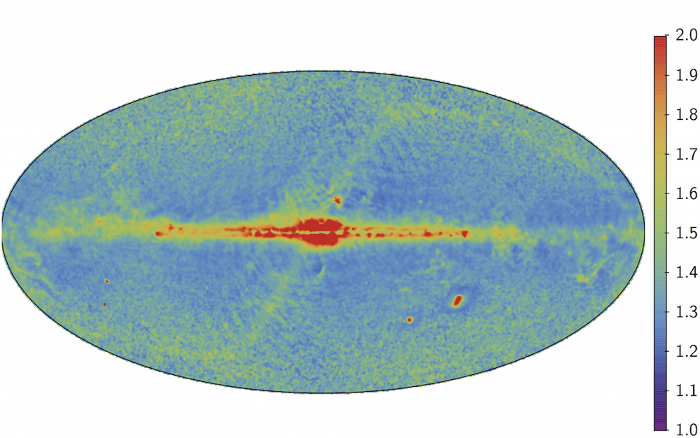
Figure 18 shows the median excess factor across the sky. Very dense areas like the Galactic centre and the Magellanic clouds stand out with high excess levels, as can be expected because of the crowding. The central Galactic regions resemble near-infrared images. We also note a narrow band along the ecliptic plane, where the excess is likely due to insufficient subtraction of zodiacal light. This suggests that the sky background is not always well modelled and can leave an imprint on the fluxes, and thereby the colours, for faint sources.
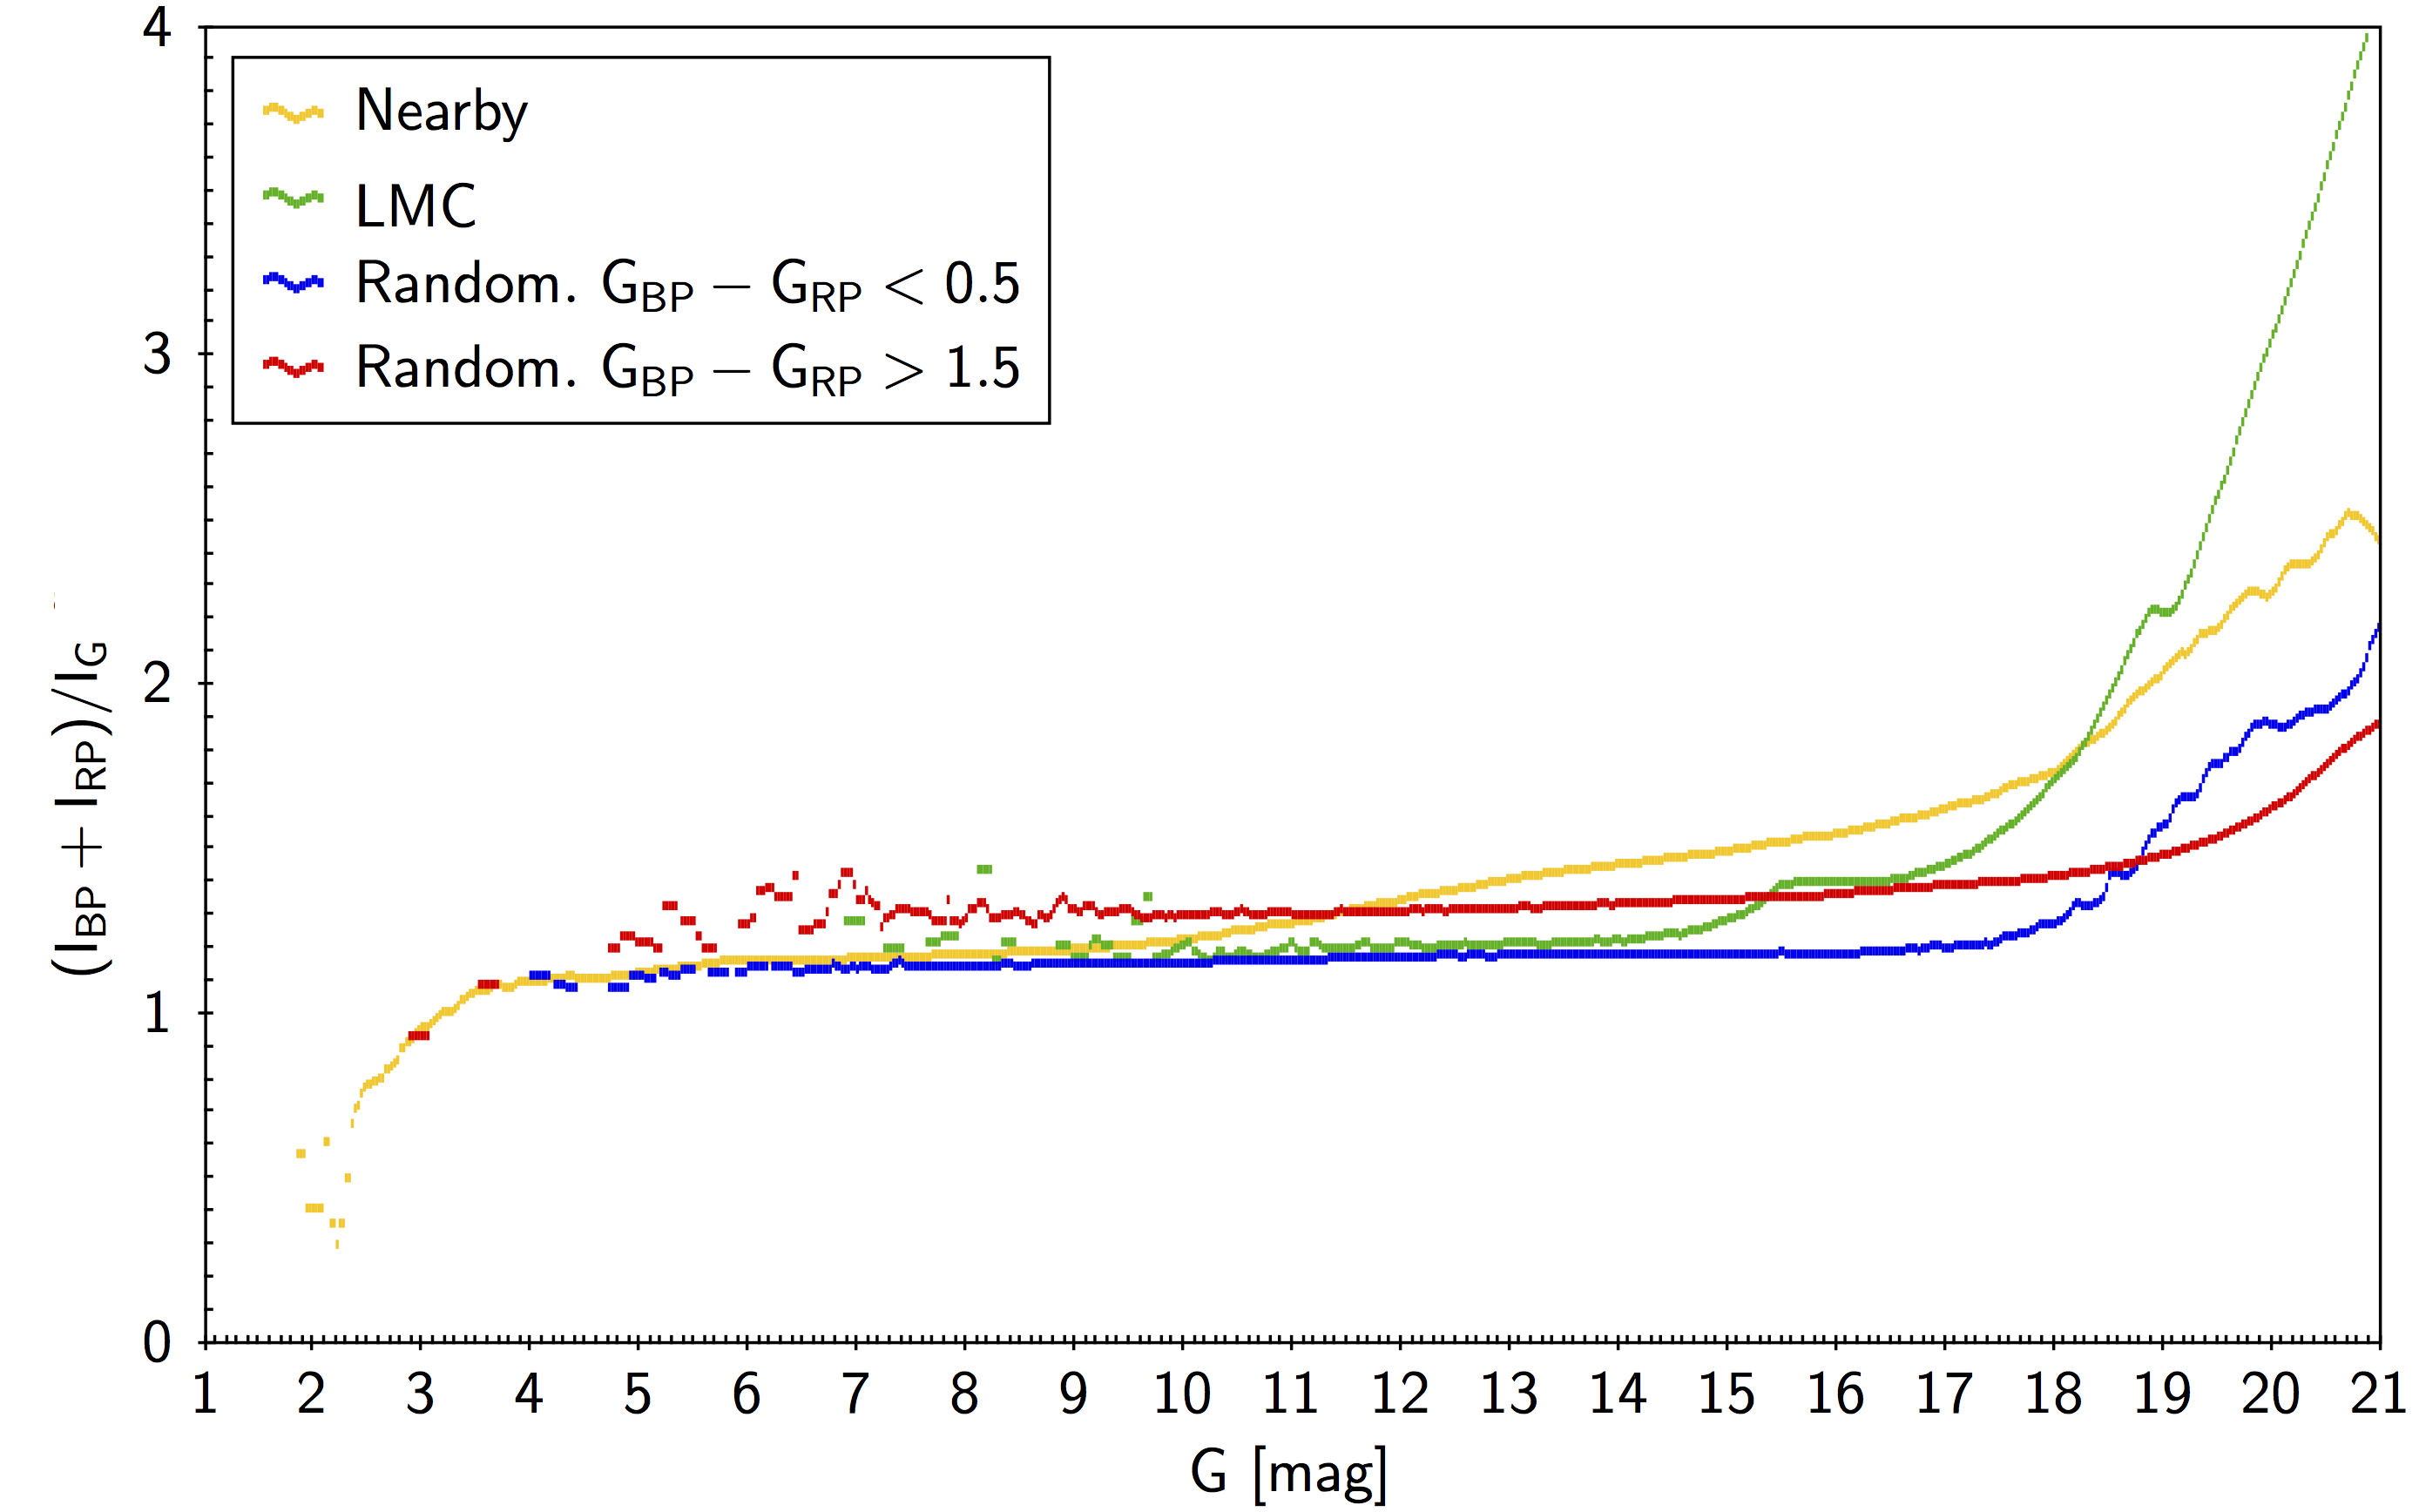
The magnitude dependence of the flux excess is shown in Fig. 19. We show median values for the nearby and LMC datasets, as well as for randomly selected blue and red sources. For sources brighter than 17–18 mag, the behaviour is good, with the exception of the very bright end, that is, below 3.5 mag, where saturation issues are very likely at play. The blue and red sources stay at almost constant levels, while the nearby selection becomes redder at fainter colours. Beyond about 18 mag, the median values shoot upwards, indicating that very many sources show one or more of the above issues.
As mentioned, the flux excess factor may occasionally reach extremely high values that indicate a very serious crowding, processing, or calibration issue. In these cases, the and fluxes have little relation to the source in question, and as a precaution, they have been removed from the data release. The limit applied in Gaia DR2 is a flux excess of five. The diagrams discussed above have all been produced before applying this filter.
Sources can show high flux excess for many reasons. The dominating reasons are binarity, crowding, and incomplete background modelling, but extended objects or galaxies can cause problems. Obviously, the surroundings of very bright sources are a particular challenge. All these problems will mostly affect the and measurements because of the longer windows, but they can also disturb the -band observations.
We therefore recommend that a filter be applied in order to remove the more problematic sources. This can be done with a requirement such as
| (1) |
where is the flux excess, and and must be chosen depending on the characteristics of the sample under study and on how clean a subset is needed.
At the present stage of Gaia data processing, many sources show one or more of these problems, but the number of Gaia sources is very large, and with suitable filtering, many clean sources still remain.
9 Validation of the external flux calibration and passband determination
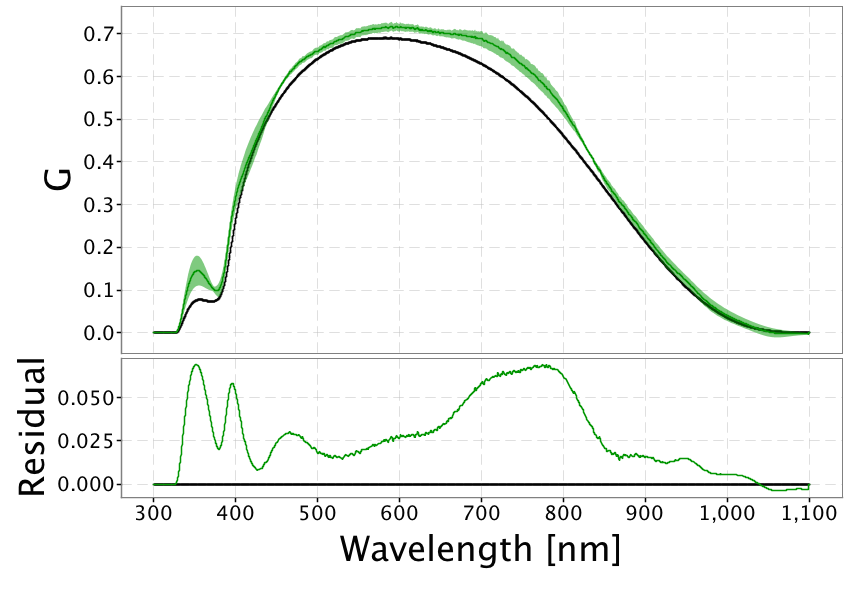
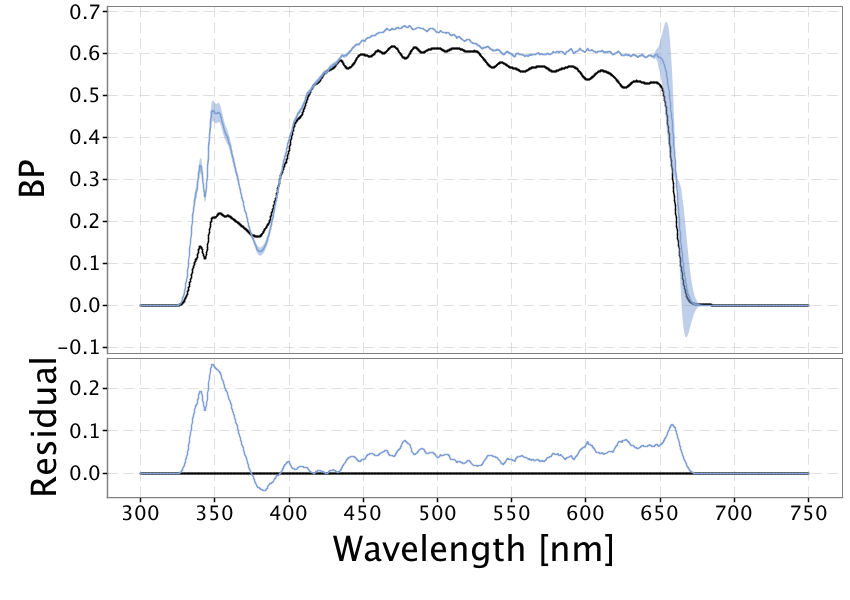
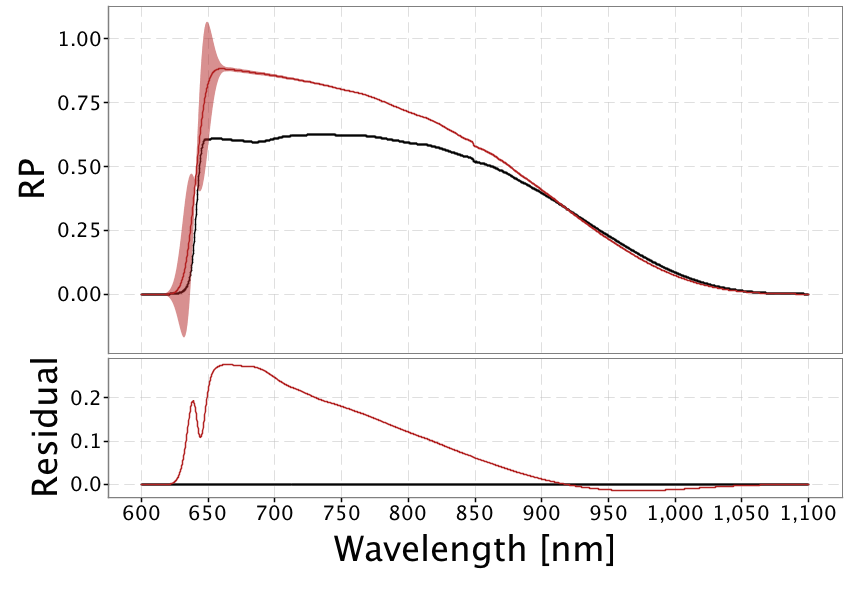
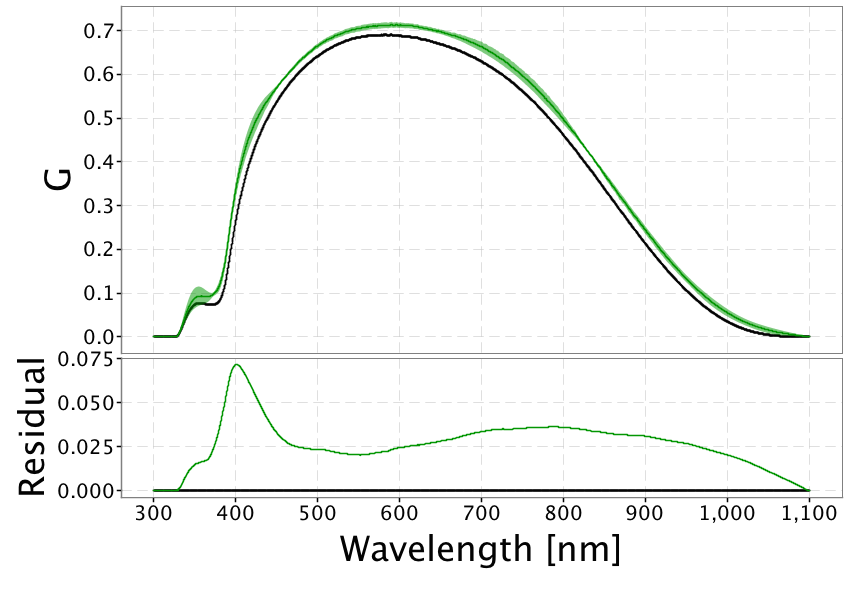
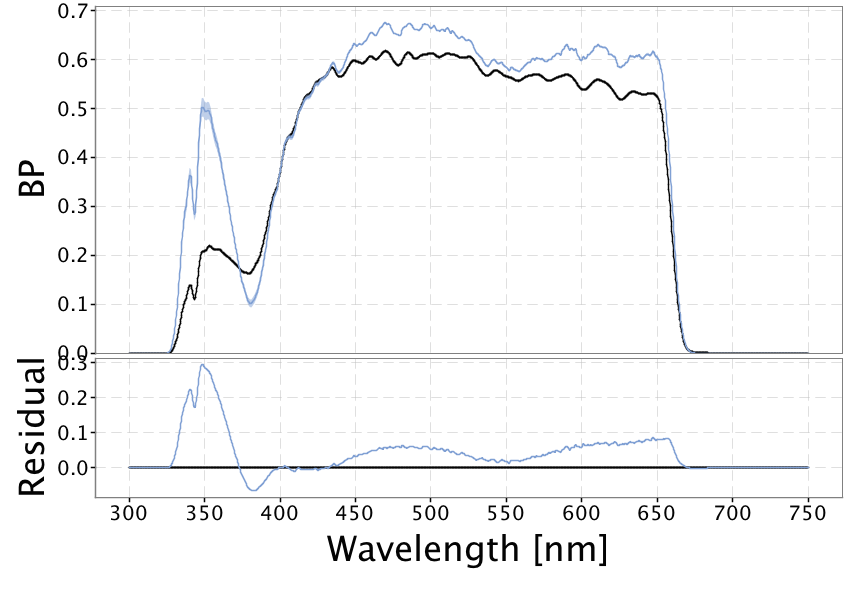
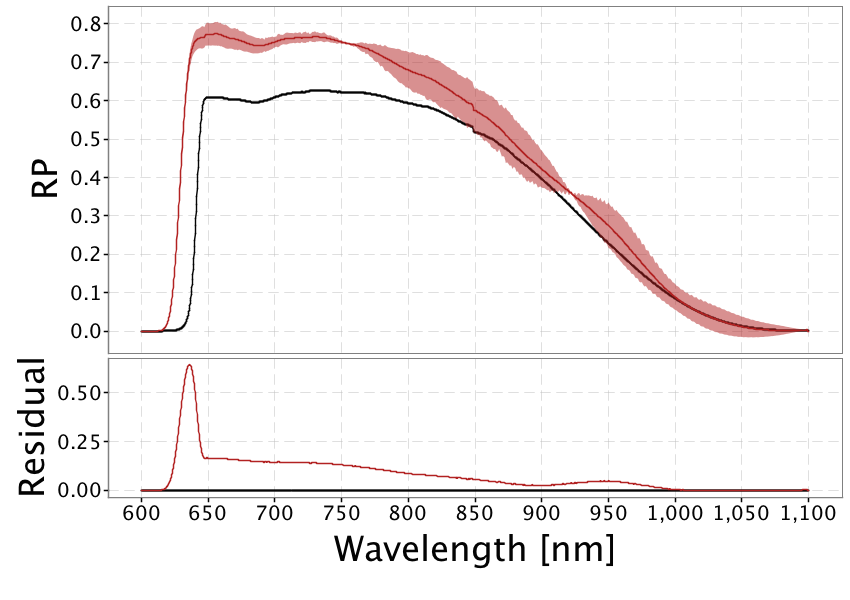
The external calibration effectively provides a means to relate the photometric system defined by the internal calibration to other photometric systems and allows for physical interpretation of data. This is achieved by providing a response function and an absolute zeropoint for each passband. The response function model depends on a set of adjustable parameters that modifies its shape and is designed to reproduce the nominal passband curves given in Jordi et al. (2010) when all parameters are set to zero. The optimal set of parameters is obtained by minimising the residuals between synthetic flux predictions and the corresponding internally calibrated value for a set of spectro-photometric standard stars (SPSS) described in Pancino et al. (2012) and Altavilla et al. (2015). A complete description of the calibration model and algorithms used for Gaia DR2 release can be found in the online documentation. However, any passband derived in this way has an arbitrary component because the SPSS cannot cover the full space of parameters. For this reason, we have built the model based on the pre-launch knowledge about the instrument overall response in the form of nominal passband curves. However, this procedure does not fix the passband shapes univocally because of uncertainties in the various elements that make up the response curve, and above all, because the current photometric system is effectively set by the internal calibration through the selection of internal calibrators and by the algorithms adopted to remove spatial and time-varying instrumental effects. The and cases offer a concrete example of these complexities because the steep cut-offs cannot be properly constrained by the fitting process alone: the assumption made for the Gaia DR2 processing was that the actual cut-offs could only deviate from the nominal cut-offs by small amounts ( nm). The calibrated photonic passbands obtained in this way are shown in Fig. 20. However, a subsequent analysis using BP and RP spectral data of the same SPSS revealed that the nominal curves for the photometer transmissivity used in the modelling process were not the most up-to-date curves provided by the satellite manufacturer, and at least in the RP case, a significant deviation with respect to the correct curve was present in the cut-off position. Thus, the redefinition of the cut-off properties along with some other minor fixes in the procedures led to a revised set of passbands that is shown in Fig. 21. To distinguish between the two sets, we will hereafter use DR2 for the first set and REV for the revised set. An important consequence of this revision is that the photometric zeropoints slightly changed from those derived for the Gaia DR2 processing. Since a reprocessing of the whole catalogue was not feasible in the Gaia DR2 schedule, it has been decided to proceed with the former zeropoints and passbands to ensure internal consistency between different DPAC subsystems, and to publish the revised passbands and zeropoints as a service to those users who wish to make precise prediction of Gaia photometry for isochrones etc. The comparison of the photometric properties of the two sets (by computing synthetic magnitudes on extended library spectral energy distributions, SEDs, with a large coverage in astrophysical parameters) shows that while the predicted magnitudes are basically equivalent in the colour range , a linear trend arises at redder colours that produces differences of up to 0.1 mag and 0.08 mag at in and , respectively.
| Band | ZPDR2 | ZPREV | |||
|---|---|---|---|---|---|
| 25.6884 | 0.0018 | 25.6914 | 0.0011 | 0.0030 | |
| 25.3514 | 0.0014 | 25.3488 | 0.0005 | -0.0026 | |
| 24.7619 | 0.0019 | 24.7627 | 0.0035 | 0.0008 |
Table 1 provides a summary of the zeropoints for the two sets of passbands: ZPDR2 are the zeropoints used for the Gaia DR2 processing, that is, the zeropoints used to convert mean integrated fluxes into the final , , and magnitudes. These zeropoints must be used together with the DR2 passband set to compare for example synthetic magnitudes computed on SEDs with the corresponding published magnitudes.
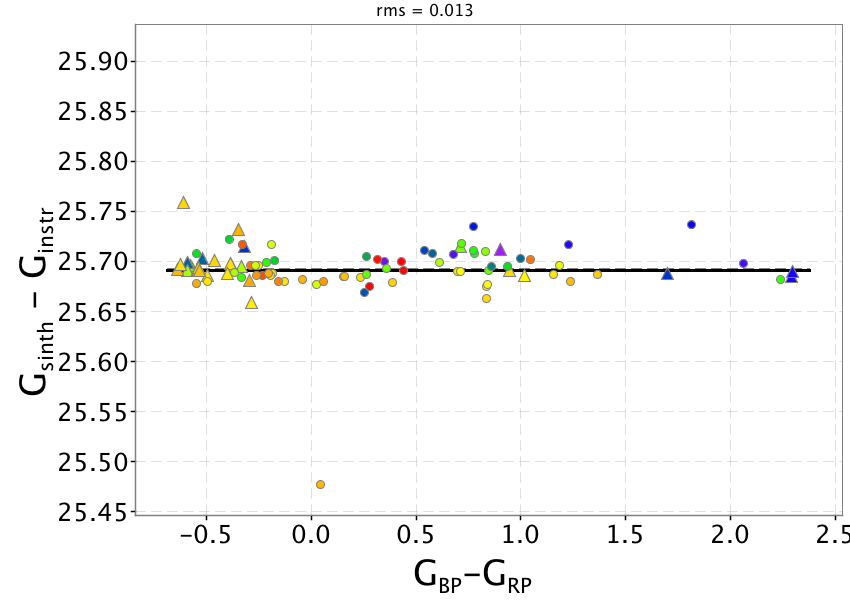
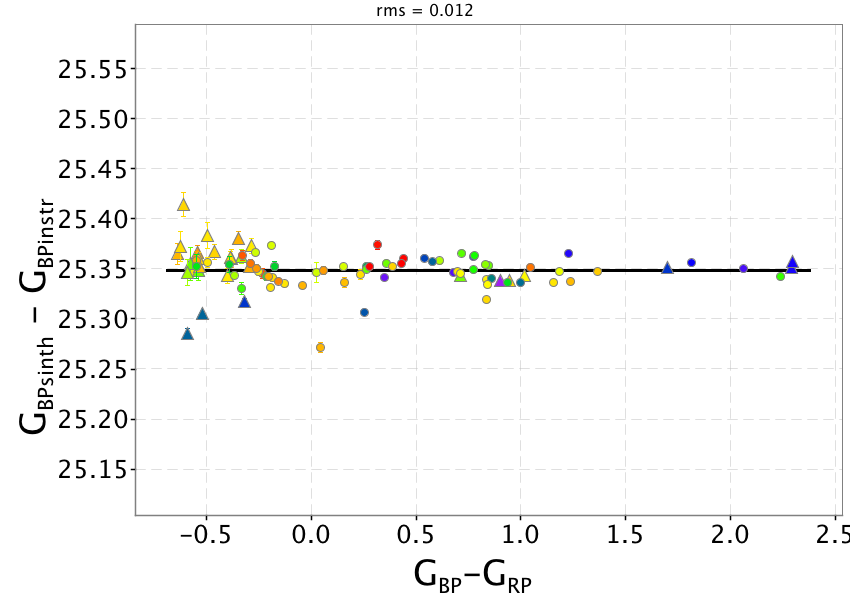
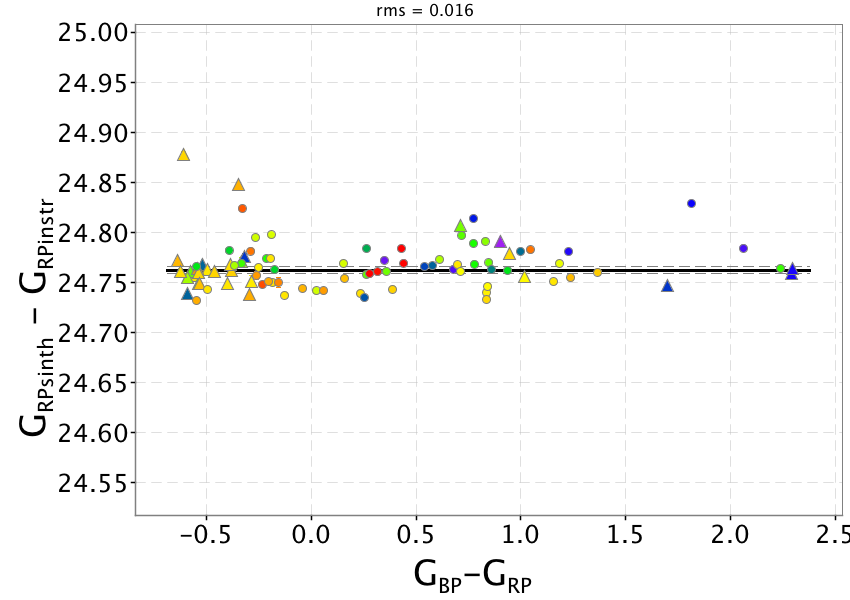
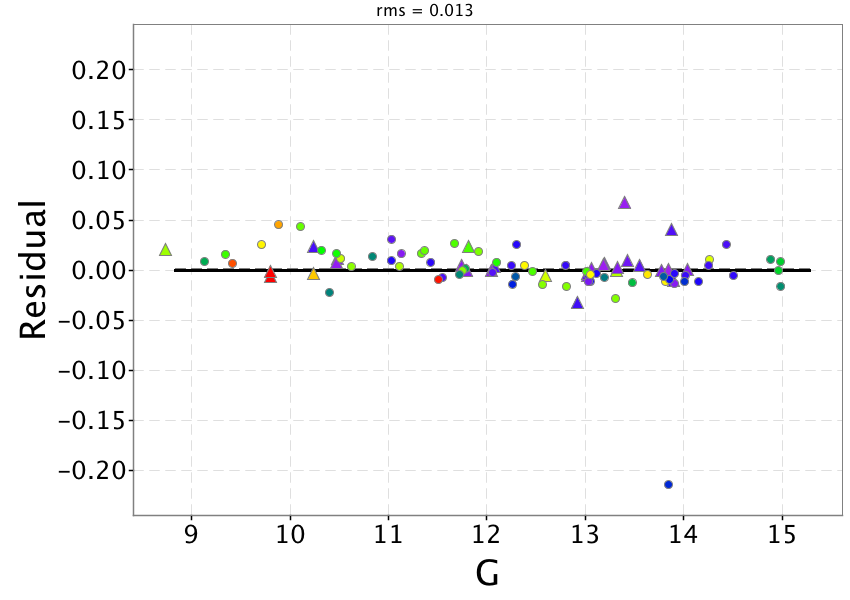
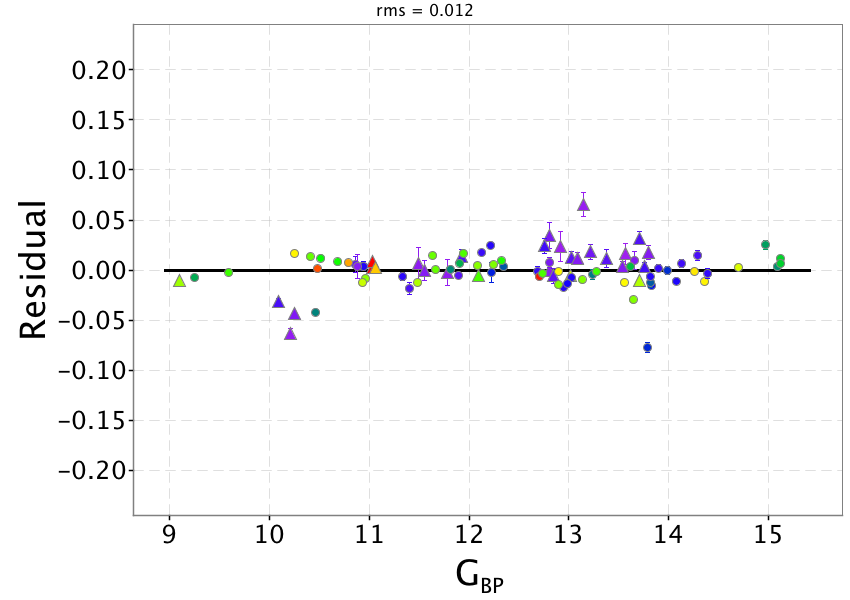
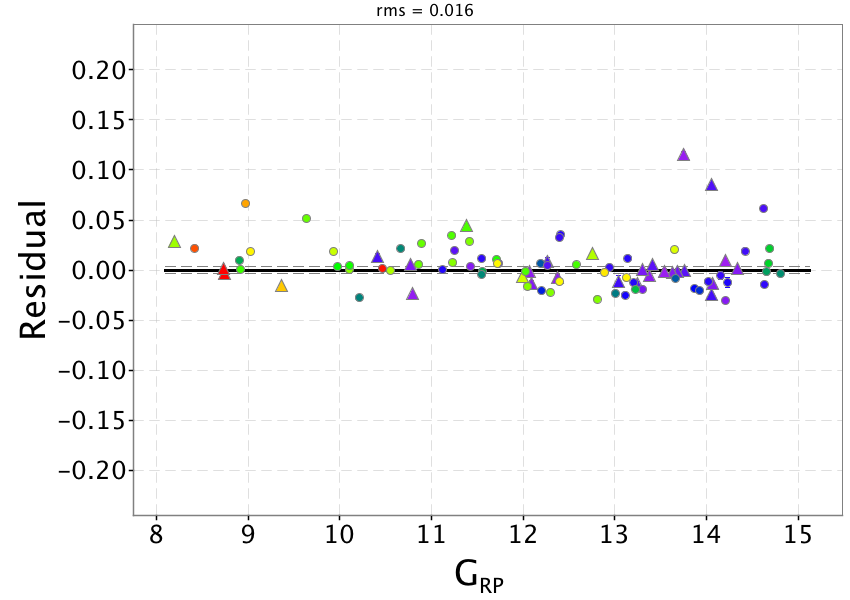
Once the photometric system passbands are calibrated, the direct comparison between synthetic and instrumental magnitudes shown in Fig. 22 exhibits a flat distribution. In this figure the comparison is made by assuming the REV passband set: the corresponding comparison made on the DR2 set is substantially equivalent and is not shown here, but can be found in the online documentation. Notably, the SPSS photometry alone is not sufficient to distinguish between the two sets of passbands. The system zeropoints, shown in the plots as horizontal black lines, are not computed as the mean values of the displayed data, but instead as
| (2) |
where is the Gaia telescope pupil area, wavelengths are expressed in nm, is the calibrated passband, and is the energy flux distribution per wavelength units of the reference Vega spectrum expressed in units of . For the Gaia DR2 release, we assumed as reference distribution the unreddened A0V star Kurucz/ATLAS9 Vega spectrum (CDROM 19) with K, log g dex, dex, and ; this model has been normalized by imposing the condition that the energy flux at is according to Straižys (1992).
The above formula implies that the calibrated passbands are normalised so that a source-integrated flux can be estimated by convolving them with the corresponding SED expressed in units of and scaling the result by the Gaia telescope pupil area.
The residual distributions of the differences with respect to the zeropoints are shown in Fig. 23 as function of the SPSS , , and magnitudes and reflect the self-consistency between the observed and predicted synthetic fluxes. The measured rms of the residuals are 0.013, 0.012, and 0.016 mags for , , and , respectively: these values are in agreement with the Gaia end-of-mission requirement for the SPSS flux precision, which has been set to , and are notably higher than the formal zeropoint errors of Tab. 1 because they also include the contribution from SEDs noise.


As a further validation for calibrated passbands, we have used data from three different spectral libraries, the STIS Next Generation Spectral Library (NGSL) (Heap & Lindler 2007), the CALSPEC spectral database (Bohlin et al. 2017), and the Stritzinger spectral library (Stritzinger et al. 2005) to compare synthetic magnitudes computed with the two set of passbands with the corresponding DR2 magnitudes. The cross-match between the libraries and Gaia DR2 release produced an initial list of 118, 50, and 93 objects for the NGSL, CALSPEC, and Stritzinger library, respectively: selecting sources with and and — to avoid excessive saturation and possible poor matches left the number of objects equal to 40, 43, and 81, respectively. Figure 24 shows the residuals for the three bands as a function of the , , and magnitudes. The top plots refer to the DR2 passbands, and the bottom plots show the residuals obtained with the REV passbands. While the NGSL- and CALSPEC-predicted photometry shows a satisfactory agreement with Gaia DR2 data (with the only exception of CALSPEC data, which exhibit a small systematic trend with magnitudes), the Stritzinger data show a residual of up to mag for sources brighter than . Figure 25 shows the same data as the previous plots as a function of the observed colour. The horizontal green lines represent a linear fit made on data fainter than : the slope is almost zero for all the data sets, and the measured offsets are 0.007, 0.004, and 0.007 and 0.007, 0.003, and 0.008 mag for , , and and the DR2 and REV sets, respectively. The fit was made by applying a sigma-rejection clipping to exclude deviating points, and the red dotted lines represent the final region. In conclusion, the behaviour shown by the two passband sets is almost indistinguishable, as expected in this colour range, because much redder sources would be needed to reveal possible differences. However, the REV passbands are more accurate because they are based on additional constraints from spectral information and are therefore preferable to the DR2 ones, which were used as a preliminary solution for internal use in the downstream processing.
The VEGAMAG system has been chosen by DPAC as the standard reference photometric system for Gaia. However, to facilitate the conversion of Gaia photometry between the two systems, the zeropoints for the AB system (Oke & Gunn 1983) have also been calculated for both sets of passbands and are available in Tab. 2. The details of the methods followed for these calculations can be found in the Gaia DR2 online documentation.
| Band | ZPDR2 | ZPREV | ||
|---|---|---|---|---|
| 25.7934 | 0.0018 | 25.7916 | 0.0018 | |
| 25.3806 | 0.0014 | 25.3862 | 0.0038 | |
| 25.1161 | 0.0019 | 25.1162 | 0.0020 |
10 Statistical properties of the gold, silver, and bronze samples
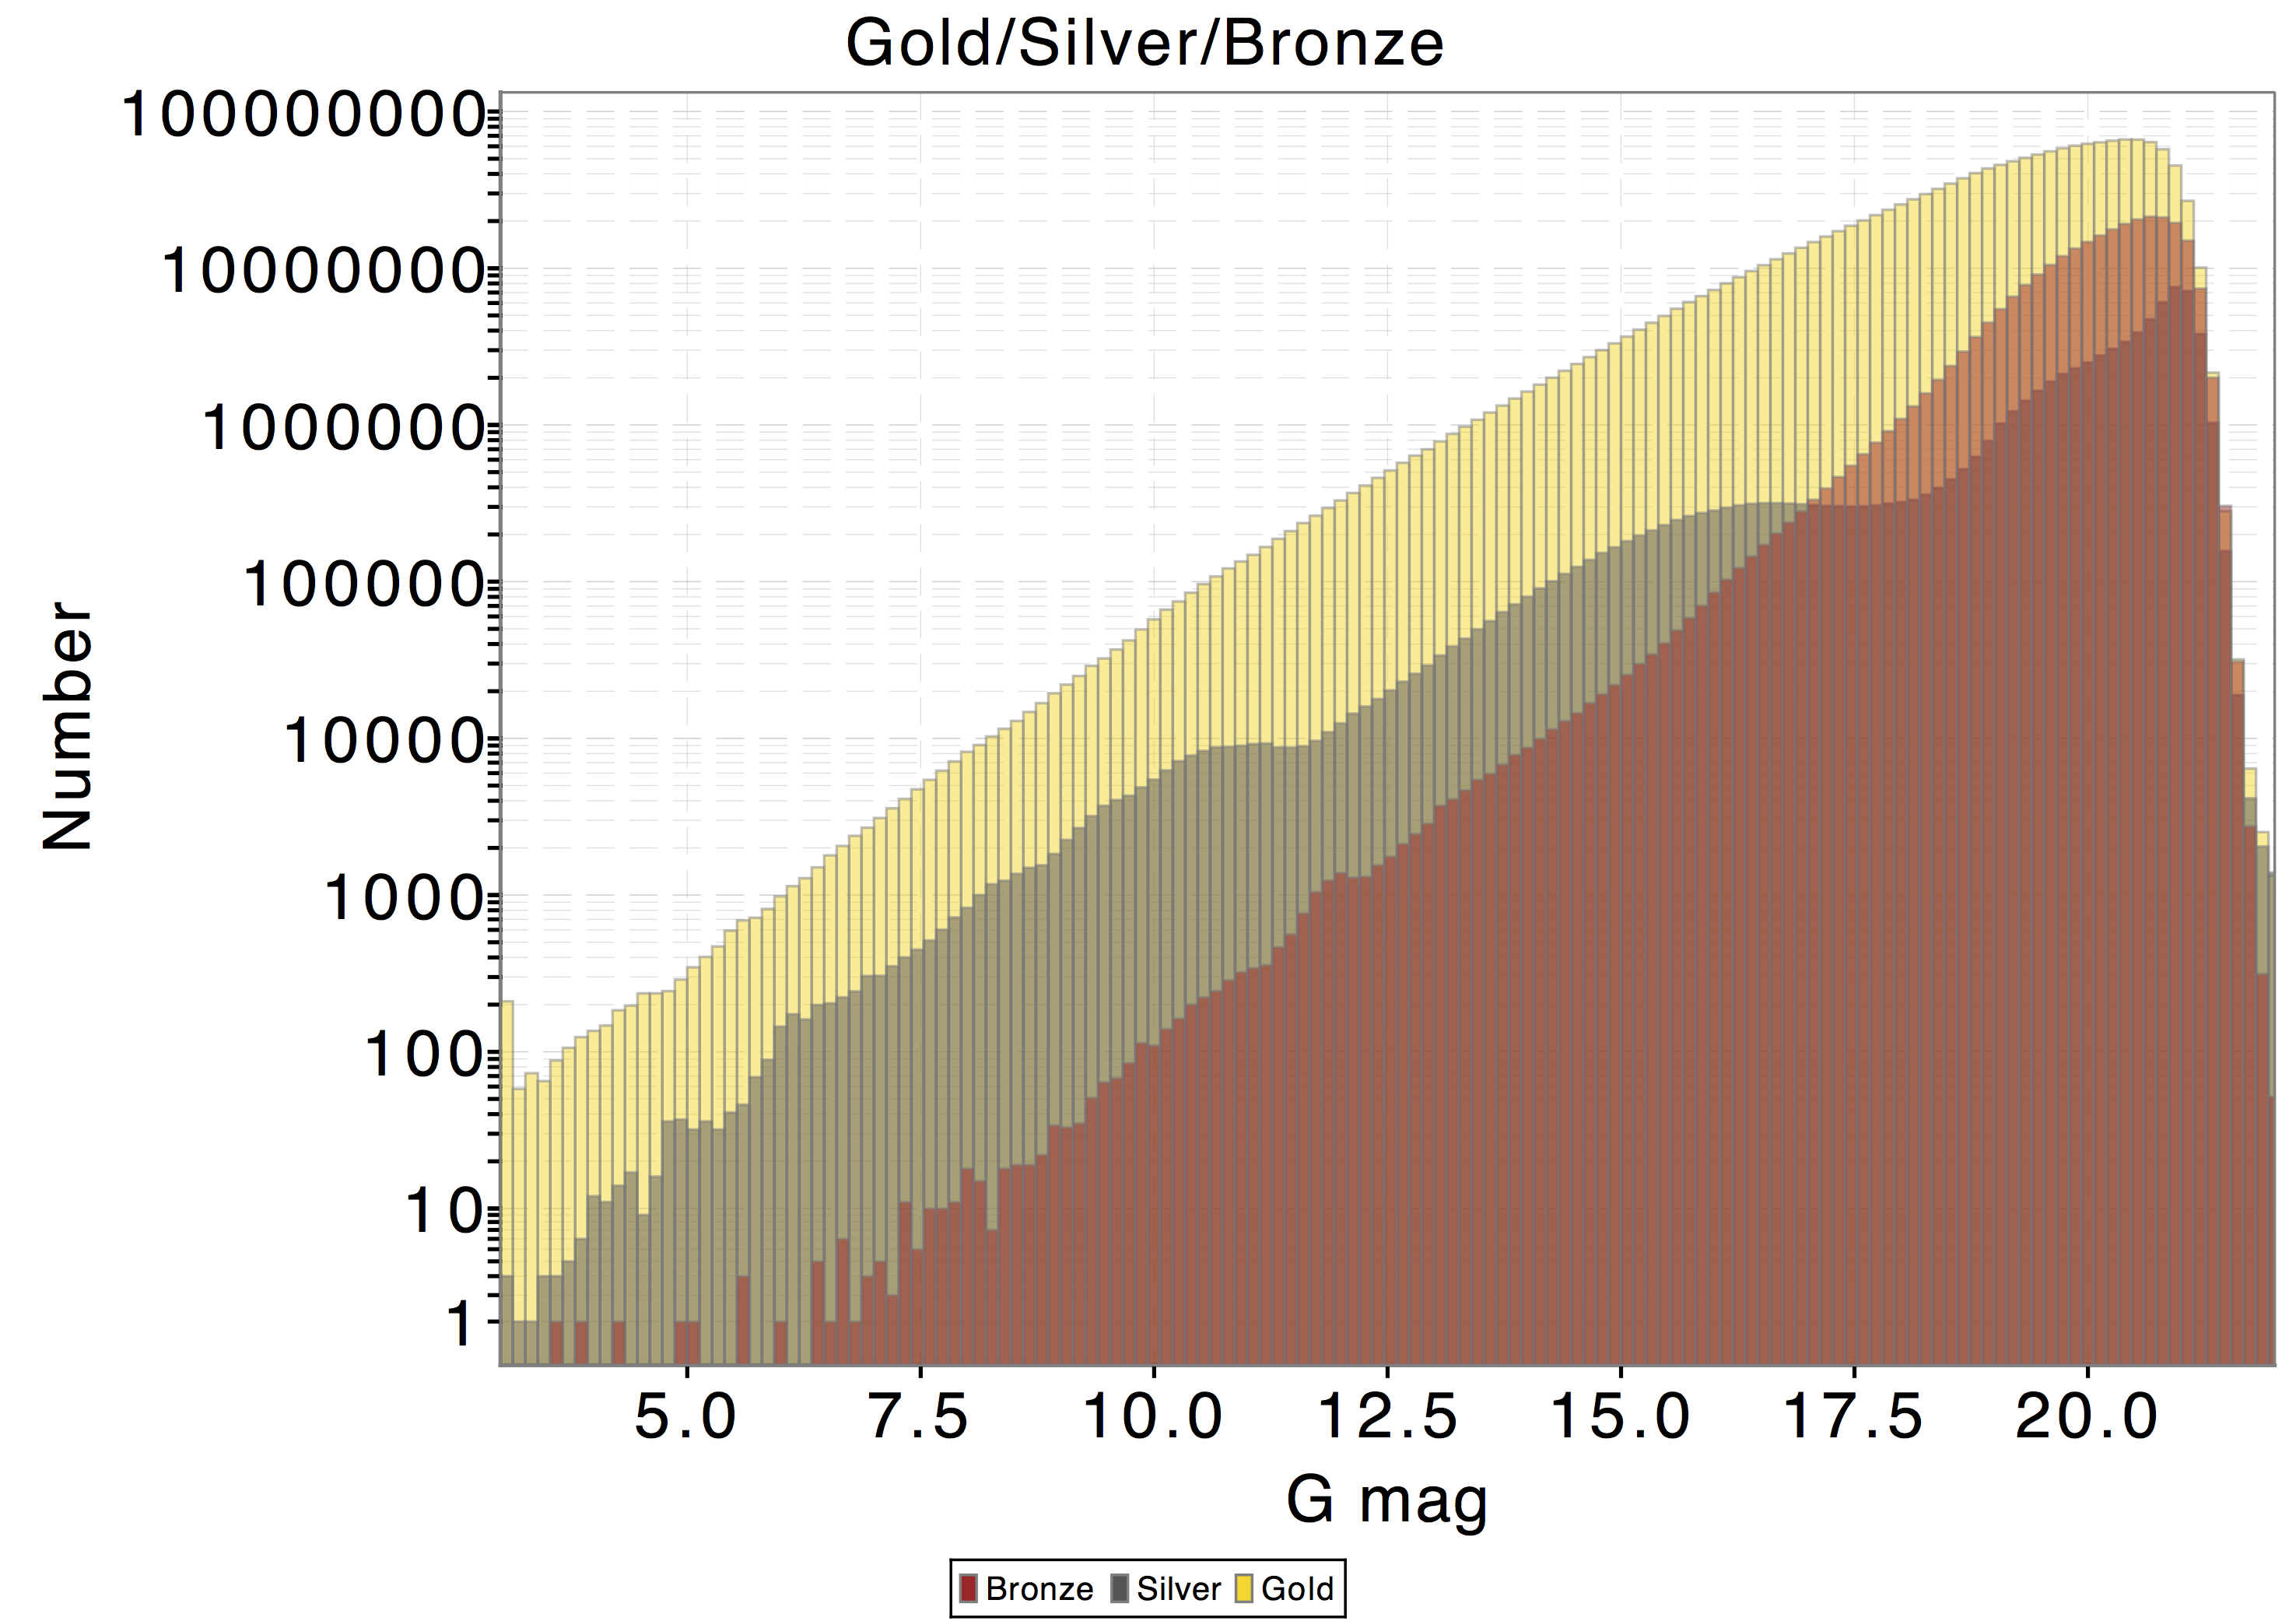
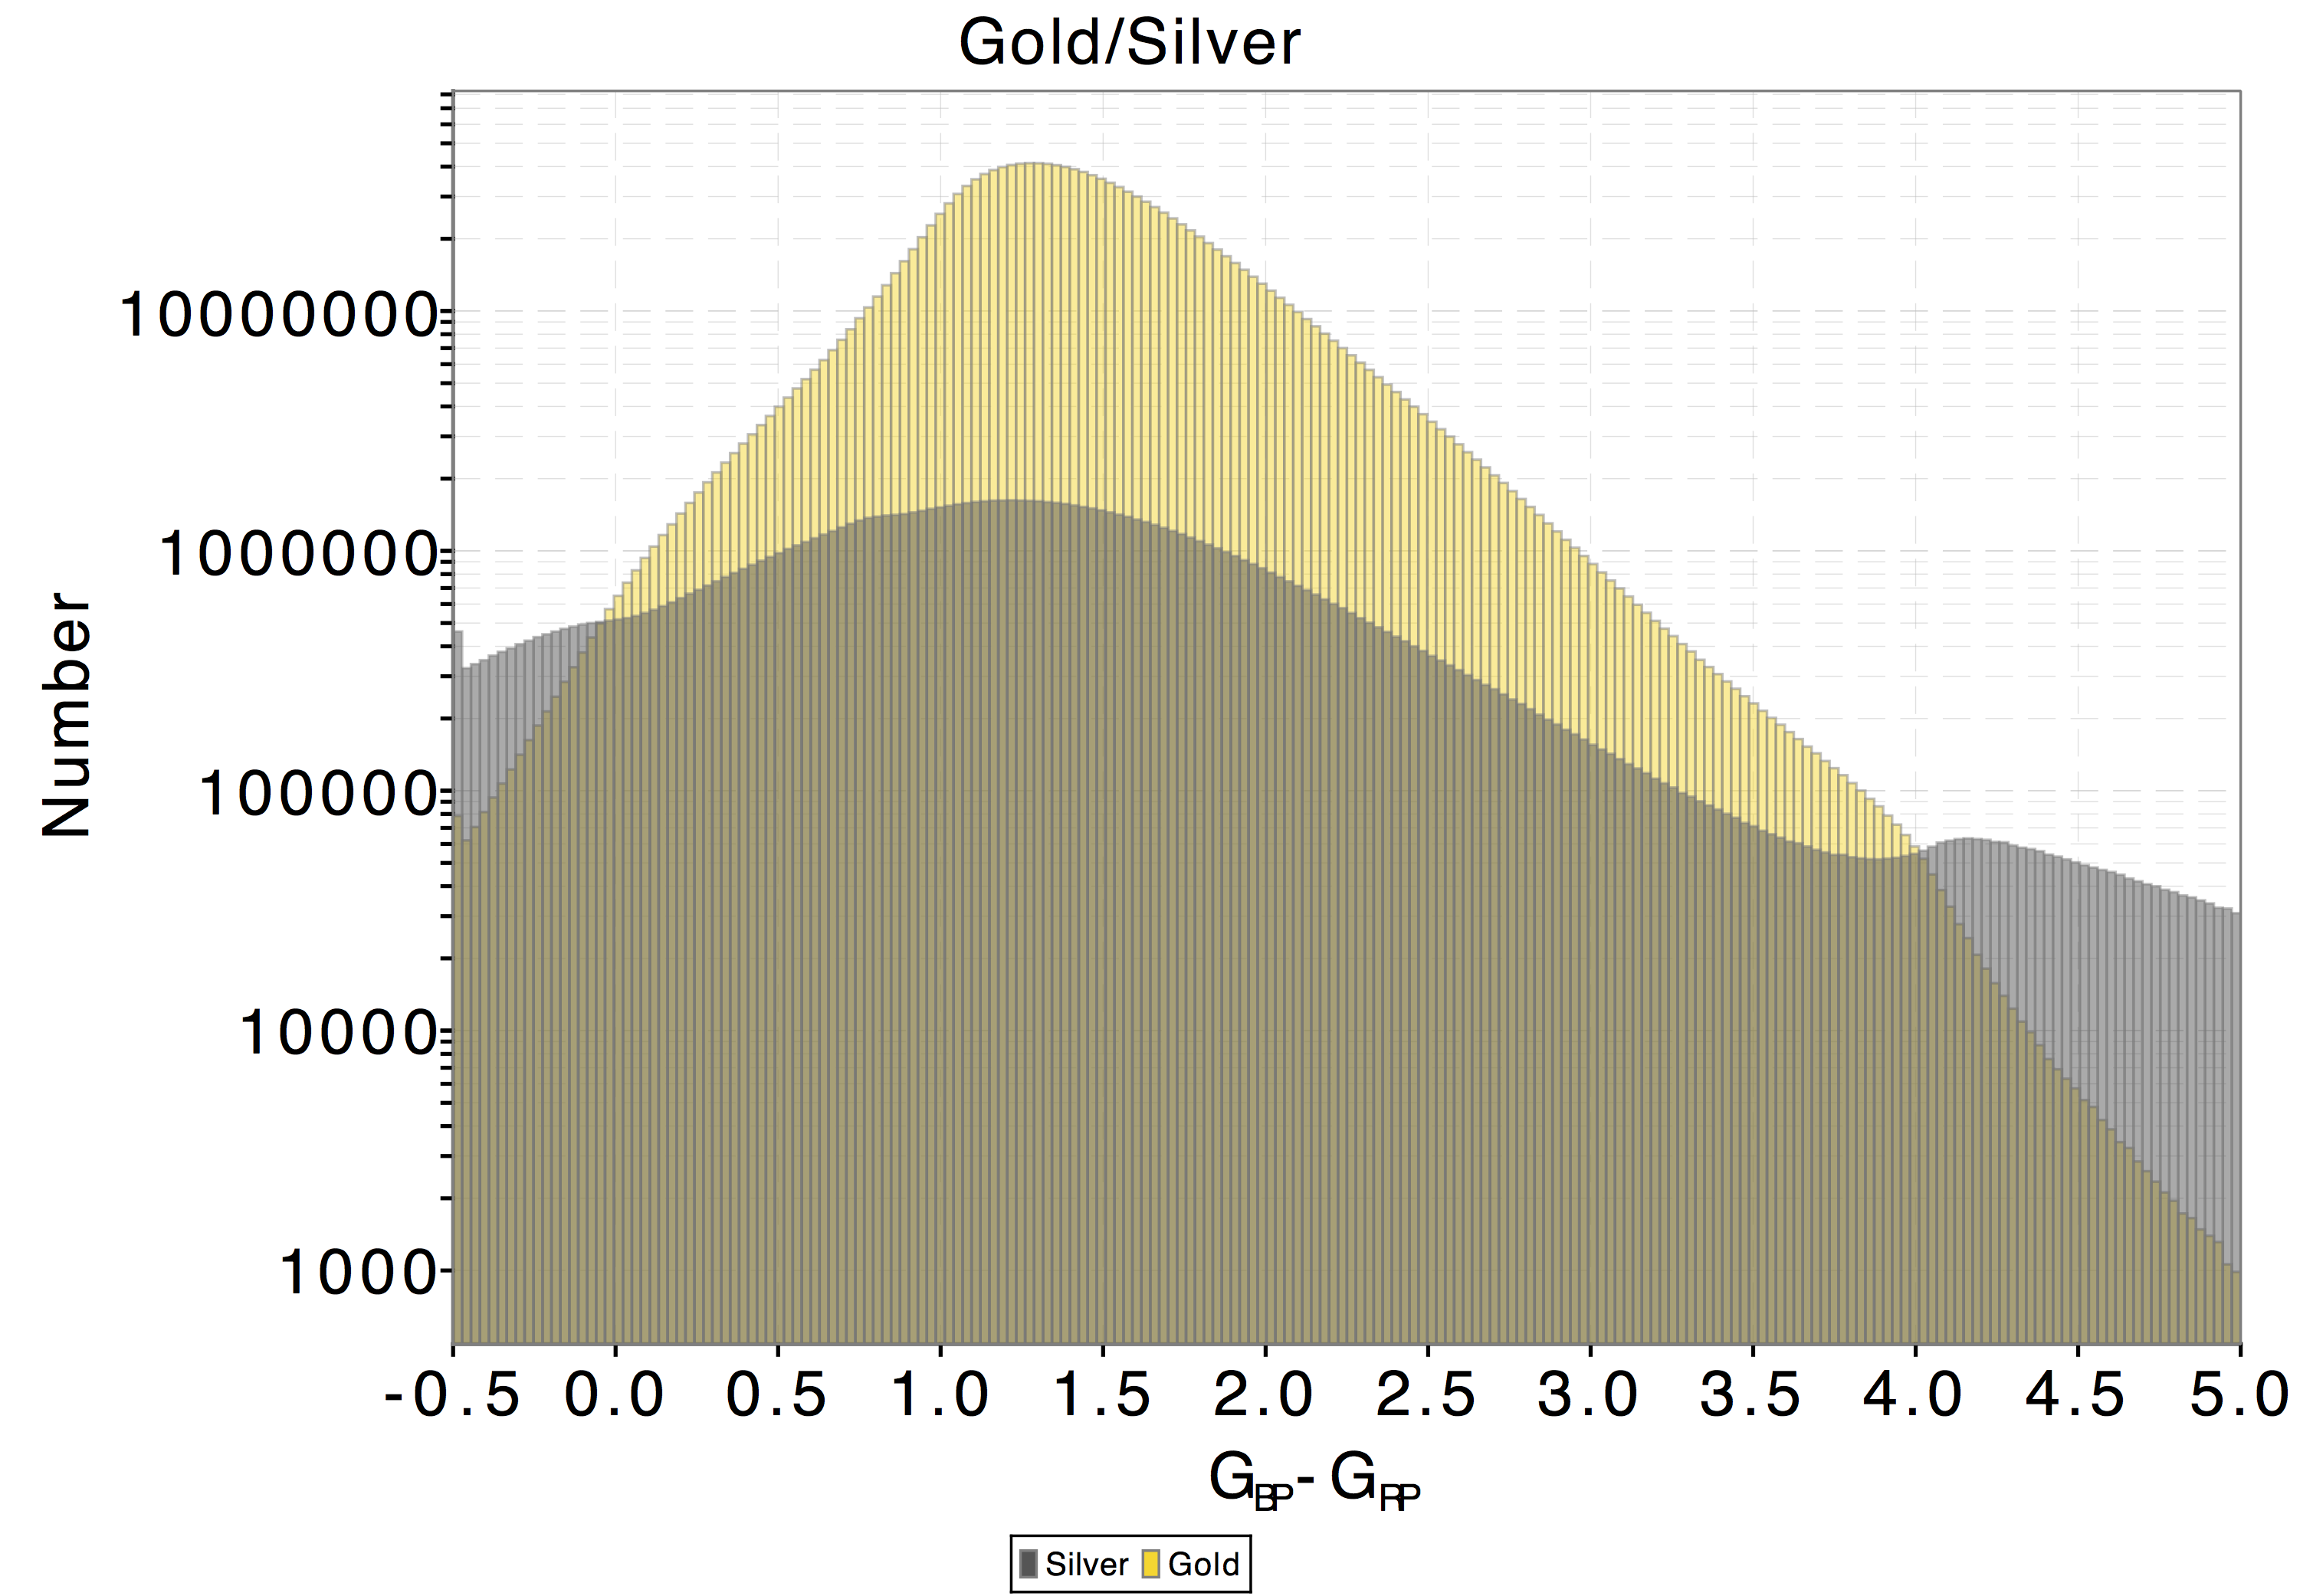
As described in Riello et al. 2018, the sources are described as having gold, silver, or bronze photometry depending on the processing chain used to generate the photometry. Figure 26 shows the magnitude and colour distributions of these samples. The magnitude distribution of the silver sources reflects problems in the processing that have caused sources at various stages to drop out. They were not calibrated in the normal gold processing chain. Although the colour distribution of the silver sources shows elevated levels for sources outside the range 0.0 to 4.0, the distribution is dominated by intermediate colours. Initially, the silver processing chain was developed to calibrate sources with extreme colours that could not be calibrated normally. However, the silver processing chain also picks up the low fraction of sources that fail to be calibrated at other stages in the calibration process. The magnitude distribution of the bronze sources is biased towards the faint end and reflects the difficulty of obtaining colour information at fainter colours. Naturally, there is no colour distribution available for the bronze sources since these, by definition, are sources without Gaia colour information and have been calibrated with a default set of colour information.
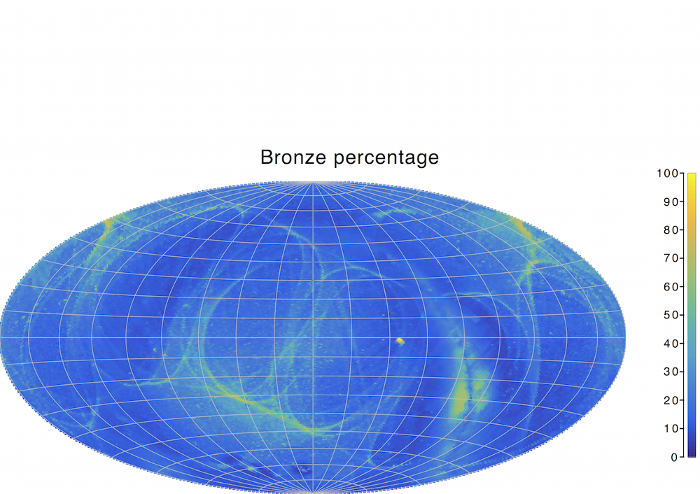
Figure 27 shows the fraction of bronze sources as a function of sky position. In the high-density regions around the Galactic centre, the fraction of bronze sources becomes very high because the BP/RP windows are likely to overlap with neighbouring sources and are therefore not processed. The patterns caused by the Gaia scanning law are also visible here. It is unclear why these areas would have a higher bronze fraction, but a possible cause is spurious detections. The bright point at (RA, dec) = (315∘, 0∘), is a result of a processing problem that prevented the colour information from being available in this area and switched the sources to the bronze processing chain. These sources do not have or photometry in Gaia DR2.
11 Epoch photometry
Although this paper focusses on the source photometric catalogue, which is the main contribution to the release from the photometric point of view, Gaia DR2 will also contain detailed epoch photometry for a small fraction of sources in the same , , and bands. The epoch photometry will be averaged over a FoV transit for the band, and the corresponding error will measure the scatter of the contributing CCD measurements. For and , each epoch flux will come from one single CCD measurement and its associated error.
Problems affecting single CCD transits or all measurements of a FoV transit are marginally important when considering mean source photometry as they will simply slightly increase the scatter of the measurements and therefore the error associated with the mean value. However, the same problems cause outliers in the epoch photometry. For instance, observations affected by hot columns do not currently receive any special treatment. Cases of poor background estimation have also been observed in all bands, either due to lack of calibration data or to a rapidly varying background that could not be captured by the model resolution. Observations taken in the proximity of very bright sources may either have underestimated background or may be spurious detections caused by the diffraction spikes from the bright source. Nearby sources may also cause outliers through the different scanning direction in subsequent scans over a region of sky, for instance, two nearby sources falling in the same window in one scan, but not in others. Furthermore, sky-related effects may well affect perfectly isolated sources because the two FoVs overlap on the focal plane.
In Gaia DR2, only a small subset of problematic epoch measurements will be flagged as rejected in the photometric processing. These are non-nominal cases (such as truncated windows and observations taken with more than one gate activated during the integration time), poor results from the image parameter determination, measurements that could not be calibrated because no appropriate calibration was available. Additional filtering will be done by the system processing the variability data (Holl et al. 2018), and the corresponding epochs will be correspondingly flagged in the catalogue, but it is likely that many of the above events will not be reported. Any subsequent analysis using the epoch photometry in Gaia DR2 should be robust against outliers.
12 Conclusions
This paper presents the photometric content of the Gaia DR2. This includes mean source photometry in the passband for 1.7 billion objects and in the integrated and passbands for about 1.4 billion objects. An estimate of the three photometric passbands, based on a set of spectro-photometric standards with high-quality ground-based reference data, will also be published together with the corresponding zeropoints. As detailed in Sect. 9, the passband definition at this stage is not unique because of limits both in the information available in the photometric data and in the set of standard sources available. A better estimate of the three passbands is also presented in this paper. Although this is also based on the same set of standards and is therefore not fully constrained, it has been determined taking full advantage of the spectral data as well as the photometry and therefore gives a more accurate representation of the Gaia average instrument and the internal reference photometric system.
The Gaia DR2 will also contain epoch photometry in the same three bands for a small fraction of sources that is classified as variables. More details on these data are given in Holl et al. (2018). At this stage in the mission, epoch photometry still shows outliers that are due to problems that affect measurements at the CCD and FoV level.
The accompanying paper, Riello et al. (2018), provides a detailed description of the photometric processing that led to the generation of the Gaia DR2 catalogue. Results of the detailed validation campaign have been included in this paper. Validation takes place at various levels during the photometric processing. Most of the validation is purely internal and is based on a careful analysis of the calibration parameters, on convergence metrics for the iterative process leading to the definition of the internal photometric system, on the analysis of the residuals of the calibration process, and on statistical distribution of the photometric errors at various stages. Comparisons with external catalogues are also useful, but may be affected by the precision and systematics in the external catalogues.
For the Gaia DR2 photometric data, our internal validation indicates that a calibration uncertainty of mmag has been reached on the individual observations for the band. Slightly larger uncertainties of and mmag are estimated for and , respectively. The expected error distribution will depend on the number of individual measurements and on other contributions such as read-out noise and photon noise. Validation against several external catalogues shows that systematic effects are at the 10 mmag level except for the brightest sources ( mag).
Section 8 in this paper shows the result of an investigation on the consistency between the and and photometry. Given the passband definition, the flux in the band is expected to be close to the sum of the and fluxes. We have therefore defined a BP/RP flux excess factor as the ratio between the sum of the and fluxes and the flux. Most sources in the catalogue follow a distribution of BP/RP flux excess factor close to 1 with a smooth trend with colour. This quantity is included in the released data, and users are encouraged to use this to select data for their photometric studies.
A final caveat should be given related to the BP/RP flux excess factor and in general the mean source photometry for variable sources. Even though the algorithm applied to generate the mean photometry has been improved with respect to Gaia DR1, with the addition of robust outlier rejection based on the full distribution of the individual measurements, this is still not optimal for variable sources. The larger scatter of the measurements in the case of a variable source implies that outliers may still be within a few sigma from the median value and therefore are not rejected. Faint outliers, with correspondingly small uncertainties, may shift our weighted average estimate of the mean source photometry by several magnitudes. Moreover, outliers may not be present in all bands. This will affect the reliability of the BP/RP flux excess factor, the value of which is entirely based on mean photometry in the three bands. Photometric studies of variable sources should take advantage of the provided epoch photometry when possible.
It is intrinsic in the cyclic nature of the Gaia processing that the quality of the data products will improve at each release through the increased amount of data available, the better treatment of the known instrumental effects, and the more sophisticated calibration models and algorithms. Each new release will therefore allow new challenging research to be pursued, even more so thanks to the new data products. Future releases will see the gradual inclusion of epoch photometry and low-resolution spectral data for all sources, thus creating the most complete and accurate photometric catalogue to date.
Acknowledgements.
This work presents results from the European Space Agency (ESA) space mission Gaia. Gaia data are being processed by the Gaia Data Processing and Analysis Consortium (DPAC). Funding for the DPAC is provided by national institutions, in particular the institutions participating in the Gaia MultiLateral Agreement (MLA). The Gaia mission website is https://www.cosmos.esa.int/gaia. The Gaia Archive website is http://gea.esac.esa.int/archive/. This work has been supported by the United Kingdom Rutherford Appleton Laboratory, the United Kingdom Science and Technology Facilities Council (STFC) through grant ST/L006553/1, and the United Kingdom Space Agency (UKSA) through grant ST/N000641/1. This work was supported by the MINECO (Spanish Ministry of Economy) through grant ESP2016-80079-C2-1-R (MINECO/FEDER, UE) and ESP2014-55996-C2-1-R (MINECO/FEDER, UE) and MDM-2014-0369 of ICCUB (Unidad de Excelencia “María de Maeztu”). This work was supported by the Italian funding agencies Agenzia Spaziale Italiana (ASI) through grants I/037/08/0, I/058/10/0, 2014-025-R.0, and 2014- 025-R.1.2015 to INAF and contracts I/008/10/0 and 2013/030/I.0 to ALTEC S.p.A and Istituto Nazionale di Astrofisica (INAF). This research has made use of the APASS database, located at the AAVSO web site. Funding for APASS has been provided by the Robert Martin Ayers Sciences Fund.We thank A. Vallenari for supplying us with spectra for the validation of the external flux calibration and passband determination.
References
- Alam et al. (2015) Alam, S., Albareti, F. D., Allende Prieto, C., et al. 2015, ApJS, 219, 12
- Altavilla et al. (2015) Altavilla, G., Marinoni, S., Pancino, E., et al. 2015, Astronomische Nachrichten, 336, 515
- Andrae et al. (2018) Andrae, R., Fouesneau, M., Creevey, O., et al. 2018, A&A, this volume, DPACP-43: First astrophysical parameters
- Arenou et al. (2018) Arenou, F. et al. 2018, A&A, this volume, DPACP-39: Catalogue validation
- Bohlin et al. (2017) Bohlin, R. C., Mészáros, S., Fleming, S. W., et al. 2017, AJ, 153, 234
- Carrasco et al. (2016) Carrasco, J. M., Evans, D. W., Montegriffo, P., et al. 2016, A&A, 595, A7
- Castañeda et al. (2018) Castañeda, J., Clotet, M., et al. 2018, A&A, this volume, DPACP-45: Cross-match
- Evans et al. (2017) Evans, D. W., Riello, M., De Angeli, F., et al. 2017, A&A, 600, A51
- Fabricius et al. (2016) Fabricius, C., Bastian, U., Portell, J., et al. 2016, A&A, 595, A3
- Gaia Collaboration et al. (2018) Gaia Collaboration, Brown, A., Vallenari, A., et al. 2018, A&A, this volume, DPACP-36: Gaia DR2 Summary
- Gaia Collaboration et al. (2016a) Gaia Collaboration, Brown, A. G. A., Vallenari, A., et al. 2016a, A&A, 595, A2
- Gaia Collaboration et al. (2016b) Gaia Collaboration, Prusti, T., de Bruijne, J. H. J., et al. 2016b, A&A, 595, A1
- Górski et al. (2005) Górski, K. M., Hivon, E., Banday, A. J., et al. 2005, ApJ, 622, 759
- Heap & Lindler (2007) Heap, S. R. & Lindler, D. J. 2007, in Astronomical Society of the Pacific Conference Series, Vol. 374, From Stars to Galaxies: Building the Pieces to Build Up the Universe, ed. A. Vallenari, R. Tantalo, L. Portinari, & A. Moretti, 409
- Henden et al. (2015) Henden, A. A., Levine, S., Terrell, D., & Welch, D. L. 2015, in American Astronomical Society Meeting Abstracts, Vol. 225, American Astronomical Society Meeting Abstracts, #336.16
- Høg et al. (2000) Høg, E., Fabricius, C., Makarov, V. V., et al. 2000, A&A, 355, L27
- Holl et al. (2018) Holl, B. et al. 2018, A&A, this volume, DPACP-49: Variability Processing
- Jordi et al. (2010) Jordi, C., Gebran, M., Carrasco, J. M., et al. 2010, A&A, 523, A48
- Landolt (2009) Landolt, A. U. 2009, AJ, 137, 4186
- Lindegren et al. (2018) Lindegren, L., Hernández, J., Bombrun, A., et al. 2018, A&A, this volume, DPACP-51: The astrometric solution
- Oke & Gunn (1983) Oke, J. B. & Gunn, J. E. 1983, ApJ, 266, 713
- Pancino et al. (2012) Pancino, E., Altavilla, G., Marinoni, S., et al. 2012, MNRAS, 426, 1767
- Perryman et al. (1997) Perryman, M. A. C., Lindegren, L., Kovalevsky, J., et al. 1997, A&A, 323, L49
- Riello et al. (2018) Riello, M., De Angeli, F., Evans, D. W., et al. 2018, A&A, this volume, DPACP-44: Processing of the Photometric Data
- Skrutskie et al. (2006) Skrutskie, M. F., Cutri, R. M., Stiening, R., et al. 2006, AJ, 131, 1163
- Straižys (1992) Straižys, V. 1992, S&T, 84, 171
- Stritzinger et al. (2005) Stritzinger, M., Suntzeff, N. B., Hamuy, M., et al. 2005, PASP, 117, 810
- van Leeuwen (2007) van Leeuwen, F., ed. 2007, Astrophysics and Space Science Library, Vol. 350, Hipparcos, the New Reduction of the Raw Data
- van Leeuwen et al. (2017) van Leeuwen, F., Evans, D. W., De Angeli, F., et al. 2017, A&A, 599, A32
Appendix A Colour-colour transformations
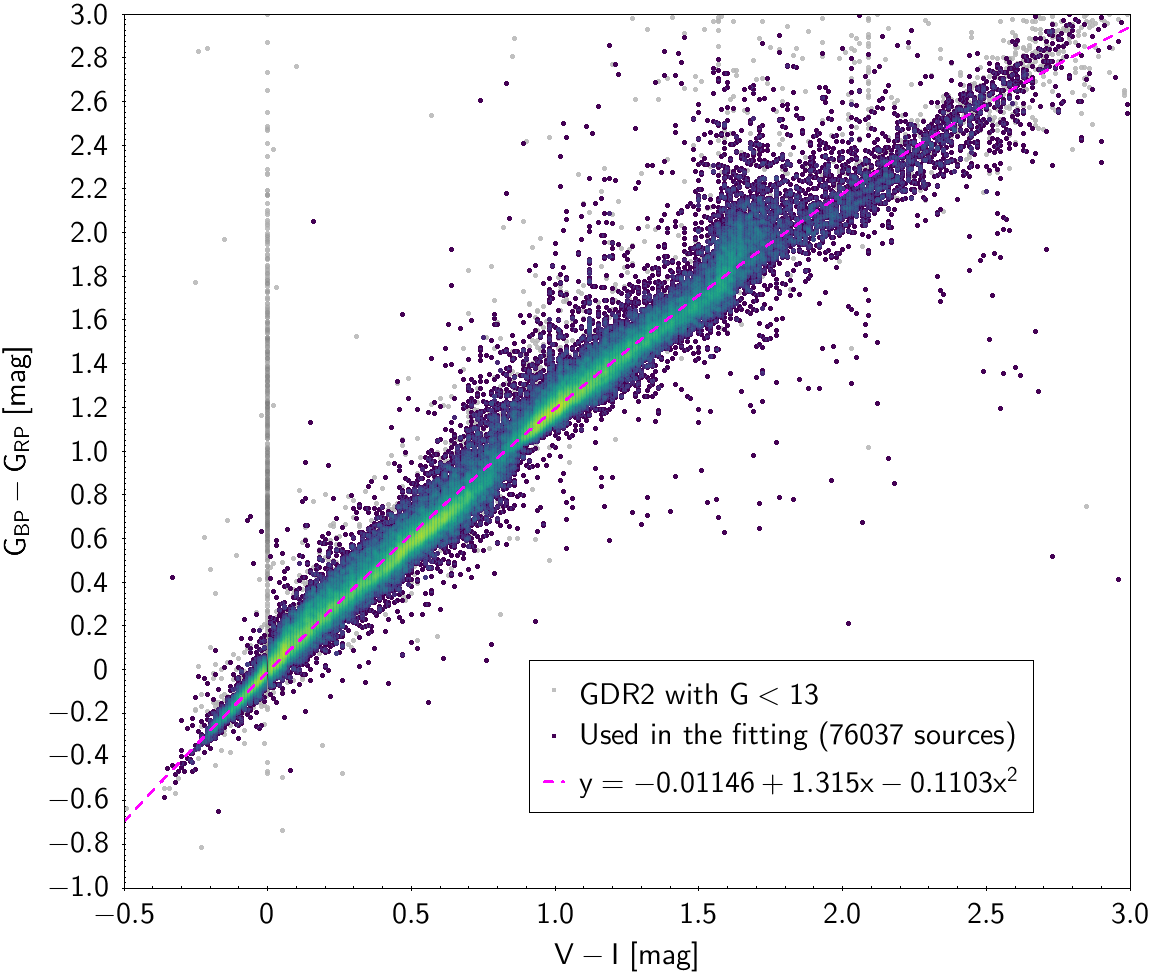
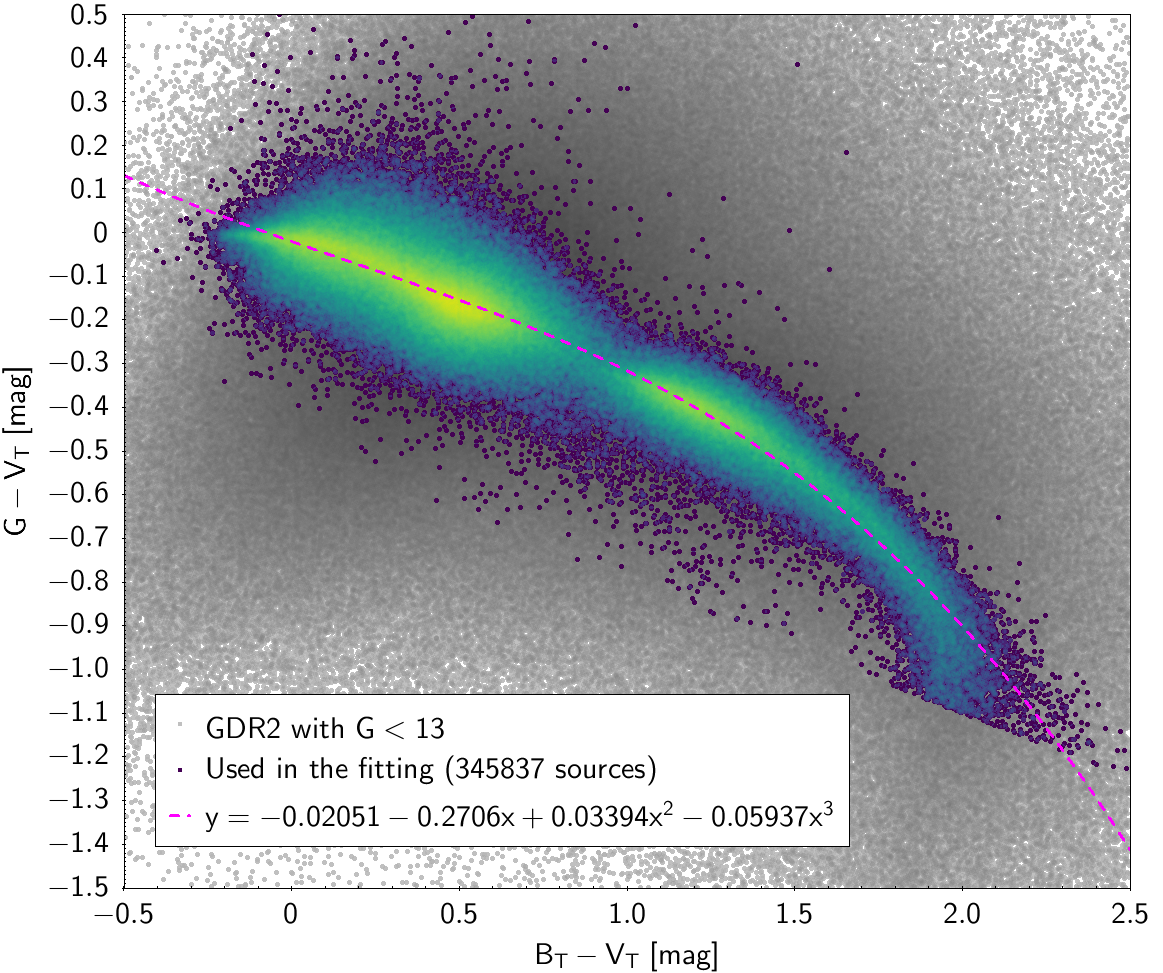
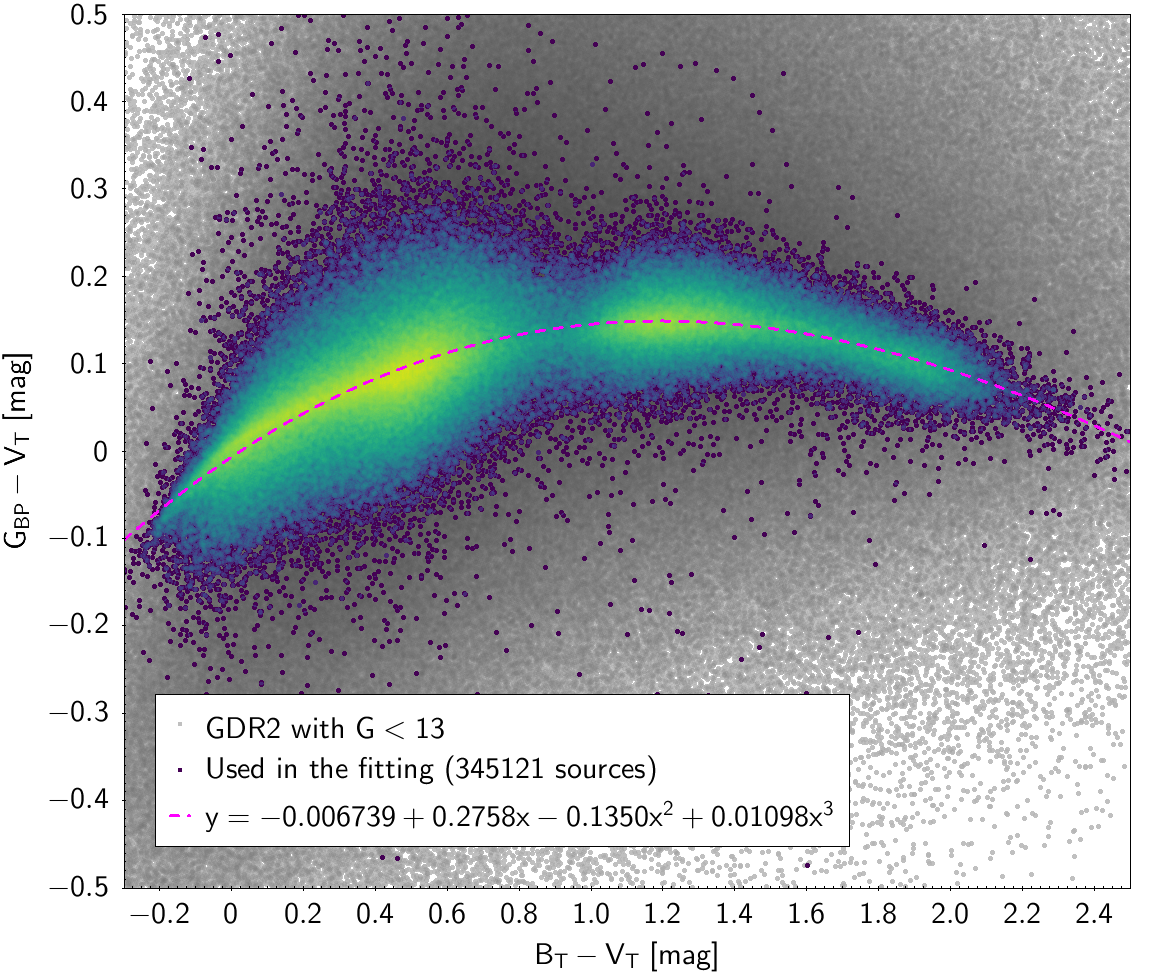
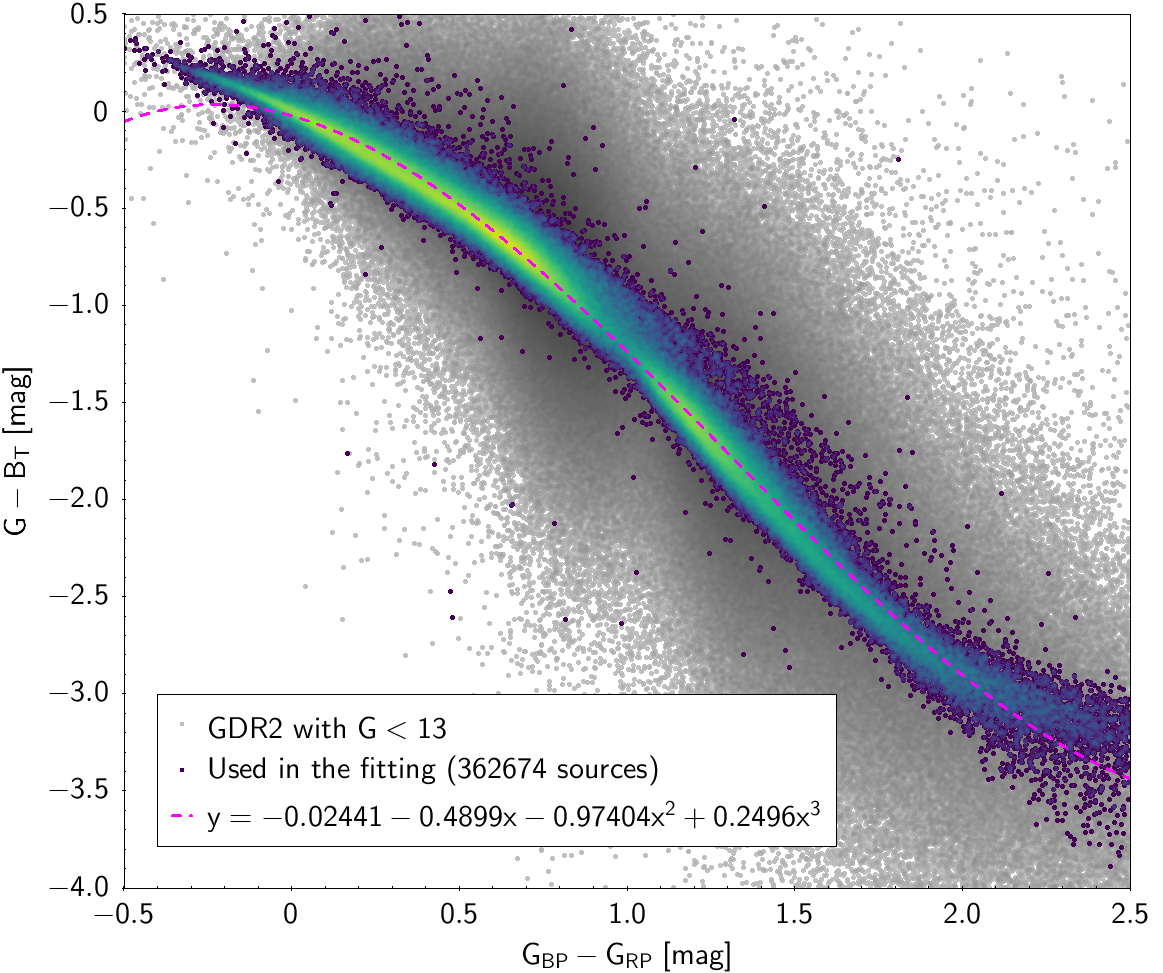
This section includes colour-colour relationships between the passbands in Gaia and other photometric surveys. These relationships supersede those published before launch using the nominal Gaia passbands (Jordi et al. 2010). In addition to magnitudes, Gaia DR2 is the first to also include and magnitudes. This allows for the first time to provide photometric relationships in both directions: to predict Gaia photometry from external photometry, and vice versa, to predict how Gaia sources would be seen if they were observed with another set of passbands. This could allow the use of Gaia sources as calibrators for other projects using these external passbands. Here we provide photometric transformations between Gaia DR2 and Hipparcos (Perryman et al. 1997), Tycho-2 (Høg et al. 2000), SDSS12 (Alam et al. 2015), Johnson-Cousins (Landolt 2009), and 2MASS (Skrutskie et al. 2006).
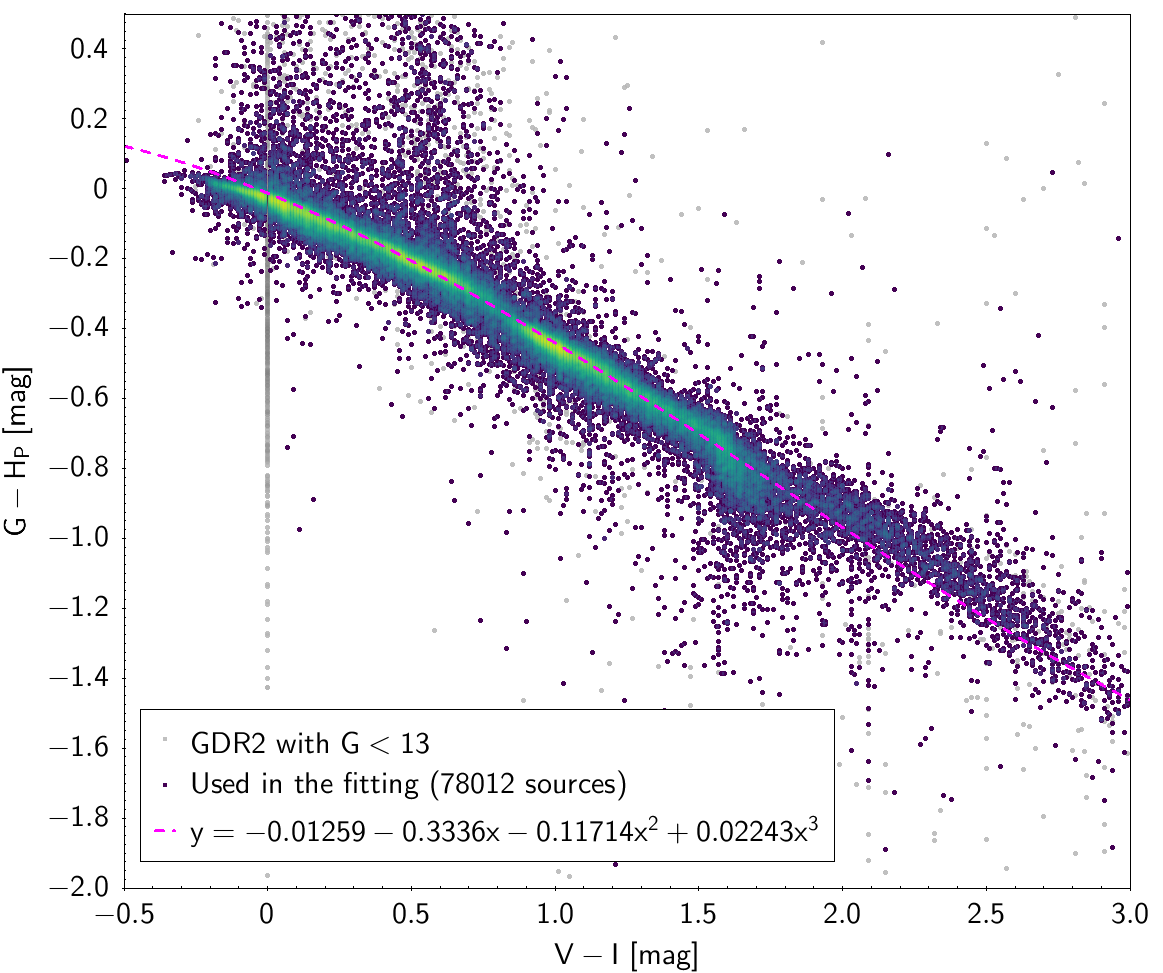
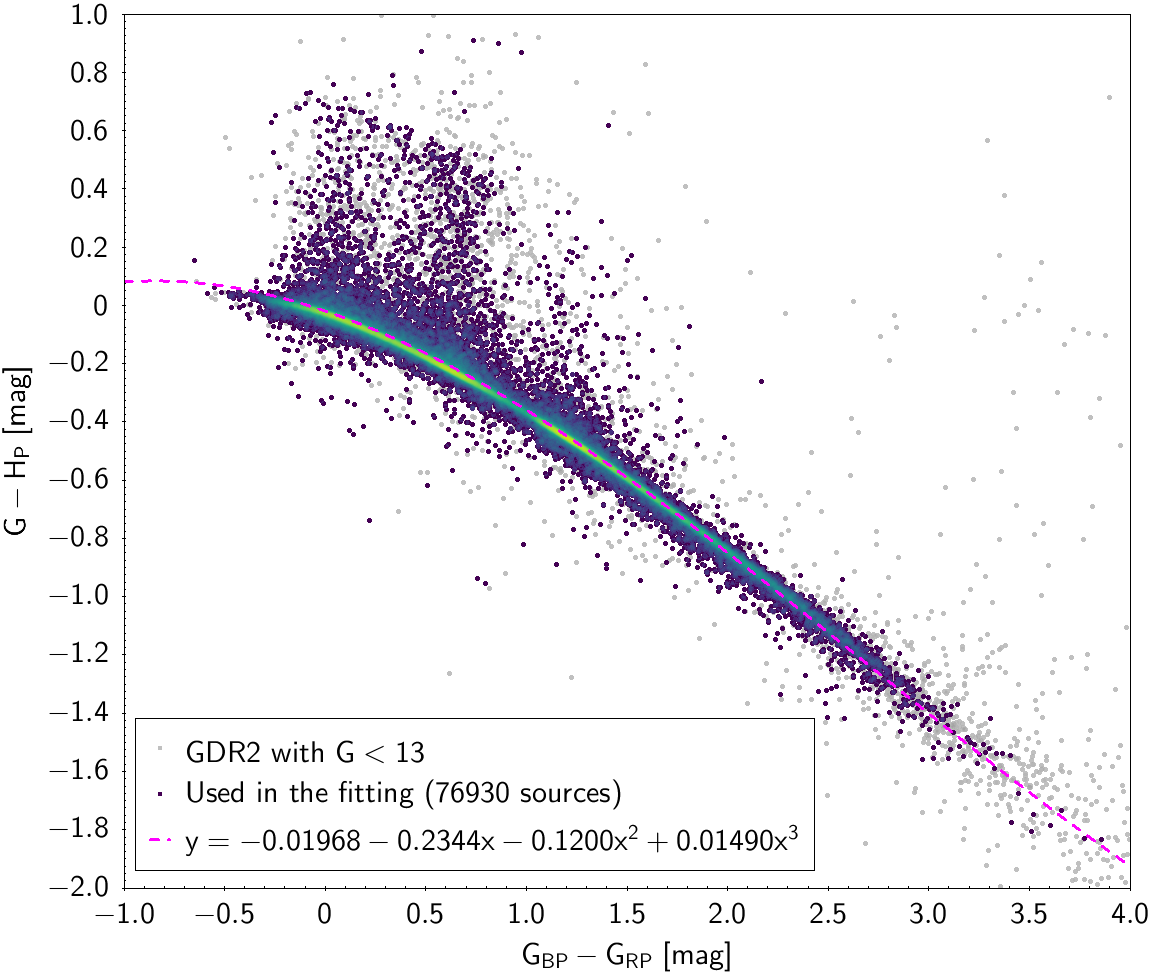
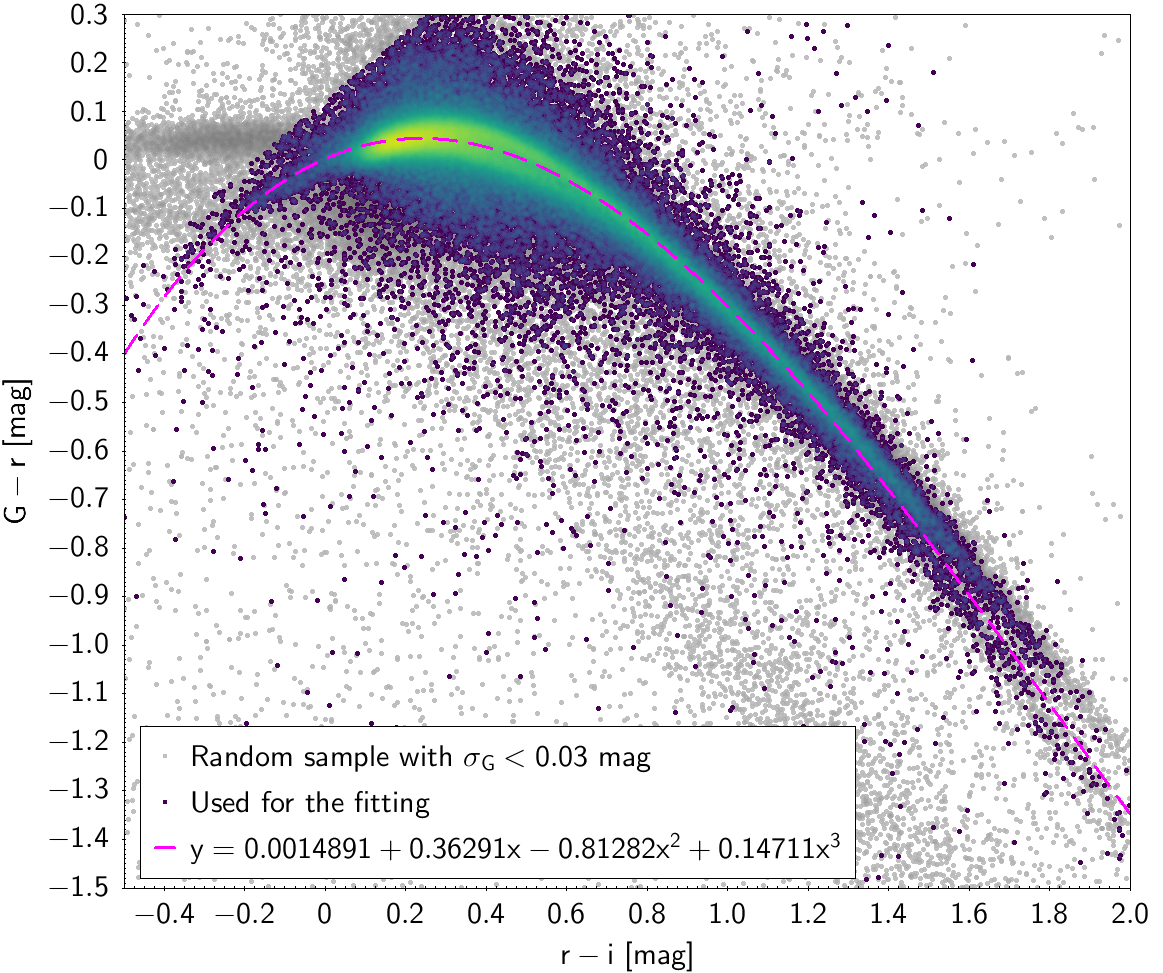
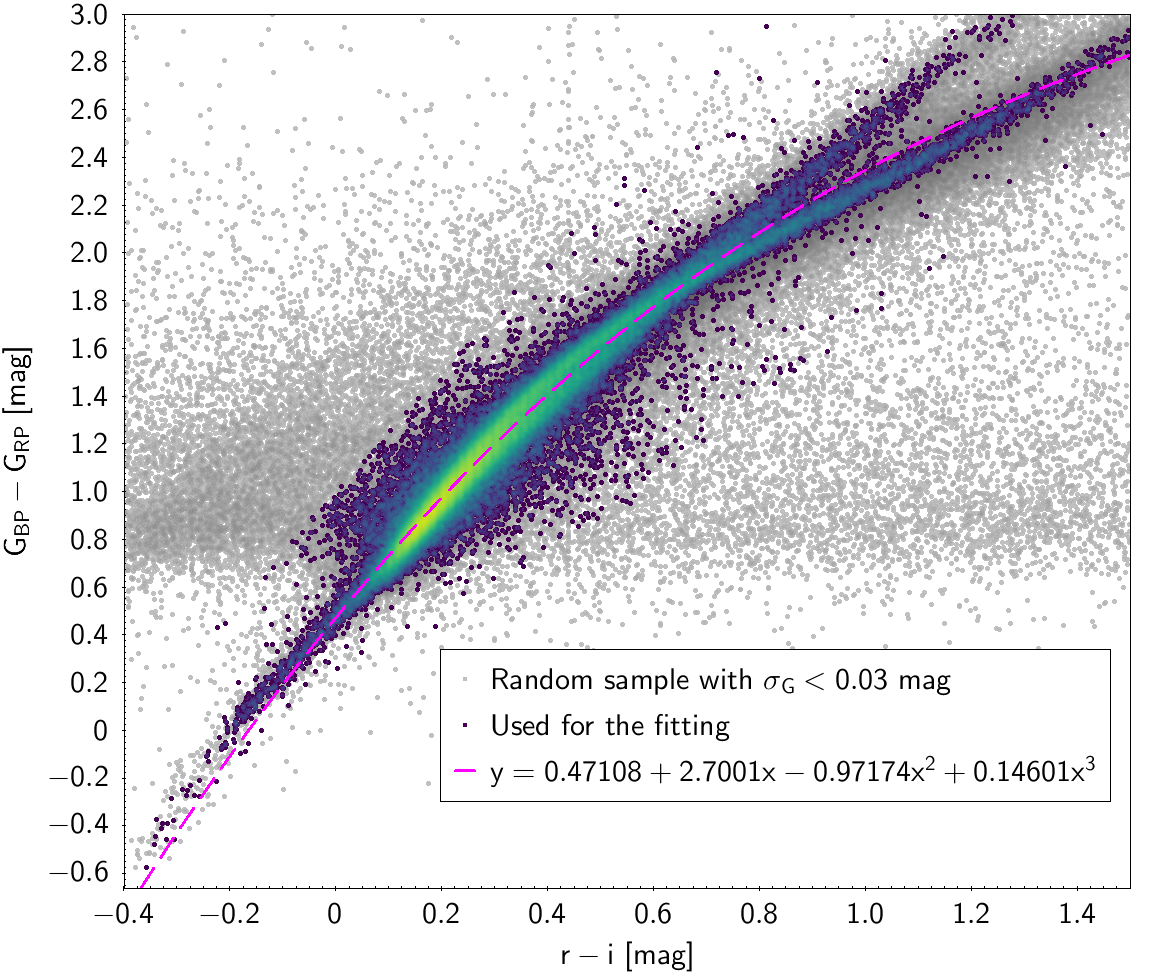
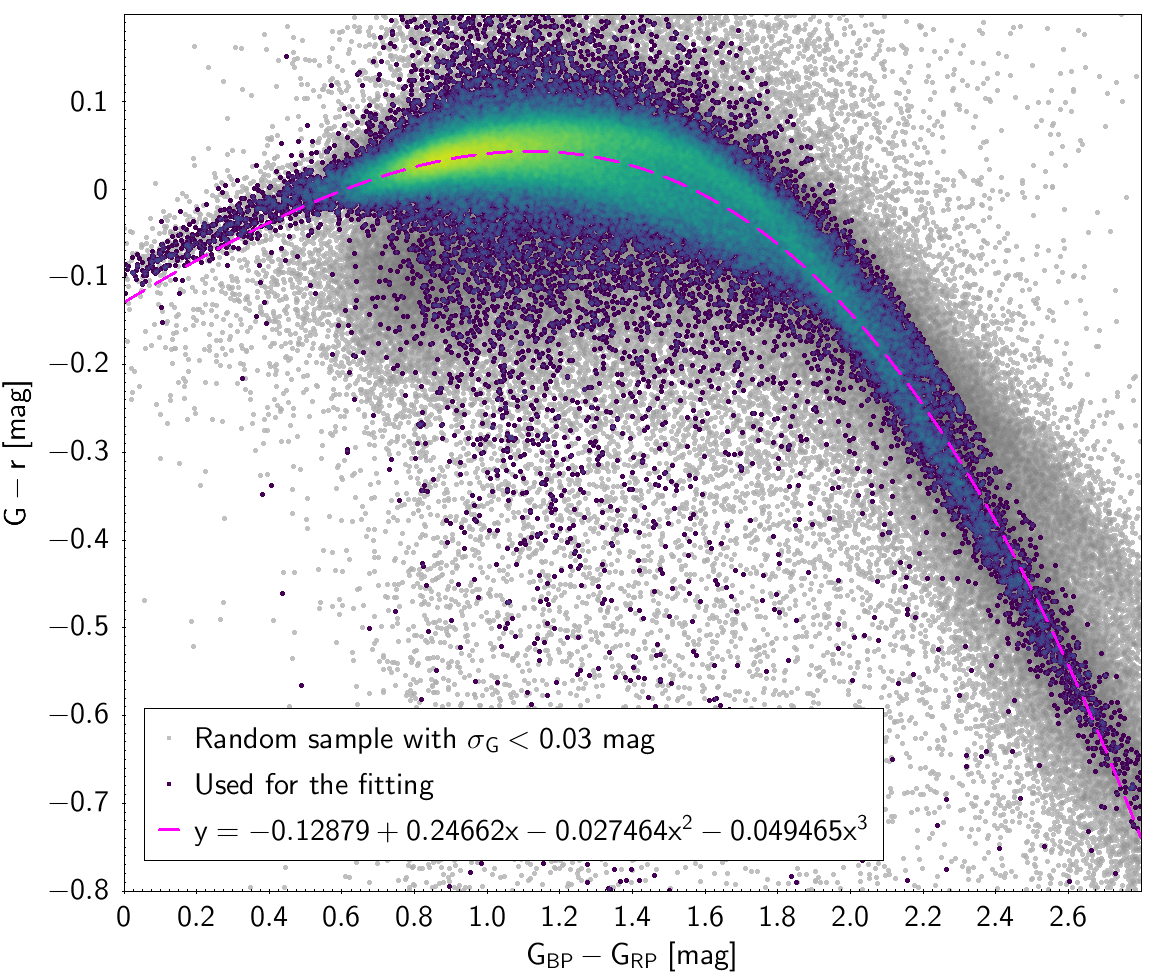
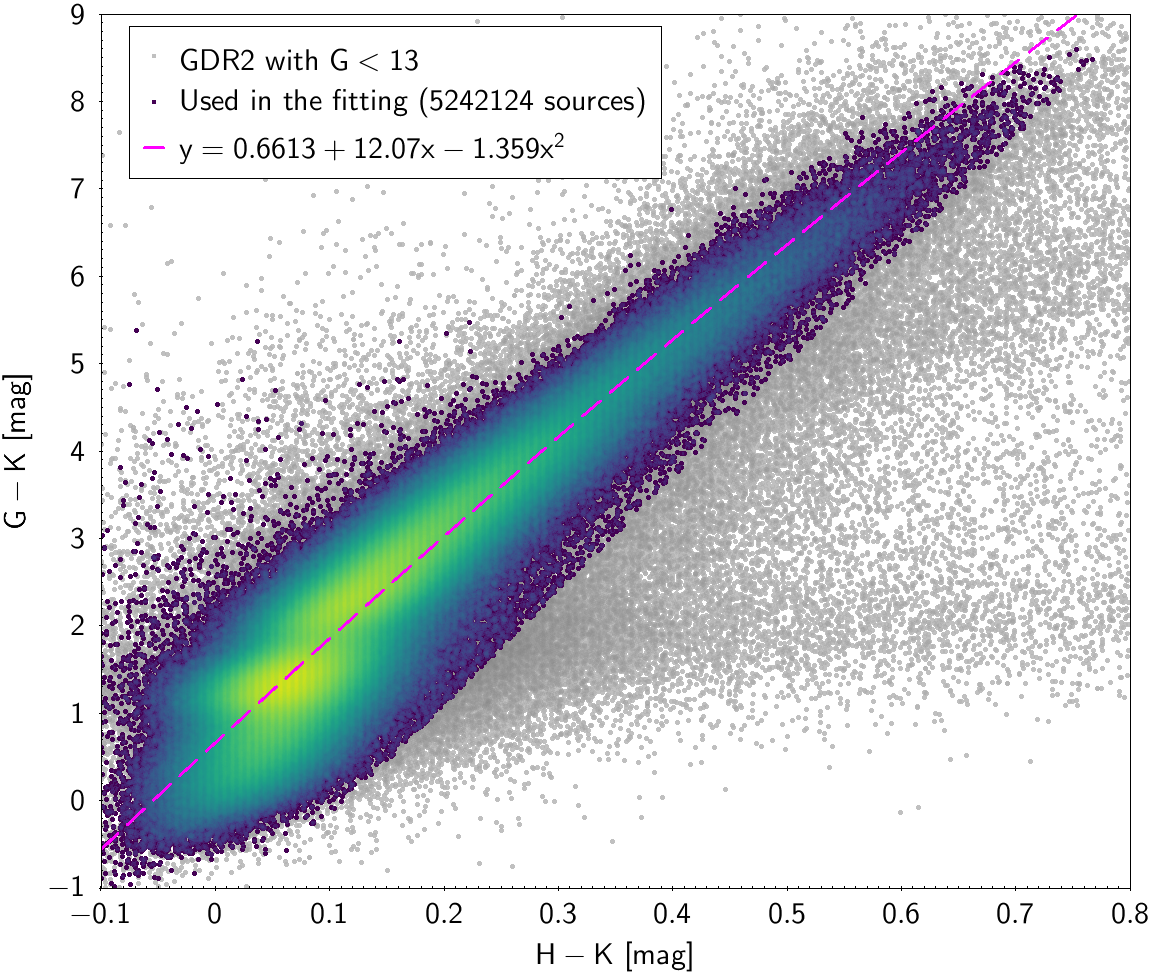
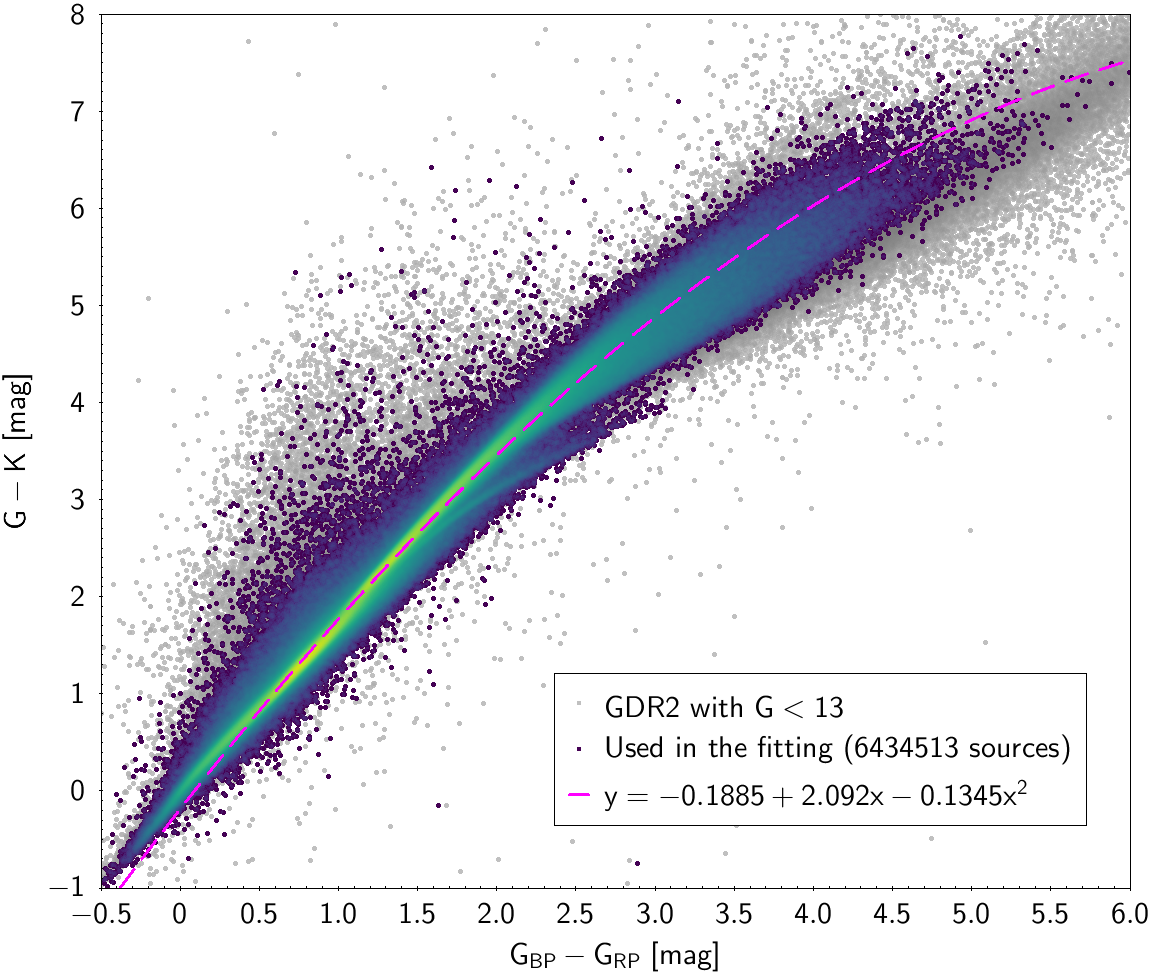
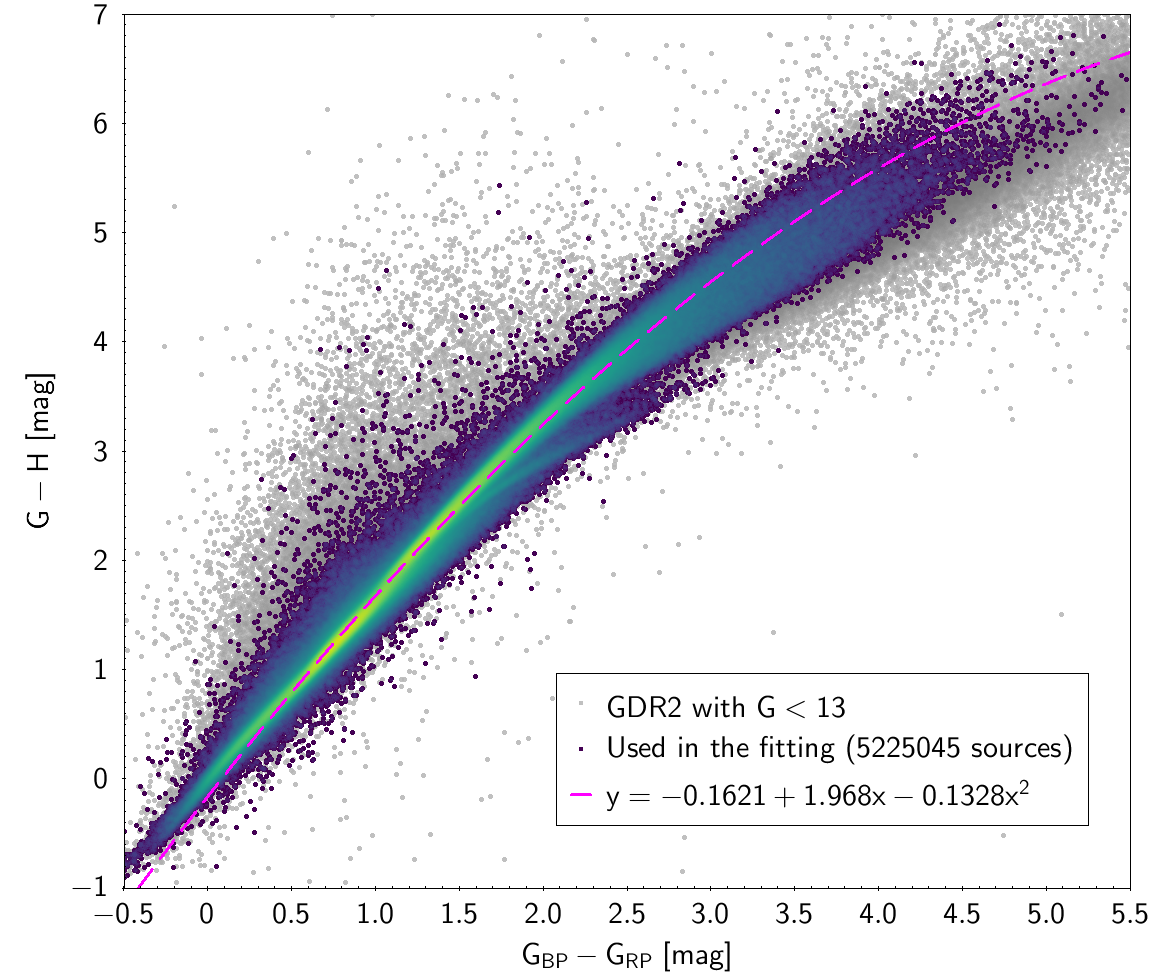
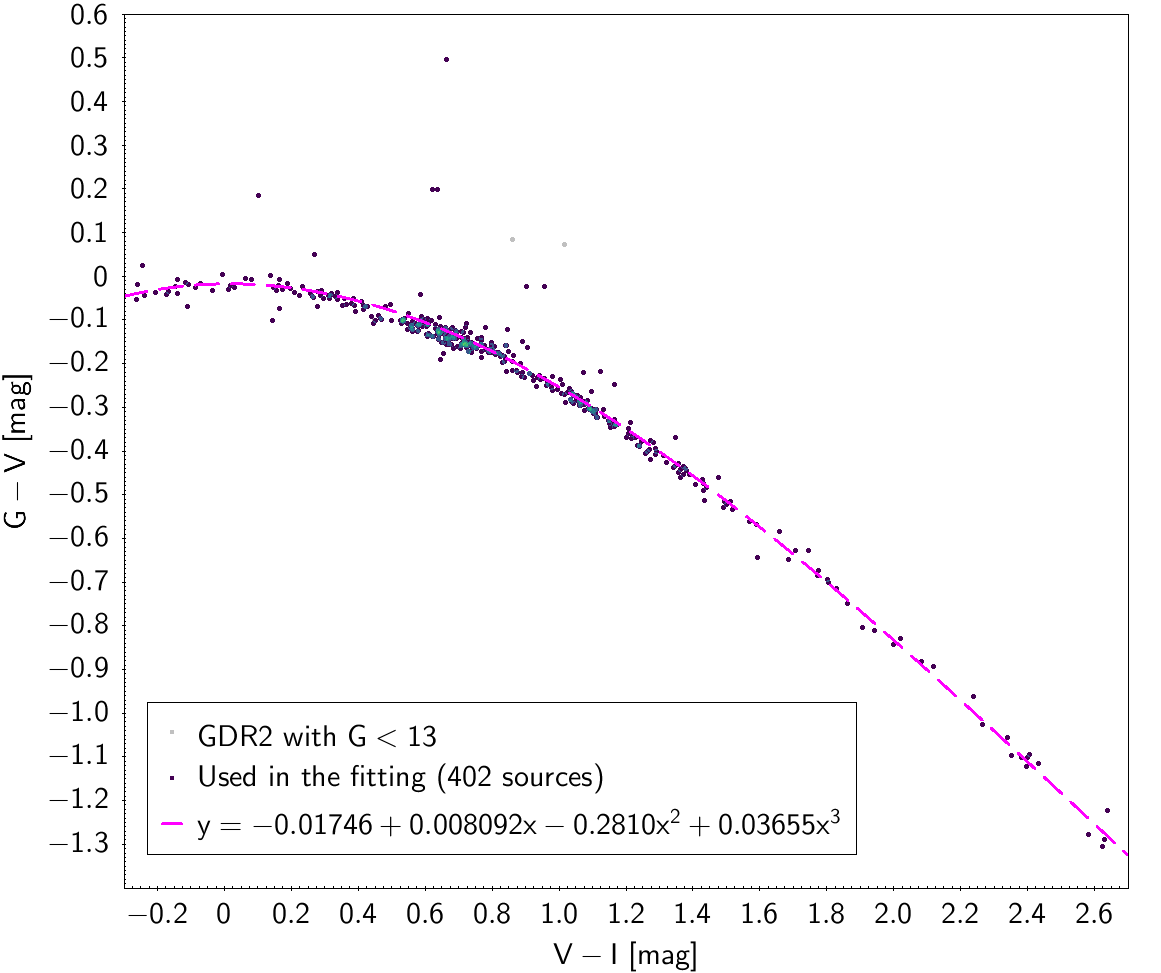
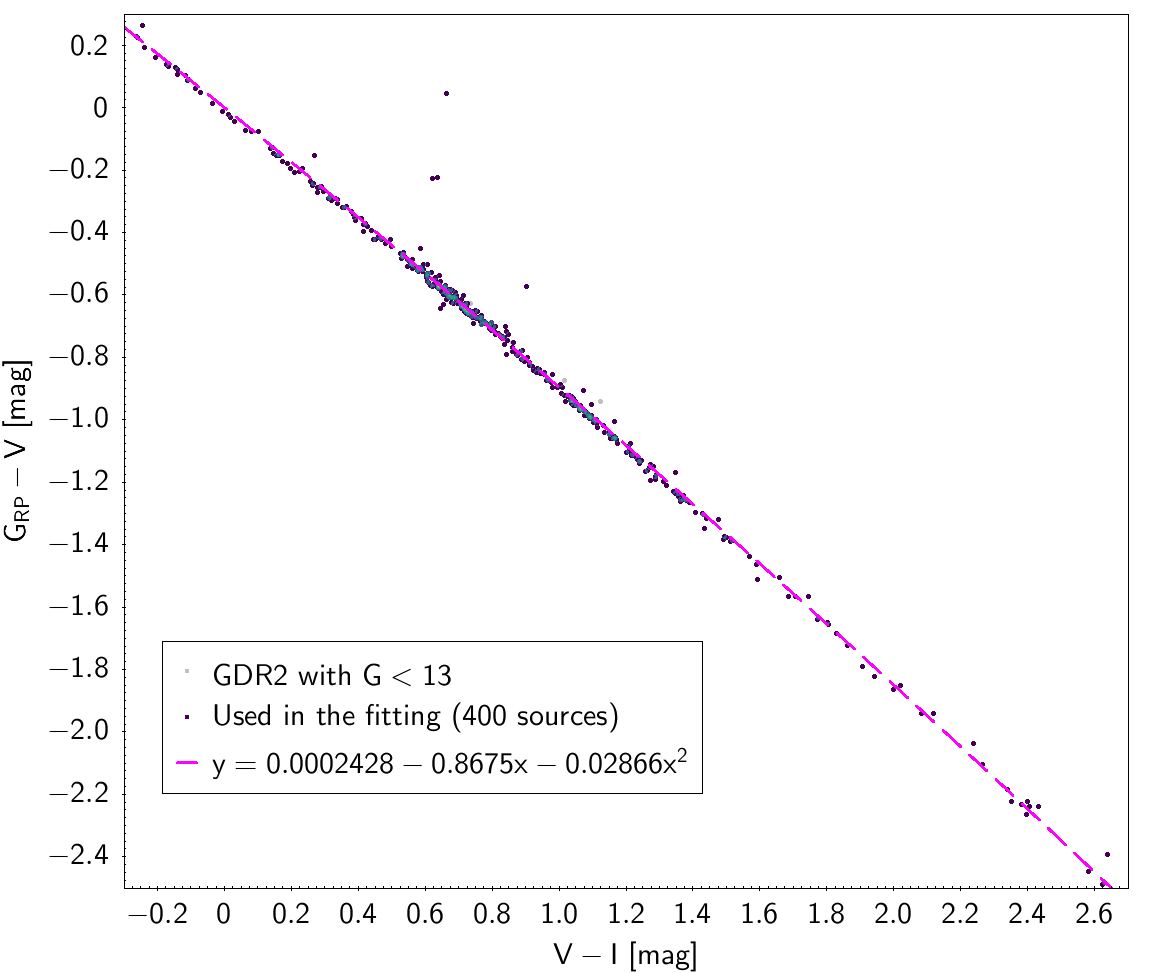
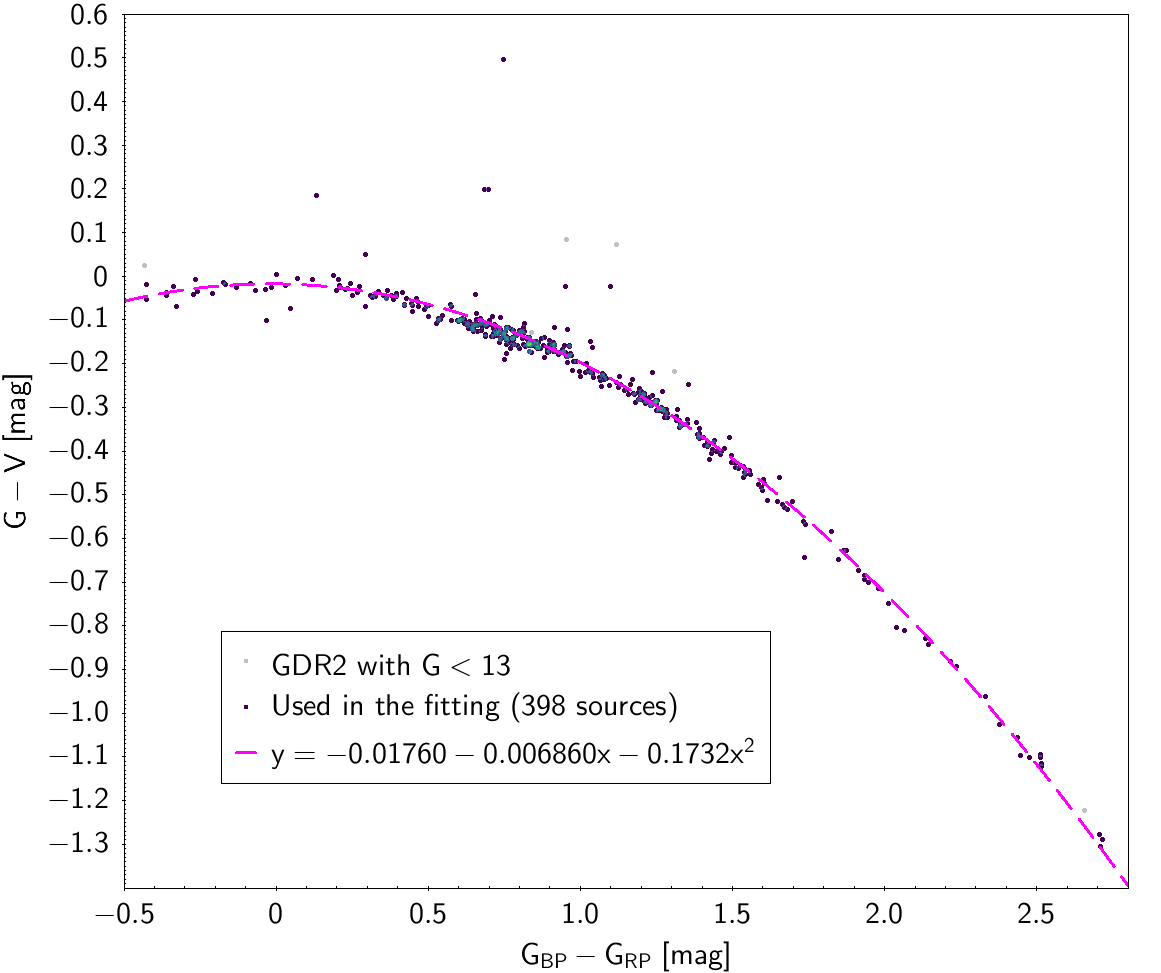
In order to produce the photometric transformations included here, we used only Gaia DR2 sources with that could be cross-matched with the external catalogues. As SDSS observations with magnitudes brighter than 14 mag are saturated, we have used a different dataset, extracting from Gaia DR2 catalogue some sources with for all magnitudes and using only those sources with SDSS magnitudes fainter than 15 mag. In order to obtain cleaner transformations, some filtering was made in each colour-colour diagram, which can be found in the Gaia DR2 online documentation. For the fitting, we used only sources with small magnitude error and small excess flux ( in Sec. 8) in BP and RP with respect to AF fluxes. We applied the filtering proposed in Eq. 1 using and values. photometric zeropoints in Table 1 were used. The polynomial coefficients obtained with the resulting sources are included in Table 4. The validity of these fittings is, of course, only applicable in the colour intervals used for the fitting (see Table 3). Some photometric relationships derived between Gaia and Hipparcos, Tycho-2, SDSS12, Johnson-Cousins, and 2MASS are plotted in Fig. 28 (for more plots, check the Gaia DR2 online documentation).
| Hipparcos relationships | |
| Tycho-2 relationships | |
| SDSS relationships | |
| Johnson-Cousins relationships | |
| 2MASS relationships | |
| Hipparcos relationships | |||||
|---|---|---|---|---|---|
| -0.03704 | -0.3915 | 0.01855 | -0.03239 | 0.02502 | |
| -0.01259 | -0.3336 | -0.1171 | 0.02244 | 0.09610 | |
| -0.01205 | 0.1105 | 0.06624 | |||
| -0.00055 | -1.203 | 0.1078 | 0.1089 | ||
| -0.01146 | 1.315 | -0.1103 | 0.09390 | ||
| -0.01968 | -0.2344 | -0.1200 | 0.01490 | 0.06875 | |
| Tycho-2 relationships | |||||
| -0.02051 | -0.2706 | 0.03394 | -0.05937 | 0.06373 | |
| -0.006739 | 0.2758 | -0.1350 | 0.01098 | 0.04415 | |
| -0.03757 | -1.188 | 0.4871 | -0.1729 | 0.09637 | |
| 0.03147 | 1.456 | -0.6043 | 0.1750 | 0.07024 | |
| -0.01842 | -0.06629 | -0.2346 | 0.02157 | 0.05501 | |
| -0.02441 | -0.4899 | -0.9740 | 0.2496 | 0.07293 | |
| SDSS relationships | |||||
| -0.074189 | -0.51409 | -0.080607 | 0.0016001 | 0.046848 | |
| -0.038025 | -0.76988 | -0.1931 | 0.0060376 | 0.065837 | |
| 0.0014891 | 0.36291 | -0.81282 | 0.14711 | 0.043634 | |
| -0.007407 | 1.4337 | -0.95312 | 0.22049 | 0.041165 | |
| 0.1463 | 1.7244 | -1.1912 | 0.22004 | 0.059674 | |
| -0.29869 | -1.1303 | 0.039156 | |||
| 0.47108 | 2.7001 | -0.97174 | 0.14601 | 0.067573 | |
| -0.12879 | 0.24662 | -0.027464 | -0.049465 | 0.066739 | |
| -0.29676 | 0.64728 | -0.10141 | 0.098957 | ||
| 0.13518 | -0.46245 | -0.25171 | 0.021349 | 0.16497 | |
| Johnson-Cousins relationships | |||||
| -0.01746 | 0.008092 | -0.2810 | 0.03655 | 0.04670 | |
| -0.05204 | 0.4830 | -0.2001 | 0.02186 | 0.04483 | |
| 0.0002428 | -0.8675 | -0.02866 | 0.04474 | ||
| -0.04212 | 1.286 | -0.09494 | 0.02366 | ||
| -0.02269 | 0.01784 | -1.016 | 0.2225 | 0.04895 | |
| -0.02907 | -0.02385 | -0.2297 | -0.001768 | 0.06285 | |
| -0.01760 | -0.006860 | -0.1732 | 0.045858 | ||
| -0.003226 | 0.3833 | -0.1345 | 0.04840 | ||
| 0.02085 | 0.7419 | -0.09631 | 0.04956 | ||
| 2MASS relationships | |||||
| 0.6613 | 12.073 | -1.359 | 0.3692 | ||
| 0.8174 | 14.66 | 2.711 | 0.4839 | ||
| 0.3560 | 9.287 | -1.721 | 0.2744 | ||
| 0.4238 | 6.098 | 1.991 | 0.2144 | ||
| -0.1885 | 2.092 | -0.1345 | 0.08281 | ||
| -0.1621 | 1.968 | -0.1328 | 0.07103 | ||
| -0.01883 | 1.394 | -0.07893 | 0.05246 | ||
Appendix B Saturation
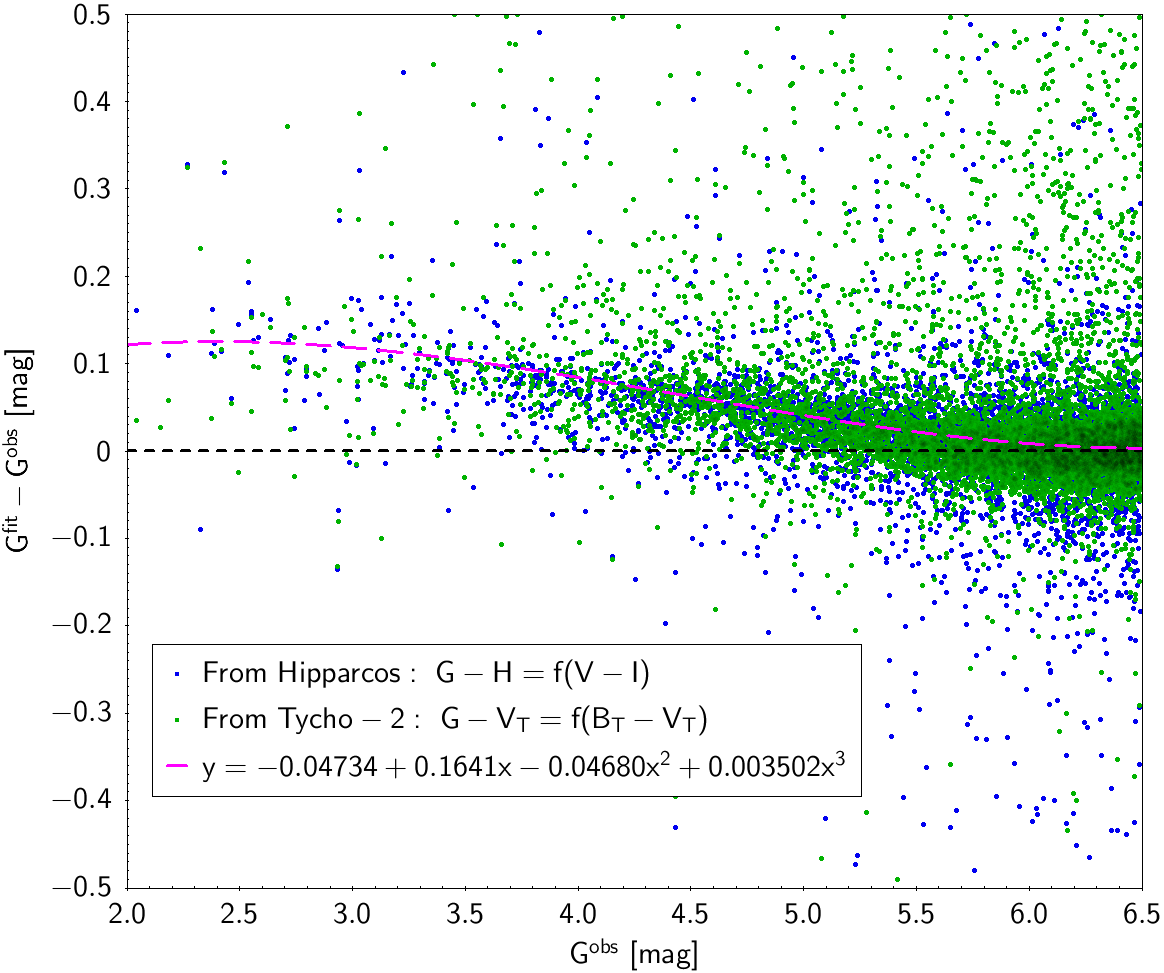
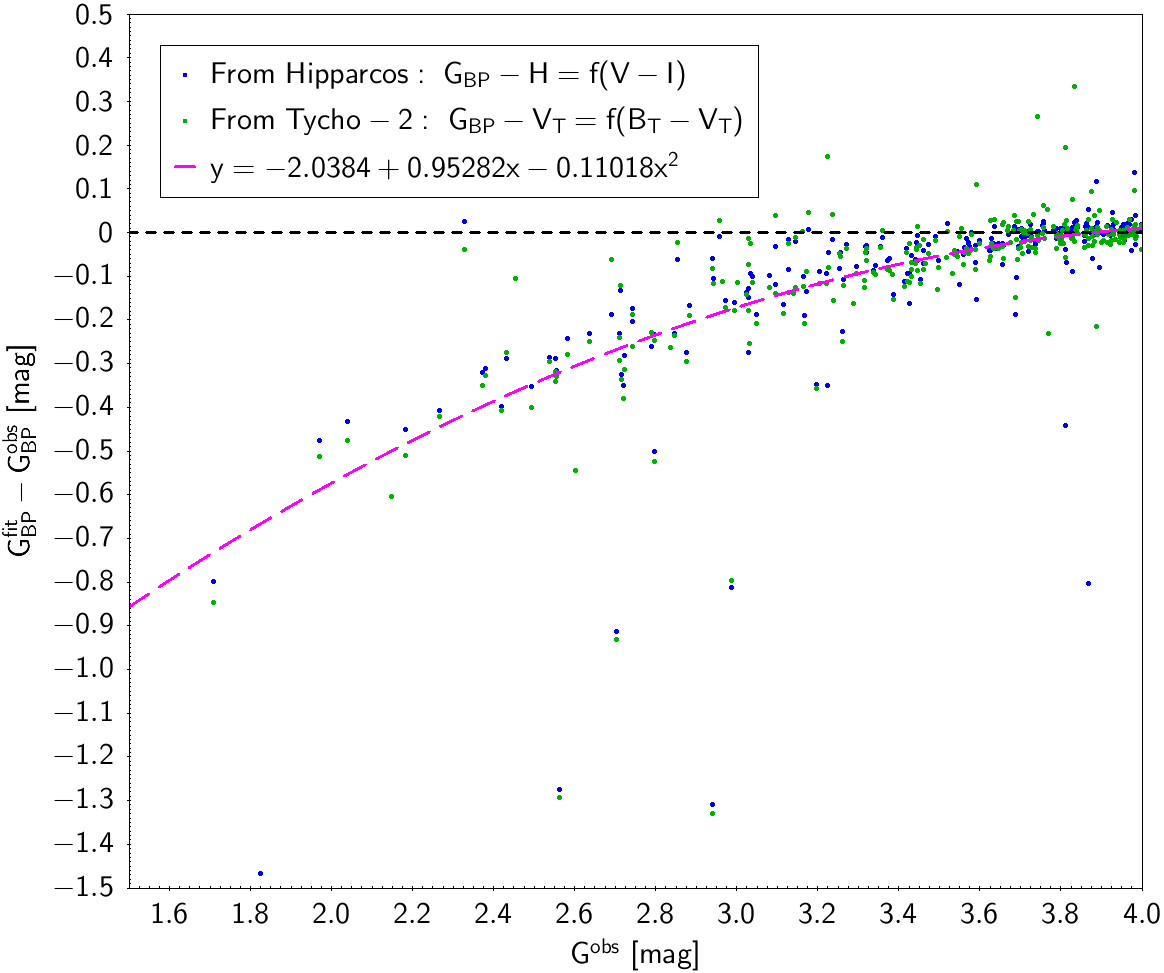
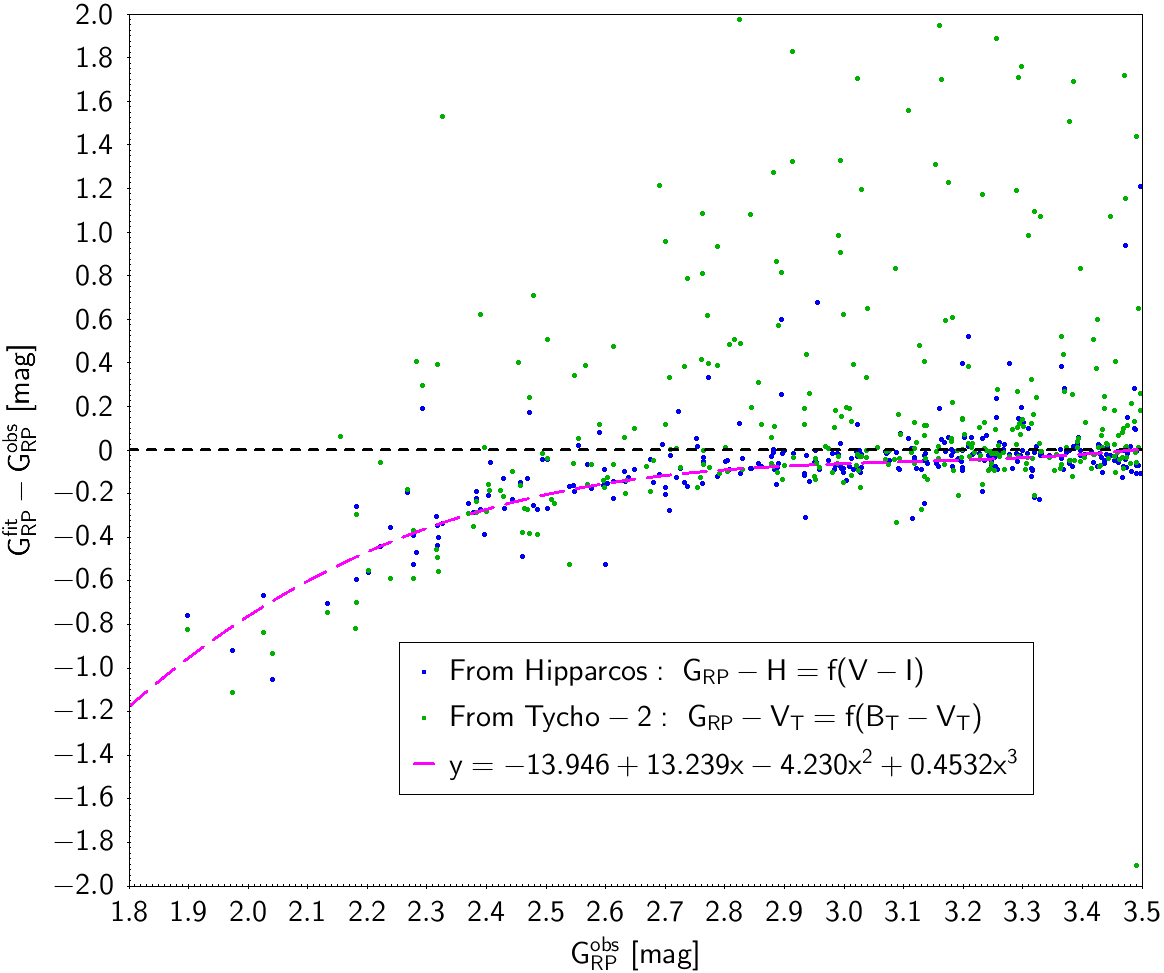
By analysing the residuals found when fitting as a function of , or as a function of and plotting them against the magnitude, we can see that the current calibration does not completely account for saturation effects (see Fig. 29). Fitting a relationship to the trends at the bright end in Fig. 29 can be useful if saturation effects need to be empirically corrected. We combined Tycho-2 and Hipparcos data to derive these fittings. The corrected magnitudes from the mean magnitudes in Gaia DR2, can be obtained with the following equations:
| (3) | |||||
| (4) | |||||
| (5) |
The relationship should only be used in the range mag, the relationship only for mag, and the relationship only for mag.
Appendix C Nomenclature
Below, we list acronyms and concepts used in this paper.
| 2MASS | Two-Micron All Sky Survey |
|---|---|
| AC | ACross scan: direction on the focal plane perpendicular to the scan direction |
| AF | Astrometric Field: the 62 astrometric CCDs on the focal plane |
| AL | ALong scan: direction on the focal plane parallel to the scan direction |
| APASS | AAVSO Photometric All-Sky Survey |
| BP | Blue Photometer: the system defined by the blue dispersion prism. Also refers to the associated CCDs. |
| Calibration Unit | Set of parameters and configurations identifying an observation environment, e.g. CCD, passband, Gate, FoV, Window Class. |
| CCD | Charge-coupled Device |
|---|---|
| CCD transit | Transit of a source across a single CCD |
| DPAC | Data Processing and Analysis Consortium |
| ESA | European Space Agency |
| FoV | Field of View: one of the two pointing directions of the satellite telescopes. See Gaia Collaboration et al. (2016b) for more information regarding the structure of Gaia. |
| FoV transit | Field-of-view transit, the complete transit of a source across the focal plane |
|---|---|
| Gate | System designed to reduce the effective exposure time for bright sources that would otherwise suffer heavy saturation. Twelve different gate configurations can be activated on board in different magnitude ranges (Gaia Collaboration et al. 2016b). |
| HEALPix | Hierarchical Equal Area isoLatitude Pixelation of a sphere producing a subdivision of a spherical surface in which each pixel covers the same surface area as every other pixel (Górski et al. 2005). |
| IDU | Intermediate Data Update: task operating at the start of each processing cycle on all Gaia data collected from the start of the mission. This includes a new cross-match (Castañeda et al. 2018), PSF/LSF calibration and IPD. |
| IPD | Image Parameter Determination: the task that estimates the fluxes that are then calibrated in PhotPipe as described in Carrasco et al. (2016). See Fabricius et al. (2016) for more details. |
| LS | Large-scale: in this paper this refers to one set of photometric calibration describing effects that vary on a large spatial range |
| LSF | Line Spread Function |
| OBMT | On-board Mission Timeline: the timescale usually used when referring to time in the Gaia context. This scale is defined in Gaia Collaboration et al. (2016b). |
| OBMT-Rev | Time in OBMT scale but in units of revolutions rather than nanoseconds (one revolution corresponds to approximately 6 hours) |
| Row | A series of CCDs in the AL direction |
| RP | Red Photometer: the system defined by the red dispersion prism. Also refers to the associated CCDs |
| SDSS | Sloan Digital Sky Survey |
| Strip | A series of CCDs in the AC direction |
| SS | Small-scale: in this paper this refers to one set of photometric calibration describing effects that vary on a small spatial range |
| Window Class | Configuration defining the AL and AC size of the window centred on each detected source as received on the ground (see Gaia Collaboration et al. 2016b) |