Spectroscopic decomposition of NGC 3521: unveiling the properties of the bulge and disc.
Abstract
We study the kinematics and the stellar populations of the bulge and disc of the spiral galaxy NGC 3521. At each position in the field of view, we separate the contributions of the bulge and the disc from the total observed spectrum and study their kinematics, age, and metallicities independently. Their properties are clearly distinct: the bulge rotates more slowly, has a higher velocity dispersion, and is less luminous than the disc. We identify three main populations of stars in NGC 3521: old ( Gyr), intermediate ( 3 Gyr), and young (1 Gyr). The mass and light of NGC 3521 are dominated by the intermediate stellar population. The youngest population contributes mostly to the disc component and its contribution increases with radius. We also study the luminosity-weighed properties of the stars in NGC 3521. Along the photometric major axis, we find: i) no age gradient for the stars in the bulge, and a negative age gradient for the stars in the disc; ii) negative metallicity gradients and sub-solar -enhancement for both the bulge and the disc. We propose the following picture for the formation of NGC 3521: initial formation a long time ago ( Gyr), followed by a second burst of star formation or a merger ( 3 Gyrs ago), which contributed predominantly to the mass-build up of the bulge. Recently ( Gyr), the disc of NGC 3521 experienced an additional episode of star formation that started in the innermost regions.
keywords:
galaxies: abundances - galaxies: kinematics and dynamics - galaxies: formation - galaxies: stellar content - galaxies: individual: NGC 35211 Introduction
Galaxies are generally complex systems that can consist of several structural components, such as bulges, stellar and gaseous discs, spiral arms, bars, and shells. The formation of a galaxy itself and its substructures is a complex process and can require a number of subsequent events ranging from “secular evolution” (e.g., orbital instability, formation of new stars, quenching) to “interactions” (e.g., mergers, accretions, ram pressure stripping); see for example Kormendy & Kennicutt (2004); Naab & Ostriker (2016) for reviews.
The detailed study of the various structural components, their morphology, their kinematics, and their stellar populations can shed light on the various processes that contributed to their formation. Because multiple structural components can co-exist in the same region of a galaxy, such as a small disc engulfed in a large bulge, it is necessary to remove their mutual contamination from the observations in order to study them separately. This “decomposition” has been widely applied in the past by fitting analytic functions to the galaxy light in order to reconstruct the images of the various components (e.g., Kormendy 1977; Peng et al. 2002; Erwin 2015). The decomposition can be done also on spectroscopic data, by taking the different kinematic properties into account. This involves decomposing the galaxy’s line-of-sight velocity distribution (LOSVD) into multiple kinematic components (e.g. Rubin et al. 1992; Kuijken & Merrifield 1993), and, more recently, decomposing the observed spectrum into multiple spectral components (Coccato et al. 2011, Katkov et al. 2011, Johnston et al. 2012). Key requirements for the kinematic and spectroscopic decomposition are a relatively good spectral resolution and high signal-to-noise, which are fundamental to properly sample the shape of the LOSVD and separate the various kinematics and spectral components (e.g., Fabricius et al. 2014; Coccato et al. 2014, 2015).
Recently, we started an observational campaign aimed at studying the detailed structure of the LOSVDs of the bulges in nearby galaxies, exploiting the Integral field unit and the superb spectral resolution of the VIRUS-W spectrograph ( km s-1 at 5200 Å) of the McDonald Observatory. The main goal of the survey is to study the kinematic signatures of the various components, such as kinematically decoupled cores, and/or a detailed characterization of the orbital structure that, for example, can be complex in the case of triaxial potential or bars.
In Fabricius et al. (2014) we studied the spiral galaxy NGC 7217. Previous works, including our own, hinted at the existence of two counter-rotating stellar components (Kuijken & Merrifield, 1993; Fabricius et al., 2012). However, the higher spectral resolution of VIRUS-W data show that the stars in NGC 7217 are co-rotating. By studying the LOSVD, we identified a kinematically hot component (that we associated with the bulge) and a kinematically cold component (that we associated with the disc). A spectral decomposition analysis allowed us to study the properties of the bulge and the disc in NGC 7217 independently. Our measurements suggest that NGC 7217 is in the process of regrowing a disc inside a more massive and higher dispersion stellar spheroid.
The same analysis was carried on the S0 galaxy NGC 4191 (Coccato et al., 2015). In this latter case, we discovered two stellar counter-rotating components, as suggested by previous studies (Krajnović et al., 2011), and proposed gas accretion along two filaments as their formation mechanism.
In this paper, we focus on another galaxy in our sample that has been claimed to host a stellar counter-rotating component (Zeilinger et al., 2001): NGC 3521. NGC 3521 is a late-type spiral galaxy with a mixed barred and inner ring morphology, classed as SAB(rs)bc by the RC3 catalog (de Vaucouleurs et al., 1991).
One of the first kinematic studies of NGC 3521 is from Burbidge et al. (1964); the authors measured the rotation curve of the ionized gas out to kpc and estimated a total enclosed mass of M⊙ and an upper limit of the stellar mass of M⊙. More recent measurements estimate the stellar and HI masses of NGC 3521 to be M⊙ and M⊙, respectively (Leroy et al., 2008; Walter et al., 2008). Elson (2014) studied the kinematics and distribution of the HI halo surrounding NGC 3521 out to 25 kpc and found evidence for a secondary HI component. This component, called “anomalous” by the author, is distributed on a thick disc and it rotates more slowly than the main HI component. Moreover, the spatial distribution of the “anomalous” component coincides with the inner regions of the stellar disc where the star formation rate is highest; this suggests a link between the stellar feedback and the gas in the halo, probably driven by galactic fountains. Elson (2014) found no evidence of gas accretion from outside the galaxy system.
Zeilinger et al. (2001) and Fabricius et al. (2012) reported the presence of a stellar component that is counter-rotating with respect the main body of the galaxy. The measured velocity separation between the two stellar components is about 200 km s-1. This kinematic decoupling was interpreted as a “projection effect induced by the presence of a bar component seen almost end on” (Zeilinger et al., 2001). The retrograde orbits allowed by the bar potential and the viewing angle caused the bi-modal distribution of line of sight velocities. This “internal” origin of the observed kinematic decoupling is consistent with the lack of evidence for gas accretion or interaction with other galaxies (although it does not prove that accretion or interaction did not take place).
The purpose of this paper is to study the kinematics and stellar populations of the various kinematic and structural components in NGC 3521, exploiting the high spectral resolution and sensitivity, and the integral field mode of the VIRUS-W spectrograph. With the aid of spectral decomposition techniques, we isolate the contribution of the various structural components from the observed spectrum and determine their kinematics, age, and metallicity independently in order to get clues on their formation mechanisms. The advantage of this approach is that we minimize the mutual contamination of these components in the regions where their light contribution is comparable. Moreover, as done for other spiral galaxies with detected stellar counter-rotation, we test whether or not the presence of a population of counter-rotating stars is confirmed (e.g. as in NGC 4191, Coccato et al. 2015) or not (e.g., as in NGC 7217, Fabricius et al. 2014) when repeating the observations with higher spectral resolution.
The paper is structured as follows. In Sections 2 and 3 we describe the observations and the data reduction, in Section 4 we describe the kinematic measurements, the identification of two kinematically distinct components, and their association with the galaxy structural components. In Section 6 we measure the properties (age, metallicity, and -enhancement) of the stars of both components. We describe and discuss the results in Section 7. In this paper, we adopt a distance to NGC 3521 of 8.1 Mpc (as in Fabricius et al. 2012), which corresponds to a linear scale of 40 pc/arcsec.
2 Photometric observations and data reduction
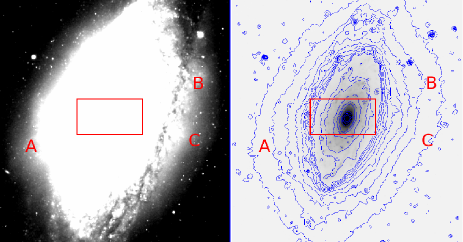
We exploit the ESO and Spitzer archive images of NGC 3521. ESO data were taken on April 1999 with FORS1 at the Very Large Telescope for the program 63.N-0530 (P.I. Kudritzki). The galaxy was observed in the 3 ESO “Bessel” filters B, V, and I with a single exposure of 300 seconds in each filter. Data reduction (bias and flat fielding) was performed with the standard ESO FORS pipeline run under the EsoReflex (Freudling et al., 2013) environment and adapting the available FORS-imaging workflow to handle observations from 1999. Despite the fact that the exposures were saturated in the centre and the reduced data are not flux calibrated due to the lack of a standard star observation, these FORS1 data are deep enough to highlight the peculiar morphology of the outskirts of NGC 3521. The left panel of figure 1 shows some extended and faint structures that depart from an axisymmetric light distribution (see regions marked with the labels A, B, and C in Fig. 1).
The Spitzer IRAC1 (3.6 µm) image was taken as part as the Spitzer Infrared Nearby Galaxies Survey (Kennicutt et al., 2003). The combined mosaic image, with a pixel scale of 0.75 arcsec, was produced as part of the SINGS Fifth Data Delivery111http://irsa.ipac.caltech.edu/data/SPITZER/SINGS/doc /sings_fifth_delivery_v2.pdf and was retrieved from NED. We performed a final background subtraction of the image by measuring median values in approximately 50 -pixel boxes well outside the galaxy and computing the mean of those values.
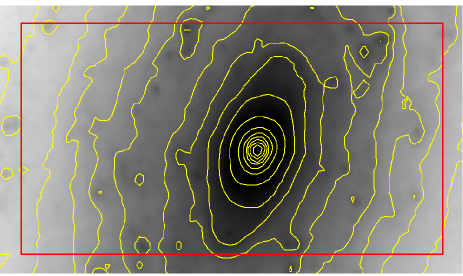
Because NIR data are less affected by dust absorption, they are particularly useful to highlight the inner structure of the galaxy. The right panel of Fig. 1 shows the inner spiral structure of the galaxy and the isophotal contours. Despite the RC3 classification as SAB, we found no evidence of a bar. The same structures observed in the FORS image are visible in the outer isophotes of the Spitzer image, as deviations from an symmetric elliptical profile.
The presence of such structure is an indicator that at least one merging event contributed to the growth of the galaxy in its past.
3 Spectroscopic observations and data reduction
The observations of NGC 3521 were carried on May 29 and May 30 2011 using the VIRUS-W Integral Field Unit (IFU) Spectrograph (Fabricius et al., 2012) at the 2.7 m Harlan J. Smith Telescope of the McDonald Observatory (Texas, US). The observed field of view is and it is mapped with 267 fibers of 32 diameter on the sky, resulting in a filling factor of 1/3. Three dithered exposures are sufficient to cover the field of view. We took a second set of exposures offset by half a fiber diameter with respect to the first, thereby sub-dithering the observation to increase the spatial resolution. The individual exposure time was 1800 s. Off-set sky exposures of 300 s each were interleaved with the target exposures. The VIRUS-W instrument was configured in the high-resolution mode, covering the 4850 – 5480 Å wavelength range with a sampling of 0.19 Å pixel-1 and a resolving power of , corresponding to an instrumental dispersion of km s-1 at the centre of the wavelength range.
Data were reduced using the FITSTOOLS package of Gössl & Riffeser (2002) and the Cure pipeline, which was originally developed for the HETDEX project (Snigula et al., 2014). We followed the prescriptions of Fabricius et al. (2014). The final reduced datacube was spatially binned to increase the signal-to-noise ratio () using the implementation for Voronoi Tesselation of Cappellari & Copin (2003) for a total of 83 binned spectra. We measured222The computation was done directly on the binned spectra by using the der_snr tool available at: http://www.stecf.org/software/ASTROsoft/ per pixel in the spatial bins where the stellar population analysis is performed, and per pixel elsewhere.
4 Kinematics and spectral decomposition
The stellar and ionized-gas kinematics of NGC 3521 were initially measured non parametrically in each spatial bin by fitting the observations with a series of stellar templates. The fitting procedure recovered the full shape of the line-of-sight velocity distribution (LOSVD) by exploiting the maximum penalized likelihood method (MPL) of Gebhardt et al. (2000) as implemented by Fabricius et al. (2014) to include H, [OIII] 4959, 5007 Å, and [NI] 5190, 5200 Å ionized-gas emission lines in the fitting process. All the emission lines are set to share the same kinematics. MPL determines the LOSVD in a non-parametric way. The best fitting spectrum is obtained by weighted linear combination of a number of stellar templates that represent the galaxy stellar populations; the templates are convolved by the same LOSVD. Therefore, the algorithm uses the same LOSVD for the different stellar components.
Then, the recovered LOSVD is modeled as the contribution of two separate components by fitting two Gaussian functions with independent velocity, velocity dispersion, and amplitude. Specifically, we used a Monte Carlo Markov Chain algorithm based on pymc to determine the maximum likelihood combinations of amplitude, mean velocity, and velocity dispersion for each of the two Gaussians in each bin.
The knowledge of the kinematics of the two stellar components allowed us then to disentangle their contribution to the observed spectra in each spatial bin. We applied a spectroscopic decomposition technique (Coccato et al., 2011) by using the Python implementation of the Penalized Pixel Fitting (pPXF) code by Cappellari & Emsellem (2004); Cappellari (2017). In contrast with the MPL method, pPXF parametrizes the LOSVD with a Gaussian-Hermite function. It can handle multiple LOSVDs so that each stellar component is formed by a linear combination of templates and convolved with its LOSVD. In the fitting process, we used the previously determined kinematics as initial starting parameters in the fit. This strategy allowed us to obtain the best fitting stellar spectra for the bulge and the disc for each spatial bin, minimizing the degeneracy between the fitting parameters and the stellar components. The kinematics obtained with the pPXF are compatible within errors to those determined via the LOSVD Gaussian decomposition.
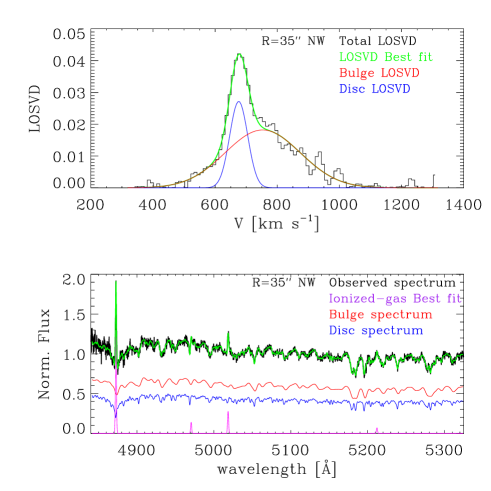
We show in Figure 2 the LOSVD and the decomposition for one Voronoi bin along the photometric major axis.
The output of the spectroscopic decomposition for each Voronoi-binned galaxy spectrum are: i) the kinematics (velocity and velocity dispersion of the 2 components); ii) the best-fitting stellar templates for each component obtained as linear combination of the stars in the input library; iii) the best-fitting stellar models of the stellar components, i.e., the best-fitting stellar templates convolved for kinematics that account also for the contribution of multiplicative polynomials; and iv) the kinematics and best-fit model of the ionized gas component. The best-fitting stellar templates are used in Section 6 to study the age and metallicity of the two stellar components, whereas the best-fitting stellar models are used in Section 5 to study their light distributions.
4.1 The extended stellar template library
To ensure that the kinematic results are not biased by the differences of the intrinsic properties of the galaxy’s stellar population to those of the template star, it has become common practice to include a multitude of template stellar spectra in the kinematic extraction covering a representative region of temperature and metallicity. In addition to the line of sight velocities, the spectral decomposition routine also determines an optimal set of weights for the linear combination of templates that ultimately becomes the best fitting model. Because we decompose the observed stellar spectra into different components, we derive stellar population parameters directly from those models rather than the input data themselves. This further strengthens the need to include a large set of different stellar types with varying metallicities and alpha element over-abundances, to prevent a biasing of the derived stellar population parameters.
From previous work, we already possess a library of spectra for 30 giant stars (A – M type) observed with VIRUS-W which are also part of the ELODIE high resolution (R 42000) library of stellar spectra Prugniel & Soubiran (2004). We use these to determine the difference in spectral resolution between the ELODIE high resolution spectra and the VIRUS-W spectra, and to then convolve the ELODIE spectra to the spectral resolution of VIRUS-W.
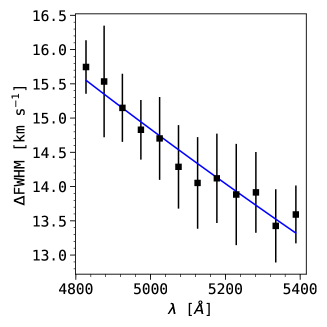
The spatial variation of the VIRUS-W’s spectral resolution is negligible (%, Fabricius et al. 2012). However, it changes as a function of wavelength, varying from 17 kms-1 around 4800 Å to 14 kms-1 at 5400 Å. To account for this, we derive a differential broadening function, which measures as a function of wavelength the difference in instrumental FWHM between the stars in the ELODIE library and those observed with VIRUS-W. We initially divide the spectral range into 12 equally spaced and 50 Å wide sub-regions and measure the differential broadening separately in each. For this, we convolve the ELODIE spectrum with a Gaussian and vary the centroid and the width of the Gaussian until we obtain minimal residuals between the ELODIE spectrum and the corresponding VIRUS-W spectrum. We use the standard scipy least_squares routine for the optimization. We repeat this process for each of the 30 spectra that the VIRUS-W library and the ELDOIE library have in common and then compute the mean and the RMS values in differential dispersion for each wavelength bin. We find that the change of the FWHM of the differential broadening with wavelength is well represented by a first order polynomial (see Figure 4); we then use this linear trend as model for the differential broadening. We then convolved all of the spectra of giant stars in ELODIE to the VIRUS-W resolution (as function of wavelength), by using the linear model of the differential broadening. The ELODIE high resolution contains spectra of 220 giant and subgiant stars which is an impractically large number of templates to use in our kinematic extraction. To fairly sample ages, metallicities and over-abundances, we use the published values for the LICK indices to locate the stars in the four dimensional space of H, Mg , , and . We split this space into one Å wide bins and select one star per bin, resulting in a total of 72 stars (broadened to the VIRUS-W resolution) that we use in the further analysis.
5 Kinematics and light distribution
We found clear evidence of the presence of two distinct stellar kinematic components in NGC 3521. Our result is supported by two different methods: the non-parametric LOSVD recovery (MPL) and a parametric fitting (pPXF). Contrarily to the previous studies (Zeilinger et al., 2001; Fabricius et al., 2012), we found that the two stellar components in NGC 3521 co-rotate with respect to each other and with respect to the ionized-gas. The main reason for the disagreement is that previous data had poorer spectral resolution ( km s-1). This generated spurious signals in the Fourier space when recovering the shape of the LOSVD, which was misinterpreted as signal of counter-rotation.
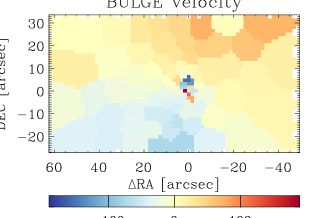
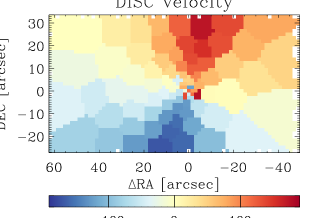
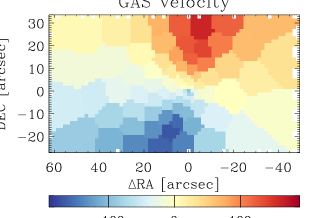
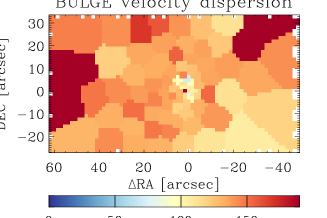
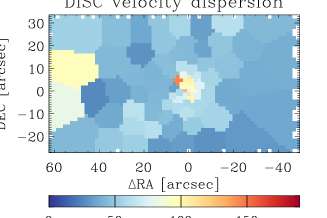
On the basis of their kinematic properties, we can classify the two components as kinematically “cold” and kinematically “hot”, as shown in Figure 3. As their names suggest, the “cold” component has large rotational velocity (up to about 150 km s-1 along the major axis) and low velocity dispersion (about 50 km s-1 over the observed field of view), whereas the “hot” component has low rotational velocity (up to about 50 km s-1 along the major axis) and large velocity dispersion (about 120 km s-1 over the observed field of view). Both the “hot” and “cold” stellar components show peculiar kinematic features in the central 3″, e.g. an apparent counter-rotating structure in the “hot” component velocity field, irregular velocity field and high values of velocity dispersion in the “cold” component. These features are probably artifacts from the spectral decomposition due to the very small velocity difference between the stellar components, and not real features.
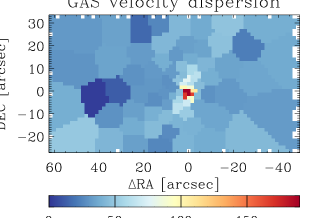
The ionized gas rotates in the same direction as the “cold” stellar component. Its rotational amplitude is about 150 km s-1 along the major axis and its velocity dispersion is about 25 km s-1 over the observed field of view. The ionized-gas velocity dispersion peaks in the central ( km s-1); it is not clear if this is due to unresolved rotation or to the presence of an AGN (NGC 3521 is classified as LINER, Goulding & Alexander 2009).
It is natural to associate the cold and hot stellar components with the disc and the bulge of NGC 3521, despite their identification being based on kinematics rather than photometry. In order to further justify this association, in Section 5.1 we study the light contributions of the two kinematic components, as returned by the spectral decomposition code, and compare them with those of the bulge and disc as derived from photometry.
5.1 Light distribution of bulge and disc
In the following sections we study the light distribution of the two kinematic stellar components identified in Section 5. We follow two complementary approaches: we study the two-dimensional images (5.1.1) and the azimuthally averaged radial profiles (5.1.2) of NGC 3521 and its structural components.
5.1.1 Two-dimensional distribution
Figure 5 shows a two-dimensional map of the light contribution of the two stellar components as derived from the spectral decomposition. The map was created in the following fashion. First we collapse the VIRUS-W data cube along the spectral direction to obtain an image on the galaxy. We then multiply the integrated flux in each pixel by the relative amplitude that we obtained from the spectral decomposition code for a given component. Both the collapsed image and the reconstructed image of the host stellar component are asymmetric with a higher surface brightness to the North-Eastern side of the centre as compared to the South-Western side. On the other hand the reconstructed image of the cold component does not show such asymmetry.
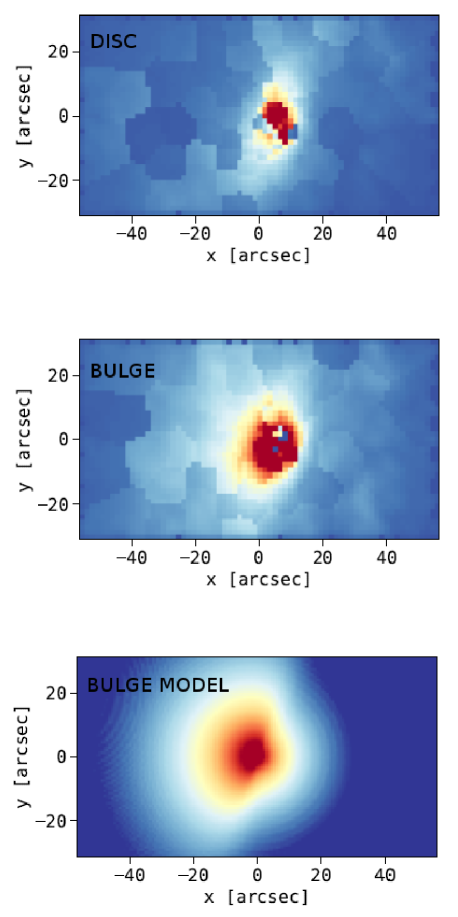
This is easily explained by dust obscuration of the light that originates from the part of the bulge that is located behind the near side of the disc. The disc itself would – at least if assumed to be thin – appear symmetric in this model because the line of sight always penetrates about the same amount of disc light before reaching the dust screen. On the other hand, the bulge is three dimensional: the side further away will always be more dust obscured than the closest side, creating an asymmetric image of the bulge.
To better understand this, we executed a simple spherical decomposition of the bulge light using the decomposition parameters of Fabricius et al. (2012) with an effective surface brightness of 15.5 mag arcsec-2, an effective radius of and a Sérsic index of 3.7. To model the dust obscuration we then add a infinitely large and infinitely thin plane through the centre of the spheroid to this model with an inclination angle of 72.7∘ as derived for NGC3521 by Bagetakos et al. (2011). We found that an obscuration to 80% (in the sense that 80% of the light behind the disc is blocked), gives a good match with the observations. We finally reproject the image onto a two dimensional plane.
The result is shown in the bottom right of Fig. 5. There is reasonable qualitative agreement between the reconstructed image of the high velocity dispersion component and the screen spheroid, suggesting that the two components of the spectral decompositions do indeed correspond to physical counter parts.
5.1.2 Radial surface brightness profiles
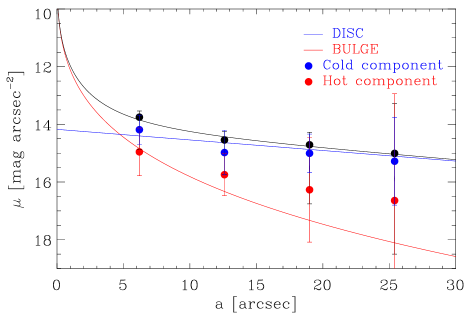
Figure 6 shows the bulge/disc surface brightness profiles as measured by Fabricius et al. (2012) with the -2.5 log of the median counts measured in elliptical annuli on the hot/cold components. From Fig. 6 we see a qualitative correspondence, albeit not optimal, between the kinematic and photometric components. The surface brightness radial profile of the kinematically cold component well matches that of the disc. The kinematically hot component has a steeper profile and is less luminous than the kinematically cold component, in agreement to the bulge profile. However, the spectral decomposition suggests a somewhat slower drop-off as function of radius than the photometric decomposition. Part of these differences can be attributed to the difference between the VIRUS-W (optical) spectral range and the near-IR photometric data.
5.1.3 Conclusions about the light distribution
Driven by the similarities described in Sections 5.1.1 and 5.1.2, we refer to the cold and hot components as “disc” and “bulge” in the rest of the paper. However, the differences highlighted in these sections prevented us from using the relative light contributions from the photometric decomposition as priors for the spectroscopic decomposition.
6 Stellar populations
In this section we describe the procedures adopted to study the properties of the stellar populations of the bulge and disc in NGC 3521 independently. The results will be presented and discussed in Section 7. First, we exploit the high signal-to-noise spectrum obtained by adding all the individual spectra of each component to derive the luminosity-weighted and the mass-weighted contributions of the multiple stellar populations that are present in each component (Section 6.1). The analysis is done by integrating the spectra over the entire radial range (Section 6.1.1) and by considering 3 radial bins to highlight possible trends with radius (Section 6.1.2). Second, we exploit the information of multiple absorption line indices to derive the luminosity-weighted simple stellar population (age, metallicity, and -enhancement) in each spatial bin in order to obtain the two-dimensional maps of the properties of the bulge and disc (Section 6.2).
6.1 Multiple stellar populations in the disc and the bulge of NGC 3521
In this section we identify the presence of multiple stellar populations in NGC 3521, by analyzing the observed spectrum and the spectra of the bulge and disc as determined via the spectroscopic decomposition. The analysis is done both globally (Section 6.1.1) and in 3 radial bins (Section 6.1.2).
In order to minimize the effects of degeneracy from the spectral decomposition, we considered only the spectra in the bins where the absolute velocity difference is higher than 50 km s-1. Indeed, we find that if we decompose the spatial bins where the velocity difference between the two components is small, the models of the two components are degenerate: the same total best model is reached when exchanging the templates from one component to the other. By selecting only bins with high velocity separation, the degeneracy is minimized by the different position of the spectral features of the two stellar components.
6.1.1 Integrated properties
The analysis is divided into 2 parts: first we analyse the observed spectra of NGC 3521, secondly we analyse the bulge and the disc separately. Therefore, we have 3 spectra to fit: one for the entire system, one for the disc, and one for the bulge.
The fit is performed using the pPXF routine with a set of simple stellar population (SSP) models from Vazdekis et al. (2010) and Gaussian functions to remove emission lines as templates. The SSP templates span a wide range of ages (from 0.5 to 14 Gyrs), and they include sub-solar ([Z/H]), solar ([Z/H]), and super-solar ([Z/H]) metallicities 333This choice is justified by the range of values obtained in Section 6.2. We used SSP models and not the ELODIE stars because, contrarily to Section 4, we are interested in finding the stellar population and not a precise fit to the kinematics.
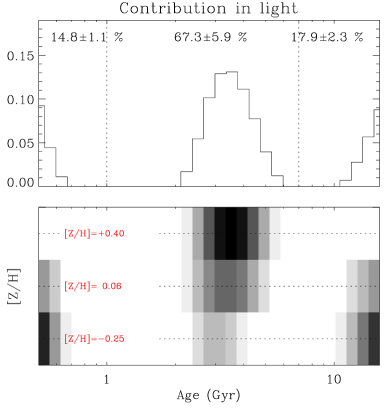
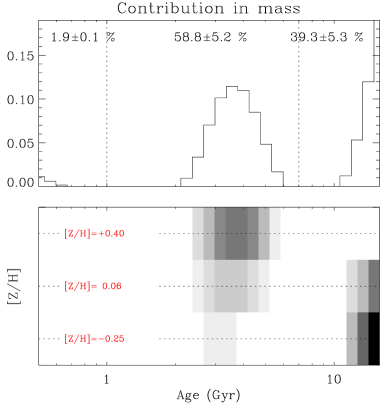
The pPXF fitting routine computes the best-fitting stellar template as a linear combination of all the individual SSP models in the library, assigning a weight to each template. We divided each SSP model by its median flux so that the weight assigned by pPXF to each SSP indicates the contribution to the total light. By removing this normalization, the weights indicate the contribution of that SSP model to the total mass.
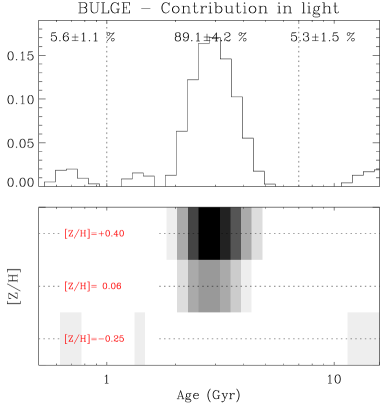
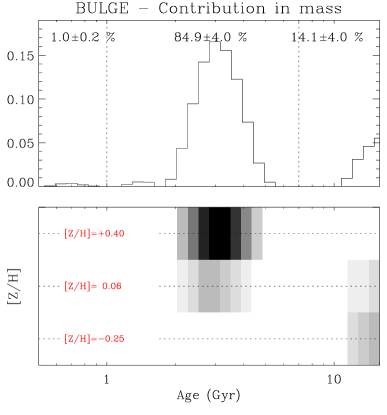
Figure 7 shows the distributions of best-fitting weights as a function of age and metallicity for the observed spectrum (top), the disc component (middle) and the bulge component (bottom). The left column shows the contribution to the total light while the right column shows the contribution to the stellar mass. We clearly identify 3 main components, an old population ( Gyr), an intermediate-age population ( 3 Gyr), and a young population (1 Gyr). It is beyond the scope of the paper to interpret the full star formation history of NGC 3521 and study in detail how mass built up over time. This, in theory, can be derived from the shape of the histograms in the right panels of Fig. 7. However, the fitting procedure is sensitive to certain features in the spectra that do not vary linearly with ages or with (age). For example, for age < 1 Gyr, the light (and therefore the features in the observed spectrum) is dominated by blue massive stars, while for age > 5 Gyr, the light is dominated by stars in the red giant branch. Therefore, one has to be cautious in how to interpret the shape of the histograms in terms of mass assembly over time. We therefore limit our analysis to 3 age bins: Gyr, 2–5 Gyrs, and Gyrs.
6.1.2 Radial profiles
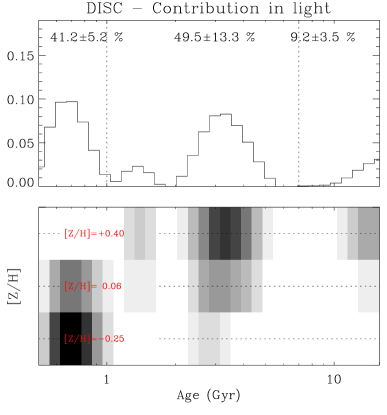
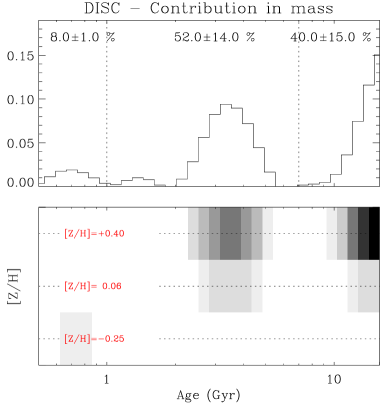
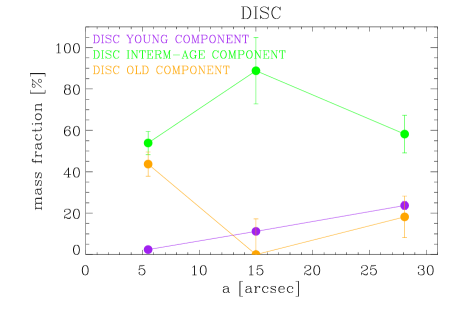
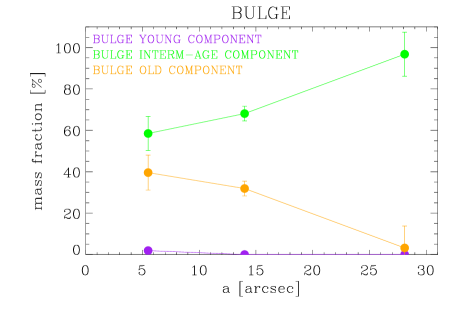
We repeated the analysis of multiple stellar populations by grouping the spectra of the bulge and disc in three radial bins. A finer radial description is beyond the signal-to-noise of our data. The aim is to study the radial variation of the contribution of the young, intermediate, and old stellar populations to the mass of the bulge and disc. This result is shown in Figure 8. The mass fraction of the bulge and disc is dominated by the intermediate-age component. The contribution of the young component to the disc mass increases with radius, whereas it is negligible in the bulge.
6.1.3 Computation of the errors in the contribution of each stellar population
In order to compute the errors on the contribution to the light and mass of each stellar population (Figs 7 and 8, we used a boot-strapping Monte Carlo approach.
The fit of each spectrum was repeated 100 times using the best-fit model with the addition of random noise as the input spectrum. The added noise is consistent with the observed signal-to-noise of the fitted spectrum. Each of these 100 realization gave a different result; the standard deviation of the results gives us the estimate of the error due to the signal-to-noise.
6.2 Spatially-resolved simple stellar population
In this section we exploit the information of several absorption line indices to infer the luminosity-weighted simple stellar population properties (SSP) and their spatial distribution. This is done both for the bulge and the disc. Because we fit simple stellar population models to components that are know to host multiple stellar populations (see Section 6.1.1), the results are biased towards the most “important” component. According to Serra & Trager (2007), the luminosity-weighted stellar SSP age derived for multiple populations will be biased towards the youngest and most luminous component. On the other hand, the luminosity-weighted SSP metallicity is less affected by this bias than the age, and therefore it traces better the properties of the main bulk of stars.
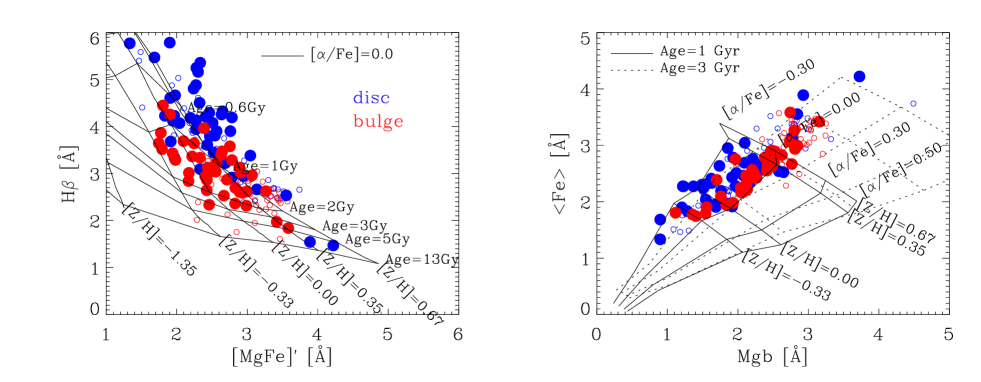
For each spatial bin, we determined the best fitting linear combination of ELODIE spectra (broadened to the spectral resolution of VIRUS-W) for each of the kinematic components. After convolving these best-fitting spectra to the LICK spectral resolution (FWHM=8.4 Å), we measured the line strengths of the indices H, Mg b, Fe5270, and Fe5335. The derived line strengths are then corrected using a linear calibration to the Lick system that we obtained by comparing the values measured on the stars in the stellar library that are in common with the sample of Worthey et al. (1994). We then fit stellar population models by Thomas et al. (2003) that account for variable -elements abundance ratio to the measured indices. We did not include Fe5015 in our procedure because it was the index that deviated most from the best fit. The distribution of absolute normalized residuals of Fe5015 was about 4 times higher than those of the other indices. Moreover, contrary to the other iron indices, the inclusion of Fe5015 in the fit systematically increased the global metallicity by 0.2 dex.
For visualization purposes, in Figure 9 we show a combination of some of the measured indices in the H vs. [MgFe]’ and Mg b vs Fe parameter spaces, and compare them with the prediction of simple stellar population models.
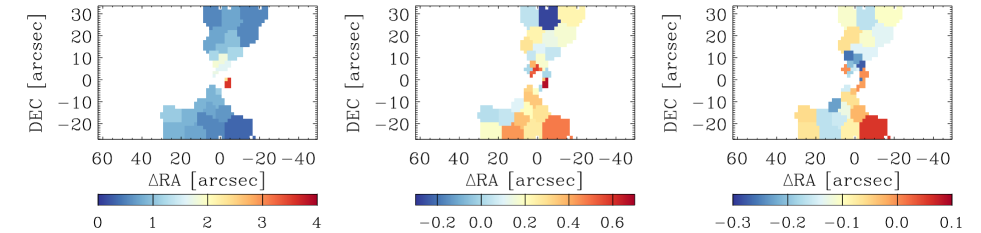
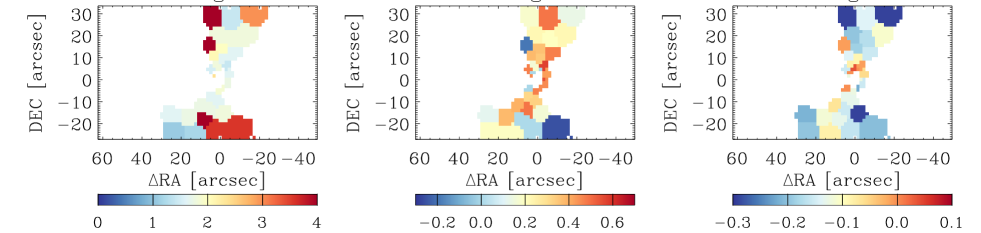
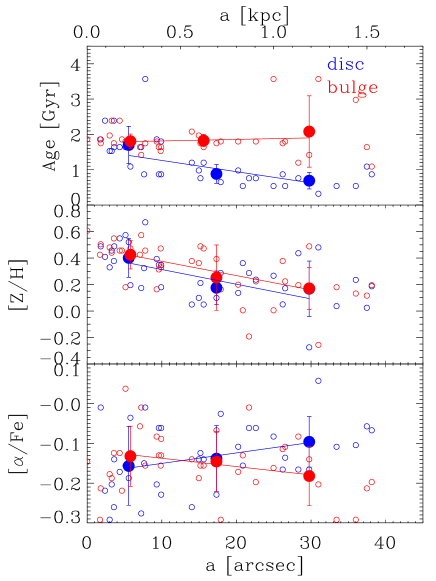
The two-dimensional maps of ages, [Z/H], and [/Fe] are shown in Figure 10 and their radial profiles computed along concentric ellipses oriented as the galaxy photometric major axis are shown in Figure 11. Similarly to what we did in Section 6.1.1, we highlight in Figs. 9-11 the spatial bins where the absolute velocity difference between the two stellar components is higher than 50 km s-1.


7 Discussion and conclusions
The spectroscopic decomposition clearly revealed the presence of two stellar kinematic components in NGC 3521, which we identified with the bulge and the disc, and one ionized-gas component. The stars in the bulge and disc co-rotate and are characterized by different morphology, kinematics (velocity and velocity dispersion), stellar population content, and equivalent width of the absorption lines.
The integrated fit of multiple stellar populations (Sect. 6.1) reveals the presence of three populations of stars that are highlighted in the upper panels of Fig. 7:
-
•
a young (1 Gyr) and metal poor population ([Z/H]);
-
•
an intermediate-age ( 3 Gyr) and metal rich component ([Z/H]), which dominates the light and mass of NGC 3521;
-
•
an old population ( Gyr) that spans a large range of metallicity values ([Z/H]).
The presence of a young component (age Gyr, that we are able to associate mainly with disc stars, see Fig. 7) is compatible with the independent detection of active star formation in NGC 3521 ( = -2.583, Calzetti et al. 2010).
Exploiting the spectral decomposition, we managed to remove the mutual contamination of bulge and disc, and therefore we could investigate how these stellar populations distribute among the bulge and the disc of NGC 3521. As shown in the middle and bottom panels of Figure 7, the light of the disc is dominated by the young and intermediate populations, whereas the bulge is dominated by the intermediate population. The mass of the disc is dominated by the intermediate and old components, whereas the mass of the bulge is dominated by the intermediate component. The stars of the old population that are associated to the disc are metal rich (Fig. 7, middle panels), whereas the stars of the old population that are associated to the bulge are metal poor (Fig. 7, bottom panels).
Figure 8 indicates that the different populations of stars have a distribution in the disc and bulge that depends on radius. Indeed, the percentage of young stars in the disc increases with radius. On the other hand, the young stars in the bulge are concentrated only in the centre, and their (negligible) contribution to the bulge mass decrease with radius.
The equivalent width of the spectral indices and the luminosity-weighted simple stellar populations of the bulge are different from those of the disc (Figures 9, 11). With respect to the luminosity-weighted simple stellar population, the main difference between bulge and disc is seen in their ages. The disc is younger and has a negative age radial gradient (from Gyr in the innermost elliptical bin down to Gyr in the outermost elliptical bin). The bulge is slightly older with an average age of Gyr (see Fig. 11).
Both components have very similar luminosity-weighed metallicity and -enhancement, within the uncertainties. Their metal content is super-solar and has a mild negative radial profile (from in the innermost elliptical bin down to ); their alpha enhancement is sub-solar and nearly constant towards the entire observed radial range ([/Fe]).
The results of Sections 6.1, and 6.2 are consistent with each other, at least from a qualitative point of view. The range of luminosity-weighted ages as determined via the SSP fit in Section 6.2 (disc Gyr, and bulge Gyr) is of the same order as the mean age of the luminosity-dominant stellar populations measured in Section 6.1.1 ( Gyr, Fig. 7 left panels). Moreover, the range of mean luminosity-weighted metallicities (, Fig. 11) is consistent with the metallicity of the main bulk of stars (, Fig. 7 right panels). The negative age gradient of the disc (Fig. 11, upper panel) is a consequence of the mild radial increase of the contribution of young stars to the mass of the disc (Fig. 8, upper panel).
From the combined information of the integrated multiple stellar populations analysis (Sect. 6.1.1), and the spatially-resolved simple stellar population analysis (Sect. 6.2), we can infer the following formation scenario for NGC 3521.
| Component | Age | [Z/H] | [/Fe] |
|---|---|---|---|
| [Gyr kpc-1] | [dex kpc-1] | [dex kpc-1] | |
| Disc | –0.8 0.4 | –0.3 0.2 | 0.1 0.1 |
| Bulge | 0.1 0.1 | –0.27 0.04 | –0.1 0.1 |
The galaxy formed with multiple formation episodes, the first occurring Gyrs ago from metal rich material. A second episode of star formation occurred about 3 Gyr ago; this episode involved both components, but it affected mainly the bulge. Because the intermediate-age population is also the most luminous, the age radial profiles shown in Figure 11 refer to this second episode.
The third episode of star formation occurred Gyr ago and added mass mainly to the disc component. This population of stars dominates the light of the disc component (although their mass contribution is small), therefore the radial age gradient shown in Figure 11 describes these stars. This radial profile suggests that the formation of the young disc stars started right after the formation of the intermediate-bulge population of stars in the innermost elliptical bin. Because the mass contribution of the youngest disc star is very small (% of the disc stellar mass, Fig. 7), the radial metallicity gradient shown in Figure 11 describes the intermediate and old disc stars.
The metallicity of the stars associated with the youngest disc component ranges from solar to sub-solar (Fig. 7), therefore they cannot originate from recycled material of previous generation of stars (either from disc or bulge), because the latter is are more metal rich. The material must come from outside the disc and the bulge of NGC 3521. On the other hand, there is no evidence of gas accretion onto NGC 3521 from the intracluster medium (Elson, 2014). The most probable scenario is that the origin of this young component is material coming from the so-called “anomalous” gas halo surrounding NGC 3521 detected by Elson (2014). The authors also suggest that the interplay between the stellar feedback and star formation is regulated by galactic fountains that transfer material from and to the halo, which is consistent with our interpretation.
The disc of NGC 3521 has luminosity-weighted properties that are similar to those of other spiral galaxies for which multiple age-components are detected (e.g., Morelli et al. 2015). However, the majority of the disc light in the sample of Morelli et al. (2015) is dominated by stars older than 7 Gyrs (Figure 2 in their paper), whereas the light of the disc of NGC 3521 is dominated by stars younger than 7 Gyrs.
The bulge of NGC 3521 is consistent with those of other bulges in spirals where an attempt was made to minimize the contamination from the disc (Morelli et al., 2008; Morelli et al., 2012). The majority of the bulges in those studies have intermediate ages and super solar metallicity, positive age gradients, and negative metallicity and gradients, similar the bulge of NGC 3521.
The properties of NGC 3521 differ from those of the majority of S0 galaxies in which spectral decomposition was attempted to isolate the contribute of disc and bulge (Johnston et al., 2012; Tabor et al., 2017). The bulges in those S0 samples have intermediate ages, as the majority of the stars in the bulge of NGC 3521. However there is evidence that the bulges in those samples are younger than the corresponding discs, unlike NGC 3521.
We cannot rule out merging as an alternative scenario opposite to the in-situ formation of stars as builder of the structural components in NGC 3521, at least for the old and the intermediate populations. Indeed, as discussed in Section 2, the galaxy shows deviations from a smooth axi-symmetric structure with spiral arms. These structures could be the relics of the past merger history of NGC 3521 that contributed to the build-up of its components. However, it is difficult to associate these non axi-symmetric structures to the youngest disc component in NGC 3521. Indeed, they extend perpendicularly to the disc and are apparently detached from the blue spiral structure that trace the youngest component (Figure 1). Therefore, if a merger indeed contributed to the formation of the stellar components in NGC 3521, it is more likely that it directly contributed to formation of the old and/or the intermediate-age populations. The same merger could also be the mechanism that allowed NGC 3521 to acquire the “anomalous” HI cloud, from which the youngest stars in the disc have originated.
In summary, we propose the following formation scenario. The bulge and disc components of NGC 3521 formed a long time ago from stars of similar age; the formation was followed by a rejuvenation process (or accretion of younger stars via a merger) that involved both components, but mainly the bulge. Then, very recently, the disc of NGC 3521 accreted material from the surrounding gas halo, which could have been acquired during a past merger, and formed a new generation of stars in an inside-out manner.
NGC 3521 is yet another good example of how it is possible to recover the formation and mass assembly of bulges and discs via the spectroscopic decomposition approach independently, especially for cases of fainter bulges embedded in luminous discs, or vice-versa. The next natural step for this kind of investigation is to study a representative sample of galaxies to understand what are the preferred formation channels.
Acknowledgements
We wish to thank Michael Opitsch for useful discussion during the preliminary phase of this work. LC thanks the Department of Physics and Astronomy of the Padova University for hospitality while this paper was in progress.
References
- Bagetakos et al. (2011) Bagetakos I., Brinks E., Walter F., de Blok W. J. G., Usero A., Leroy A. K., Rich J. W., Kennicutt Jr. R. C., 2011, AJ, 141, 23
- Burbidge et al. (1964) Burbidge E. M., Burbidge G. R., Crampin D. J., Rubin V. C., Prendergast K. H., 1964, ApJ, 139, 1058
- Calzetti et al. (2010) Calzetti D., et al., 2010, ApJ, 714, 1256
- Cappellari (2017) Cappellari M., 2017, MNRAS, 466, 798
- Cappellari & Copin (2003) Cappellari M., Copin Y., 2003, MNRAS, 342, 345
- Cappellari & Emsellem (2004) Cappellari M., Emsellem E., 2004, PASP, 116, 138
- Coccato et al. (2011) Coccato L., Morelli L., Corsini E. M., Buson L., Pizzella A., Vergani D., Bertola F., 2011, MNRAS, 412, L113
- Coccato et al. (2014) Coccato L., Iodice E., Arnaboldi M., 2014, A&A, 569, A83
- Coccato et al. (2015) Coccato L., et al., 2015, A&A, 581, A65
- Elson (2014) Elson E. C., 2014, MNRAS, 437, 3736
- Erwin (2015) Erwin P., 2015, ApJ, 799, 226
- Fabricius et al. (2012) Fabricius M. H., Saglia R. P., Fisher D. B., Drory N., Bender R., Hopp U., 2012, ApJ, 754, 67
- Fabricius et al. (2014) Fabricius M. H., et al., 2014, MNRAS, 441, 2212
- Freudling et al. (2013) Freudling W., Romaniello M., Bramich D. M., Ballester P., Forchi V., García-Dabló C. E., Moehler S., Neeser M. J., 2013, A&A, 559, A96
- Gebhardt et al. (2000) Gebhardt K., et al., 2000, AJ, 119, 1157
- Gorgas et al. (1990) Gorgas J., Efstathiou G., Aragon Salamanca A., 1990, MNRAS, 245, 217
- Gössl & Riffeser (2002) Gössl C. A., Riffeser A., 2002, A&A, 381, 1095
- Goulding & Alexander (2009) Goulding A. D., Alexander D. M., 2009, MNRAS, 398, 1165
- Johnston et al. (2012) Johnston E. J., Aragón-Salamanca A., Merrifield M. R., Bedregal A. G., 2012, MNRAS, 422, 2590
- Katkov et al. (2011) Katkov I., Chilingarian I., Sil’chenko O., Zasov A., Afanasiev V., 2011, Baltic Astronomy, 20, 453
- Kennicutt et al. (2003) Kennicutt Jr. R. C., et al., 2003, PASP, 115, 928
- Kormendy (1977) Kormendy J., 1977, ApJ, 217, 406
- Kormendy & Kennicutt (2004) Kormendy J., Kennicutt Jr. R. C., 2004, ARA&A, 42, 603
- Krajnović et al. (2011) Krajnović D., et al., 2011, MNRAS, 414, 2923
- Kuijken & Merrifield (1993) Kuijken K., Merrifield M. R., 1993, MNRAS, 264, 712
- Leroy et al. (2008) Leroy A. K., Walter F., Brinks E., Bigiel F., de Blok W. J. G., Madore B., Thornley M. D., 2008, AJ, 136, 2782
- Morelli et al. (2008) Morelli L., et al., 2008, MNRAS, 389, 341
- Morelli et al. (2012) Morelli L., Calvi V., Cardullo A., Pizzella A., Corsini E. M., Dalla Bontà E., 2012, A&A, 544, A74
- Morelli et al. (2015) Morelli L., Corsini E. M., Pizzella A., Dalla Bontà E., Coccato L., Méndez-Abreu J., 2015, MNRAS, 452, 1128
- Naab & Ostriker (2016) Naab T., Ostriker J. P., 2016, preprint, (arXiv:1612.06891)
- Peng et al. (2002) Peng C. Y., Ho L. C., Impey C. D., Rix H.-W., 2002, AJ, 124, 266
- Prugniel & Soubiran (2004) Prugniel P., Soubiran C., 2004, ArXiv Astrophysics e-prints,
- Rubin et al. (1992) Rubin V. C., Graham J. A., Kenney J. D. P., 1992, ApJ, 394, L9
- Serra & Trager (2007) Serra P., Trager S. C., 2007, MNRAS, 374, 769
- Snigula et al. (2014) Snigula J. M., Drory N., Fabricius M., Landriau M., Montesano F., Hill G. J., Gebhardt K., Cornell M. E., 2014, in Manset N., Forshay P., eds, Astronomical Society of the Pacific Conference Series Vol. 485, Astronomical Data Analysis Software and Systems XXIII. p. 447
- Tabor et al. (2017) Tabor M., Merrifield M., Aragón-Salamanca A., Cappellari M., Bamford S. P., Johnston E., 2017, MNRAS, 466, 2024
- Thomas et al. (2003) Thomas D., Maraston C., Bender R., 2003, MNRAS, 339, 897
- Vazdekis et al. (2010) Vazdekis A., Sánchez-Blázquez P., Falcón-Barroso J., Cenarro A. J., Beasley M. A., Cardiel N., Gorgas J., Peletier R. F., 2010, MNRAS, 404, 1639
- Walter et al. (2008) Walter F., Brinks E., de Blok W. J. G., Bigiel F., Kennicutt Jr. R. C., Thornley M. D., Leroy A., 2008, AJ, 136, 2563
- Worthey et al. (1994) Worthey G., Faber S. M., Gonzalez et al. 1994, ApJS, 94, 687
- Zeilinger et al. (2001) Zeilinger W. W., Vega Beltrán J. C., Rozas M., Beckman J. E., Pizzella A., Corsini E. M., Bertola F., 2001, Ap&SS, 276, 643
- de Vaucouleurs et al. (1991) de Vaucouleurs G., de Vaucouleurs A., Corwin Jr. H. G., Buta R. J., Paturel G., Fouqué P., 1991, Third Reference Catalogue of Bright Galaxies. Volume I: Explanations and references. Volume II: Data for galaxies between 0h and 12h. Volume III: Data for galaxies between 12h and 24h.