Correlating Cellular Features with Gene Expression using CCA
Abstract
To understand the biology of cancer, joint analysis of multiple data modalities, including imaging and genomics, is crucial. We propose the use of canonical correlation analysis (CCA) and a sparse variant as a preliminary discovery tool for identifying connections across modalities, specifically between gene expression and features describing cell and nucleus shape, texture, and stain intensity in histopathological images. Applied to 615 breast cancer samples from The Cancer Genome Atlas, CCA revealed significant correlation of several image features with expression of PAM50 genes, known to be linked to outcome, while Sparse CCA revealed associations with enrichment of pathways implicated in cancer without leveraging prior biological understanding. These findings affirm the utility of CCA for joint phenotype-genotype analysis of cancer.
1 Introduction
Cancer is a complex disease arising from molecular alterations that interact with and obstruct normal biological processes and produce phenotypic changes. Imaging modalities, such as microscopic imaging of hematoxylin-and-eosin (H&E) stained slides and high-throughput genomics provide complementary information about the phenotypic traits (such as cell morphology) and molecular traits (such as gene expression and mutations) in a tumor. The Cancer Genome Atlas (TCGA) [1] provides rich resources of imaging, genomic, and clinical data and exemplifies the growing interest in comprehensive phenotypic and genomic data sets for disease understanding.
To explore connections between multiple data modalities, correlation analysis is the most straightforward approach. However, since gene expression is the product of complex interacting cellular processes, cross-modality connections should be made that consider their relative levels and not just pairwise relationships. A recent effort to explore correlation analysis for paired image and genomic data is the work by Cooper et al. [2]. The authors extracted human-annotated measures of necrosis and angiogenesis, along with cellular features, from histopathological images of glioblastomas and studied their correlation with gene expression. To incorporate interactions between genes, each patient’s gene expression was represented as a mixture of clustered gene signatures derived from the data.
Canonical correlation analysis (CCA) [3] is an alternative approach for exploration that extends pairwise correlation analysis by considering linear combinations of the variables of each modality. An advantage of CCA is that it requires no preprocessing of gene expression or image features to incorporate their interactions, but rather learns them via the linear model. A sparsity-based extension is Sparse CCA (SCCA) [4], which makes CCA possible for high-dimensional data with few samples and is particularly suited for gene expression.
We explored the use of CCA and SCCA for unbiased discovery of connections between histopathological image features and gene expression of breast cancer tumors. In particular, we extracted cellular features of shape, color, and texture from images using CellProfiler [5] and a reliable, efficient patch-based approach for nuclear segmentation using convolutional neural networks (CNNs) [6]. Using CCA, we discovered a significant correlation of 0.763 () between the texture and shape features of cells and the expression of PAM50 genes, and enabled a separation of patients based on subtypes without leveraging specific subtype information. Using SCCA, we discovered a correlation of 0.471 () between a subset of image features and genes. Pathway analysis of the selected subset of genes using DAVID [7] revealed a meaningful connection between cell size and several genes related to immune response. Based upon these findings, we propose the use of CCA and its sparse variant as a preliminary discovery tool for imaging-genomic connections.

2 Imaging-Genomics and CCA
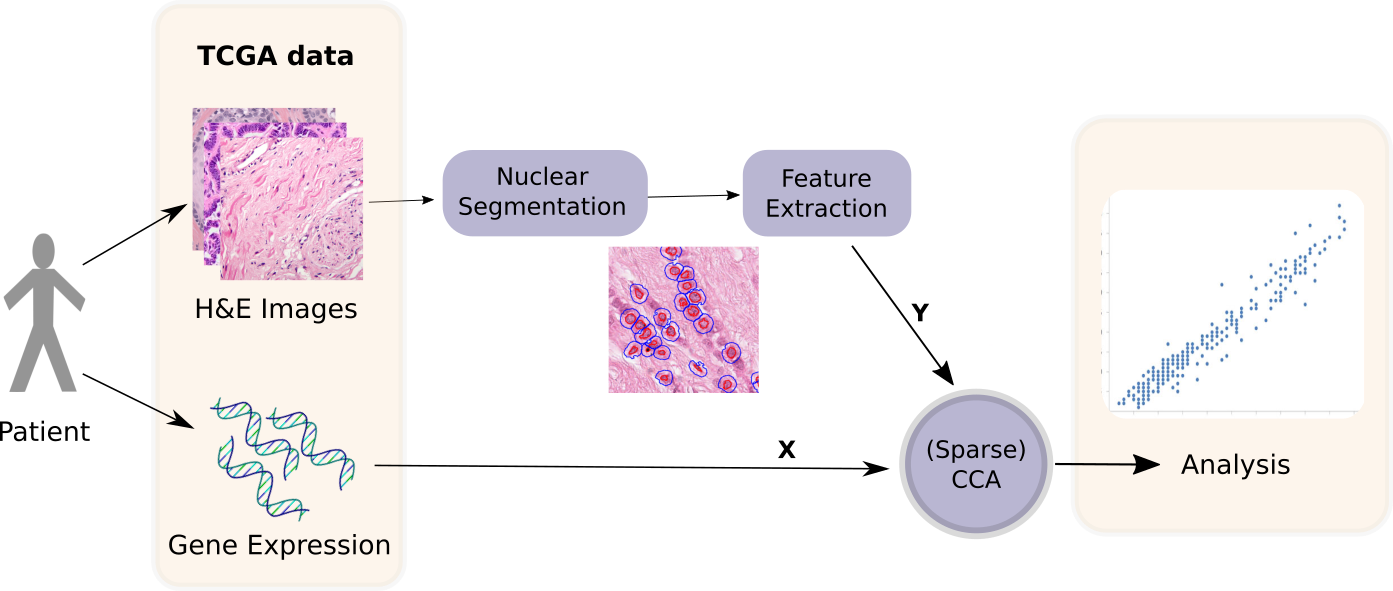
Our overall CCA workflow on paired histopathological images and gene expression of patients is shown in Fig 1, which consists of nuclear and cellular segmentation and feature extraction, and CCA and SCCA to discover significant connections between images and gene expression.
2.1 Nuclear Segmentation and Feature Extraction
In diagnosing breast cancer, the morphology and granularity of nuclei is an important indicator. Therefore, we employed computational image analysis methods to extract quantitative features describing these qualities of cells and their nuclei. We have developed a reliable and efficient patch-based CNN approach for segmentation [6], similar to that recently proposed by Janowczyk and Madabhushi [8], which scans an image patch-by-patch and produces a binary label for each patch, indicating if the center pixel of the patch is contained within a nucleus or not.
Our patch-based CNN produces a full binary nuclear segmentation mask, which is then fed to CellProfiler [5], along with the corresponding H&E image, to refine the segmentation and extract quantitative features describing the shape, texture, and color of the nuclei and cells. To summarize these features across all of the cells of the image, the mean, standard deviation, and percentiles at increments of 10% of the distribution of each feature are calculated. This yielded unique statistics of image features, which defined the image feature vector for the corresponding patient. Since analyzing entire WSIs is computationally demanding, we manually selected several representative patches from the tumor regions of each WSI and calculated the image feature vectors based on these patches, for each patient.
2.2 Canonical Correlation Analysis
For the imaging-genomics formulation, let denote the matrix of expression levels of genes for patients and denote the matrix of image features for the same patients. To understand the information shared between and , we make use of CCA and its sparse variant.
Introduced by Hotelling [3], CCA is a method for determining the linear relationship between two sets of variables. Given two sets of variables, and , attributed to the same samples, CCA seeks linear combinations of the variables in each domain that are maximally correlated with each other. Formally, CCA seeks and that maximize the objective function
where the columns of and are standardized to mean zero and unit variance. The vectors and are referred to as the canonical weights and and are the canonical variates. This process can be repeated to find dimensions of canonical variates. Similar to principal component analysis, orthogonality constraints are imposed such that corresponding variates are orthogonal to previously found pairs. The correlations of each variable of each domain with its corresponding canonical variate are called the canonical loadings. For example, for image feature and the first variate , both , the loading where is the Pearson’s correlation. Here, we employ CCA to obtain the canonical weights, and hence the canonical variates, and look to identify the genes and image features of most importance in the variate space.
For most of the genomic data used today, , while CCA is only suitable when . Applying CCA to high-dimensional, low-sample data therefore requires selecting a subset of the features in advance, or first mapping the features to a lower dimensional space, limiting the utility of the approach. To overcome this issue, many versions of penalized CCA have been proposed, which can work for high-dimensional data, while preserving interpretability.
We work with the formulation described by Witten et al. [4]. Called SCCA, this method optimizes the objective function
where and are convex penalty functions, often chosen to impose sparsity. For our analysis, we chose the penalty function. For multiple variates, the algorithm is iterated.
3 Results and Discussion


We applied the overall method on 615 breast invasive carcinoma (BRCA) patients from TCGA. Histopathological images for TCGA patients are in the form of whole slides (WSIs), and in order to reduce the computational burden of image analysis and to avoid contamination in the analysis by normal cells near the tumor, we manually selected up to fifteen representative patches of 10001000 pixels from each WSI in the tumor region for segmentation and feature extraction. Gene expression was retrieved from TCGA using cBioPortal, which normalized expression levels to z-scores. The analyses are done in R using the default CCA package and the SCCA package provided by Witten et al. [4].
3.1 Using CCA
To apply CCA to the extracted image features and gene expression of TCGA-BRCA patients, we first had to select a smaller subset of both image features and genes such that . Of the image features, we used only the mean and standard deviation of the shape, texture and color features, which resulted in 84 image features per patient. As a meaningful subset of genes to analyze, we chose the PAM50 set of 50 genes, which has been shown to be discriminative of the general grouping of patients into molecular subtypes [9].
Using CCA on these restricted sets of variables, we found four canonical variates of statistical significance (p-value less than 0.05, computed using Wilk’s lambda statistic) with strong correlation ( respectively). Beyond the first four variates, the significance of the correlation quickly dropped. To interpret the learned canonical variates, we examined the canonical loadings of each image feature and gene with each variate, which are shown in Fig. 2(a)(b).
We observe that the first canonical variate is highly correlated with many PAM50 genes, with correlations as high as , which implies that this variate is highly representative of PAM50 expression. The loadings of the image features in Fig. 2(a) are grouped by category, which reveals the strongest correlation for most variates is with several texture features of the hematoxylin stain, area, and shape. The first variate shows a strong positive correlation particularly with texture features describing the entropy and variance of the hematoxylin stain within the nucleus and shape features describing the nucleus. Subsequent variates showed much lower loadings, so while still significantly correlated within their imaging counterpart, the interpretation is not as clear.
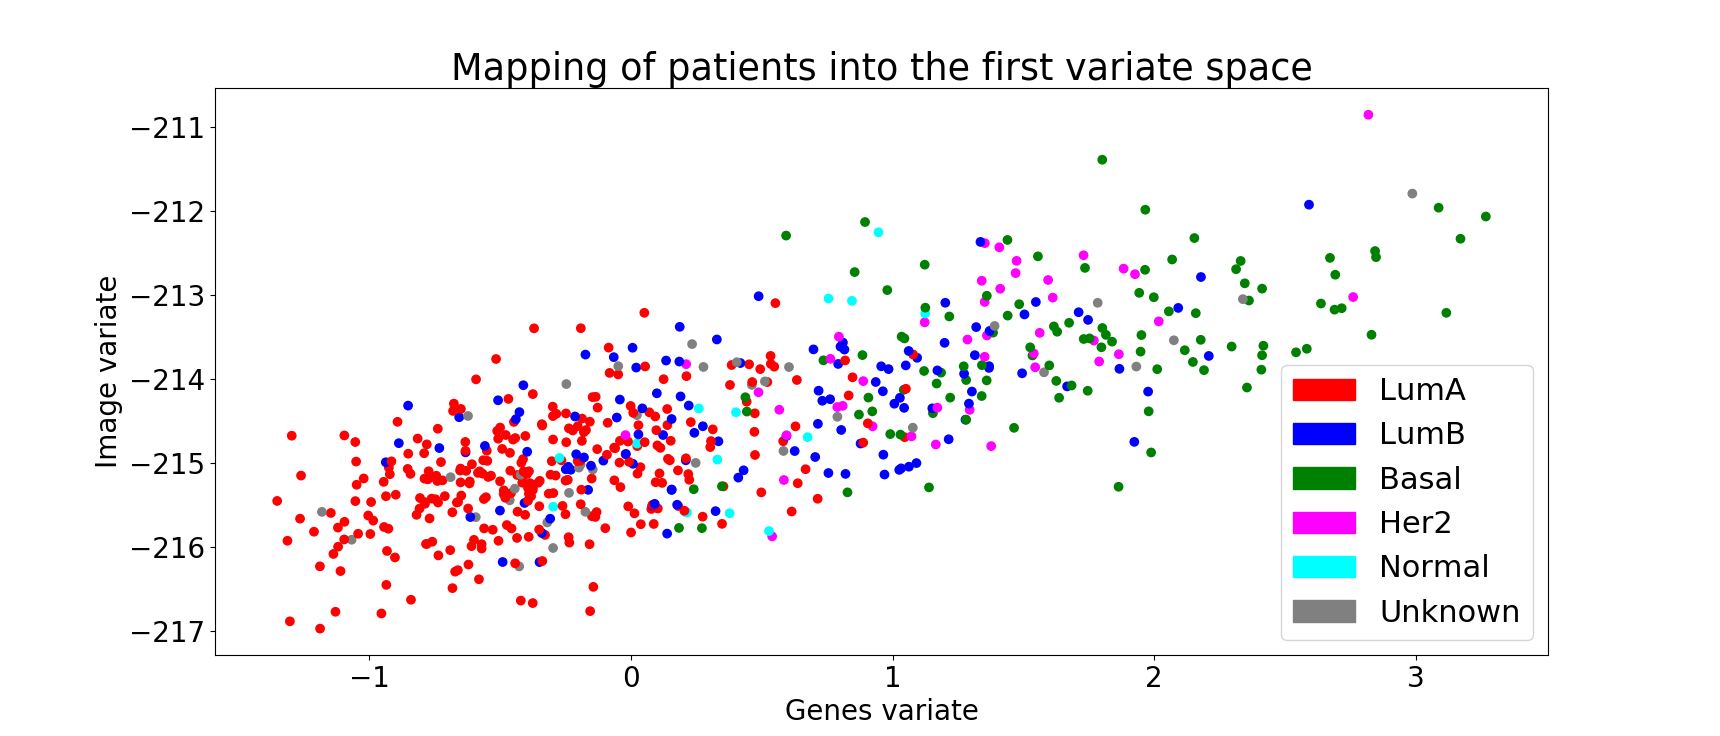
To further understand the first variate, the patients are mapped into the corresponding variate space. The scatter plot of the mappings (, on and axes, respectively) is shown in Fig. 2(c), with the color representing the true subtype. Luminal A patients are clustered towards the left, and Basal patients to the right, while HER2 and Luminal B patients are spread out in between. This spread of the subtypes is, interestingly, in accordance with the expected prognosis of the patients. It is also noted that the range of values in the image variate is considerably smaller than those of the genes, suggesting that we should consider a more diverse set of image features.
Though CCA can potentially pick any relevant linear combination of features resulting in any possible ordering of the subtypes, the result of information from both modalities was a meaningful order of subtypes: Luminal A, Luminal B, HER2 and Basal. Thus, while it is known that the PAM50 gene set is indicative of molecular subtype, CCA was able to identify the particular combination of genes and image features which can map patients into the subtype, without leveraging particular subtype information.

3.2 Using SCCA
In contrast to CCA, we were able to analyze all image features and genes using SCCA, allowing the algorithm to discover which subset of each is most correlated. Using an L1 penalty factor of 0.1 for both image and genomic variables, we obtained sets of 45-60 genes and 30-45 image features with non-zero weights for each of the ten canonical variates, respectively, with correlations in the range of 0.35-0.47, with an overall p-value of 0.001. To interpret the learned canonical variates of SCCA, we make use of the loadings as before, as shown in Fig. 2(d)(e). The category of ‘cell’ indicates that the feature is of the cytoplasmic region surrounding the nucleus, which mostly describe area and shape. All other features are extracted from the nucleus only.
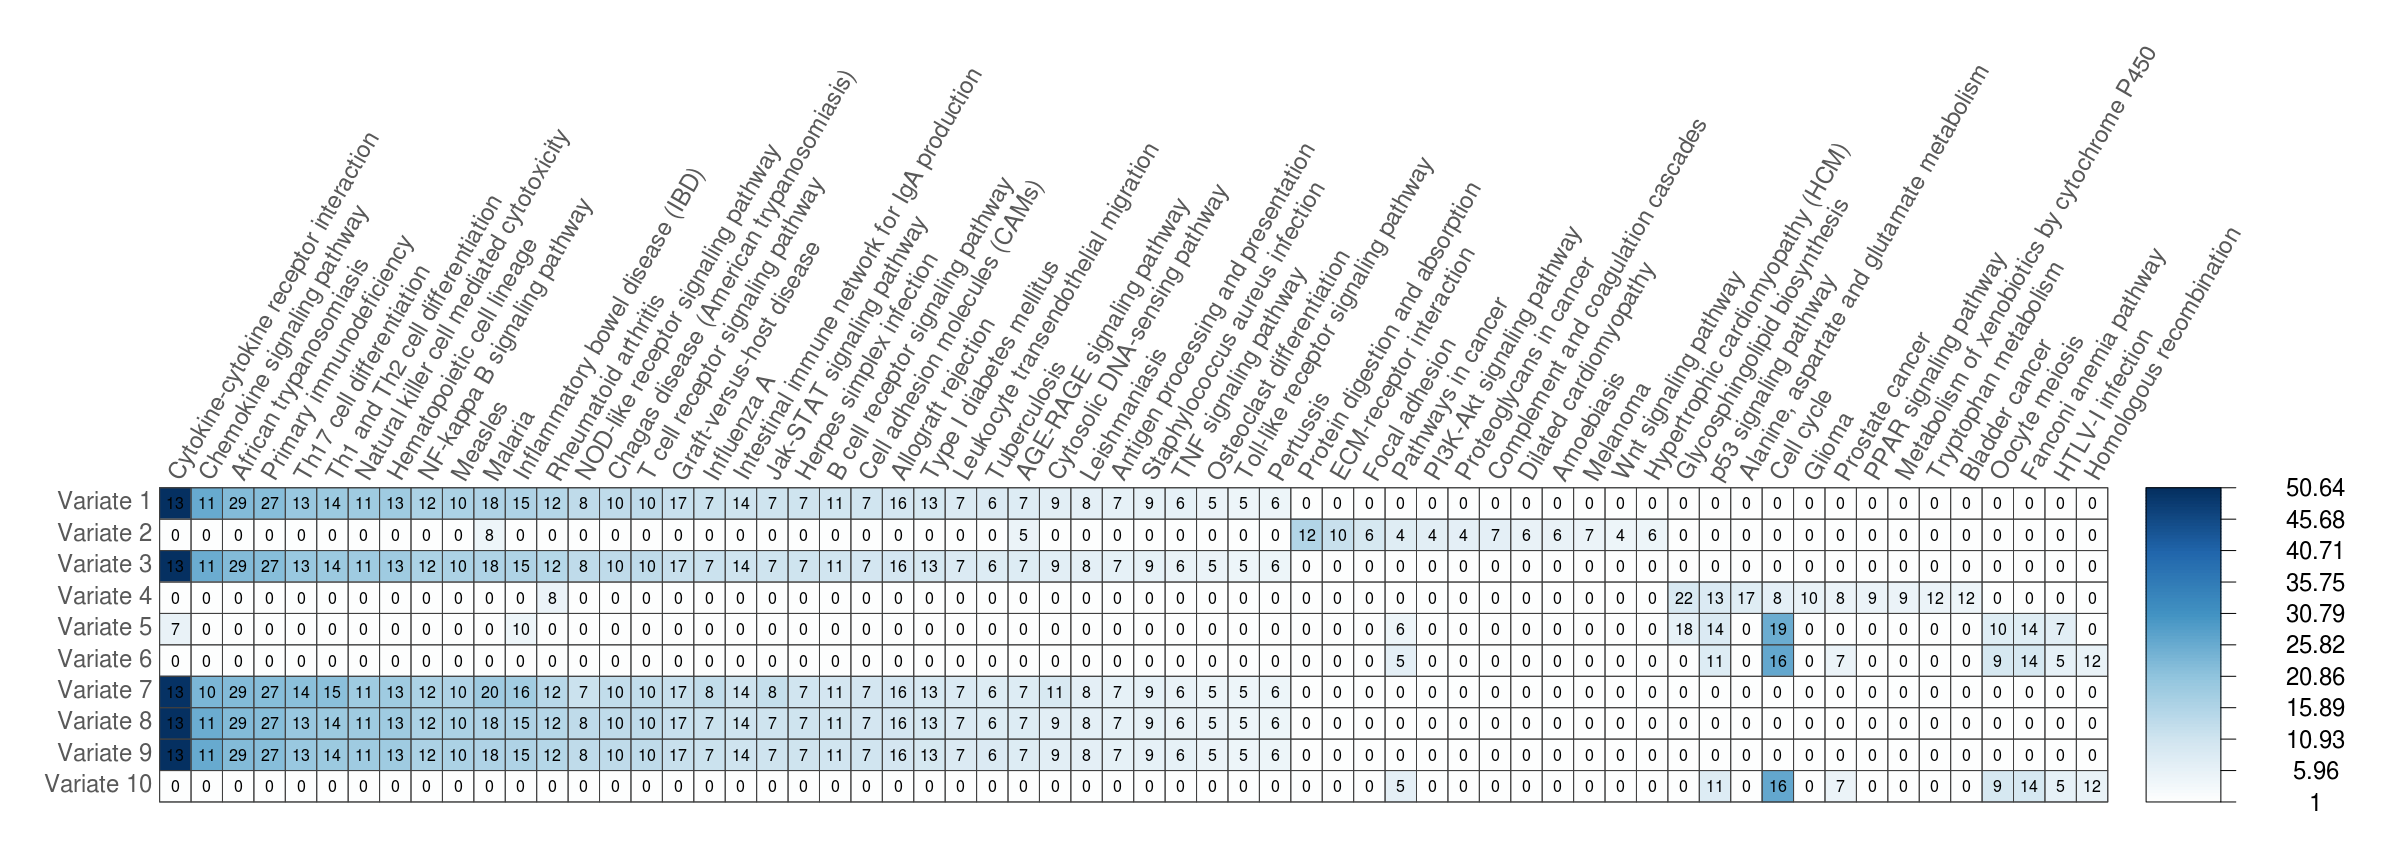
Since SCCA can consider all genes and image features, it can reveal novel, unbiased phenotype-genotype associations. We selected genes whose expression levels were highly correlated () with the canonical variates discovered by SCCA and investigated their collective function using the online functional annotation tool DAVID [7], which can test for association of gene sets with KEGG pathways. The KEGG pathways significantly associated are shown in Fig 3.
The first variate and others showed a similar correlation pattern with both image features and gene expressions, which is likely a result of the lack of enforcement of orthogonality by SCCA. DAVID revealed that, for the first variate, the highly correlated genes were strongly associated with pathways related to immune response, including primary immunodeficiency, natural killer cell mediated cytotoxicity, and to lymphocytes, including Th1 and Th2 cell differentiation, T-cell and B-cell receptor signaling, and NF-kappa B signaling. Fig. 2(d)(e) shows that the expression of these genes has a strong correlation with area and shape features through the latent canonical variates. Given that lymphocytes are easily distinguished by their small size and circular shape, we could hypothesize that these canonical variates are capturing image and genomic descriptions of the presence of lymphocytes within the tumor, which is indeed a biologically relevant association for cancer.
Variates five, six, and ten capture texture and cell hematoxylin features, which are indicative of DNA content, and intensity features of both stains. These variates were found to be correlated with gene sets associated with the cell cycle and p53 signaling pathways (related to DNA damage repair and apoptosis), all of which have important implications for tumor development. The second variate too could have implications for cancer, as it was associated with pathways involved in cell processes such as cell maintenance (ECM-receptor interaction), adhesion (focal adhesion), and proliferation (Wnt signaling and proteoglycans in cancer), and the cycle (PI3K-Akt signaling), though the lack of strong correlation with particular image features necessitates further investigation for a clear interpretation.
4 Conclusions and Future Work
We have demonstrated the utility of CCA and SCCA in discovering connections between cellular features and gene expressions for breast cancer. The learned canonical variates represent latent spaces that link the two modalities and provide insight into their joint variation. Their biological relevance was shown through their association with diverse pathways with implications for cancer, and could benefit from a more diverse range of image features. We envision that such a correlation analysis could be a preliminary step in studies of phenotypic and genomic traits, with follow-up affirmation and testing by pathologists and biologists, toward new insights into genetic diseases.
References
- [1] TCGA-Network, “Comprehensive molecular portraits of human breast tumours,” Nature, vol. 490, no. 7418, pp. 61–70, 2012.
- [2] L.A.D. Cooper, J. Kong, D.A. Gutman, W.D. Dunn, M. Nalisnik, and D.J. Brat, “Novel genotype-phenotype associations in human cancers enabled by advanced molecular platforms and computational analysis of whole slide images,” Laboratory Investigation, vol. 95, no. 4, pp. 366–376, 2015.
- [3] H. Hotelling, “Relations between two sets of variates,” Biometrika, vol. 28, no. 3/4, pp. 321–377, 1936.
- [4] D.M. Witten, R. Tibshirani, and T. Hastie, “A penalized matrix decomposition, with applications to sparse principal components and canonical correlation analysis,” Biostatistics, vol. 10, no. 3, pp. 515–534, 2009.
- [5] A.E. Carpenter, T.R. Jones, M.R. Lamprecht, C. Clarke, I.H. Kang, O. Friman, D.A. Guertin, J.H. Chang, R.A. Lindquist, J. Moffat, P. Golland, and D.M. Sabatini, “CellProfiler: image analysis software for identifying and quantifying cell phenotypes.,” Genome biology, vol. 7, no. 10, pp. R100, 2006.
- [6] B. Chidester, M.N. Do, and J. Ma, “Discriminative bag-of-cells for imaging-genomics,” in Pacific Symposium on Biocomputing, 2018.
- [7] D.W. Huang, B.T. Sherman, and R.A. Lempicki, “Systematic and integrative analysis of large gene lists using DAVID bioinformatics resources,” Nature Protocols, vol. 4, no. 1, pp. 44–57, 2008.
- [8] A. Janowczyk and A. Madabhushi, “Deep learning for digital pathology image analysis: A comprehensive tutorial with selected use cases,” Journal of Pathology Informatics, vol. 7, no. 1, pp. 29, 2016.
- [9] J.S. Parker, M. Mullins, M.C.U. Cheang, S. Leung, D. Voduc, T. Vickery, S. Davies, C. Fauron, Z. He, X.and Hu, et al., “Supervised risk predictor of breast cancer based on intrinsic subtypes,” Journal of clinical oncology, vol. 27, no. 8, pp. 1160–1167, 2009.