Antarctic Surface Reflectivity Calculations and Measurements from the ANITA-4 and HiCal-2 Experiments
Abstract
The balloon-borne HiCal radio-frequency (RF) transmitter, in concert with the ANITA radio-frequency receiver array, is designed to measure the Antarctic surface reflectivity in the RF wavelength regime. The amplitude of surface-reflected transmissions from HiCal, registered as triggered events by ANITA, can be compared with the direct transmissions preceding them by (10) microseconds, to infer the surface power reflection coefficient . The first HiCal mission (HiCal-1, Jan. 2015) yielded a sample of 100 such pairs, resulting in estimates of at highly-glancing angles (i.e., zenith angles approaching ), with measured reflectivity for those events which exceeded extant calculations[1]. The HiCal-2 experiment, flying from Dec., 2016–Jan., 2017, provided an improvement by nearly two orders of magnitude in our event statistics, allowing a considerably more precise mapping of the reflectivity over a wider range of incidence angles. We find general agreement between the HiCal-2 reflectivity results and those obtained with the earlier HiCal-1 mission, as well as estimates from Solar reflections in the radio-frequency regime[2]. In parallel, our calculations of expected reflectivity have matured; herein, we use a plane-wave expansion to estimate the reflectivity from both a flat, smooth surface (and, in so doing, recover the Fresnel reflectivity equations) and also a curved surface. Multiplying our flat-smooth reflectivity by improved Earth curvature and surface roughness corrections now provides significantly better agreement between theory and the HiCal 2a/2b measurements.
1 Overview
The NASA-sponsored ANITA project[3, 4, 5, 6] has the goal of detecting the highest-energy particles incident on the Earth. Although designed for measurement of ultra-high energy neutrinos interacting in-ice, the first ANITA flight also demonstrated (unexpectedly) excellent sensitivity to primary ultra-high energy cosmic rays (UHECR) with energies exceeding 1 EeV ( eV)[7] interacting in the Earth’s atmosphere. These are assumed to be charged nuclei (likely protons), given the lack of efficient acceleration mechanisms for electrically uncharged particles, and the long lifetimes required to traverse megaparsec-scale distances. Through interactions with terrestrial matter, both neutrinos and charged cosmic-rays produce observable radio-frequency (RF) emissions via the Askaryan Effect[8, 9, 10], with three important distinctions between the two experimental signatures:
-
1.
as viewed from the airborne ANITA gondola, charged primary cosmic ray interactions in the atmosphere generally produce down-coming signals, which subsequently reflect off the surface and up to the gondola, whereas neutrinos interacting in-ice produce up-coming signals which refract through the surface to ANITA.
-
2.
owing to the relative sparseness of the air target medium, down-coming charged cosmic ray interactions result in forward-beamed RF signal close to the primary CR momentum axis (within one degree), whereas Cherenkov radiation from in-ice neutrino interactions is well-separated () from the neutrino momentum axis.
-
3.
down-coming charged primary cosmic-rays, owing to the Lorentz force in the Earth’s magnetic field, result in predominantly horizontally-polarized (HPol) radiation, whereas the measurable Cherenkov radiation due to neutrino interactions and emerging to the gondola is predominantly vertically-polarized (VPol). Owing to this latter consideration, the HPol component of the ANITA trigger was, unfortunately, removed from the trigger chain after the ANITA-1 flight, and before the ANITA-2 flight (and also before it was realized that ANITA-1 had charged UHECR measurement capabilities). That capability was re-installed for ANITA-3 and subsequent flights.
In both cases, knowledge of the RF reflection/transmission across the surface discontinuity between Antarctic snow and air is critical to reconstructing UHECR energies. This quantity is primarily determined by the dielectric contrast across the discontinuity and also surface roughness effects, which can introduce, as a function of signal incidence angle, frequency-dependent decoherence and/or frequency-dependent signal amplification. At highly oblique incidence angles, the divergence of signal upon reflection from the convex Earth surface results in a significant dimunition of measured signal (i.e., “curvature effects”). Previously, the surface reflectivity was deduced from both ANITA-2[2] and also ANITA-3 observations of the Sun, and also ANITA-3 measurements of HiCal-1 triggers[1]. Those measurements typically followed expectations from the Fresnel equations, with the exception of the most oblique incidence angles, for which HiCal-1 data indicated a two-fold larger-than-expected surface reflectivity, compared to published models[11].
Our goals for the successor HiCal-2 experiment, compared to HiCal-1 were three-fold: a) improvement of event statistics by at least an order of magnitude, b) considerably greater incidence angle sampling than the limited range probed by HiCal-1 (3.5–5 degrees with respect to the surface), and extension into the 8–30 degree incidence angle regime probed by the Solar surface reflectivity measurements, and c) signal-emission time-stamping and azimuthal orientation readback. The latter is important in understanding the signal strength received at ANITA, given the expected dipole beam pattern of the transmitter.
In what follows, we first detail the hardware used on the HiCal-2 payloads (designated “a” and “b”, in reverse order of launch), as well as provide flight trajectory performance characteristics. More details on the instrument can be found elsewhere[12]. We also provide details on our improved calculation of the expected surface reflectivity, and compare with our measured reflectivity.
2 HiCal payload
The HiCal payload schematically consists of three main components. These are:
-
1.
the Micro-Instrumentation Package (MIP) containing the Columbia Scientific Ballooning Facility (CSBF) hardware used for communications with the main ground station in Palestine, TX, and also instrumentation for monitoring in-flight payload and telemetry of useful data,
-
2.
a sealed pressure vessel (PV) containing the bicone transmitter antenna, two piezo-electric signal generators at each axial end of the bicone transmitter, and, for each piezo, both a rotating camshaft which activates the piezo every 8–10 seconds (depending on voltage applied to the rotor, as well as ambient temperature) and also wires connecting the piezo to the feedpoint at the center of the HiCal biconical antenna. Note that the camshaft period for HiCal-1 was considerably shorter than for HiCal-2, of order 2.5–3 seconds. The PV maintains a roughly 1000 mb environment (compared to 5 mb outside the payload at float altitude). Owing to the increased likelihood of high-voltage breakdown with decreasing pressure, the PV is essential in ensuring regular pulsing and reproducible signal shapes.
-
3.
the Azimuth, TimeStamp and Altitude (ATSA) board which provides information on the transmitter performance in-flight, and measures the time and azimuthal transmitter orientation at the time a HiCal pulse is emitted.
Given the 60,000 balloon used to fly the payload, lift is sufficient to accommodate, at most, a total mass of 5 kg, similar to the weight limit on a typical weather balloon flight.
2.1 Telemetry
Since the HiCal payloads are not recovered, all necessary data are only retrievable via real-time transmission at flight-time. HiCal data are telemetered via the Iridium-based satellite communications network, with a total telemetry bandwidth budget limited to 256 bytes/minute111The 256 byte/minute total science telemetry therefore restricted the duty cycle for transmission of ATSA information to less than 50%, with the remainder being taken up by CSBF MIP data.. In addition to the time and azimuthal information from the ATSA board, CSBF data also include the voltage on the MIP board itself, as well as voltages monitoring the PV pressure and the voltage being delivered to the piezo cam motor.
2.2 ATSA performance
To determine the absolute azimuthal orientation of the HiCal-2 payload, the ATSA board interpolates the amplitudes of Solar-induced signals measured in 12 silicon photomultipliers (SiPM’s) prepared prior to flight by collaborators at the Moscow Engineering Physics Institute (Moscow, Russia). Each SiPM is displaced by 30 degrees, on a disk, relative to the adjacent SiPM’s, as shown in Figure 2. The azimuthal orientation of the transmitter antenna axis is then calculated using an ephemeris look-up table of the true sky location of the Sun, given the instantaneous payload UTC time, latitude, longitude and elevation.
[\FBwidth]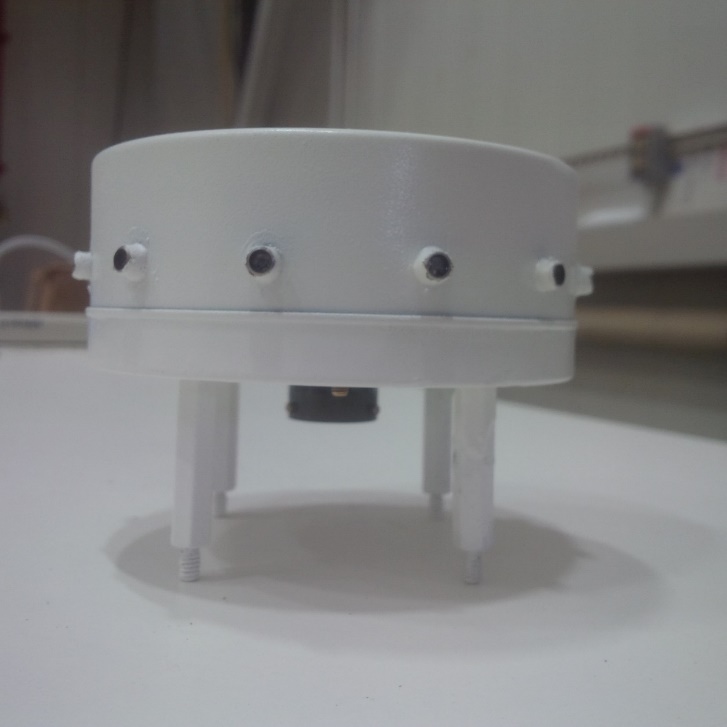
[\FBwidth]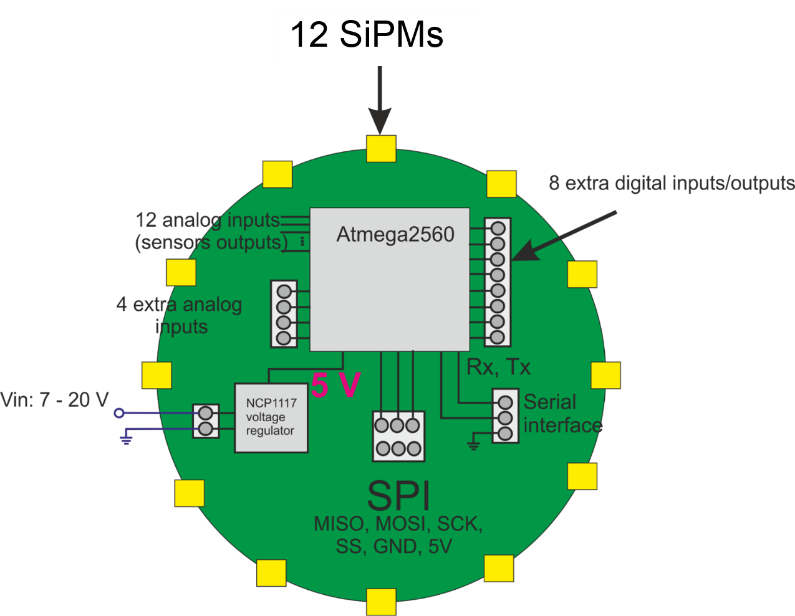
The block functional diagram and the actual implementation of the block diagram are shown in Figures 2 and 4, respectively.
Calibration of the Solar azimuthal response and the corresponding angular resolution is conducted on a bright Midwestern day. As seen from the deviation from linearity with unit slope (Figure 4), the ATSA azimuthal calibration has an accuracy of approximately three degrees. Note that there is no tracking of the polar attitude of the payload, although measurements of the (albeit much heavier) ANITA gondola rarely show departures from horizontal exceeding one degree.
[\FBwidth]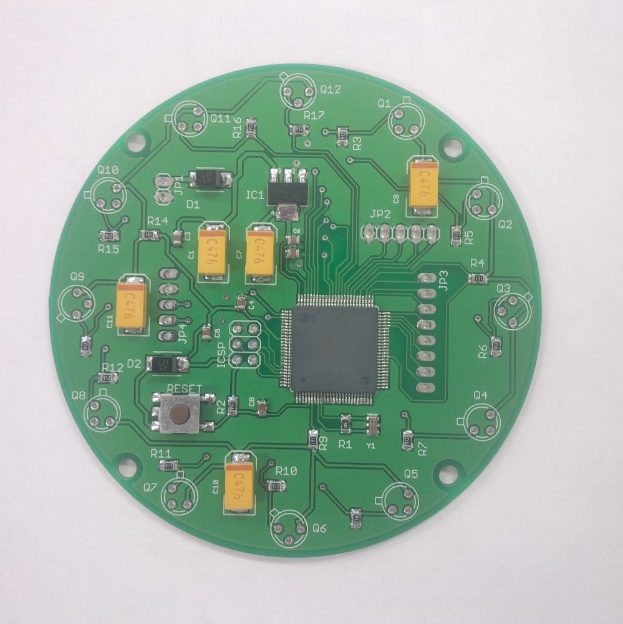
[\FBwidth]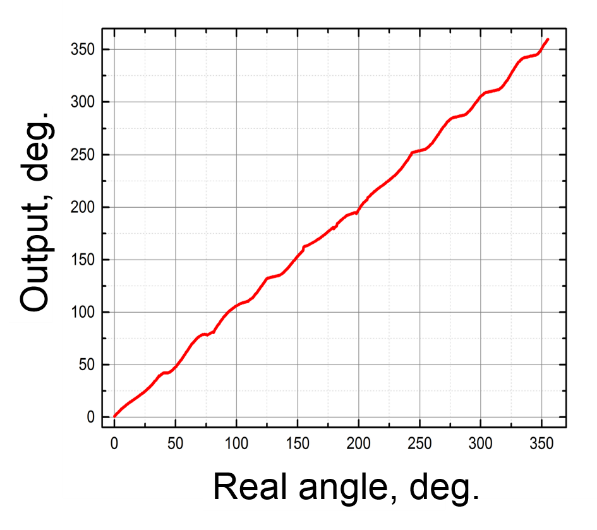
GPS time is provided by the CSBF MIP board; when a HiCal signal is produced by relaxation of the cam-depressed piezo, a small wire pickup within the pressure vessel forwards this signal to the ATSA board, which then latches the CSBF GPS second and interpolates the sub-second by counting clock cycles on a 200 MHz oscillator. This procedure was tested pre-flight and indicated 30 microsecond resolution. The actual in-flight timing resolutions achieved by the ATSA were found to be approximately 30 s and 500 s for HiCal-2a and HiCal-2b, respectively, by comparing HiCal time stamps to those of ANITA for the HiCal events which triggered ANITA-4. The error in the timing for HiCal-2a is found to be dominated by jitter in the capacitive pickup latching the CSBF GPS board. The source of the large timing error for HiCal-2b is due, in part, to the less distinctive HiCal-2b observed output signal.
2.3 Piezo-based transmitter
For the HiCal-2 mission, three transmitter design modifications were employed relative to HiCal-1. First, the MSR-brand piezo-electric was selected to replace the previous HiCal-1b MHP piezo-electric, based on a lab study of signal shape and signal regularity. In pre-flight laboratory testing, the MSR brand piezo consistently produced 5 Volt (peak-peak) amplitude signals, when broadcast to an ANITA-2 Seavey quad-ridged horn antenna at a distance of 20 meters, with no additional amplification, translating to 5 kV signal output at the bicone transmitter antenna itself. Second (as mentioned earlier), to provide redundancy, each antenna was equipped with two piezo-electric generators, one at either end of the dipole antenna. Finally, to minimize weight, the RICE dipole transmitter which flew in HiCal-1b was replaced with the thinner, aluminium bicone model, with the separation between the two bicone halves reduced to 250 microns using a thin nylon spacer.
As with all CSBF missions, prior to Antarctic flight, the performance of experimental hardware was verified during the pre-flight summer in Palestine, TX. A photograph of the payload pressure vessel (black cylinder) suspended beneath the MIP box is shown in Fig. 6.
3 Flight Details and Trajectory
Although originally intended to launch directly following the ANITA-4 launch on Dec. 2, 2016, logistical restrictions made this impossible, and the decision was made to delay HiCal launch until the return of ANITA-4 to McMurdo Station following one full circumpolar orbit around the Antarctic continent. HiCal-2b and HiCal-2a were then launched, approximately 20 hours apart, in succession, 9 days after the initial ANITA-4 launch, with HiCal-2b leading ANITA and HiCal-2a trailing, each by several hundred kilometers. The trajectories of the two HiCal payloads are shown in Figure 6. As reported elsewhere, both payloads were successfully tracked by a ground receiver array during ascent[13] with 2–3 degree precision in both azimuth and elevation during ascent. In-flight slow control parameters (temperature and pressure vessel pressure) for the HiCal-2a flight show a clear 24-hour cycle, consistent with the solar sky elevation and illumination.
[\FBwidth]
[\FBwidth]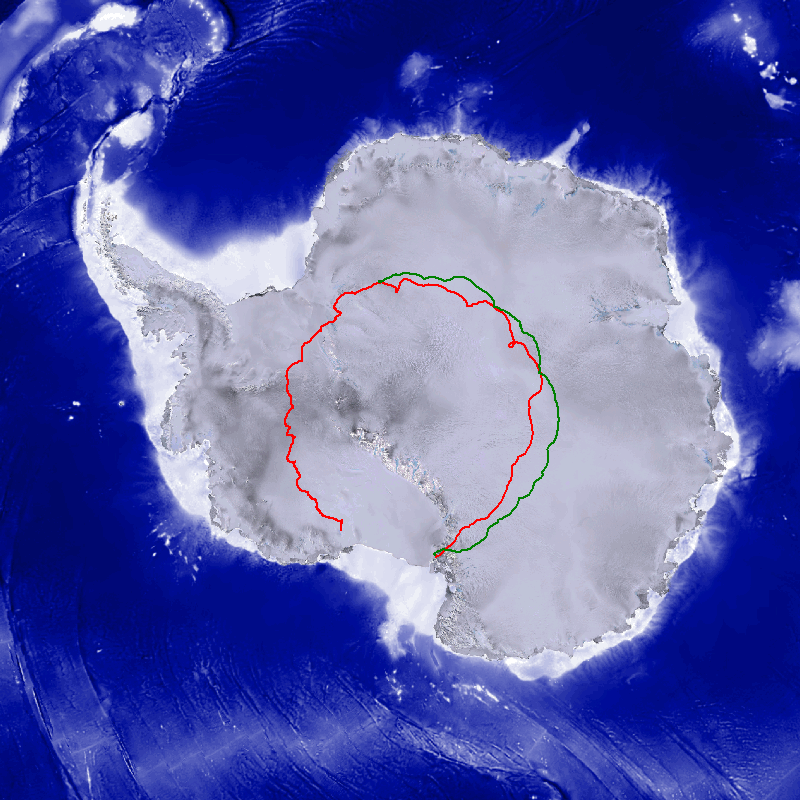
There are several parameters that can be used to identify HiCal triggers in the ANITA-4 data sample. Most obviously, we can compare the recorded HiCal transmitter trigger time to the receiver trigger times for ANITA-4 recorded events after correcting for the expected transit time between HiCal and ANITA (based on the known GPS locations of the two payloads) – this should yield a distribution that centers at zero, as indicated in Figures 8 and 8. These distributions readily identify HiCal events for those transmitted pulses with telemetered timestamps.
[\FBwidth]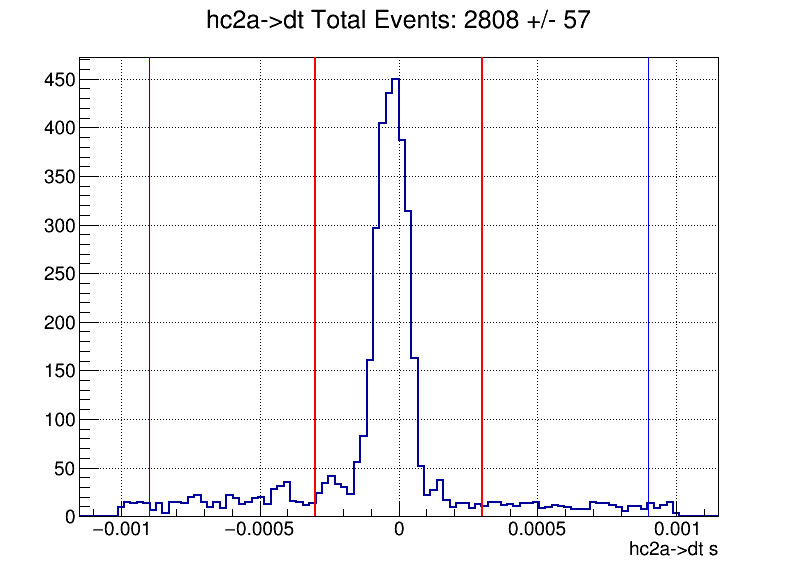
[\FBwidth]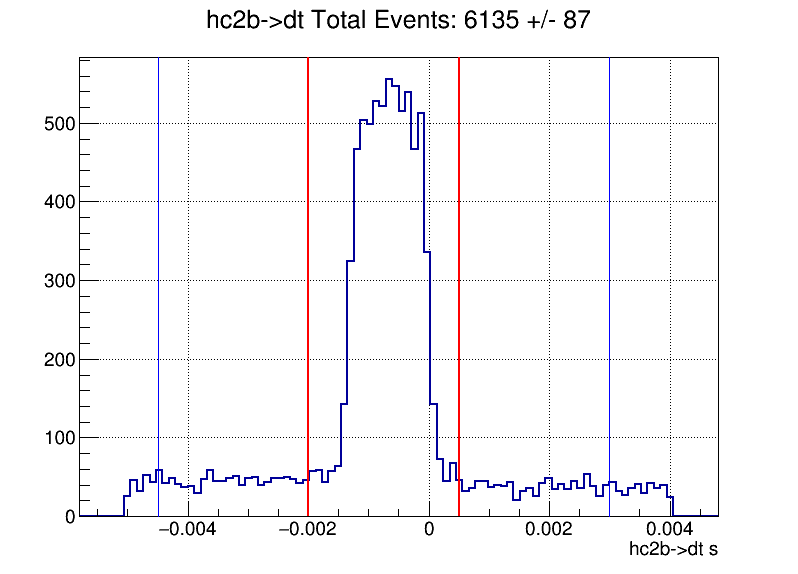
The signals obtained in pre-flight testing in Palestine, TX, with the HiCal transmitter broadcasting to an ANITA-4 quad-ridged horn antenna, but read-out into a high-bandwidth Tektronix digital scope, compared to triggers captured in-flight, are shown in Figure 10. The waveforms for the in-flight events have a characteristic low-frequency tail, which can be removed by deconvolution of the system response in post-processing, as illustrated in Figure 10. The deconvolution process is necessary to infer the actual shape of the waveform reflected off the Antarctic surface.
[\FBwidth]
[\FBwidth]
4 Calculation: A General Treatment of Reflection of Spherical Waves
We seek to compare our measurements with expectation for in-air signal reflecting off surface ice. In our previous article[12], we presented initial numerical estimates of the reflectivity, as a function of incidence angle at an interface between two media with refractive indices and . For our case, these correspond to the refractive indices of air and ice, respectively. Our current treatment, following [14], comprises a decomposition of incident signal into a sum of plane waves of different wave vectors.
We first consider the case of a flat surface and then generalize to a sphere, neglecting the Earth’s flattening at the Poles. For each plane wave, the reflected and transmitted waves are subject to the standard boundary conditions, from which we derive the standard reflection coefficients. After determining the electric and magnetic fields associated with each plane wave, integration over all wave vectors gives the total field.
The source is taken to be a dipole radiator, located at coordinates and pointing towards the y-axis, i.e. with a dipole moment as shown in Fig. 12. For comparison, the geometry for our subsequent calculation of the reflectivity for a spherical surface is shown in Fig. 12.
[\FBwidth] \ffigbox[\FBwidth]
The configuration in which the dipole points along the -axis has been calculated in [14] for the case of a flat surface. The observer is located in the plane at . The surface of Earth, first assumed to be flat, coincides with the plane. The Hertz potential for such a radiator at position vector for can be expressed as
| (1) |
with and . Here the first term on the right hand side represents the primary radiation and the second term () arises due to reflection.
For , the spherical wave can be decomposed as
| (2) |
with , and spherical polar coordinates. The right hand side represents an integral over plane waves. Note that the 1/R dependence on the left hand side of this expression is manifest in the oscillations of the exponential argument on the right hand side, over which we integrate to determine the total signal strength at the final observation point. Alternately, we can interpret this equation as a superposition of plane waves, each with a wave vector
| (3) |
i.e. with a polar angle and azimuthal angle . Note that, with this notation, we must integrate over complex values of the polar angle. Using (1) and (2), we write the Hertz potential corresponding to an incident plane wave as
| (4) |
where
| (5) |
The electric and magnetic fields can be computed using:
| (6) |
where is the angular frequency of radiation and is the permeability of the medium.
We are interested in the fields only in the Fraunhöfer far zone, . The incident electric and magnetic fields are given by
| (7) |
To determine the reflected and transmitted fields, we first determine the plane of incidence for each plane wave.
Next we decompose the electric and magnetic fields into independent components parallel
and perpendicular to the plane of incidence, then we integrate over the contributions from all the
plane waves.
4.1 Reflection and Transmission on a Flat Surface
The basic geometry for a flat reflecting surface is illustrated in Fig. 12. To compare directly with HiCal, we focus on HPol. For each incident plane wave, we project the electric and magnetic field and into two components which are perpendicular and parallel to the plane of incidence, i.e.,
| (8) |
where the subscript designates the incident, reflected or transmitted waves. For the electric field, and components are denoted by the superscripts and , respectively. If the electric field lies in the plane of incidence then the corresponding magnetic field is perpendicular to this plane. Hence for the case of magnetic field, superscripts and denote components and to the plane of incidence, respectively. We next write the unit vector normal to the plane of incidence corresponding to wave vector as
| (9) |
The vectors and lie in the plane of
incidence and hence are perpendicular to
.
This implies that and
(. Hence we obtain
.
The vectors and
point in the direction .
For the incident wave, the and components of the electric field can be expressed as:
| (10) |
| (11) |
Similarly, the and components of the magnetic field are given by
| (12) |
| (13) |
For our case, we assume that the observer is located in the plane. In order to determine the reflected and transmitted waves we treat contributions from different separately. The component of the reflected wave is straightforward. We obtain
| (14) |
where
| (15) |
For the component we need to reverse the signs of the and components of Eq. (11), leading to:
| (16) |
Similarly,
| (17) |
and
| (18) |
where and are the reflection coefficients corresponding to the and components of the reflected fields, respectively.
The corresponding transmitted fields , , and are obtained by the standard procedure. These have the same form as the incident wave with and replaced by and , respectively and are given by
| (19) |
| (20) |
where
| (21) |
| (22) |
i.e. the transmitted wave vector has a polar angle and azimuthal angle .
We point out that in the constant term, , in , the exponent is proportional to and not . The overall normalization of this term is contained in the reflection coefficients and which are fixed by the boundary conditions. The corresponding expressions for the transmited magnetic fields can be written as
| (23) |
and
| (24) |
We next impose the boundary conditions at the interface on each component in order to determine the reflection coefficients. The exponential factors lead to the standard conditions:
| (25) |
The continuity of the electric field components parallel to the surface imply that the and components are continuous, i.e.,
The perpendicular components follow:
The perpendicular components of the magnetic field are continuous at the interface and the parallel components satisfy
Here we shall assume . These conditions lead to:
| (26) |
| (27) |
Solving Eqs. 26 and 27 we obtain
| (28) |
and
| (29) |
We next impose boundary conditions on the components perpendicular to the plane of incidence. These lead to
and
These conditions imply
| (30) |
and
| (31) |
Solving Eqs. 30 and 31 we obtain:
| (32) |
and
| (33) |
Using the above reflection coefficients we can compute the and components of the reflected and
transmitted fields for each plane wave. Adding Eqs. 14 and 16, we find the total
reflected electric field for each plane wave.
Since we are interested only in
the perpendicular component, we consider only the -component of the
reflected field, obtained by integrating over the angles and , as
| (34) |
Similarly, we add Eqs. 19 and 20 to get the transmitted electric field for each plane wave. The final expression for the -component of transmitted electric field is given by
| (35) |
We compute the reflection coefficient numerically as a function of the specular angle by setting the altitude of both the source and observer to be 37 km, appropriate for HiCal-2 broadcasting to ANITA-4 at float altitude. For proper comparison we set the distance of propagation of the incident wave to be same as that of the reflected wave. The resulting value of the reflection coefficient is found to be same as that for Fresnel reflection independent of frequency.
4.2 Reflection and Transmission at a Spherical Surface
In this section we derive the reflection coefficient for a spherical interface between air and ice. The source is again assumed to be a dipole located at an altitude of . In a Cartesian coordinate system centered at , the transmitter coordinates are with (see Fig. 12). As in the case of a flat surface, we again decompose the spherical wave in terms of plane waves. In contrast to the case of a flat surface, the reflected wave corresponding to each incident plane wave will not be a plane wave. However since the curvature is small it may be reasonable to approximate it as a plane wave. This is justified by the observation, as discussed in more detail later, that the dominant contribution to the reflected wave arises from a small angular region near the specular point. For each plane wave corresponding to spherical polar angles , we identify a point on the spherical surface where the wave vector from the source intersects the surface (see Fig. 12 ). We next assume that the reflection and refraction occurs on the plane tangent to .
For each incident plane wave, we transform our coordinate system
such that the new axes () lie on the tangent plane and
the plane of reflection is same as the plane. We can now use our
planar reflection coefficients in this new coordinate system . First, we compute the electric and magnetic field components for each plane wave in this coordinate system.
As the primed coordinate system is not fixed, and depends on the point of reflection Q, we transform
back to the original frame and integrate over all plane
waves to get the total field.
For a given plane wave, let the point be located at
. We identify the tangent plane at this point
and choose the cordinate system
such that it satisfies the following conditions:
-
1.
The coordinates of in this new coordinate system are .
-
2.
The source point in the new coordinate system lies at .
-
3.
The unit vector normal to the tangent plane at is parallel to the axis.
This is accomplished by two rotations followed by a translation. We first rotate our coordinate system counter-clockwise about the axis by an angle . The rotation matrix corresponding to this is
| (36) |
Next we rotate counter-clockwise about the new -axis by an angle (). This leads to the rotation matrix
| (37) |
Now the overall rotation matrix is given by,
| (38) |
With these two rotations, we obtain the coordinate system which satisfies condition 3. given above and the tangent plane becomes parallel to the plane. We next apply a translation in the coordinate system given by:
| (39) |
This leads to the final coordinate system which
satisfies all the conditions given above and
has the origin located at .
The angle is the angle of reflection as shown
in Fig. 12.
For each incident plane wave we can now use the
formalism developed in section 4.1 for a flat surface.
We obtain the coordinates of the observation point P in the new
system by applying the Rotation above followed by a translation in the frame. The
observation point in the new coordinate system is given by:
| (40) |
We now find the incident, reflected and transmitted fields for the spherical geometry defined in Fig. 12. The exponent appearing in the expression for in Section 4.1 is now dependent on the geometry of reflecting surface, coordinates of point of observation and the dipole height in the new frame. The basis vectors in this new coordinate system are related to those in the old coordinate system by the formulae
| (41) |
We next write the incident wave vector in the new coordinate system as:
| (42) |
The reflected wave vector in the new frame is given by:
| (43) |
We write the corresponding transmitted wave vector as:
| (44) |
where and are, respectively, the polar and azimuthal angles of . The exponential factor for the incident plane wave is derived for spherical geometry using the same method as in the case of flat geometry. We express it as
| (45) |
where (0, 0, ) is the location of the dipole in the new frame and the point of observation is located at vector with respect to the new origin . The exponential factor for the reflected plane wave is obtained from geometry (Fig. 12) as
| (46) |
In the transformed frame we may again identify the location of the image as in the case of flat geometry [14]. Let the image be located at the position vector with respect to the origin of the original coordinate system. We then have
| (47) |
We obtain
| (48) |
and
| (49) |
where
| (50) |
and
| (51) |
This can be derived easily by using geometry. We see from Fig. 12 that the exponential factor can also be written as:
where
and
| (52) |
This provides an alternative way to derive the formula for the exponent appearing in and yields the same result as before. The exponential factor for the transmitted wave obtains from geometry (see Fig. 12), and can be expressed as
| (53) |
where is the constant term appearing in both and . As in the case of flat geometry, this term is proportional to k and not .
We next write the electric and magnetic field components in the new coordinate system:
| (54) |
| (55) |
and
| (56) |
Now we use the same method as in the case of flat geometry to find the and components of and (where again denotes the incident, reflected or transmitted wave) and use the boundary conditions at to find the reflection coefficients.
In order to calculate the s and p components of the electric and magnetic fields, we first need to find a unit vector which is perpendicular to both and . The resulting unit vector perpendicular to the plane of incidence is given by
| (57) |
Now we can write the incident electric field components as
| (58) |
Similarly the incident magnetic field components can be written as
| (59) |
The and components of the reflected electric field are obtained as
| (60) |
Similarly, for the reflected magnetic field components we write
| (61) |
| (62) |
where and are the reflection coefficients corresponding to the
and components of the reflected fields.
The corresponding transmitted fields , , and can be written as
| (63) |
Similarly the transmitted magnetic field components can be written as
| (64) |
We impose the boundary conditions at on each component in order to determine the reflection coefficients for reflection and transmission of a plane wave, using the same procedure described in section 4.1. The exponential factors lead to the standard conditions:
| (65) |
The continuity of electric field components parallel to the surface imply that
The components perpendicular to the surface follow:
The component of magnetic field to the surface are continuous at the interface and the parallel components satisfy
Here we shall assume . These conditions lead to:
| (66) |
| (67) |
Solving Eqs. 66 and 67 we obtain
| (68) |
and
| (69) |
We next impose boundary conditions on the components to the plane of incidence. These lead to
and
These conditions imply
| (70) |
and
| (71) |
Solving Eqs. 70 and 71 we obtain:
and
| (72) |
Using the above reflection coefficients we now write the reflected and transmitted electric field expressions for each plane wave by adding s and p components of and respectively as in Section 4.1,
| (73) |
We remind the reader that the new coordinate system is not fixed, rather it changes with the location Q on the spherical surface which, in turn, depends on the parameters of the plane wave. So we need to write our final expression in the fixed coordinate system . Using the inverse of the rotation matrix , we finally write the electric field expression in the original coordinate system as
Since we are interested only in the perpendicular component, we consider only the y-component of the electric field. For each plane wave we obtain the y-component of as
| (74) |
Similarly we write the y- component of as
| (75) |
We compute the y-component of the total reflected field by integrating Eq. 74 over . It is convenient to define . We divide the integral over into 3 regions: (i) , (ii) , (iii) . Region (i) gives the dominant contribution. The contribution from other two regions is found to be negligible.
[\FBwidth] \ffigbox[\FBwidth]
The result obtained for the amplitude ratio, choosing a surface index-of-refraction and frequency MHz, is shown in Fig. 14. The result for the flat surface is shown for comparison. This result is relatively insensitive to frequency and shows only a mild increase with the refractive index for small values of elevation angle. Since the ratio oscillates rapidly with elevation angle, we show only the maxima, minima and the average of these oscillations in Fig. 14. For comparison with data, we should use the mean value. In any case, as discussed below, once roughness corrections are included, the fluctuations disappear.
4.3 Roughness Correction
The roughness contribution is computed by using the model [15]
| (76) |
where and
| (77) |
We choose the parameters m, m and which are found to give reasonable agreement with data. We find the power reflectance ratio for a spherical rough surface. In this case we do not observe any oscillations and the power ratio varies smoothly with elevation angle. We find that the contribution is obtained dominantly from a small region close to the specular point (this is true in the zero roughness case, as well) and hence we can confine the integration to this region. We see this explicitly in Fig. 14 which shows the integral as a function of the upper limit on the azimuthal angle . The same is found for the case of angle where the dominant contributions arise from a small region around . The oscillations seen in Fig. 14 arise due to the change in path lengths as we integrate over angle across the different fresnel zones.
As discussed below, our numerical result for a spherical rough surface deviates from HiCal2 data for small elevation angle. The deviation from the data can be attributed to our assumption that for each incident plane wave, the corresponding reflected wave is also a plane wave. A more general treatment is under development that does not rely on this assumption. Here we also use an alternate formalism in which the curvature correction is incorporated as a geometric factor.
4.4 Alternative treatment for calculating power reflectance for a spherical surface
We can also incorporate the effects due to curvature of Earth by using the divergence factor [16] given by,
| (78) |
where is the reflection angle (with respect to the tangent at the point of reflection).
radius of Earth
arc length along the surface of Earth between the source and observation point () as given in Fig. 12.
distance between the specular point and the observation point.
distance between the source and the specular point.
We compute the flat surface amplitude reflectance including the roughness correction given in 4.3. This result is then multiplied by the divergence factor . The square of this result gives the final power reflectance. As discussed below, this treatment gives better agreement with HiCal2 data for all elevation angles.
5 Experimental Results
To determine the reflectivity from the interferometric maps formed from ANITA event triggers, we follow three, parallel strategies, and interpret the scatter between the three results as a measure of the inherent systematic errors. In each case, we initially select event pairs with trigger times consistent with the time separation expected for (Reflected,Direct) (designated as “(R,D)”) pairs, and geometrically consistent with the known sky location of HiCal to within 3 degrees in azimuth and also within 3 degrees in elevation, either above the horizon (direct events) or below the horizon (reflected events). The directional ANITA interferometric source reconstruction relies on excellent channel-to-channel timing resolution (100 ps) to find the pixel in the sky interferometric map most consistent with the measured relative arrival times for received signals. From high Signal-to-Noise Ratio (SNR) data taken while a ground pulser was transmitting from the Antarctic West Antarctic Ice Station (WAIS), the typical resolution in azimuth and elevation is determined to be of order and .
Once the candidate sample has been chosen by pointing and timing, we evaluate the reflectivity as follows:
-
1.
determined from coherently-summed, de-dispersed waveforms:
For the sample of both R and D events, we form the coherently-summed waveform (i.e., the summed waveform of those channels used to form the interferometric map, after shifting each waveform by the time delay expected for that sky pixel found to give the maximum total cross-correlation), after deconvolving the system response. The coherently-summed, deconvolved waveform is now Fourier transformed into the frequency domain, and the D, or R power calculated in each bin of incidence angle, summing over the “good” 200–650 MHz system bandwidth for ANITA-4.
-
2.
determined from raw waveforms – here, we follow the same procedure as used for the HiCal-1 analysis, namely:
Identify the ANITA-4 antennas pointing to within 45 degrees of the HiCal payload, then calculate the noise-subtracted HPol power in each antenna (summing the squares of the voltages, and using the first 64 samples in the captured waveform, prior to the onset of the received signal to measure noise) separately for R vs. D.
-
3.
calculated from the slope of R vs. D: To ensure that our calculated ratio is insensitive to either trigger threshold biases for low-amplitude reflected events, or saturation effects for high-amplitude direct events, we plot the square of the peak of the maximum Hilbert transformed voltage for R vs. D, and fit the slope of this graph over the central interval to the form , constraining the fit to pass through the point (0,0). Owing to the rotation of the transmitter payload, even in the case of perfect resolution, the signal strength will vary from event-to-event.
5.1 Corrections
Corrections must be applied to the ‘raw’ values of given by the above prescriptions, as follows.
5.1.1 Receiver Cant Angle Correction
The ANITA-4 receiver antennas are canted at 10 degrees below the horizontal to favor reception of upcoming signals resulting from in-ice neutrino interactions. This results in a calculable correction, as a function of incidence angle, for D vs. R events, assuming a beam-width =26 degrees for the ANITA Seavey Quad-Ridge receiver horn antennas.
5.1.2 Pathlength correction
There is a straightforward correction due to the 1/r diminution of the electric field strength with distance from the source, corresponding to diminution in power, which is different for R vs. D. This correction can be as large as 25% at separation distances smaller than 150 km.
5.1.3 Azimuthal correction
Since the beam pattern of the bicone transmitter roughly follows , with the angle between the signal emission direction and the transmitter antenna axis, the gain when antenna boresight is rotated by a given azimuthal angle relative to ANITA is different for the D vs. R signals – in the limit where boresight points perpendicular to ANITA (i.e., ANITA lies along the antenna axis), e.g., the D gain for HPol signals should be zero, whereas the R HPol gain is non-zero, since the R signal is emitted at some separation-dependent angle below the horizontal plane (Fig. 15). In such a case, the D signal is (in principle) pure VPol.
5.2 Cross-checks
5.2.1 Check of signal polarization
We have conducted several cross-checks of our observed signals. The most direct cross-check of true reflected signals vs. direct signals is the expected radian phase change upon reflection, in the case where the reflecting surface has a higher index-of-refraction than the medium from which the initial signal is incident – this is true of both HPol, as well as VPol electromagnetic waves. To test this, we compare the correlation coefficient when we cross-correlate the observed putative reflected signal with the direct signal, vs. an ‘inverted’ (in this case, by taking the negative of the actual recorded waveform voltages) reflected signal cross-correlated with the direct signal. As with HiCal-1, we find that cross-correlation favors the inverted, rather than non-inverted signals.
[\FBwidth]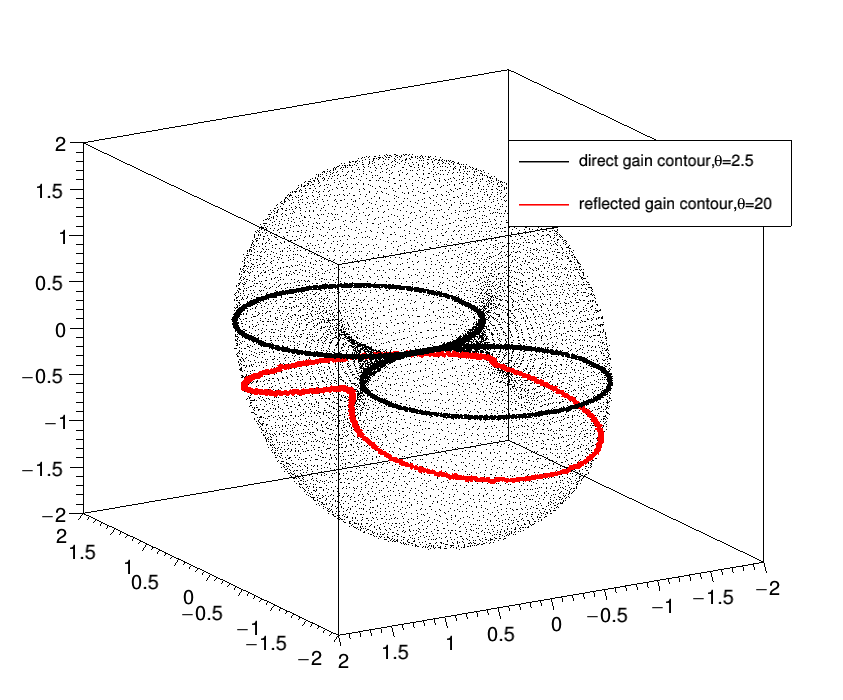
5.2.2 Possibility of ‘ripple’ signals
Owing to imperfect impedance mismatch over the full frequency band of the bicone antenna, the large, multi-kV piezo-electric signal induced across the antenna feedpoint can result in ‘ringing’ that persists considerably longer than the 110 ns timescale of a typical ANITA-4 event capture. Additionally, the oscillatory relaxation of the piezo can result in after-pulses, separated by several hundred ns. Since the ANITA-4 buffer depth allows only a maximum of four waveforms stored in memory at a given time, this raises the possibility of registering an initial direct event, followed by successive direct ‘echoes’ over the next few microseconds, and thereby initiating a full system clear and reset. The timescale for the reset (10 ms) suppresses the registration of the reflected signal by ANITA.
For HiCal-1b, such an effect was searched for using the sample of 100 (D,R) pairs by considering the angular difference between a putative D event and the previous event trigger, with no such obvious effects observed. To investigate this for HiCal-2b vs. HiCal-2a, we plot the time between successive triggers for a) cases where the HiCal piezo was active, and for which there is a candidate D event identified by pointing, vs. b) cases where the HiCal piezo was active, but there is no evident HiCal D event. As shown in Figures 17 and 17, restricting consideration to values smaller than the minimum possible R-D time difference, we observe a considerable excess of evident “echoes”, relative to background, for HiCal-2b compared to HiCal-2a, consistent with secondary pulses observed from the HiCal-2b piezo pre-flight, and clustering around a period of 600–700 ns. We attribute the bulk of the observed unpaired D-events to this effect, with the remainder due to cases where the D-event fills the fourth available buffer, initiating a reset prior to registration of the corresponding R-event. Fortunately, these events can be readily suppressed in software by requiring that a) the time difference, measured at the ANITA-4 payload, between the recorded R event and the putative D predecessor be consistent with expectation, knowing the elevation of HiCal-2b and ANITA-4 and the separation distance, and b) explicitly suppressing events pointing directly at HiCal-2b, for which the previous event also points directly at HiCal-2b.
[\FBwidth]
[\FBwidth]
5.2.3 Check of ANITA-4 pointing resolution
If we require that the observed time difference between an ANITA-4 trigger and a HiCal-2 event be consistent with the calculated signal transit time between ANITA and HiCal, we can then measure the angular pointing resolution of the ANITA-4 gondola relative to the HiCal biconical transmitter source, as shown in Figure 19, indicating a resolution (FWHM) better than one degree, slightly worse than the resolution obtained from ground pulser data. Note that this includes both direct, as well as reflected events, both of which evidently follow a Gaussian distribution with relatively little indication of non-Gaussian tails.
5.2.4 Check of transmitter antenna beam pattern
Our bicone transmitter antenna is expected to follow a signal amplitude distribution, measured relative to the antenna axis. This corresponds to a signal power distribution, as derived from the interferometric map, which itself is computed as the summed product of signal amplitudes. As shown in Figure 19, we observe generally adequate match to expectation. We note that the phase of the overlaid fit has been, in this case, fixed, so there are no free parameters in the fit.
[\FBwidth]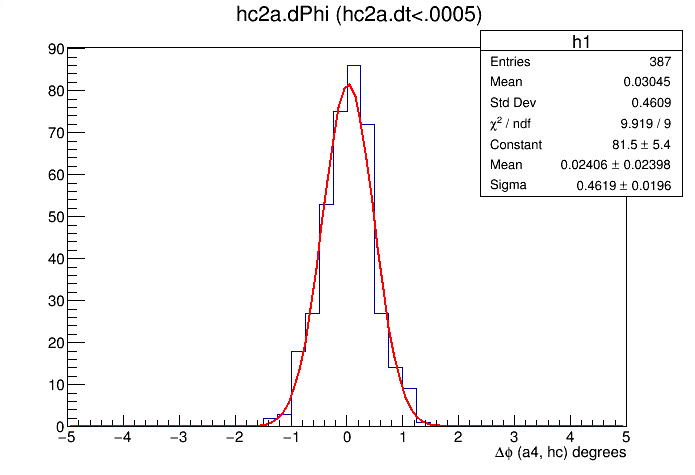
[\FBwidth]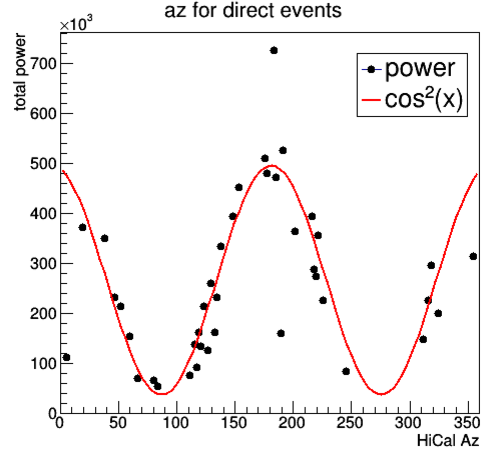
5.2.5 Trigger Threshold Considerations
The last of our three signal extraction techniques is intended to safeguard against possible trigger threshold effects, since at low signal amplitudes, there may be a possible bias which preferentially selects D/R pairs for which the D power is just above the trigger threshold, but suppresses D/R pairs for which the R power falls just below the trigger thresold. In the previous analysis, this effect was studied using the observed D and R events, and verifying that both distributions were well-separated from the trigger threshold, as defined by the power distribution for thermal triggers. It was additionally tested by verifying that the ratio of R signal to D signal power was linear for all measured pairs.
With HiCal-2, there are sufficient statistics to study this in greater detail and compare the power distribution for R/D paired events, as well as D events which are unpaired. For cases where ANITA-4 is off-boresight, or the separation distance between ANITA-4 and HiCal-2 large, the D signal will be correspodingly reduced, and the R signal may be sub trigger-threshold, resulting in an artificially ‘inflated’ measurement. The paired R signal, however, on which our measurement is based, is found to be well-separated from thermal triggers (Fig. 21). As an additional check, we compare the paired R distribution with ground calibration data taken using a transmitter pulser at the West Antarctic Ice Sheet (WAIS) station (Figure 21), again indicating signal strengths well-separated from threshold.
[\FBwidth] \ffigbox[\FBwidth]
As a final check, we show the plot of reflected power vs. direct power, for the angular interval showing the greatest discrepancy between measurement and calculation (5–10 degrees incidence with respect to the surface) in Figure 23. We observe saturation at the highest values of Direct power, although we do not observe an obvious deviation from linearity close to the origin. The lack of similar saturation at high values of Reflected power is due, at least in part, to the buffer depth limitations mentioned previously.
5.3 Further Probes of Reflectivity
[\FBwidth]
[\FBwidth]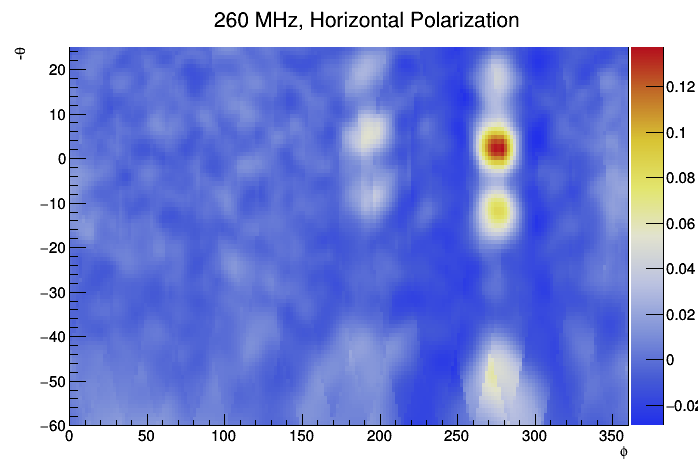
Thus far, surface reflectivity has been probed using the two HiCal missions and also using continuous solar emissions as the RF source. The ratio of direct signal power in HPol to VPol in the two cases is approximately 10:1 and 1:1, respectively. The former comprises a triggerable, ns signal, while the latter is (obviously) constant and immune to trigger threshold effects. At the time ANITA-3 flew, one of the most pernicious backgrounds was that due to US military satellites, broadcasting at both 260 MHz and 370 MHz, with an SNR comparable to HiCal. Introduction of adaptive frequency filtering in ANITA-4 (“TUnable Frequency Filtering”, or “TUFF”[17]) successfully suppressed this background; nevertheless, the narrow band nature of these satellites offers the possiblity of determining the surface reflectivity at a single, fixed frequency value. As shown in Fig. 23, we can clearly see both the direct and reflected signals due to these satellites; the inferred values of HPol reflection coefficient are: a) 0.520.17 for 260 MHz () and b) 0.350.15 for 370 MHz (). These values are preliminary-only and are presented, at this stage, only as a semi-quantitative cross-check of the HiCal-2 results presented herein.
5.4 Results Summary
Our reflectivity results are summarized in 24. We note generally good agreement between the HiCal-2a and HiCal-2b flights and reasonable agreement with the results, at highly oblique incidence angles, obtained with the HiCal-1b mission. We also note that, the distinct difference in the nature of the emission (pulsed vs. continuous) notwithstanding, the HiCal-2 results also follow the general trend traced by measurements of the Solar RF signals (both direct, and reflected), as obtained with both the ANITA-2 and also ANITA-3 experiments. The black dashed line shown in the Figure corresponds to our flat-surface calculation including a roughness correction with the curvature contribution[16] included with a multiplicative divergence factor discussed in section 4.4. The roughness parameters used in this calculation are m, , m, and the frequency has been set equal to 240 MHz. The cyan curve uses the spherical-surface calculation described in section 4.2 including the same roughness correction. In this calculation, we average over the frequency range 200 to 650 MHz and the roughness parameters used are m, , m which have been chosen to provide reasonable agreement with data for elevation angles larger than 10 degrees. Although in agreement with data over the bulk of the relevant angular regime, at small elevation angles, our own spherical surface calculation, modulo roughness, still underestimates the reflected signal power relative to data.
[\FBwidth]
We note at least one physical difference between the reflector modeled for the purposes of calculation, and the actual physical reflector – namely, the reflecting boundary layer is not uniform; HiCal signals penetrating up to 2 wavelengths into the snow will contribute to the final, observed triggered events. This corresponding 2–3 meter depth of snow also includes seasonal ‘crusts’ with a local dielectric contrast of order 0.001, which will act as discrete reflecting layers. A full Huygens-wavelet inspired simulation of these effects is currently underway.
6 Outlook and Summary
Data accumulated with the HiCal-1 and HiCal-2 missions has allowed a fairly comprehensive mapping of the HPol Antarctic surface reflectivity, over the range of incidence angles relevant to radio-based UHECR measurements. Of greater relevance to neutrino detection, however, is the vertical polarization surface transmissivity, which can be inferred as the complement to surface reflectivity. Five obvious goals for a future HiCal-3 mission are as follows: a) equip the payload with an ADC capable of measuring HPol signal returns at normal incidence from the surface and provide reflectivity data independent of ANITA-5, b) include solar power provision to extend the lifetime of the measurements, and also offer the possibility of surface reflectivity measurements over sea water, c) tie the transmitter signal to the GPS second using a triggerable pulser design based on a fast DCDC step-up conversion, d) inclusion of VPol data collection capabilities, and e) attitude (i.e., polar angle) orientation monitoring. These goals could be met either through two dedicated missions (as with HiCal-2), or by flying a larger payload-capacity balloon. The timescale of the ANITA-5 flight (December, 2020) should allow ample time for the HiCal-3 hardware development.
7 Acknowledgments
We thank NASA for their generous support of ANITA and HiCal, and the National Science Foundation for their Antarctic operations support. specifics required for the HiCal launches relative to ANITA. This work was also supported by the US Dept. of Energy, High Energy Physics Division, as well as NRNU, MEPhI and the Megagrant 2013 program of Russia, via agreement 14.А12.31.0006 from 24.06.2013. We are enormously indebted to the Columbia Scientific Balloon Facility for their excellent support, at all stages of this effort. Given the specific requirements for the HiCal launch, particular recognition is due Hugo Franco, Dave Gregory and the entire McMurdo CSBF logistical staff.
References
- [1] PW Gorham, P Allison, O Banerjee, JJ Beatty, K Belov, DZ Besson, WR Binns, V Bugaev, P Cao, C Chen, et al. Antarctic surface reflectivity measurements from the anita-3 and hical-1 experiments. Journal of Astronomical Instrumentation, page 1740002, 2017.
- [2] DZ Besson, J Stockham, M Sullivan, P Allison, JJ Beatty, K Belov, WR Binns, C Chen, P Chen, JM Clem, et al. Antarctic radio frequency albedo and implications for cosmic ray reconstruction. Radio Science, 50(1):1–17, 2015.
- [3] PW Gorham, P Allison, BM Baughman, JJ Beatty, K Belov, DZ Besson, S Bevan, WR Binns, C Chen, P Chen, et al. Observational constraints on the ultrahigh energy cosmic neutrino flux from the second flight of the anita experiment. Physical Review D, 82(2):022004, 2010.
- [4] P. W. Gorham, P. Allison, S W. Barwick, and et al. The Antarctic Impulsive Transient Antenna ultra-high energy neutrino detector: Design, performance, and sensitivity for the 2006-2007 balloon flight. Astropart. Phys., 32(1):10 – 41, 2009.
- [5] P. W. Gorham et al. Characteristics of Four Upward-pointing Cosmic-ray-like Events Observed with ANITA. Phys. Rev. Lett., 117(7):071101, 2016.
- [6] P. W. Gorham et al. Observational Constraints on the Ultra-high Energy Cosmic Neutrino Flux from the Second Flight of the ANITA Experiment. Phys. Rev., D82:022004, 2010. [Erratum: Phys. Rev.D85,049901(2012)].
- [7] S. Hoover et al. Observation of Ultra-high-energy Cosmic Rays with the ANITA Balloon-borne Radio Interferometer. Phys. Rev. Lett., 105:151101, 2010.
- [8] G. Askaryan. Excess negative charge of an electron-photon shower and its coherent radio emission. Soviet Physics JETP, 14:441–443, 1962.
- [9] G. A. Askaryan. Excess negative charge of electron-photon shower and the coherent radiation originating from it. radiorecording of showers under the ground and on the moon. J. Phys. Soc. Japan, Vol. 17, Suppl. A-III:257, 1962.
- [10] G. A. Askaryan. Coherent radio emission from cosmic showers in air and in dense media. Soviet Phys. JETP, 21:658, 1965.
- [11] H. Schoorlemmer, K. Belov, A. Romero-Wolf, D. García-Fernández, V. Bugaev, S. A. Wissel, P. Allison, J. Alvarez-Muñiz, S. W. Barwick, J. J. Beatty, D. Z. Besson, W. R. Binns, W. R. Carvalho Jr., C. Chen, P. Chen, J. M. Clem, A. Connolly, P. F. Dowkontt, M. A. DuVernois, R. C. Field, D. Goldstein, P. W. Gorham, C. Hast, C. L. Heber, T. Huege, S. Hoover, M. H. Israel, A. Javaid, J. Kowalski, J. Lam, J. G. Learned, K. M. Liewer, J. T. Link, E. Lusczek, S. Matsuno, B. C. Mercurio, C. Miki, P. Miočinović, K. Mulrey, J. Nam, C. J. Naudet, J. Ng, R. J. Nichol, K. Palladino, B. F. Rauch, J. Roberts, K. Reil, B. Rotter, M. Rosen, L. Ruckman, D. Saltzberg, D. Seckel, D. Urdaneta, G. S. Varner, A. G. Vieregg, D. Walz, F. Wu, E. Zas. Energy and Flux Measurements of Ultra-High Energy Cosmic Rays Observed During the First ANITA Flight. Astropart. Phys., 77:32–43, 2016.
- [12] PW Gorham, P Allison, O Banerjee, L Batten, JJ Beatty, K Belov, DZ Besson, WR Binns, V Bugaev, P Cao, et al. The hical 2 instrument: Calibration and antarctic surface reflectivity measurement for the anita experiment. arXiv preprint arXiv:1710.11175, 2017.
- [13] S.H. Wang et al. Calibration, Performance, and Cosmic Ray Detection of ARIANNA-HCR Prototype Station. In Proceedings of the 35th ICRC, Busan, Korea, volume 1, pages 1–8, 2017.
- [14] Julius Adams Stratton. Electromagnetic theory. John Wiley & Sons, 2007.
- [15] Andrew Romero-Wolf, Steve Vance, Frank Maiwald, Essam Heggy, Paul Ries, and Kurt Liewer. A passive probe for subsurface oceans and liquid water in jupiter’s icy moons. Icarus, 248:463–477, 2015.
- [16] Constantine A Balanis. Antenna theory analysis and design. International Journal of Aerospace Engineering Hindawi Publishing Corporation http://www. hindawi. com, 2010, 1997.
- [17] P Allison, O Banerjee, JJ Beatty, A Connolly, C Deaconu, J Gordon, PW Gorham, M Kovacevich, C Miki, E Oberla, et al. Dynamic tunable notch filters for the antarctic impulsive transient antenna (anita). arXiv preprint arXiv:1709.04536, 2017.