Pseudogap and electronic structure of electron-doped
Abstract
We present a theoretical investigation of the effects of correlations on the electronic structure of the Mott insulator upon electron doping. A rapid collapse of the Mott gap upon doping is found, and the electronic structure displays a strong momentum-space differentiation at low doping level: The Fermi surface consists of pockets centered around , while a pseudogap opens near . Its physical origin is shown to be related to short-range spin correlations. The pseudogap closes upon increasing doping, but a differentiated regime characterized by a modulation of the spectral intensity along the Fermi surface persists to higher doping levels. These results, obtained within the cellular dynamical mean-field theory framework, are discussed in comparison to recent photoemission experiments and an overall good agreement is found.
I Introduction
Understanding the physical mechanism responsible for the pseudogap in cuprate superconductors, and its interplay with superconductivity, is still a central and very debated question in the field of strongly-correlated materials. In this respect, the iridate is a very interesting playground as it closely resembles these materials. It is indeed isostructural to , Randall et al. (1957) and its low-energy electronic structure is well described by a single half-filled band because of strong spin-orbit (SO) coupling as shown by electronic structure calculations in the Local Density Approximation (LDA). Kim et al. (2008); Martins et al. (2011) Angular Resolved PhotoEmission Spectroscopy (ARPES), optical spectroscopy, and resonant inelastic X-ray scattering experiments Kim et al. (2008, 2012); de la Torre et al. (2015); Brouet et al. (2015); Terashima et al. (2017) as well as scanning tunneling microscopy Nichols et al. (2014) demonstrate that the ground-state of this material is a Mott insulator. This conclusion is also supported by electronic structure calculations taking into account electronic correlations. Martins et al. (2011); Zhang et al. (2013) The similarity between the low-energy electronic structure of and that of cuprates has led to the quest for superconductivity upon doping in this material. Watanabe et al. (2013); Yang et al. (2014); Kim et al. (2015); Yan et al. (2015)
The electronic configuration of the ions is and crystallizes in the tetragonal structure, as or . Randall et al. (1957) The octahedra are rotated about the -axis by deg., generating a doubled unit cell. Crawford et al. (1994) The electronic configuration would naively lead to a metallic state in a band theory approach. , having an identical atomic arrangement with nearly the same lattice constants and bond angles, is indeed found to be a Fermi liquid metal. Vogt and Buttrey (1996) however has a very strong SO coupling, a property which was shown to modify the electronic structure near the Fermi level in systems. Singh et al. (2002); Rossnagel and Smith (2006); Xiang and Whangbo (2007); Martins et al. (2011); Zhang et al. (2013) This compound then effectively reduces to a half-filled single band near the Fermi surface, a configuration which makes it prone to the opening of a Mott gap as a result of repulsive interactions.
As the non-interacting Fermi surface of this material is electron-like, the hole-doped regime of high-Tc cuprates is to be compared with the electron-doped one of . Several experimental groups performed ARPES measurements on to investigate the doped compound further. Kim et al. (2014); de la Torre et al. (2015); Brouet et al. (2015); Terashima et al. (2017) Spectral intensity at the Fermi surface exhibits a strong momentum differentiation leading to the appearance of pockets in the ‘nodal’ region located around , de la Torre et al. (2015); Kim et al. (2014) while the ARPES spectra in the ‘antinodal’ region around are suggestive of a pseudogap. (de la Torre et al., 2015) Note that the ‘nodal/antinodal’ terminology is inherited from the cuprate context and does not refer to the nodes of a superconducting gap - up to now no unambiguous evidence of superconductivity has been established.
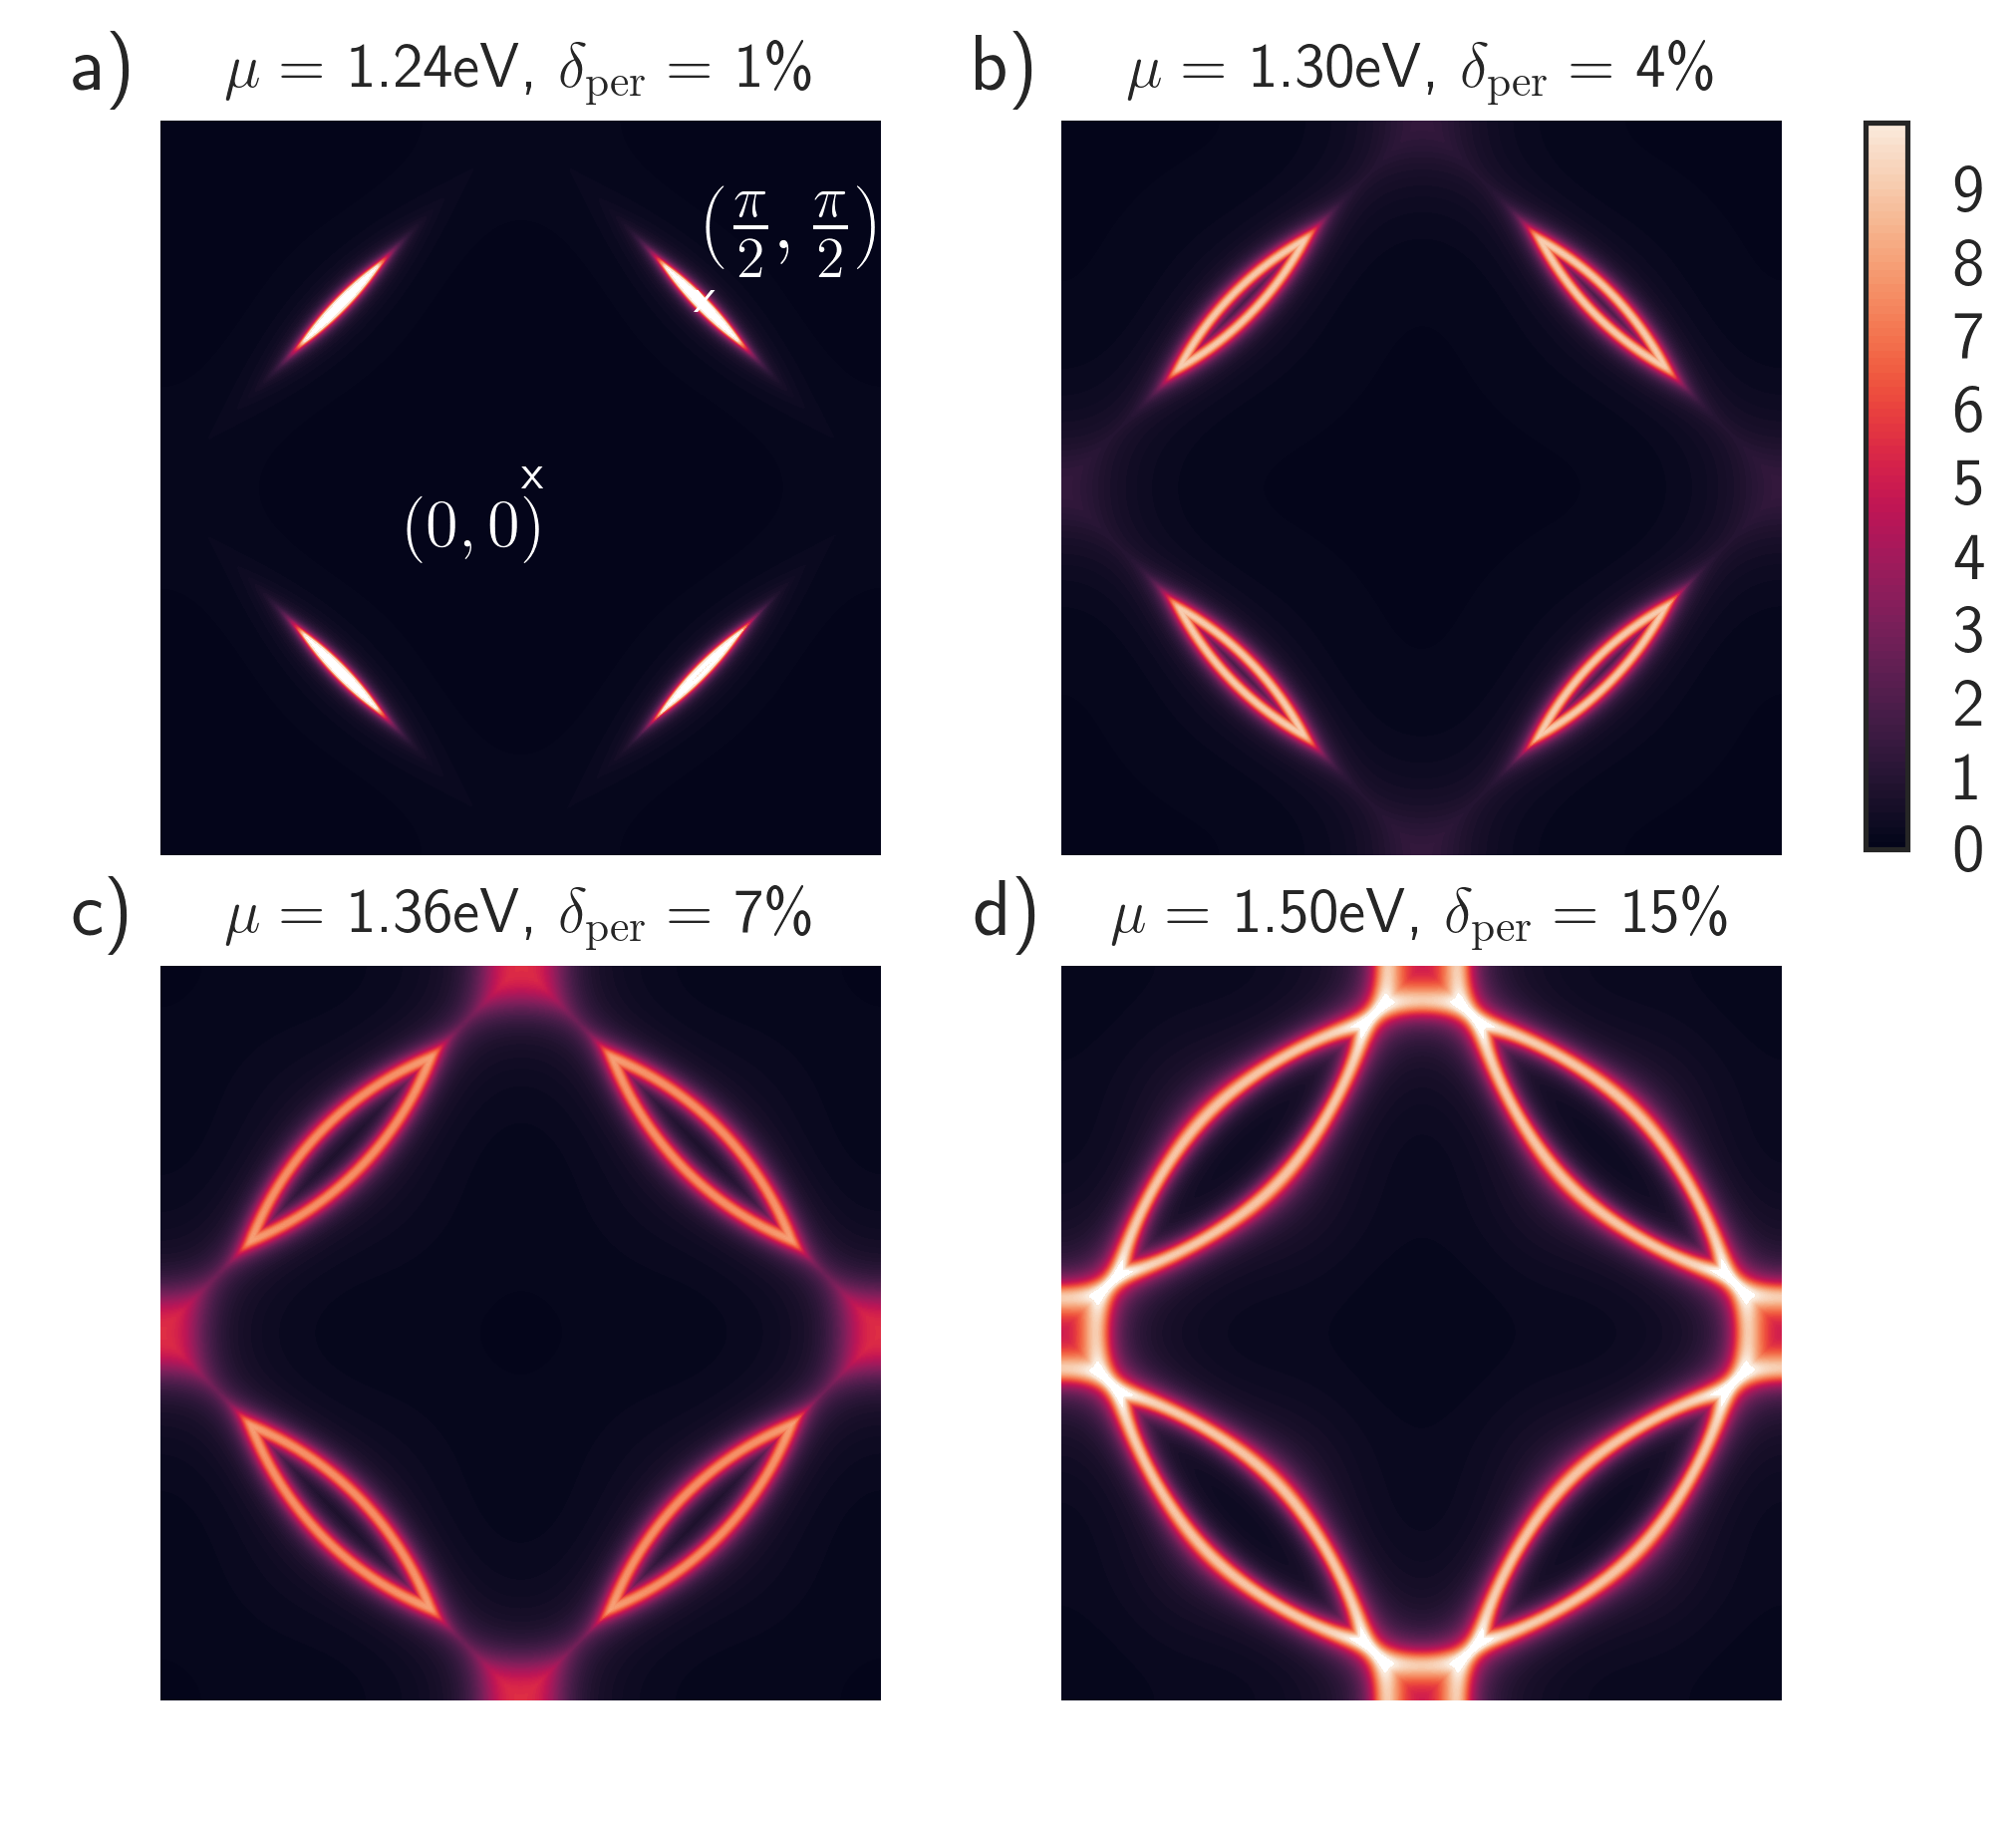
In this article, we construct a theoretical model of the low-energy electronic structure of doped , treating electronic correlation effects in the framework of cellular dynamical mean-field theory (CDMFT). Kotliar et al. (2001); Georges et al. (1996) The Fermi surface spectral intensity maps displayed in Fig. 1 summarize key aspects of our results. Four successive doping regimes are found: The Mott insulating state (not displayed in Fig. 1) evolves into a metal with strong nodal-antinodal differentiation at low doping level. In this regime, the Fermi surface consists in pockets around (a-b), while the antinodal region displays a pseudogap, as shown below. Increasing doping further, spectral intensity appears near the antinodes with still a pronounced differentiation (c). A full Fermi surface, close to the uniform non-interacting one, is recovered at higher doping (d).
A previous theoretical study Hampel et al. (2015) addressed the issue of nodal-antinodal differentiation in this material, but the opening of the antinodal pseudogap and the associated spectral signatures could not be discussed due to the limitations of the slave-boson method used in that work.
This article is organized as follows. In Sec. II, we briefly summarize the tight-binding (TB) model of the electronic structure established in previous works and derive an effective model for the states. In Sec. III, we introduce correlations in this model and explain how to deal with these within the CDMFT scheme. We discuss results of such CDMFT calculations in Sec. IV and particularly the emergence of the four doping regimes sketched above. In order to restore translational symmetry which is broken in CDMFT, we introduce a periodization scheme for the self-energy in Sec. V. This allows for a calculation of the spectral intensities, which are found to be in good agreement with the existing ARPES measurements. We also discuss the spectral signatures of the antinodal pseudogap. In Sec. VI, we compute and discuss the the quasiparticle band structure. Sec. VII is devoted to a discussion and concluding remarks.
II Tight-binding model
In this section, we describe the electronic band structure of , derive an effective model for the states, and emphasize that the low-energy states can be described by a single band tight-binding model defined on a periodic lattice with a single atom per unit cell.
Our starting point is the tight-binding (TB) model introduced in Refs. Jin et al., 2009; Carter et al., 2013 describing bands in the presence of a spin-orbit coupling. Because of the rotation of the octahedra around the -axis, the unit cell is composed of two inequivalent sites and . The tight-binding Hamiltonian is then written as
| (1) |
where the momentum sum is over the reduced Brillouin zone and the components of are the electron annihilation operators for all 12 orbitals in the unit cell . It is convenient to order the basis according to followed by their time-reversed partners . There is no coupling between these two blocks as the system is time-reversal invariant and we can thus only consider the first half of the basis, taking into account that all bands are two-fold degenerate. The remaining tight-binding matrix writes
| (2) |
where describes the hopping part of the Hamiltonian
| (3) |
with , and . Here is expressed in terms of the reciprocal vectors forming the reduced Brillouin zone. describes the on-site part of the Hamiltonian. It includes the spin-orbit coupling and reads
| (4) |
where is an on-site energy difference of the orbital relative to and , and is the spin-orbit coupling parameter. The additional term accounts for the hybridization between and . Jin et al. (2009) In the following we consider eV, eV, eV and eV. It has been shown that these values yield a band structure in good agreement with LDA+SO calculations. Jin et al. (2009); de la Torre et al. (2015)
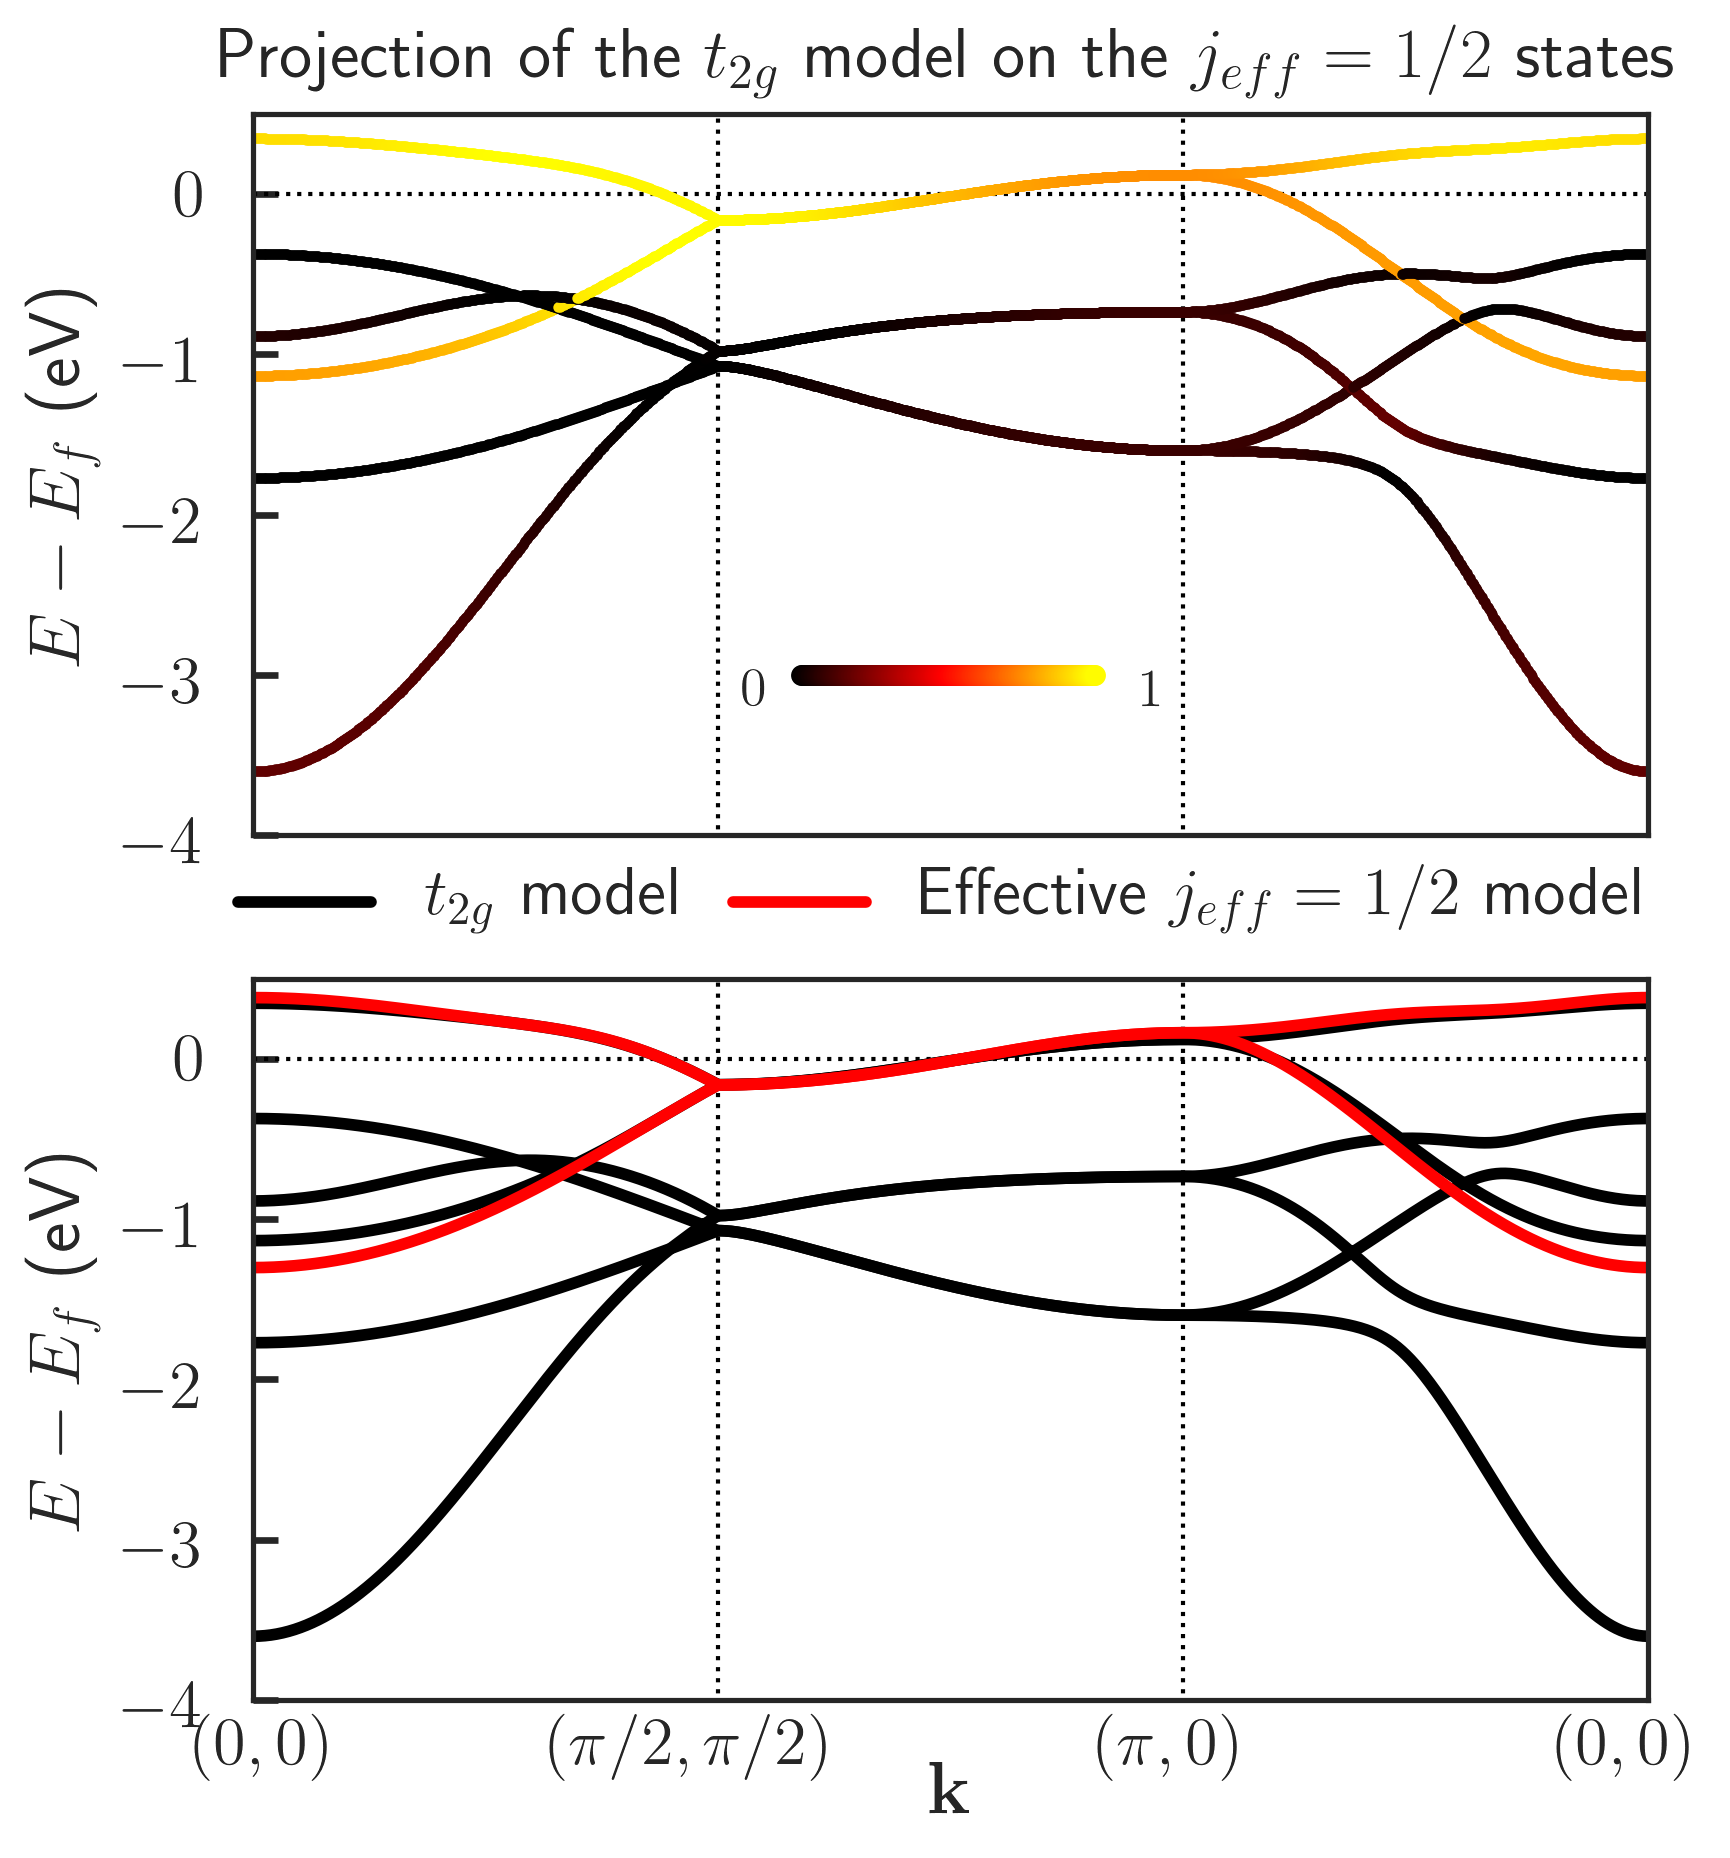
We plot in Fig. 2 (upper panel) the six bands resulting from the diagonalization of along the path of the full Brillouin zone. When the eigenvalues are projected on the states
| (5) |
it can be seen that the low-energy bands essentially have character, as highlighted in Refs Kim et al., 2008; Jin et al., 2009; Carter et al., 2013; de la Torre et al., 2015. It is therefore natural to look for an effective reduced Hamiltonian describing these states.
To do so, we rewrite in the basis (, , , , , , ):
| (6) |
where the exact expressions of , and are given in Appendix A. An effective Hamiltonian is then obtained by projecting onto the subspace:
| (7) |
where is the unit matrix and an energy scale that is adjusted in order to best match the original band structure.
While it is difficult to have a compact expression for this reduced Hamiltonian, one can easily diagonalize numerically for every point of interest. This is shown (red lines) in Fig. 2 (lower panel) together with the complete band structure (black lines). The effective model appears to be in excellent agreement with the two low-energy bands exhibiting a character.

As mentioned earlier, the crystal has a two-atom unit cell and we expressed the tight-binding models above in the reduced Brillouin zone in order to make contact with experiments. Let us however emphasize that all sites are actually equivalent from a purely electronic point of view in these models. An inspection of the band structure in the reduced Brillouin zone indeed reveals that it results from the folding of half as many bands defined over the full Brillouin zone. This can be seen e.g. from the degeneracy of the bands along the - path of the full Brillouin zone. As a result, the effective model in Eq. (7) can be written as a simple tight-binding model on a square lattice
| (8) |
where the hopping amplitudes are shown as a function of the distance in Fig. 3 (upper panel). We see that one obtains a good approximation of the band structure by only keeping the nearest and next-nearest neighbor hopping terms (for an almost perfect agreement it is necessary to keep 8 hopping parameters). This yields the simple energy dispersion
| (9) |
where eV, eV, eV and is now expressed in the basis of the full Brillouin zone. The folding of this band in the reduced Brillouin zone is shown together with the effective band structure previously derived in Fig. 3 (lower panel). Let us mention that a similar tight-binding model was derived in Ref. Watanabe et al., 2010 with the difference that the admixture was not included in their work.
In the following we use the effective Hamiltonian to describe the low-energy excitations of the system.
III Introducing correlations
We model the effect of electronic correlations in with a Hubbard Hamiltonian that introduces an energy cost for having two electrons on the same Ir atom
| (10) |
where is the occupation number on the orbital of the Ir atom in the unit cell . In the following we use eV Jin et al. (2009); de la Torre et al. (2015) and temperature eV K. This model is studied using cellular dynamical mean-field theory Kotliar et al. (2001); Georges et al. (1996): The original lattice Hamiltonian (10) is mapped on a two-site auxiliary cluster model embedded in a self-consistent medium. The self-energy of the cluster model is used to construct an approximation of the lattice self-energy where only intra unit cell components are non-vanishing, i.e. . Note that the orbitals at sites and are electronically equivalent and therefore and . We then have the following expression for the lattice Green’s function
| (11) |
where is defined in the reduced Brillouin zone and both and are matrices associated with the two Ir atoms in the unit cell. The CDMFT self-consistency imposes that the cluster Green’s function be the same as the unit cell Green’s function of the lattice:
| (12) |
We use a continuous-time quantum Monte Carlo (CT-HYB) Seth et al. (2016); Werner et al. (2006); Werner and Millis (2006); Gull et al. (2011) impurity solver to find the solution of the two-site cluster model and the self-consistent equation (12) is solved iteratively. Georges et al. (1996) More details are given in Appendix C. Codes necessary for the numerical calculations were developed using the TRIQS Parcollet et al. (2015) library.
IV The four doping regimes
We first investigate the cluster quantities and obtained by solving the CDMFT equations. These quantities can be expressed in the basis of the orbitals on sites and . However, because and are electronically equivalent, it is convenient to work in the basis of even and odd combinations of the orbitals, defined by
| (13) |
In this basis, both and are diagonal (see Appendix C)
| (14) |
As we will discuss later, and have a direct physical interpretation. The physics close to the node is indeed essentially controlled by and while the physics at the antinode is controlled by and . The reason for this, anticipating on Sec. VI and Fig. 10, is that the nodal Fermi-surface pocket at is associated with the upper band (which has an antibonding/odd character) while the nodal states are associated with the lower bonding band with even character. The analysis of these quantities will reveal the existence of four distinct regimes upon doping: a Mott insulator phase, a pseudogap regime, a differentiation region and finally a uniform Fermi liquid state.

The electronic density is shown as a function of the chemical potential in Fig. 4 (blue curve). It displays a clear plateau at for between eV and eV, confirming that the system is a Mott insulator at half-filling. Kim et al. (2008); Martins et al. (2011); Zhang et al. (2013) The width of the plateau eV is consistent with the recent experiment of Ref. Brouet et al., 2015.


In Fig. 5 and 6 are displayed the spectral intensities at the Fermi level as well as the zero-frequency self-energies as a function of the chemical potential . These quantities are obtained by extrapolating to zero Matsubara frequencies results obtained by Monte Carlo:
| (15) | ||||
| (16) |
For completeness, we have included plots of the Matsubara frequency Green’s functions and self-energies for several chemical potentials in Appendix B.
These results allow to identify four distinct doping regimes. For chemical potentials smaller than eV, the system is in a Mott insulating regime and both the even () and odd () components of the spectral intensity at the Fermi level are zero, (also both Matsubara Green’s functions have clear insulating character, see Appendix B). This is compatible with the location of the Mott plateau in Fig. 4. Correlation effects are especially visible in the very different values of the real parts of the self-energies while both imaginary parts vanish. As a result, the effective low-energy band structure is split by the real parts of the self-energy in Eq. (12) and no excitations exist at . More precisely, the quasiparticle equation
| (17) |
has no solutions at for all values of .
When lies between 1.16eV and 1.32eV, we enter a pseudogap regime. The even component of the Green’s function, that provides a coarse-grained picture of the physics close to the antinode , maintains its insulating character () while the odd component, describing the nodal region close to , becomes metallic (). This describes a metal that only has coherent quasiparticles close to the node. Antinodal particles are suppressed by lifetime effects, as can be seen from the more negative imaginary part of the even self-energy reaching -0.1eV in Fig. 6 while remains very small. We show below that the spectral function exhibits a pseudogap at in this region. This regime is very reminiscent of the pseudogap region of cuprate superconductors.
As the electron doping is further increased, for eV, spectral weight starts appearing in , an indication that quasiparticles start forming at the antinode as well. However, there are still visible differences between the even and odd components of the self-energies (see also Appendix B). The regime is therefore characterized by a visible -space differentiation where lifetime effects are stronger at the antinode than at the node () but do not completely destroy quasiparticles.
Eventually, for above 1.45eV, a uniform metallic regime settles where both self-energies are identical and -space differentiation has disappeared. This regime would be well described by a single-site DMFT calculation.
It should be emphasized that boundaries delimiting these different regimes correspond to crossovers and hence are defined here in a qualitative manner.

The physical mechanism responsible for the formation of the pseudogap and the strong nodal-antinodal dichotomy observed at low doping can be revealed by studying the many-body states associated with the 2-site cluster. Calculating these states’ histogram, we identify those that contribute most to the stochastic sampling within the CT-HYB quantum impurity solver. This is shown in Fig. 7, from which it is clear that the system is dominated by the intra-dimer singlet state at low doping levels. This is a strong indication that physics in this regime is governed by the formation of short-range antiferromagnetic correlations between neighboring sites.
V Fermi surface and pseudogap
We now turn to the study of the fermiology of the system. Within CDMFT, the lattice Green’s function given by Eq. (11) breaks translational symmetry, Kotliar et al. (2001) hence making a direct comparison to momentum-resolved ARPES experiments difficult. The reason for the symmetry breaking is the lattice self-energy in CDMFT only having components inside a unit cell but not between different unit cells. A natural way to restore the translational symmetry is to periodize the self-energy by propagating the intersite contribution over all links on the lattice. However an artifact of this periodization scheme is that it prevents the formation of a Mott insulator and gives a wrong description of the low-doping physics (see Appendix D for more details). We therefore design a different periodization that yields much more physical results and preserves the existence of the Mott insulator. In this scheme, the lattice self-energy is given by
| (18) |
where is expressed in the reduced Brillouin zone. With this self-energy, we then define a periodized lattice Green’s function according to
| (19) |
This Green’s function preserves all the symmetries of the lattice and will be the basis of our analysis below.
As a consistency check we first compute in Fig. 4 the electronic density as a function of obtained from (orange curve). Comparing it to the cluster density (blue curve) discussed in Sec. IV, we see that plateaus at match well, confirming the existence of a Mott insulator within our periodization scheme. However, the periodized density generally has a slightly lower values compared to the cluster density for a given chemical potential. In the following, we discuss our results for specific values of and thus indicate two corresponding values of the electron doping: the cluster and the periodized one (resp. and ).
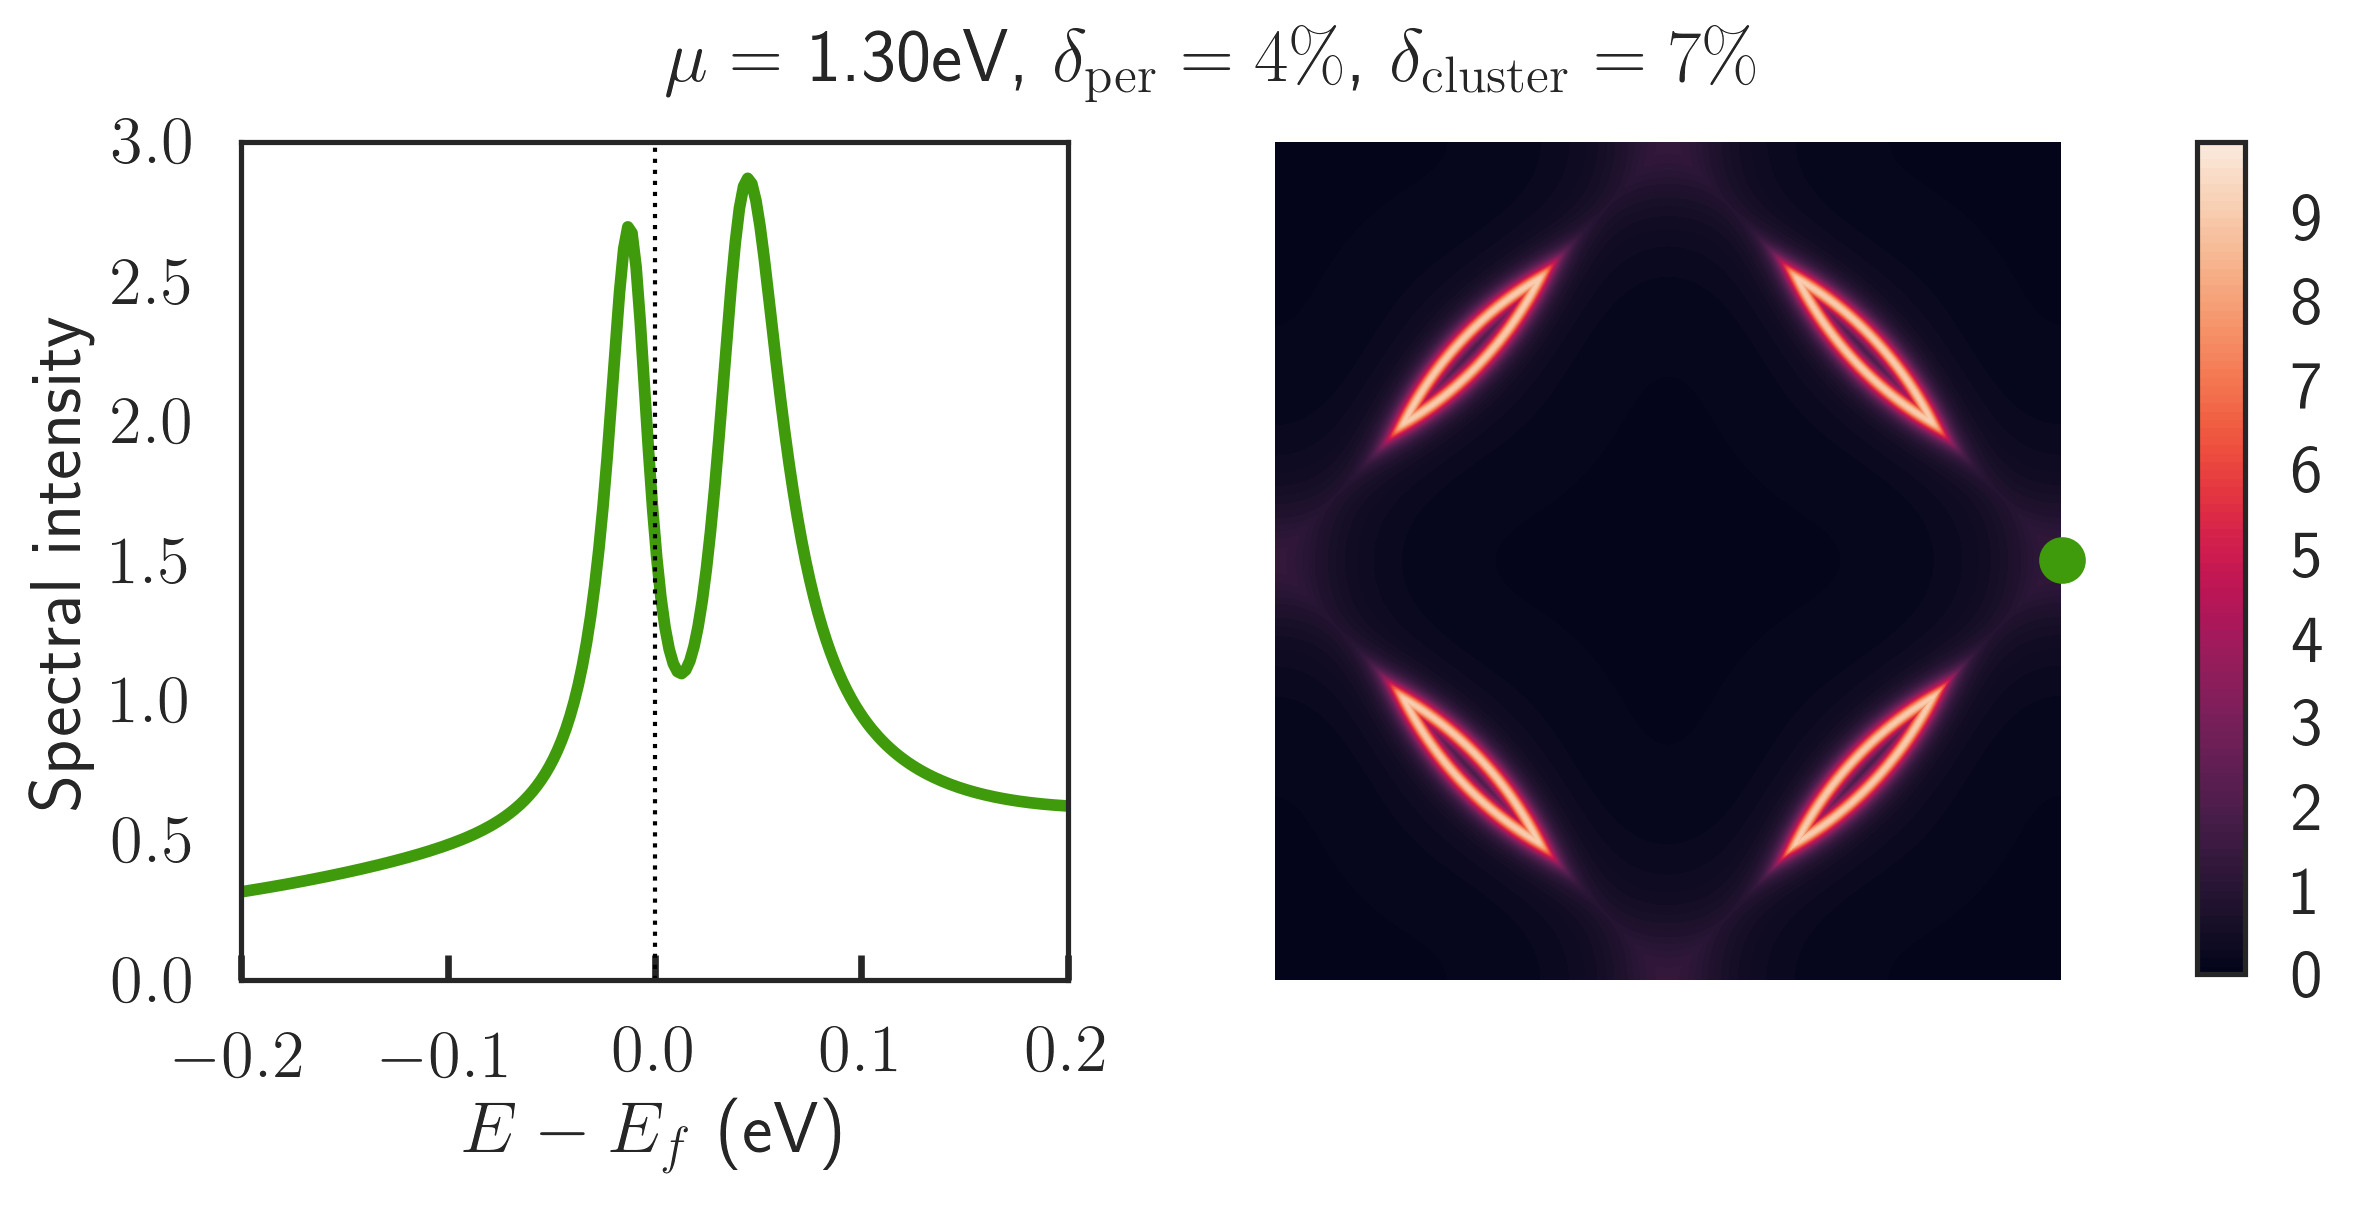
We plot in Fig. 1 the spectral intensity at the Fermi surface for four values of the chemical potential. At small doping levels, for , nodal pockets with coherent quasiparticles develop while the antinodal intensity is completely suppressed. For these values of , we are in the pseudogap regime discussed above. A closer inspection of the spectral function at for indeed confirms the presence of a clear pseudogap: Fig. 8 shows the leading edge of the spectrum being shifted away from zero energy. As discussed above, we attribute its formation to short-range antiferromagnetic correlations (manifested here as the dominance of inter-site singlet dimer formation in our cluster, as revealed by the histogram of states).
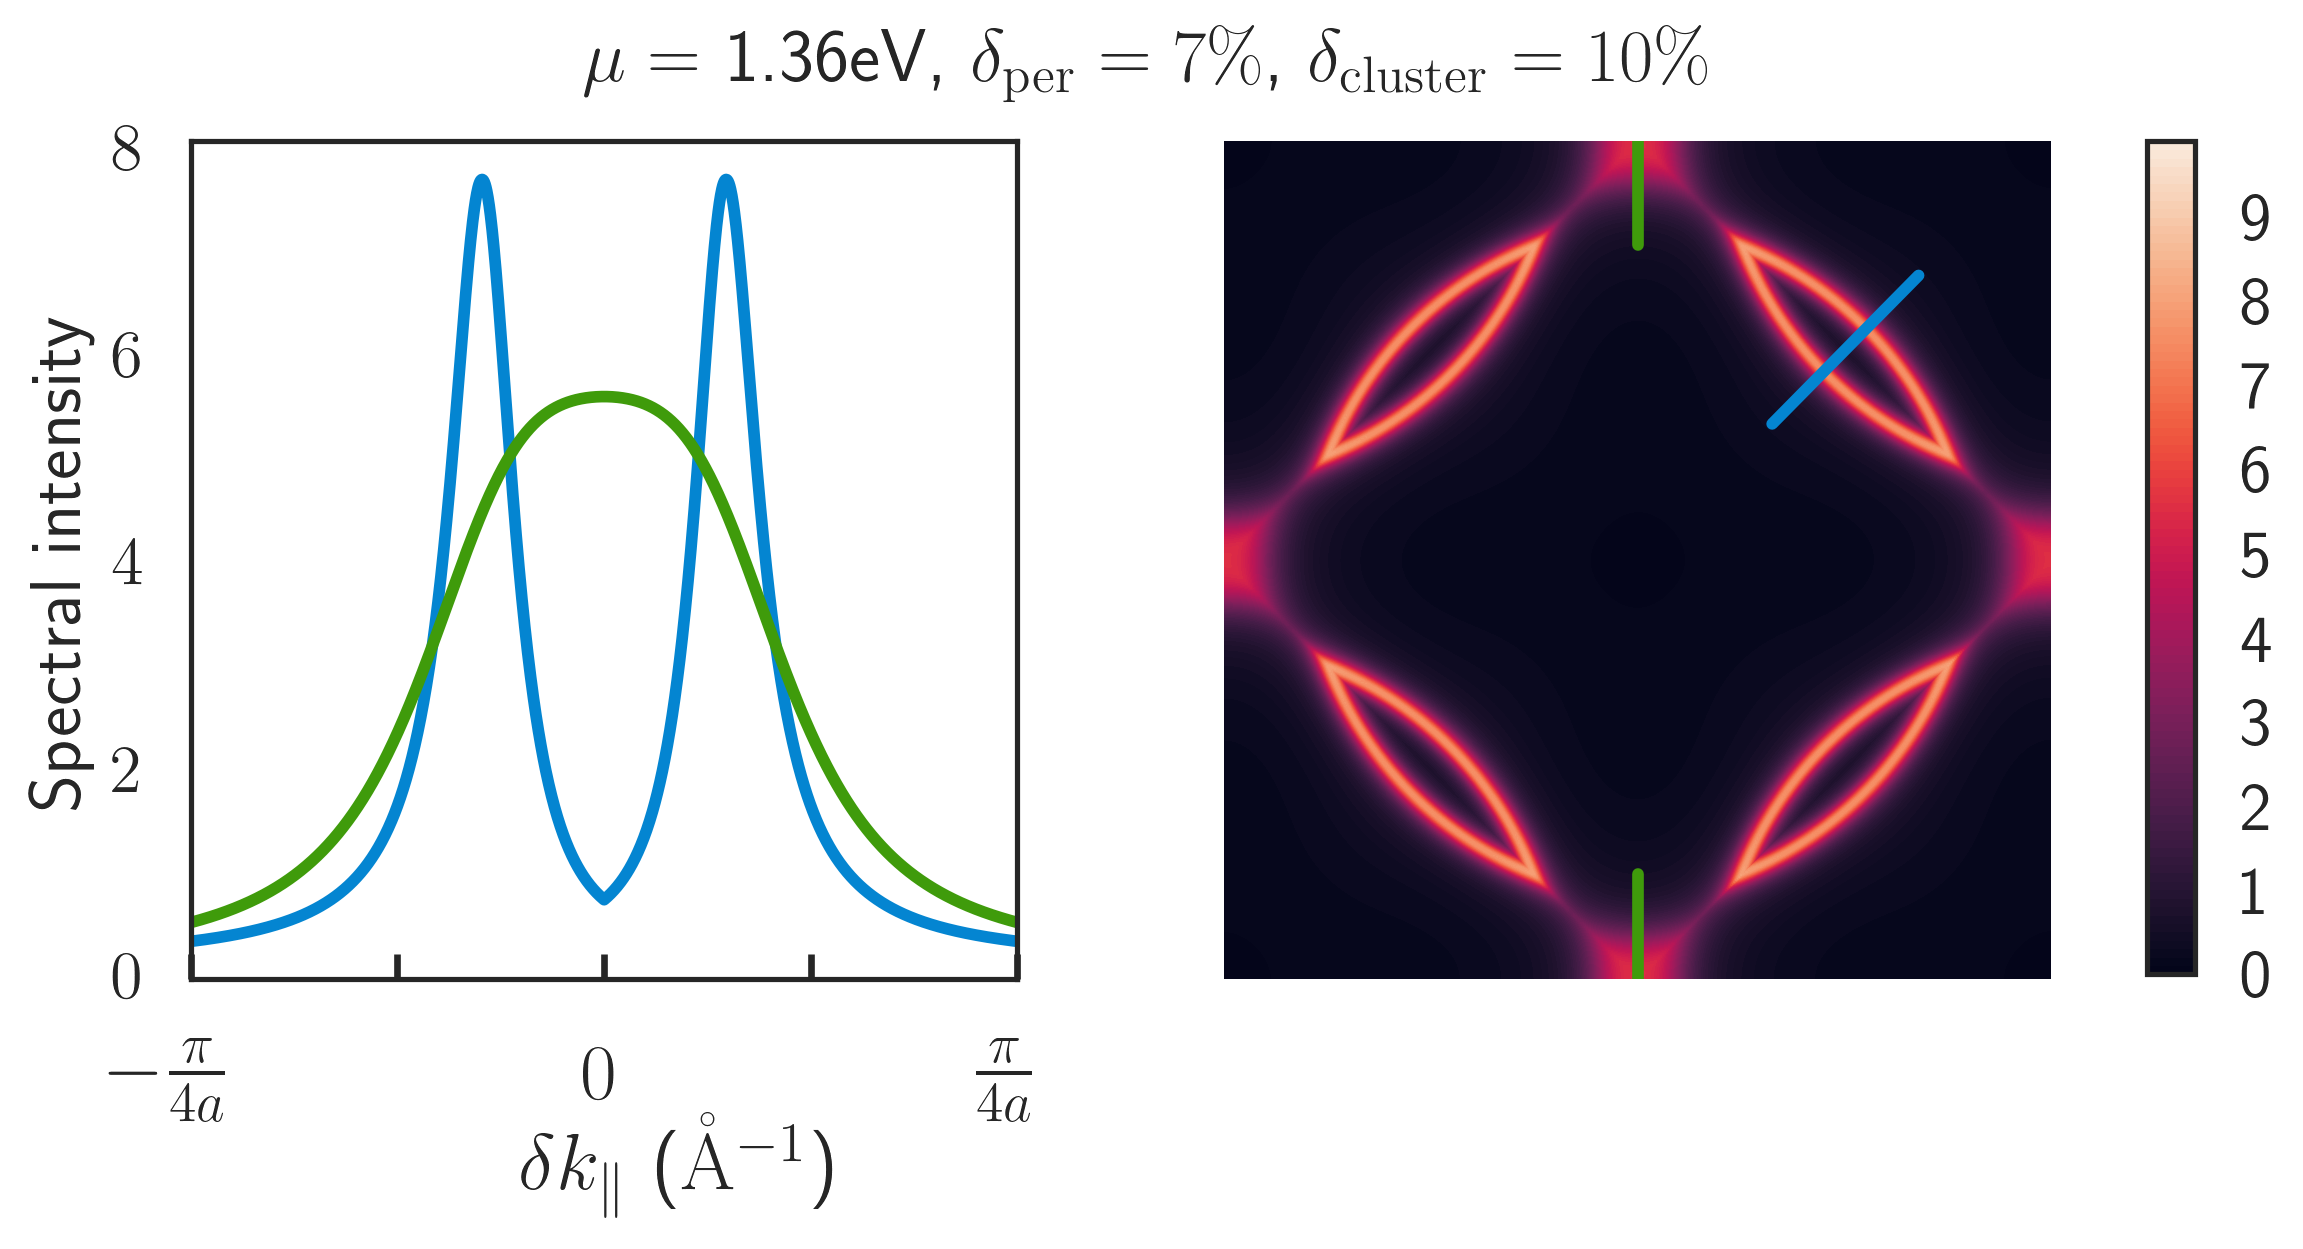
As the electron doping is increased, the pockets grow and spectral intensity starts to appear around , see panel (c) of Fig. 1, leading to an extension of the Fermi surface over the Brillouin zone. Quasiparticles are however far more incoherent and broader at the antinode, as can be seen from momentum cuts across the node or the antinode (Fig. 9). While sharp coherent quasiparticles are found at the node, those at the antinode display a lower spectral intensity that is broadened over a greater region of -space. This corresponds to the momentum-differentiation regime introduced above.
At larger doping, the self-energy becomes finally uniform and the resulting Fermi surface displays coherent quasiparticles both at the node and the antinode, as shown in the panel (d) of Fig. 1.
VI Electronic band structure
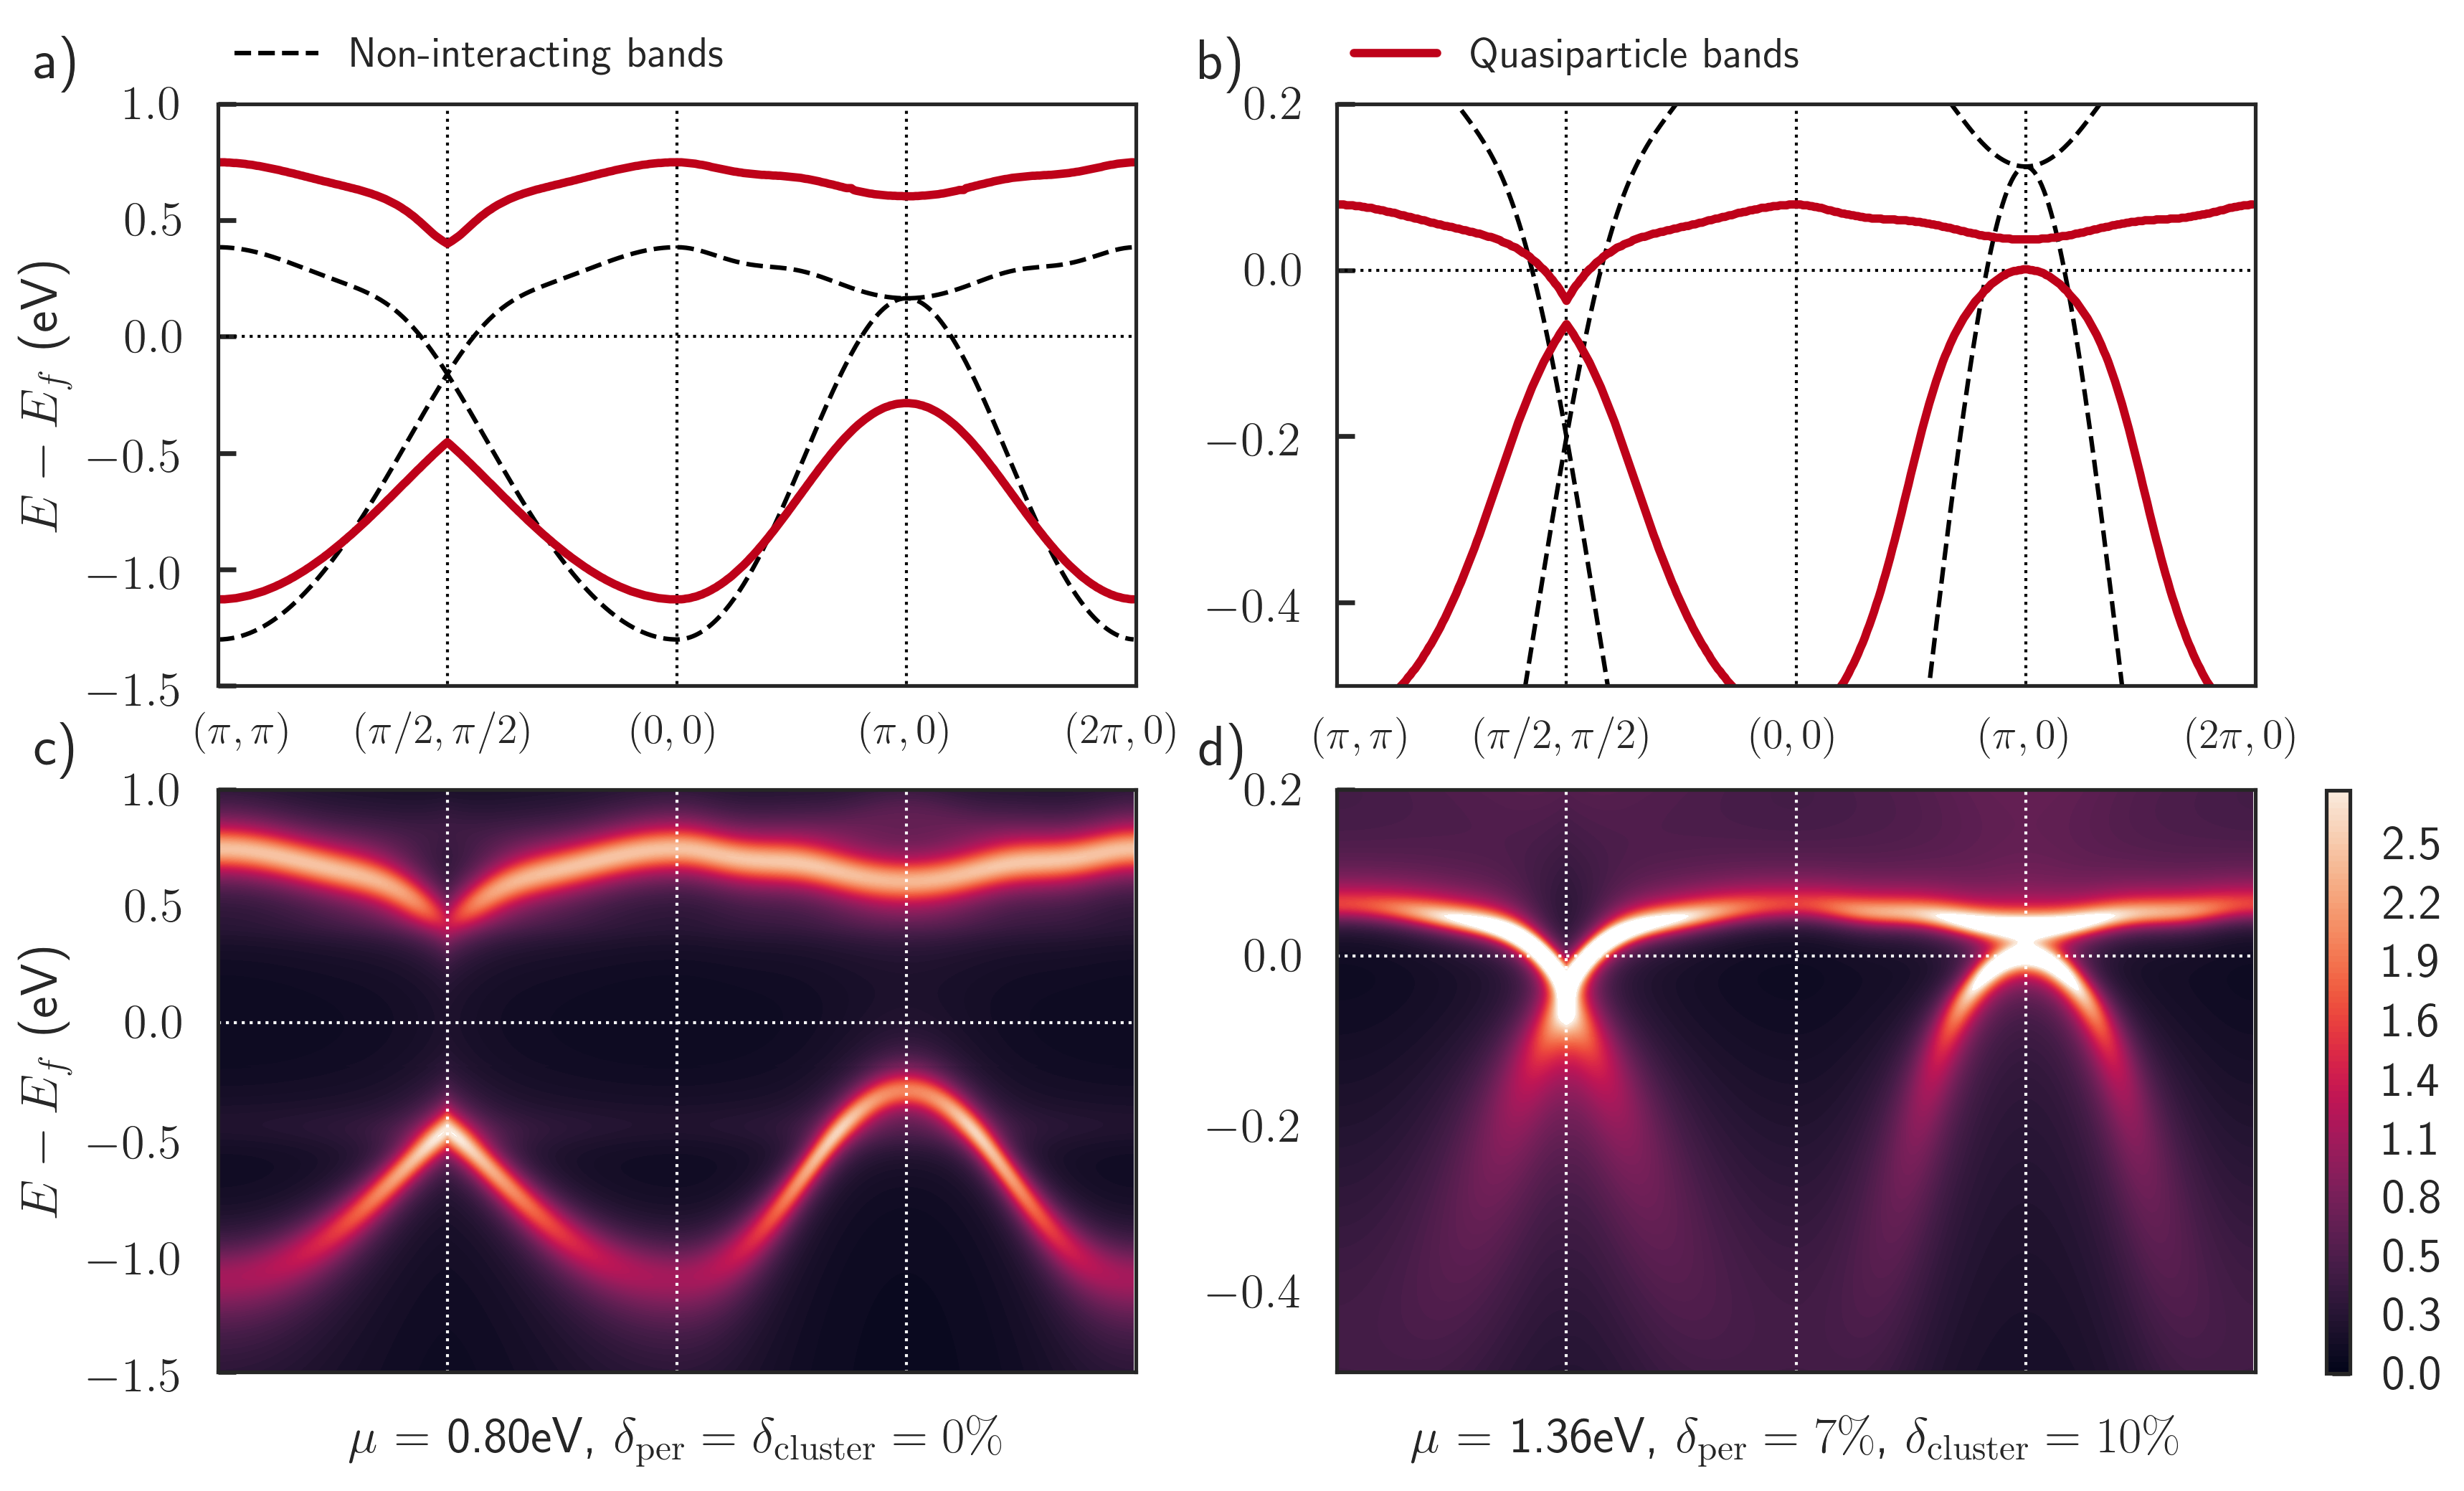
We now turn to an analysis of the dispersion of quasiparticle bands in . This requires to analytically continue our imaginary-frequency data to the real axis. We use Padé approximants Vidberg and Serene (1977) to find from the knowledge of the periodized lattice self-energy . The resulting band structure is shown in Fig. 10 where we compare the insulating state at eV (left panels) and the electron doped state at eV, , (right panels). On the upper panels, we show the non-interacting bands obtained by diagonalizing the TB + SO Hamiltonian (dashed lines) and the quasiparticle bands obtained from the solutions of
| (20) |
Bands are plotted along the - - - - path of the full Brillouin zone. Lower panels display the corresponding total spectral intensity .
In the insulating region, the Mott gap is clearly visible. The band structure indicates that correlation effects have split the original non-interacting bands. This is compatible with the observation that, at eV, the cluster self-energies take very different values . Lifetime effects are also not very strong and the bands are fairly coherent, consistent with the fact that . The top of the lower band is located at eV at the node and at eV at the antinode. There is a direct gap to the unoccupied states of the order of 0.8 eV at , while the smallest overall gap is indirect and of order 0.6 eV. Note that the latter value is consistent with the width of the Mott plateau in Fig. 4.
As we move to the doped region, the Mott gap first closes at the nodal point and the quasiparticle bands merge. The crossing of the upper band at two points close to is a signature of the pocket seen in the previous spectral intensities. Around these points, a clear renormalization of the Fermi velocities by a factor is visible as compared to the non-interacting bands. For eV there is still a gap between the bands at but the lower band just reaches the Fermi level yielding some antinodal spectral weight. It is interesting to note that the correlation effects are much stronger on the lower band than on the upper band. Quasiparticles are then better defined at (they correspond to a crossing of the upper band) than at where they are associated with the lower band. This is explained by the fact that the physics of the lower band is mainly controlled by the cluster , while the upper band is controlled by . As a result, the larger negative imaginary part of (see Fig. 6) induces stronger lifetime effects at the antinode, while the smaller imaginary part of maintains coherent quasiparticles at the node.
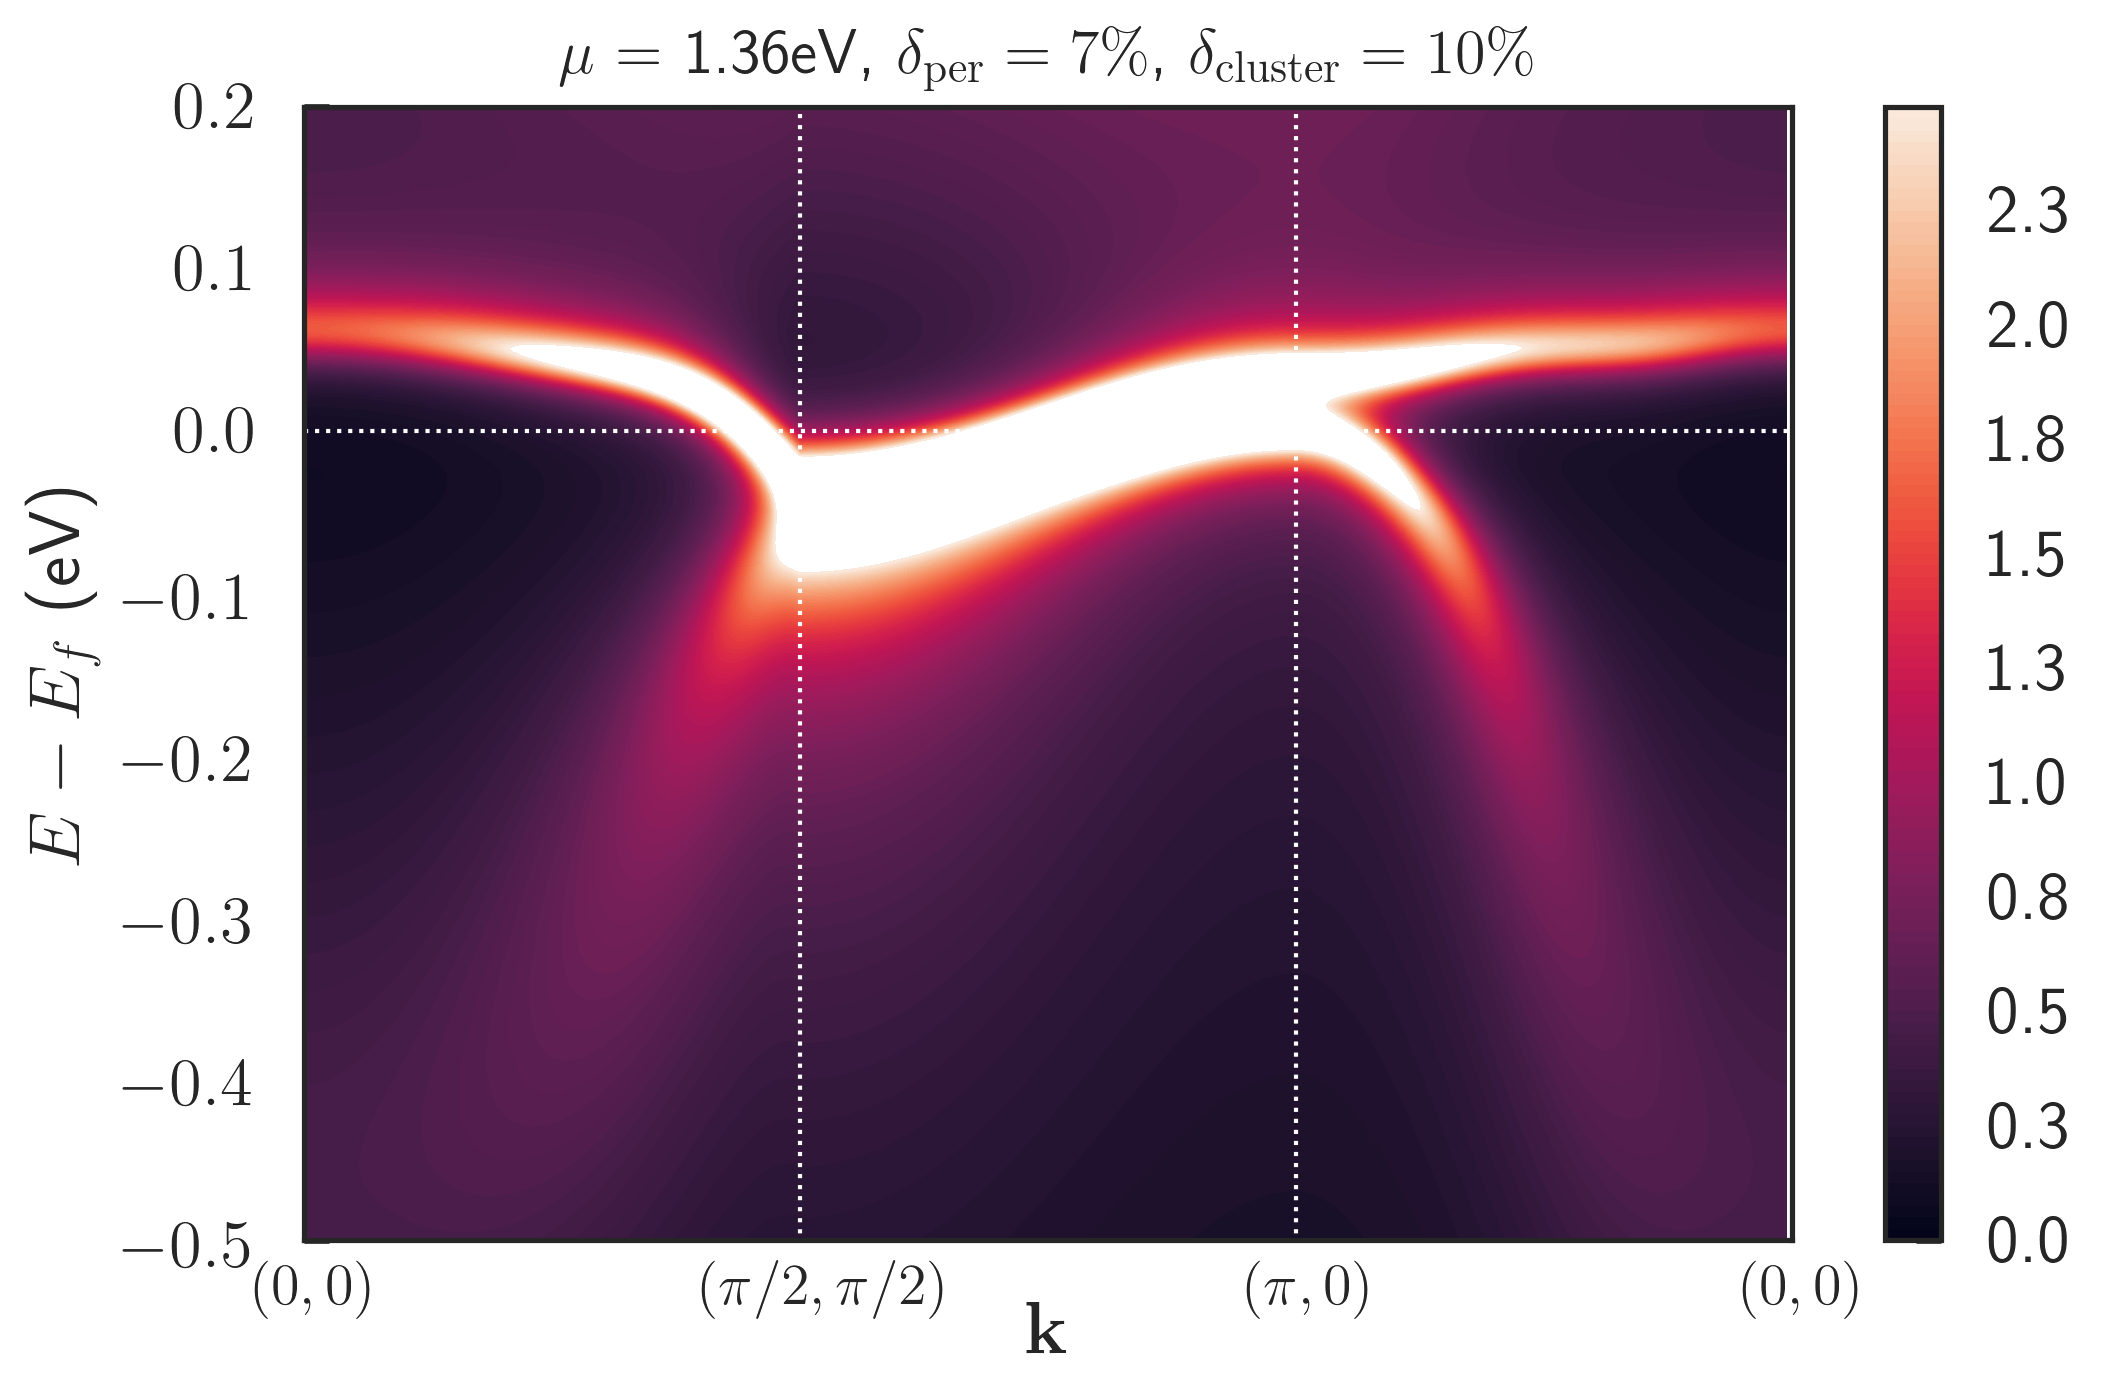
We finally display in Fig. 11 a spectral intensity map along the - Brillouin zone path, which corresponds to the path along which the non-interacting bands are degenerate. ARPES data along this path have not appeared in print to our knowledge, and our results could be useful in the context of future analysis of ARPES experiments.
VII Discussion and conclusions
Finally, we discuss the comparison of our results with ARPES and other experiments on doped .
Overall, there is excellent qualitative agreement. Comparing panels (a) and (b) of Fig. 10, a clear ‘collapse’ of the Mott gap is found upon doping the insulator (i.e the two bands become much closer to each other). This effect was reported in ARPES experiments: de la Torre et al. (2015); Brouet et al. (2015) It is clearly apparent for example in Fig.2 (g-h) of Ref. de la Torre et al., 2015 in which the top of the band at moves from about eV to about eV (band crossing) upon doping. In fact, the location of the top of the band at the ‘node’ ( eV) and ‘antinode’ ( eV) are in good quantitative agreement with the values reported in Ref. de la Torre et al., 2015. The rather round and spread behavior of the band at the node quite agrees with the experiments even if the nodal part does not appear to be as narrow as it is observed.
The ‘nodal-antinodal’ differentiation and formation of a pseudogap near the ‘antinode’ is also consistent with the experimental observations. de la Torre et al. (2015); Kim et al. (2014) Here, we have shown that the physical origin of the pseudogap is indeed the same than in cuprate superconductors, namely short-range spin correlations (see e.g. Refs. Gunnarsson et al., 2015; Wu et al., 2017 for recent theoretical studies).
The value of the interaction parameter eV for which we chose to perform our calculations should also be discussed in the context of experimental measurements, especially of experimental determinations of the Mott gap. With this value, we find a Mott gap which is indirect and of order eV - corresponding to the transition between the top of the lower Hubbard band at and the bottom of the upper Hubbard band at in Fig. 10(a), and also to the width of the Mott plateau in Fig. 4. The value of the optical gap would be slightly larger. In Ref. Brouet et al., 2015, was studied under both hole (Rh) and electron (La) doping, allowing for a determination of a Mott gap of order eV, in rather good agreement with the present work. Optical spectroscopy measurements (see e.g Fig.4 in Ref. Kim et al., 2008) do reveal a sharp increase of absorption in that frequency range, but a rather slow onset of the optical conductivity is observed with spectral weight below this scale, possibly suggesting a significantly smaller value of the actual gap (although a precise determination is difficult). This suggests that the value of used in the present work may be a bit too large. Accordingly, we note that the Fermi surface renormalizations obtained above appear to be somewhat larger than the values reported in Ref. de la Torre et al., 2015.
An ab-initio determination of the screened appropriate for the low-energy model used here, as well as a more systematic study of this model as a function of would be desirable in future work. In connection with the latter, a study of the possible superconducting instability as a function of can be performed within cluster extensions of DMFT (CDMFT or DCA) for the present model and would shed light on the elusive superconductivity of doped .
Acknowledgements.
We are grateful to Felix Baumberger, Alberto de la Torre, Sara Ricco and Anna Tamai for sharing with us their experimental results and for numerous discussions. We also acknowledge discussions with Luca Perfetti, Véronique Brouet, Dirk van der Marel, Nimrod Bachar, Silke Biermann, and thank the CPHT computer support team for their help. This work has been supported by the European Research Council grant ERC-319286-QMAC and the Swiss National Science Foundation (NCCR MARVEL). The Flatiron Institute is supported by the Simons Foundation.Appendix A Expression of in the basis
Labeling , we have
| (21) |
and
| (22) |
and
| (23) |
Appendix B Green’s functions and self-energy in the four doping regimes

In Fig. 12, we show the Matsubara frequency Green’s functions and self-energies in the four doping regimes discussed in the main text. These regimes are here associated with four different values of the chemical potential corresponding to the four rows of the figure.
For eV the system is a Mott insulator, as can be seen from the insulating character of the two components of the Green’s function . Let us note that the real parts of the self-energies are very different, which is responsible for the opening of the Mott gap (see main text). Increasing the doping, we enter a pseudogap phase. At eV, the even component of the Green’s function has an insulating behavior while the odd one is metallic. At eV, the system is in a differentiate regime. Both components of the Green’s function are now metallic but the self-energies are still quite differentiated. Going to even larger dopings we finally reach the uniform Fermi liquid state. Hence at eV, we see that and are both metallic and that the self-energies tend to be identical.
Appendix C Solving CDMFT equations
In order to solve the CDMFT equations, it is convenient to work in the basis introduced in Eq. (13). In this basis, the lattice Green’s function is
| (24) |
where is the effective Hamiltonian expressed in the basis and the cluster self-energy is diagonal because and sites are electronically equivalent
| (25) |
Note that for a given point, is not diagonal. One can however show that, for a generic diagonal matrix ,
| (26) |
is a diagonal matrix too. As a result, the CDMFT self-consistency Eq. (12) becomes diagonal and reads
| (27) |
where both cluster quantities and are diagonal. This equation is solved iteratively in the following way: At the iteration step , the quantum impurity model is described by a non-interacting Green’s function and a local interaction Hamiltonian that has the following expression in the basis
| (28) |
This cluster model is solved using the CT-HYB quantum impurity solver. This solver directly works in the basis. It yields both the cluster Green’s functions and self-energies . The self-consistency condition is used to construct a local diagonal lattice Green’s function
| (29) |
This allows to get a new expression for the non-interacting cluster Green’s function, via a modified Dyson equation:
| (30) |
This procedure is iterated until convergence.
Appendix D Absence of a Mott insulator with the standard periodization scheme
The usual periodization of the self-energy writes
| (31) |
where
| (32a) | ||||
| (32b) | ||||
is expressed in the reduced Brillouin zone. We see from Fig. 2 that the degeneracy of the - path in the full Brillouin zone has to be lifted in order to create a Mott insulating gap. However along this path and the self-energy has the following expression
| (33) |
Hence the self-energy only renormalizes the chemical potential in the quasiparticle equation (Eq. (20)) at , forbidding any lifting of the degeneracy between the quasiparticle bands and therefore any gap in the band structure.
References
- Randall et al. (1957) J. J. Randall, L. Katz, and R. Ward, Journal of the American Chemical Society 79, 266 (1957), http://dx.doi.org/10.1021/ja01559a004 .
- Kim et al. (2008) B. J. Kim, H. Jin, S. J. Moon, J.-Y. Kim, B.-G. Park, C. S. Leem, J. Yu, T. W. Noh, C. Kim, S.-J. Oh, J.-H. Park, V. Durairaj, G. Cao, and E. Rotenberg, Phys. Rev. Lett. 101, 076402 (2008).
- Martins et al. (2011) C. Martins, M. Aichhorn, L. Vaugier, and S. Biermann, Phys. Rev. Lett. 107, 266404 (2011).
- Kim et al. (2012) J. Kim, D. Casa, M. H. Upton, T. Gog, Y.-J. Kim, J. F. Mitchell, M. van Veenendaal, M. Daghofer, J. van den Brink, G. Khaliullin, and B. J. Kim, Phys. Rev. Lett. 108, 177003 (2012).
- de la Torre et al. (2015) A. de la Torre, S. McKeown Walker, F. Y. Bruno, S. Riccó, Z. Wang, I. Gutierrez Lezama, G. Scheerer, G. Giriat, D. Jaccard, C. Berthod, T. K. Kim, M. Hoesch, E. C. Hunter, R. S. Perry, A. Tamai, and F. Baumberger, Phys. Rev. Lett. 115, 176402 (2015).
- Brouet et al. (2015) V. Brouet, J. Mansart, L. Perfetti, C. Piovera, I. Vobornik, P. Le Fèvre, F. m. c. Bertran, S. C. Riggs, M. C. Shapiro, P. Giraldo-Gallo, and I. R. Fisher, Phys. Rev. B 92, 081117 (2015).
- Terashima et al. (2017) K. Terashima, M. Sunagawa, H. Fujiwara, T. Fukura, M. Fujii, K. Okada, K. Horigane, K. Kobayashi, R. Horie, J. Akimitsu, E. Golias, D. Marchenko, A. Varykhalov, N. L. Saini, T. Wakita, Y. Muraoka, and T. Yokoya, Phys. Rev. B 96, 041106 (2017).
- Nichols et al. (2014) J. Nichols, N. Bray-Ali, A. Ansary, G. Cao, and K.-W. Ng, Phys. Rev. B 89, 085125 (2014).
- Zhang et al. (2013) H. Zhang, K. Haule, and D. Vanderbilt, Phys. Rev. Lett. 111, 246402 (2013).
- Watanabe et al. (2013) H. Watanabe, T. Shirakawa, and S. Yunoki, Phys. Rev. Lett. 110, 027002 (2013).
- Yang et al. (2014) Y. Yang, W.-S. Wang, J.-G. Liu, H. Chen, J.-H. Dai, and Q.-H. Wang, Phys. Rev. B 89, 094518 (2014).
- Kim et al. (2015) Y. K. Kim, N. H. Sung, J. D. Denlinger, and B. J. Kim, Nature Physics 12, 37 (2015).
- Yan et al. (2015) Y. J. Yan, M. Q. Ren, H. C. Xu, B. P. Xie, R. Tao, H. Y. Choi, N. Lee, Y. J. Choi, T. Zhang, and D. L. Feng, Phys. Rev. X 5, 041018 (2015).
- Crawford et al. (1994) M. K. Crawford, M. A. Subramanian, R. L. Harlow, J. A. Fernandez-Baca, Z. R. Wang, and D. C. Johnston, Phys. Rev. B 49, 9198 (1994).
- Vogt and Buttrey (1996) T. Vogt and D. Buttrey, Journal of Solid State Chemistry 123, 186 (1996).
- Singh et al. (2002) D. J. Singh, P. Blaha, K. Schwarz, and J. O. Sofo, Phys. Rev. B 65, 155109 (2002).
- Rossnagel and Smith (2006) K. Rossnagel and N. V. Smith, Phys. Rev. B 73, 073106 (2006).
- Xiang and Whangbo (2007) H. J. Xiang and M.-H. Whangbo, Phys. Rev. B 75, 052407 (2007).
- Kim et al. (2014) Y. K. Kim, O. Krupin, J. D. Denlinger, A. Bostwick, E. Rotenberg, Q. Zhao, J. F. Mitchell, J. W. Allen, and B. J. Kim, Science 345, 187 (2014), http://science.sciencemag.org/content/345/6193/187.full.pdf .
- Hampel et al. (2015) A. Hampel, C. Piefke, and F. Lechermann, Phys. Rev. B 92, 085141 (2015).
- Jin et al. (2009) H. Jin, H. Jeong, T. Ozaki, and J. Yu, Phys. Rev. B 80, 075112 (2009).
- Carter et al. (2013) J.-M. Carter, V. Shankar V., and H.-Y. Kee, Phys. Rev. B 88, 035111 (2013).
- Watanabe et al. (2010) H. Watanabe, T. Shirakawa, and S. Yunoki, Phys. Rev. Lett. 105, 216410 (2010).
- Kotliar et al. (2001) G. Kotliar, S. Y. Savrasov, G. Pálsson, and G. Biroli, Phys. Rev. Lett. 87, 186401 (2001).
- Georges et al. (1996) A. Georges, G. Kotliar, W. Krauth, and M. J. Rozenberg, Rev. Mod. Phys. 68, 13 (1996).
- Seth et al. (2016) P. Seth, I. Krivenko, M. Ferrero, and O. Parcollet, Computer Physics Communications 200, 274 (2016).
- Werner et al. (2006) P. Werner, A. Comanac, L. de’ Medici, M. Troyer, and A. J. Millis, Phys. Rev. Lett. 97, 076405 (2006).
- Werner and Millis (2006) P. Werner and A. J. Millis, Phys. Rev. B 74, 155107 (2006).
- Gull et al. (2011) E. Gull, A. J. Millis, A. I. Lichtenstein, A. N. Rubtsov, M. Troyer, and P. Werner, Rev. Mod. Phys. 83, 349 (2011).
- Parcollet et al. (2015) O. Parcollet, M. Ferrero, T. Ayral, H. Hafermann, I. Krivenko, L. Messio, and P. Seth, Computer Physics Communications 196, 398 (2015).
- Vidberg and Serene (1977) H. J. Vidberg and J. W. Serene, J. Low Temp. Phys. 29, 179 (1977).
- Gunnarsson et al. (2015) O. Gunnarsson, T. Schäfer, J. P. F. LeBlanc, E. Gull, J. Merino, G. Sangiovanni, G. Rohringer, and A. Toschi, Phys. Rev. Lett. 114, 236402 (2015).
- Wu et al. (2017) W. Wu, M. Ferrero, A. Georges, and E. Kozik, Phys. Rev. B 96, 041105 (2017).