Indication of anisotropy in arrival directions of ultra-high-energy cosmic rays through comparison to the flux pattern of extragalactic gamma-ray sources
Abstract
A new analysis of the dataset from the Pierre Auger Observatory provides evidence for anisotropy in the arrival directions of ultra-high-energy cosmic rays on an intermediate angular scale, which is indicative of excess arrivals from strong, nearby sources. The data consist of 5514 events above with zenith angles up to recorded before 2017 April 30. Sky models have been created for two distinct populations of extragalactic gamma-ray emitters: active galactic nuclei from the second catalog of hard Fermi-LAT sources (2FHL) and starburst galaxies from a sample that was examined with Fermi-LAT. Flux-limited samples, which include all types of galaxies from the Swift-BAT and 2MASS surveys, have been investigated for comparison. The sky model of cosmic-ray density constructed using each catalog has two free parameters, the fraction of events correlating with astrophysical objects and an angular scale characterizing the clustering of cosmic rays around extragalactic sources. A maximum-likelihood ratio test is used to evaluate the best values of these parameters and to quantify the strength of each model by contrast with isotropy. It is found that the starburst model fits the data better than the hypothesis of isotropy with a statistical significance of , the highest value of the test statistic being for energies above . The three alternative models are favored against isotropy with significance. The origin of the indicated deviation from isotropy is examined and prospects for more sensitive future studies are discussed.
=-1
in ApJL as DOI:10.3847/2041-8213/aaa66d
1 Search for UHECR anisotropies
Identifying the sources of ultra-high-energy cosmic rays (UHECRs) has been a prime goal of particle astrophysics for decades. The challenge is great, because the flux falls rapidly with increasing energy, and because UHECRs have a mixed mass composition (Aab et al., 2014a, 2016a) so that some or all of them experience substantial magnetic deflections. Many scenarios have been proposed involving different populations of host galaxies. In this Letter, we investigate whether intermediate-scale111“Intermediate” denotes hereafter angular scales larger than the experimental resolution, , and smaller than large-scale patterns, . anisotropies in UHECR arrival directions are associated with either or both of two prominent classes of extragalactic sources detected by Fermi-LAT – active galactic nuclei (AGNs) and starburst galaxies (SBGs) – using the gamma-ray luminosity or its surrogate (radio emission for SBGs) as a proxy for the relative luminosity of each source in UHECRs.
The rate of energy production of UHECRs determined from observations above is close to (Unger et al., 2015). Based on the Fermi-LAT survey, Dermer & Razzaque (2010) argue that AGNs and SBGs match such rates in the gamma-ray band. Due to the low density of detected SBGs and AGNs, and the attenuation of UHECR flux with increasing distance (GZK effect, Greisen, 1966; Zatsepin & Kuz’min, 1966), a few objects would be expected to dominate the local flux, naturally producing an intermediate-scale anisotropy if these sources contribute a sufficient fraction of the UHECR flux.
The AGN and SBG populations are well-motivated physically. AGNs are favored source candidates because their jets and radio lobes satisfy the Hillas criterion for shock acceleration (Hillas, 1984). SBGs – being loci of intense star formation – potentially have increased rates of extreme events associated with the deaths of short-lived, massive stars, such as gamma-ray bursts, hypernovae, and magnetars (see e.g. Biermann et al., 2016; Perley et al., 2016). Their winds have also been proposed as possible reacceleration sites (Anchordoqui et al., 1999).
The analysis presented here is an advance in several ways. First, Fermi-LAT observations of gamma rays from two extragalactic populations provide us with possible ansatzes for the relative UHECR fluxes from source candidates. That information makes the present analyses potentially more sensitive than previous studies based solely on the source direction. Second, thanks to our improved knowledge of the energy-dependent composition, we can now account more accurately for the relative attenuation of fluxes from distant sources. Third, thanks to the significant increase in exposure of the Pierre Auger Observatory with respect to previous analyses, the data can reveal more subtle patterns.
2 UHECR dataset
UHECRs are detected at the Pierre Auger Observatory (Argentina, latitude S, longitude W; Aab et al., 2015c) through the extensive air showers they induce in the atmosphere. Air showers are detected on the ground with an array of 1,600 water-Cherenkov detectors with a duty cycle of nearly . Twenty-four fluorescence telescopes map, during dark nights (duty cycle of ), the longitudinal profile of each shower via the nitrogen fluorescence produced dominantly by the electromagnetic cascade. The combination of both techniques provides the array with an energy scale insensitive to primary mass assumptions and air-shower simulation uncertainties. The systematic uncertainty in the energy scale is estimated to be (Verzi et al., 2013).
Events above recorded between 2004 January 1 and 2017 April 30 are used in this analysis. Above , both ‘vertical showers’ (zenith angle , Abraham et al., 2010) and ‘inclined showers’ (, Aab et al., 2014b) trigger the array of detectors with efficiency, the average angular resolution being below and the statistical energy resolution being better than .
3 Source selection & UHECR sky models
3.1 Extragalactic gamma-ray populations
We extract our list of gamma-ray AGNs (AGNs hereafter) from the 2FHL catalog (Ackermann et al., 2016), which includes 360 sources detected by Fermi-LAT above . We study radio-loud objects within a radius, yielding 17 blazars and radio galaxies. Their integral flux is used as a proxy for the UHECR flux. Given the distance of these objects, the gamma-ray absorption by the extragalactic background light (e.g. Domínguez et al., 2011) is small.
The detections of seven SBGs have been reported using Fermi-LAT data: NGC 253, M 82, NGC 4945, NGC 1068 (Ackermann et al., 2012), NGC 2146 (Tang et al., 2014), Arp 220 (Peng et al., 2016), and Circinus (Hayashida et al., 2013). Their gamma-ray luminosity has been shown to scale almost linearly with their continuum radio flux (Ackermann et al., 2012). We thus adopt as a proxy for the UHECR flux of SBGs their continuum emission at for which a larger census exists.
We select the 23 SBGs with a flux larger than among the 63 objects within searched for gamma-ray emission by Ackermann et al. (2012). Due to possible incompleteness of that list near the Galactic plane () and in the southern sky (), relevant SBGs could be missing from our selection. We checked however that our conclusions remain unchanged:222Test statistic for anisotropy within unit. a) using all 63 objects listed in Ackermann et al. (2012), b) using the catalog from Becker et al. (2009) with 32 SBGs above , c) adding the Circinus SBG absent from (a) and (b), d) using only the six SBGs reported in the 3FGL (NGC 253, M 82, NGC 4945, NGC 1068, Circinus, NGC 2146; Acero et al., 2015) and their integral flux as UHECR proxy.
3.2 X-ray and infrared samples
Following previous searches (Aab et al., 2015b), we additionally study two flux-limited samples: Swift-BAT sources up to , above a flux of , and sources from the 2MASS redshift survey (2MRS catalog, Huchra et al., 2012) beyond , effectively taking out the Local Group as in Erdoǧdu et al. (2006). We use the flux and K-band flux corrected for Galactic extinction as UHECR proxies for each of these surveys.
The X-ray sky observed by Swift-BAT is dominated in flux by the nearby Centaurus A, often considered as a prime UHECR source candidate (e.g. Romero et al., 1996; Wykes et al., 2017), with additional diffuse structures arising from both radio-loud and radio-quiet AGNs. This constitutes a different selection of AGNs from that performed for the -ray sample (radio-loud only), dominated by the radio galaxies Centaurus A and M 87 within and by the blazars Mrk 421 and Mrk 501 within .
The 2MRS infrared intensity traces the distribution of extragalactic matter, and includes both star-forming galaxies and AGNs. It is dominated by contributions from the nearby SBG NGC 253, close to the South Galactic pole, M 82, only observable from the Northern hemisphere, along with M 83 and NGC 4945, belonging to the same group of galaxies as Centaurus A. Strong emission from Centaurus A as well as cumulated emission from fainter objects, e.g. in the Virgo cluster, constitute distinctive features of the 2MRS sky model with respect to the SBG one.


3.3 Impact of attenuation
We account for attenuation of UHECRs from distant objects (GZK effect) using a data-driven scenario that reproduces the composition and spectral constraints obtained by the Observatory (Aab et al., 2017a). Assuming a homogeneous distribution of sources in the local Universe, it was shown that an interpretation of the air-shower data using the EPOS-LHC interaction model together with a hard injection index at the sources (scenario A) best matches the data, accounting for propagation effects (Aloisio et al., 2012; Alves Batista et al., 2016). We also consider two other scenarios matching the data reasonably well: EPOS-LHC with (B) and Sibyll 2.1 with (C). These scenarios differ in the composition and maximum rigidities attainable at the sources. For each scenario and a chosen energy threshold, we evaluate the flux attenuation factor due to propagation for each source and correct its expected UHECR flux accordingly.
The two extragalactic gamma-ray populations under study and the relative weight of each source are provided in Table 2. The relative contributions accounting for the directional exposure of the Observatory are shown in the last column. Because SBGs are mostly nearby, attenuation from them is much less important than from the more distant blazars in the AGN sample. Taking into account attenuation, of the accumulated flux from SBGs emerges from a -radius region, while the radius goes up to for AGNs. For both the 2MRS and Swift-BAT flux-limited samples, the radius is .
4 Analysis and results
4.1 Maximum-likelihood analysis
We build the UHECR sky model as the sum of an isotropic component plus the anisotropic contribution from the sources. For the anisotropic component, each source is modeled as a Fisher distribution (Fisher, 1953), the equivalent of a Gaussian on the sphere. Its distribution is centered on the coordinates of the source, the integral being set by its flux attenuated above the chosen energy threshold, and the angular width – or search radius333Inverse square root of Fisher’s concentration parameter. – being a free parameter common to all sources. No shift of the centroid position is considered, avoiding dependence on any particular model of the Galactic magnetic field in this exploratory study. After mixing the anisotropic map with a variable fraction of isotropy, as in Abreu et al. (2010), the model map is multiplied by the directional exposure of the array and its integral is normalized to the number of events. The model map thus depends on two variables aimed at maximizing the degree of correlation with UHECR events: the fraction of all events due to the sources (anisotropic fraction) and the RMS angular separation between an event and its source (search radius) in the anisotropic fraction.
We perform an unbinned maximum-likelihood analysis, where the likelihood (L) is the product over the UHECR events of the model density in the UHECR direction. The test statistic (TS) for deviation from isotropy is the likelihood ratio test between two nested hypotheses: the UHECR sky model and an isotropic model (null hypothesis). The TS is maximized as a function of two parameters: the search radius and the anisotropic fraction. We repeat the analysis for a sequence of energy thresholds.
For a given energy threshold, we confirmed with simulations that the TS for isotropy follows a distribution with two degrees of freedom, as expected (Wilks, 1938), directly accounting for the fit of two parameters of the model. As in Aab et al. (2015b), we penalize the minimum p-value for a scan in threshold energy, by steps of up to , estimating the penalty factor with Monte-Carlo simulations. The p-values are converted into significances assuming 1-sided Gaussian distributions.


4.2 Single population against isotropy
Previous anisotropy studies (e.g. Aab et al., 2015b) have considered a scan in energy threshold starting at , where the observed flux reaches half the value expected from lower-energy extrapolations, but as shown in Fig. 1, there is a maximum in the significance close to this starting point. Therefore we have evaluated the TS down to .
The TS is maximum for SBGs above (894 events), with or without attenuation. For AGNs, the TS is maximum above (177 events) after accounting for attenuation. As shown in Fig. 1, left, attenuation mildly impacts SBGs which are nearby: we obtain TS=24.9/25.5/25.7 for scenarios A/B/C, respectively. The impact is more pronounced for AGNs, a larger attenuation reducing contributions from distant blazars: we obtain a maximum TS of 15.2/9.4/11.9 for scenarios A/B/C. Shifting the energy scale within systematic uncertainties () affects the maximum TS by unit for AGNs, for SBGs.
Penalizing for the energy scan, the maximum TS obtained for SBGs and AGNs within scenario A correspond to and deviations from isotropy, respectively. As shown in Fig. 2, left, the maximum deviation for AGNs is found at an angular scale of and a fraction of anisotropic events. For SBGs, a stronger deviation from isotropy is uncovered at an intermediate angular scale of and an anisotropic fraction of . The systematic uncertainty induced by the energy scale and attenuation scenario is at the level of for the anisotropic fraction and for the search radius obtained with SBGs.
For Swift-BAT and 2MRS sources attenuated within scenario A, we obtain maximum TS of 18.2 () above and 15.1 () above , respectively (see Fig. 1, right). These correspond to values of the best-fit parameters of and for Swift-BAT, and for 2MRS.
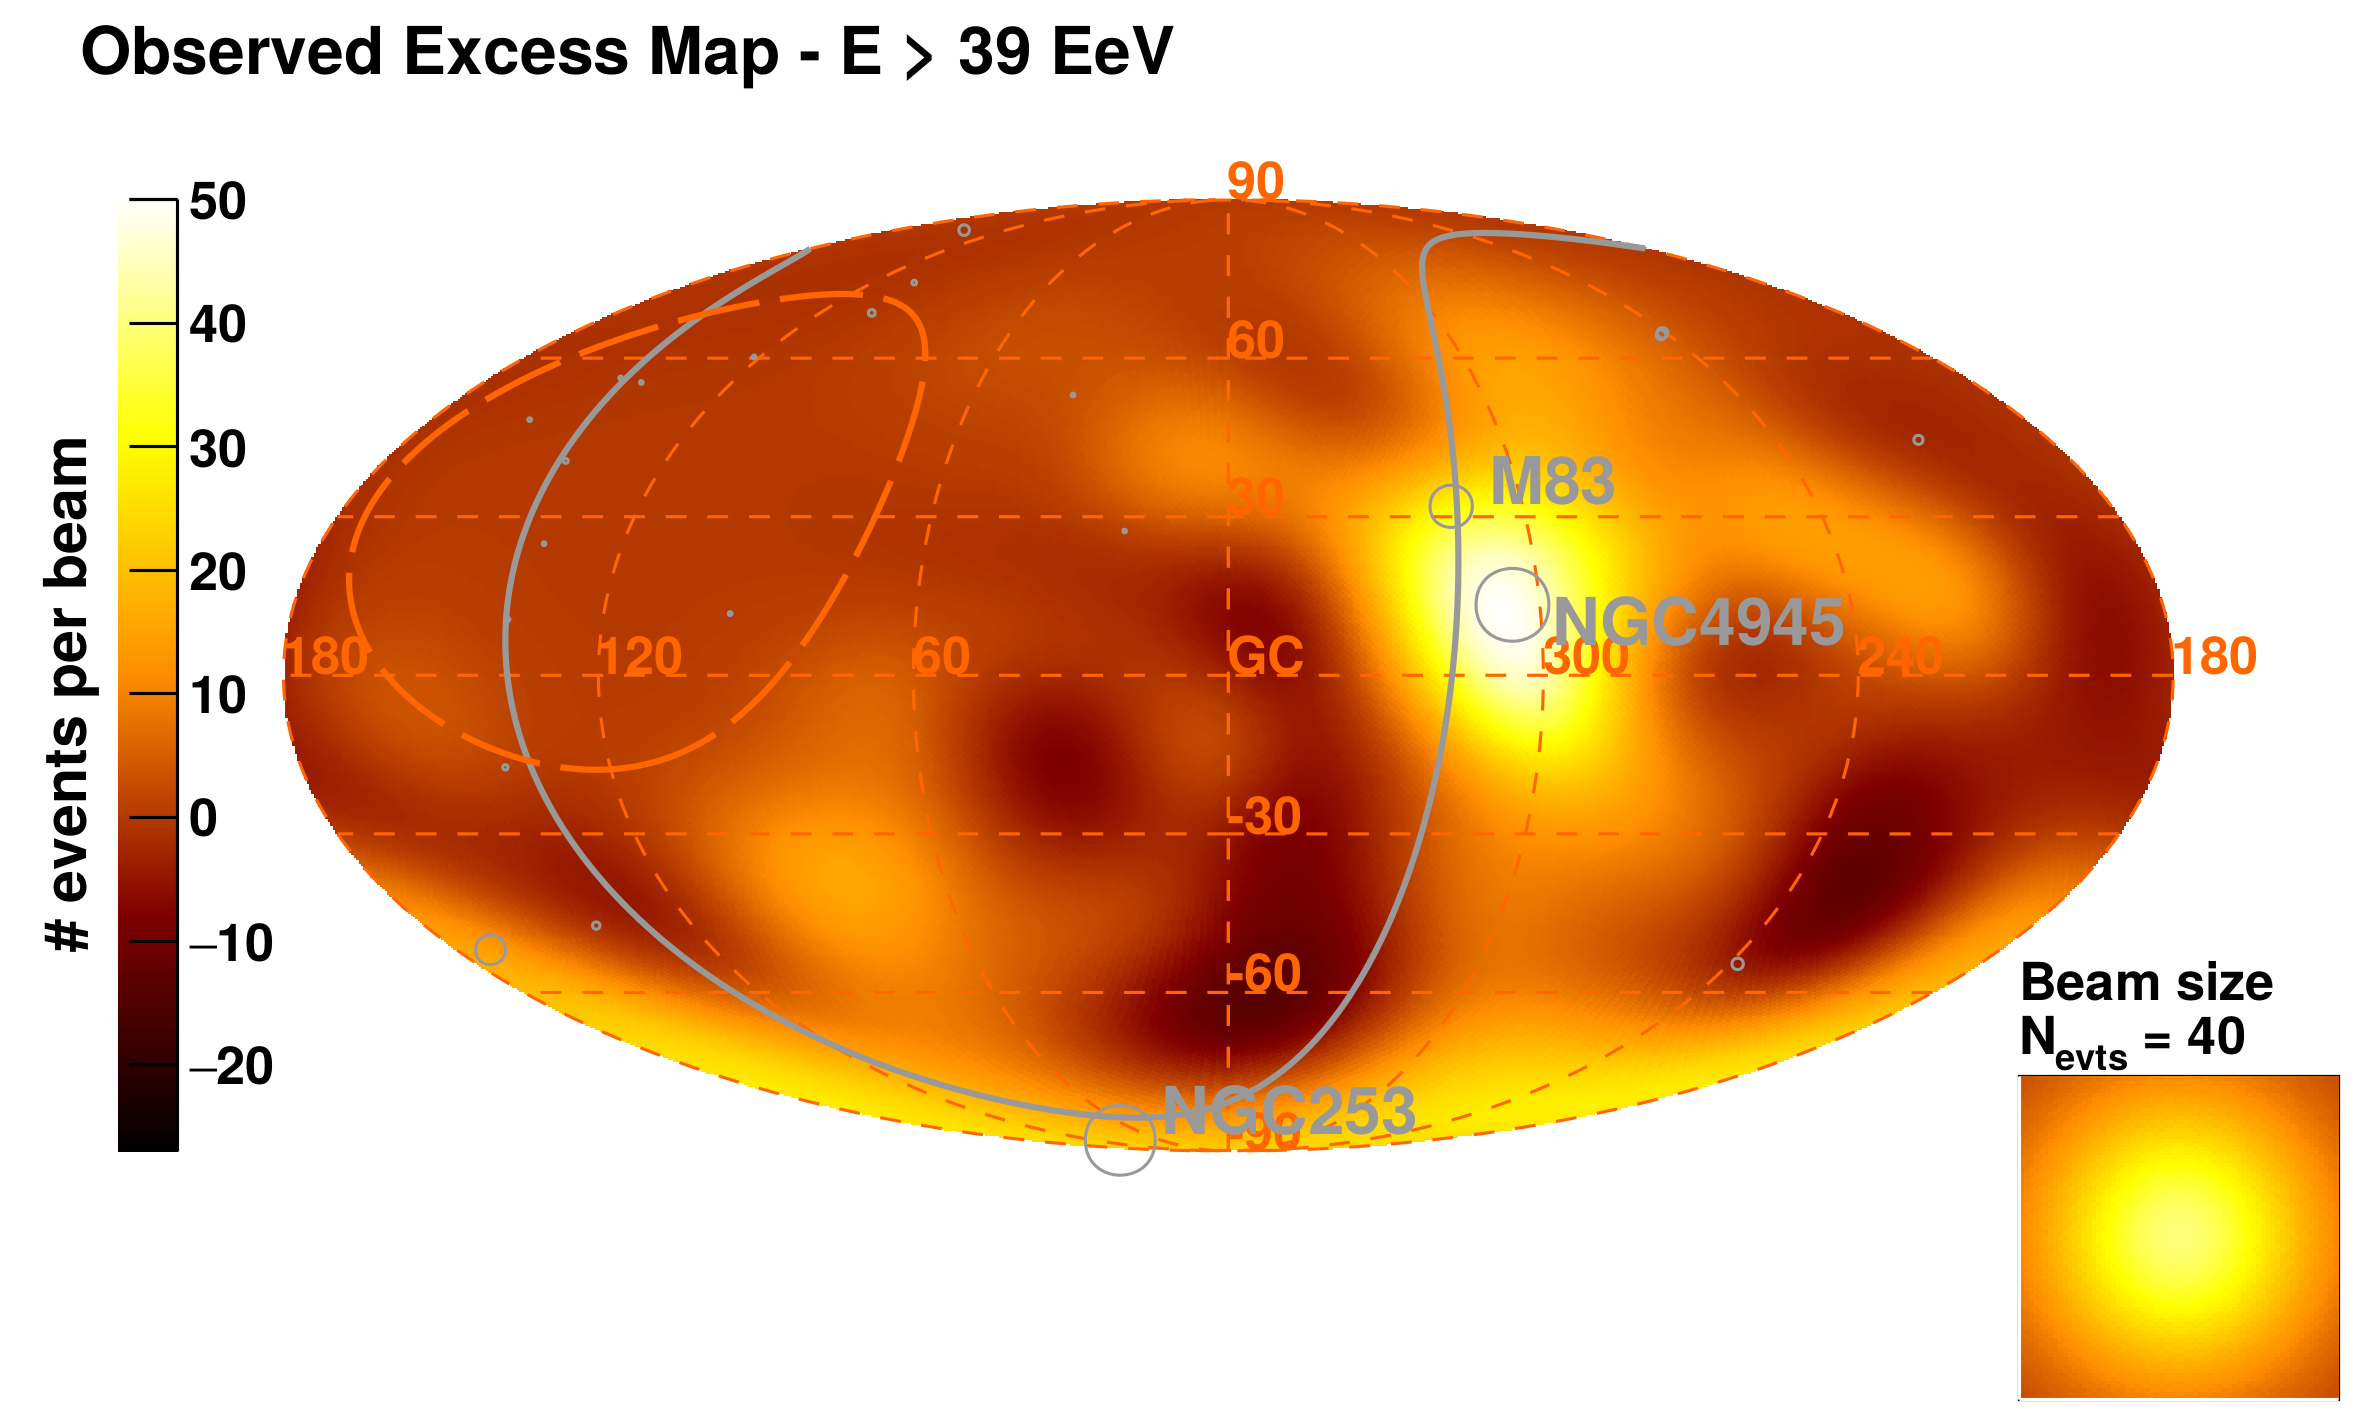
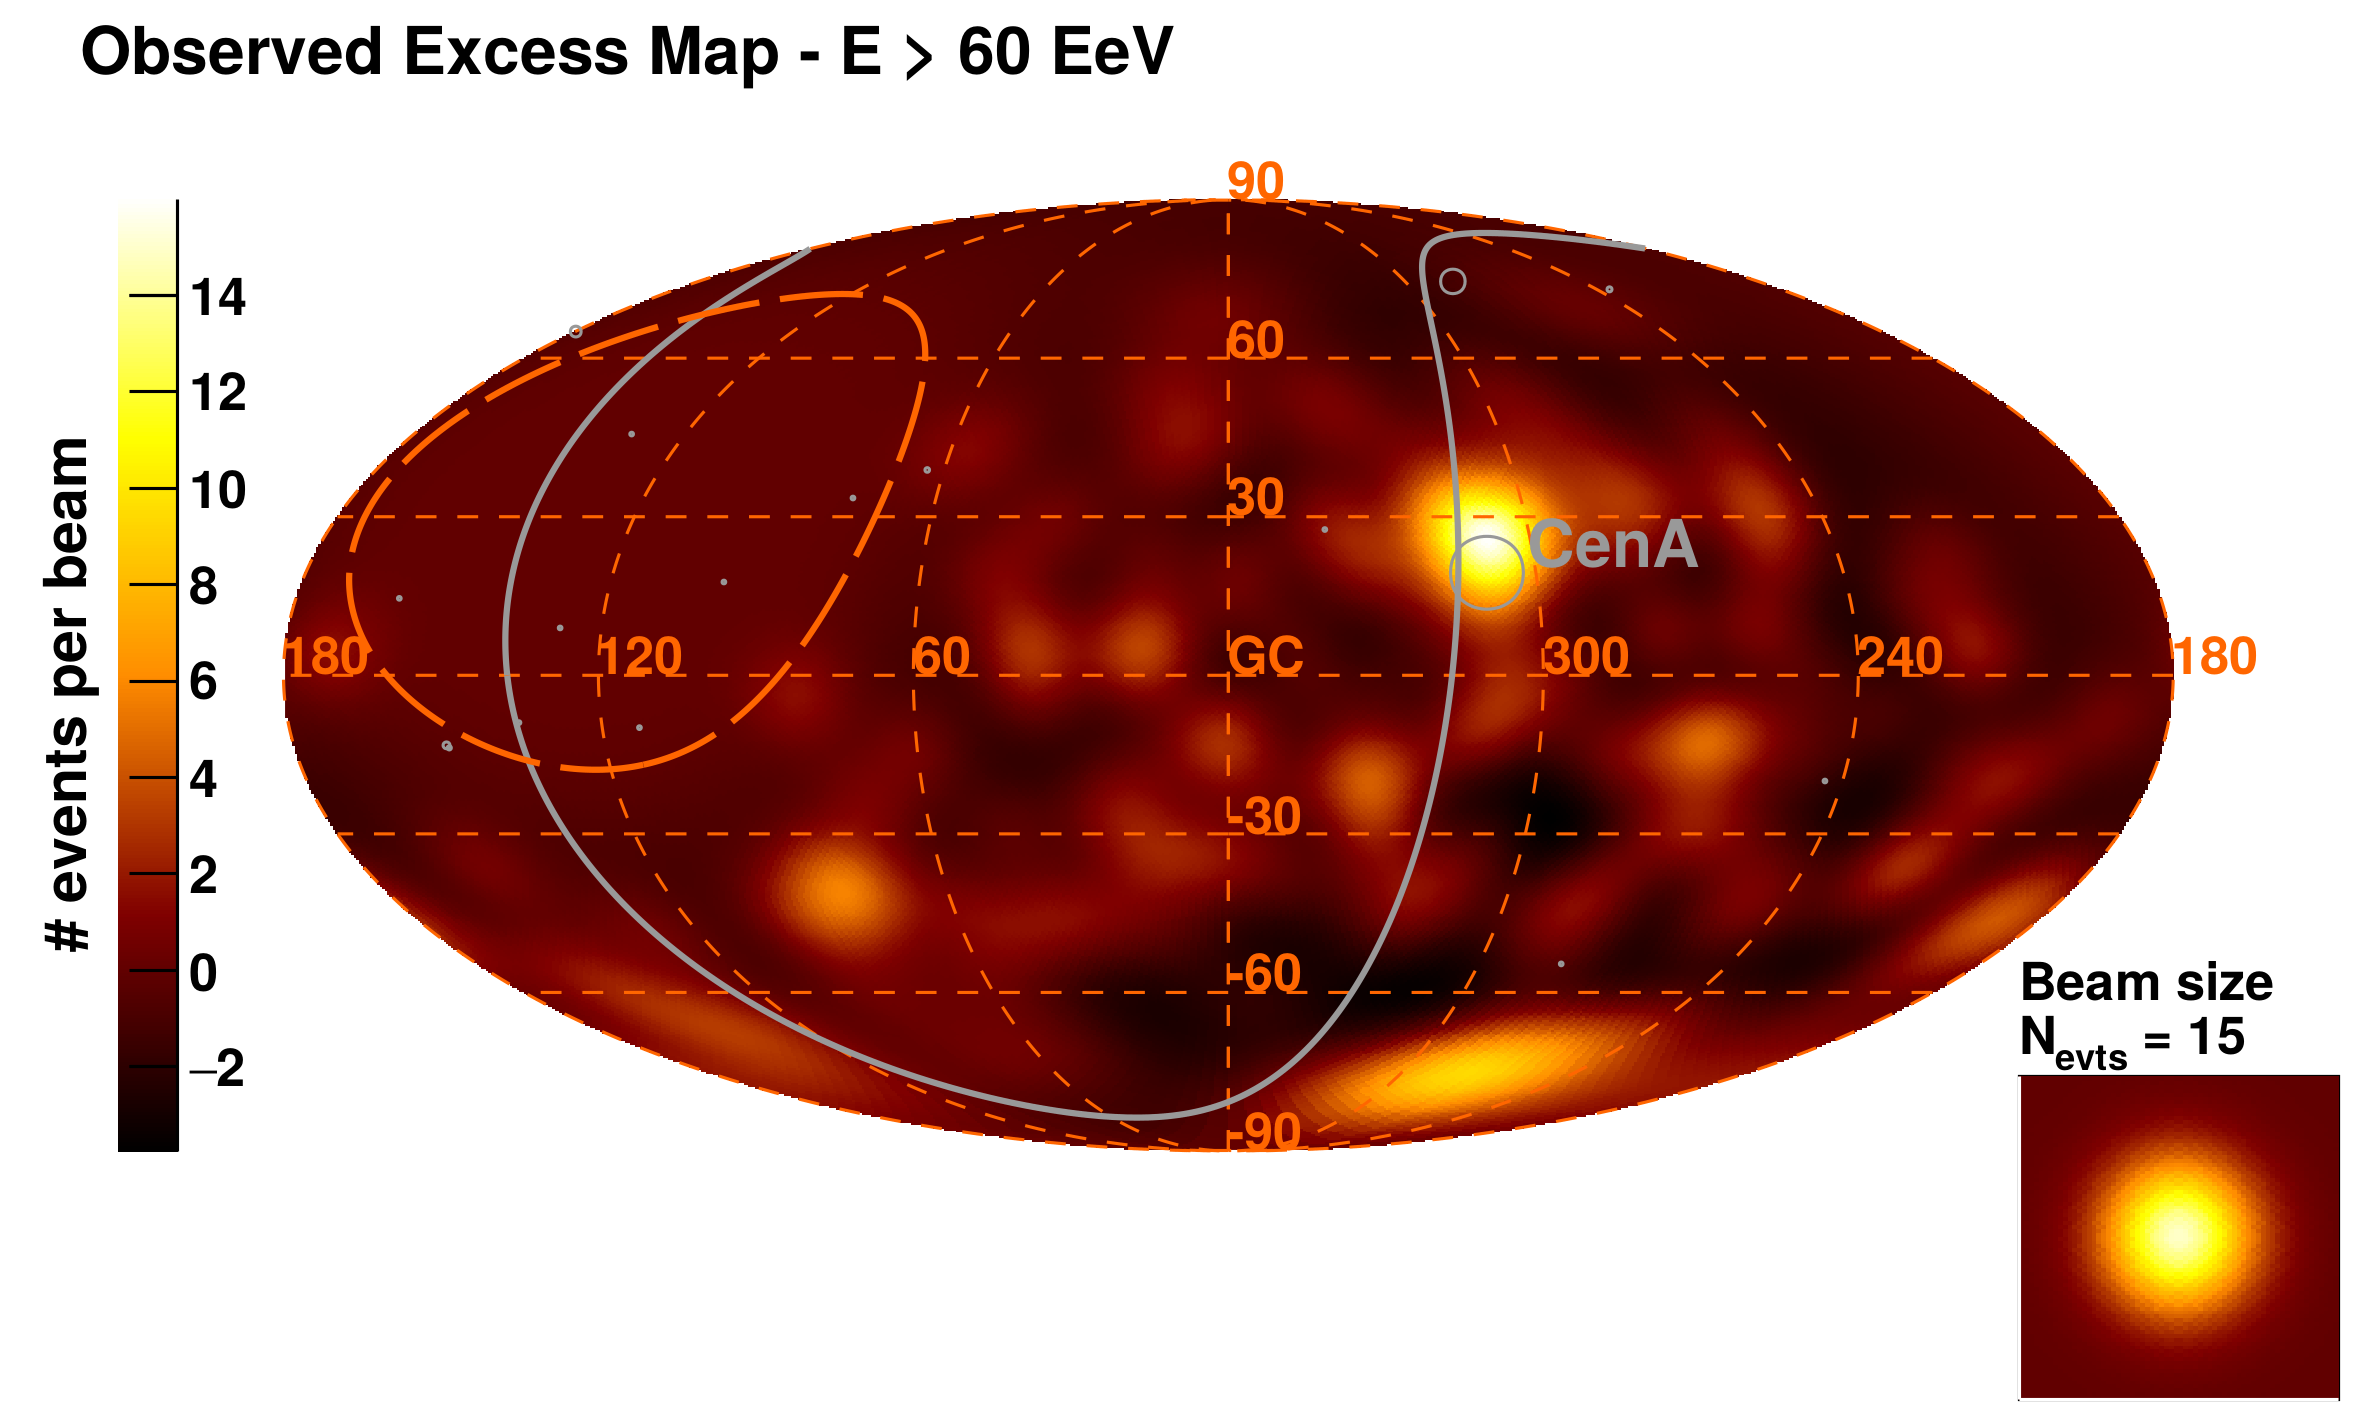
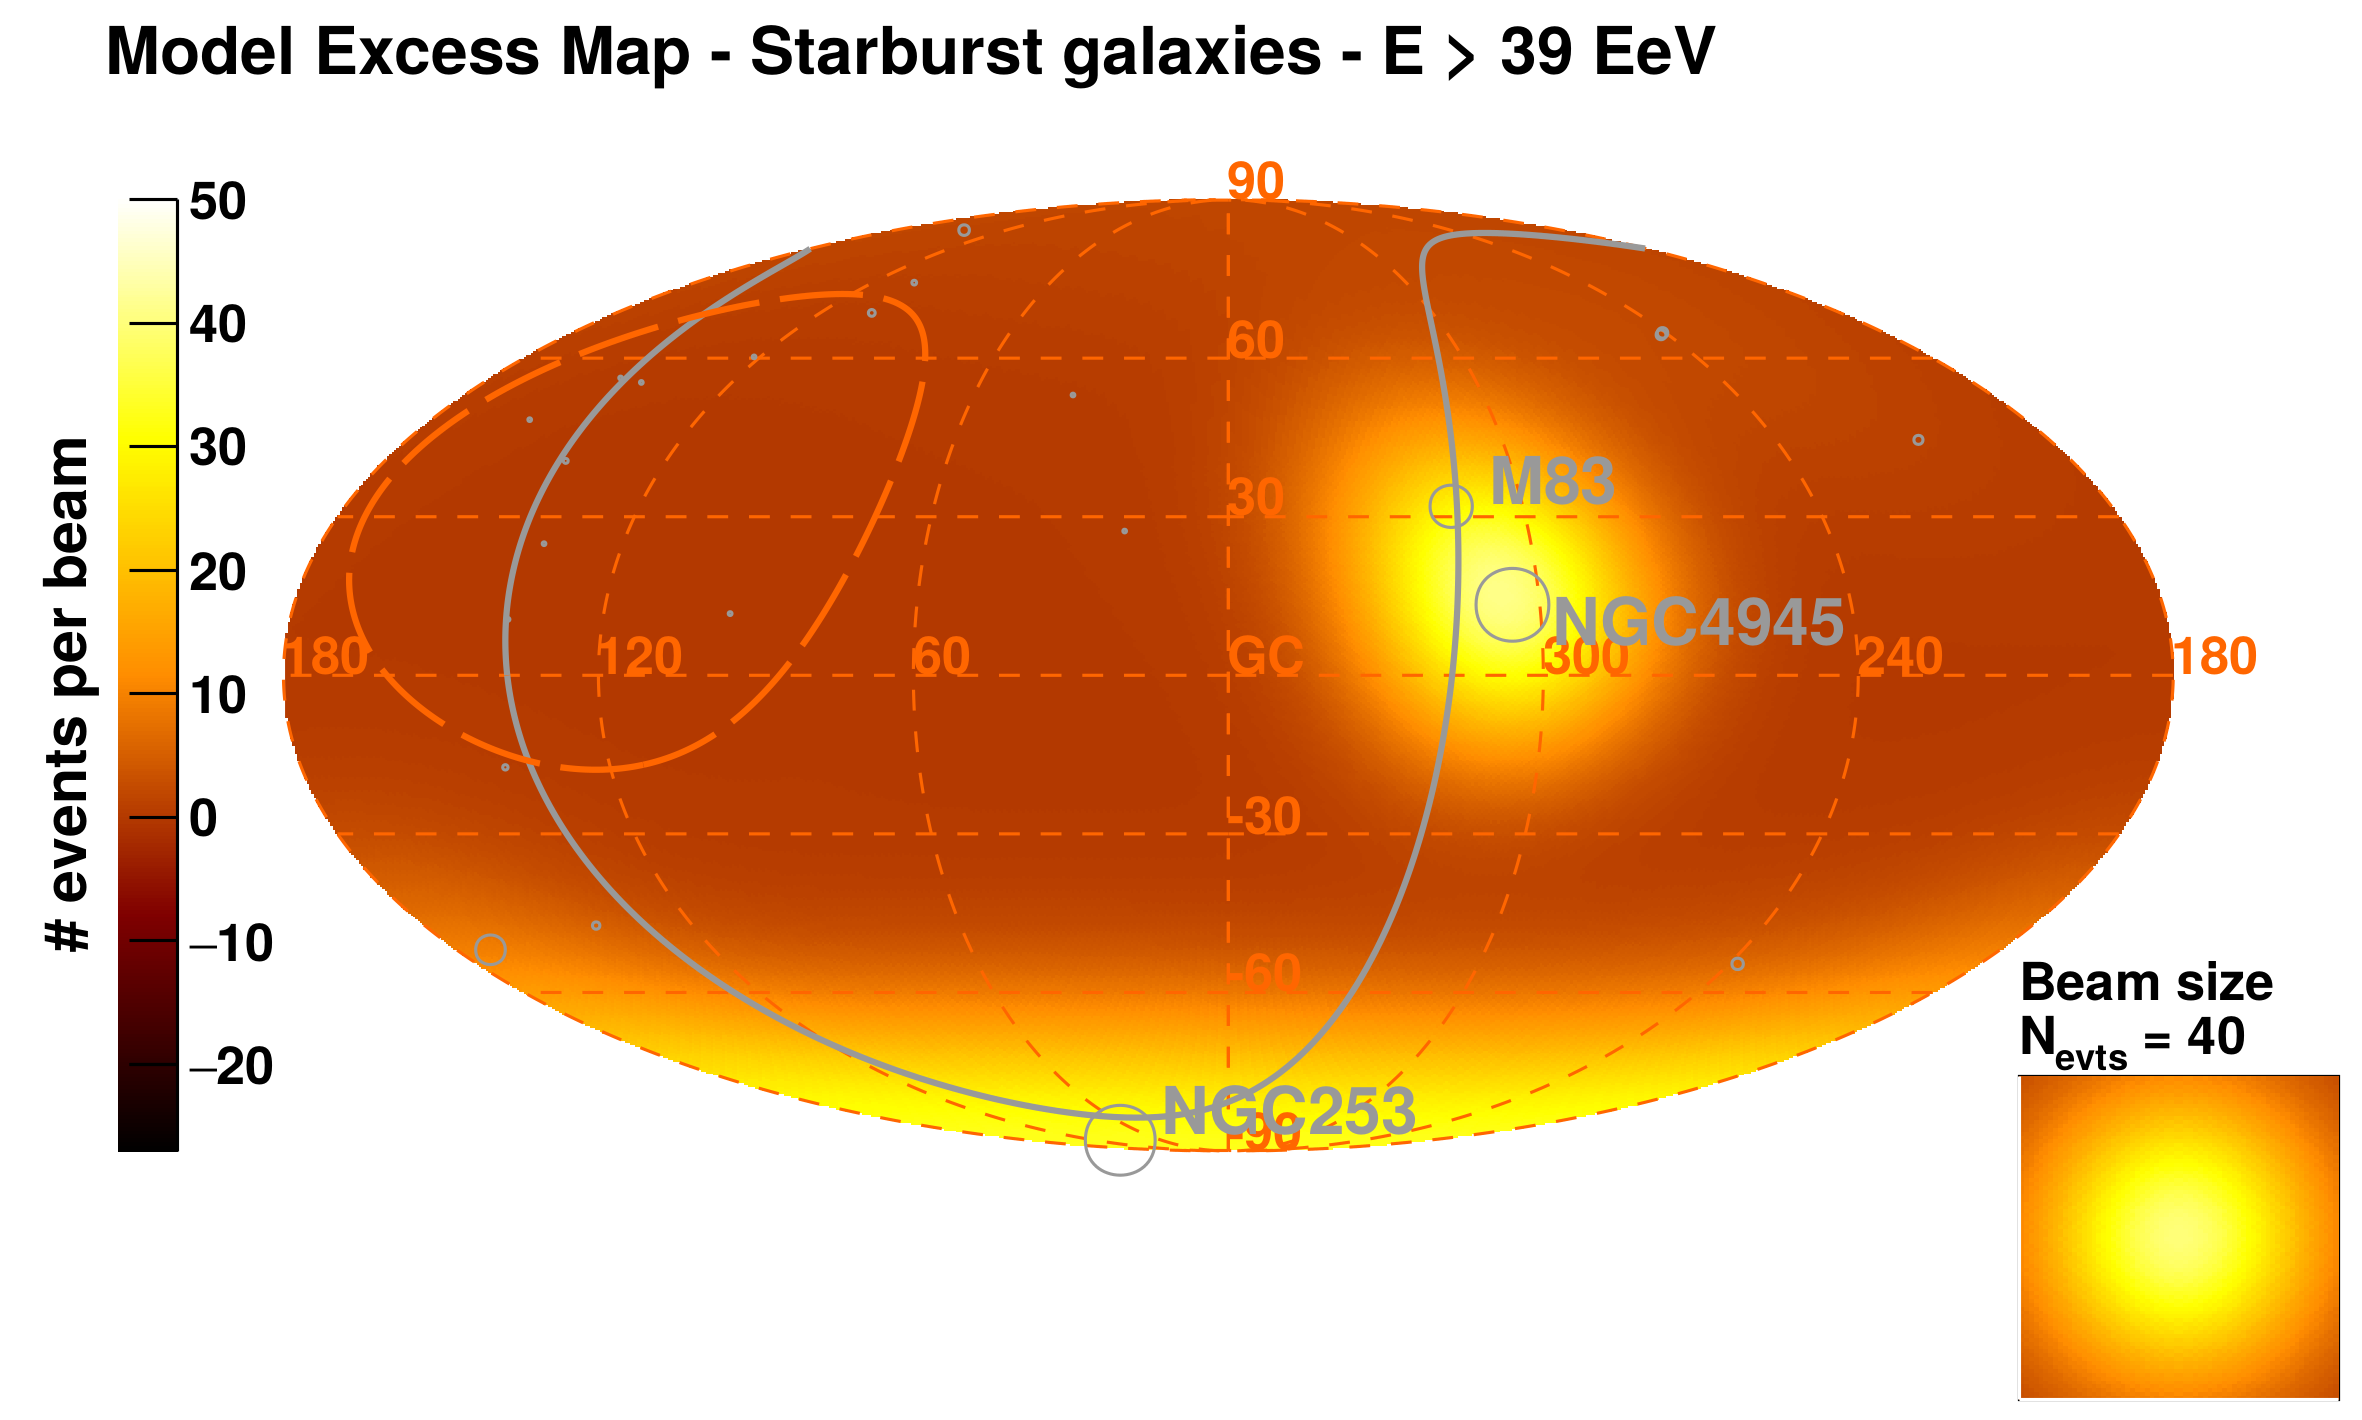
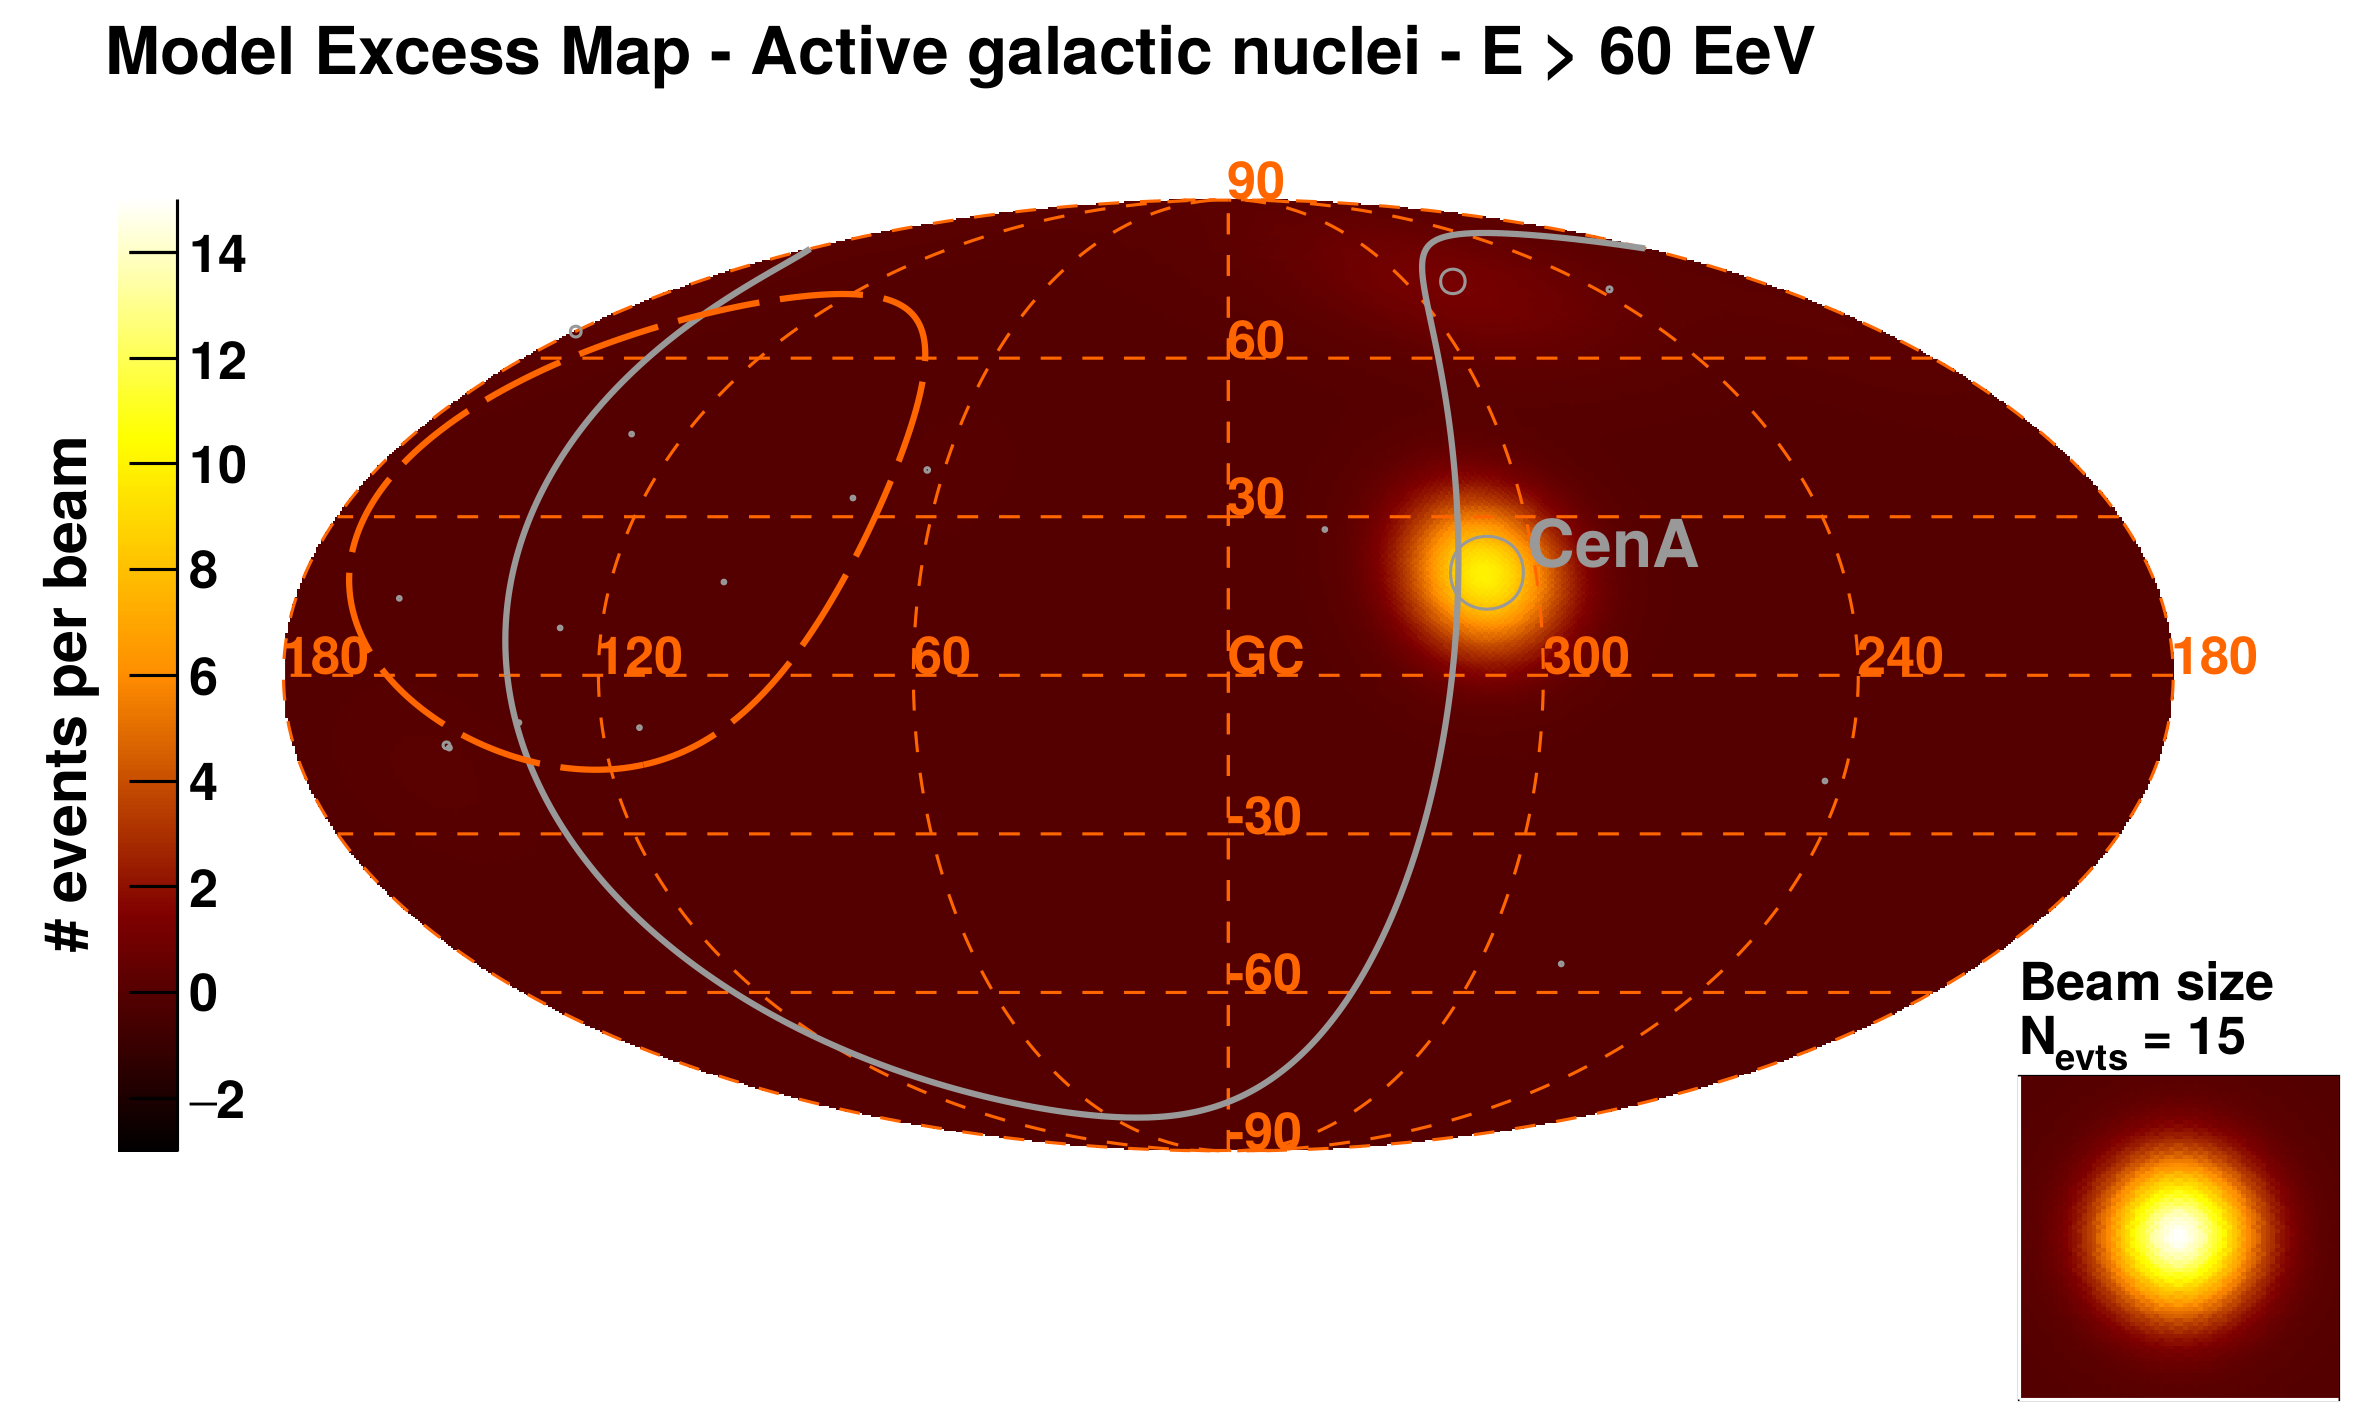
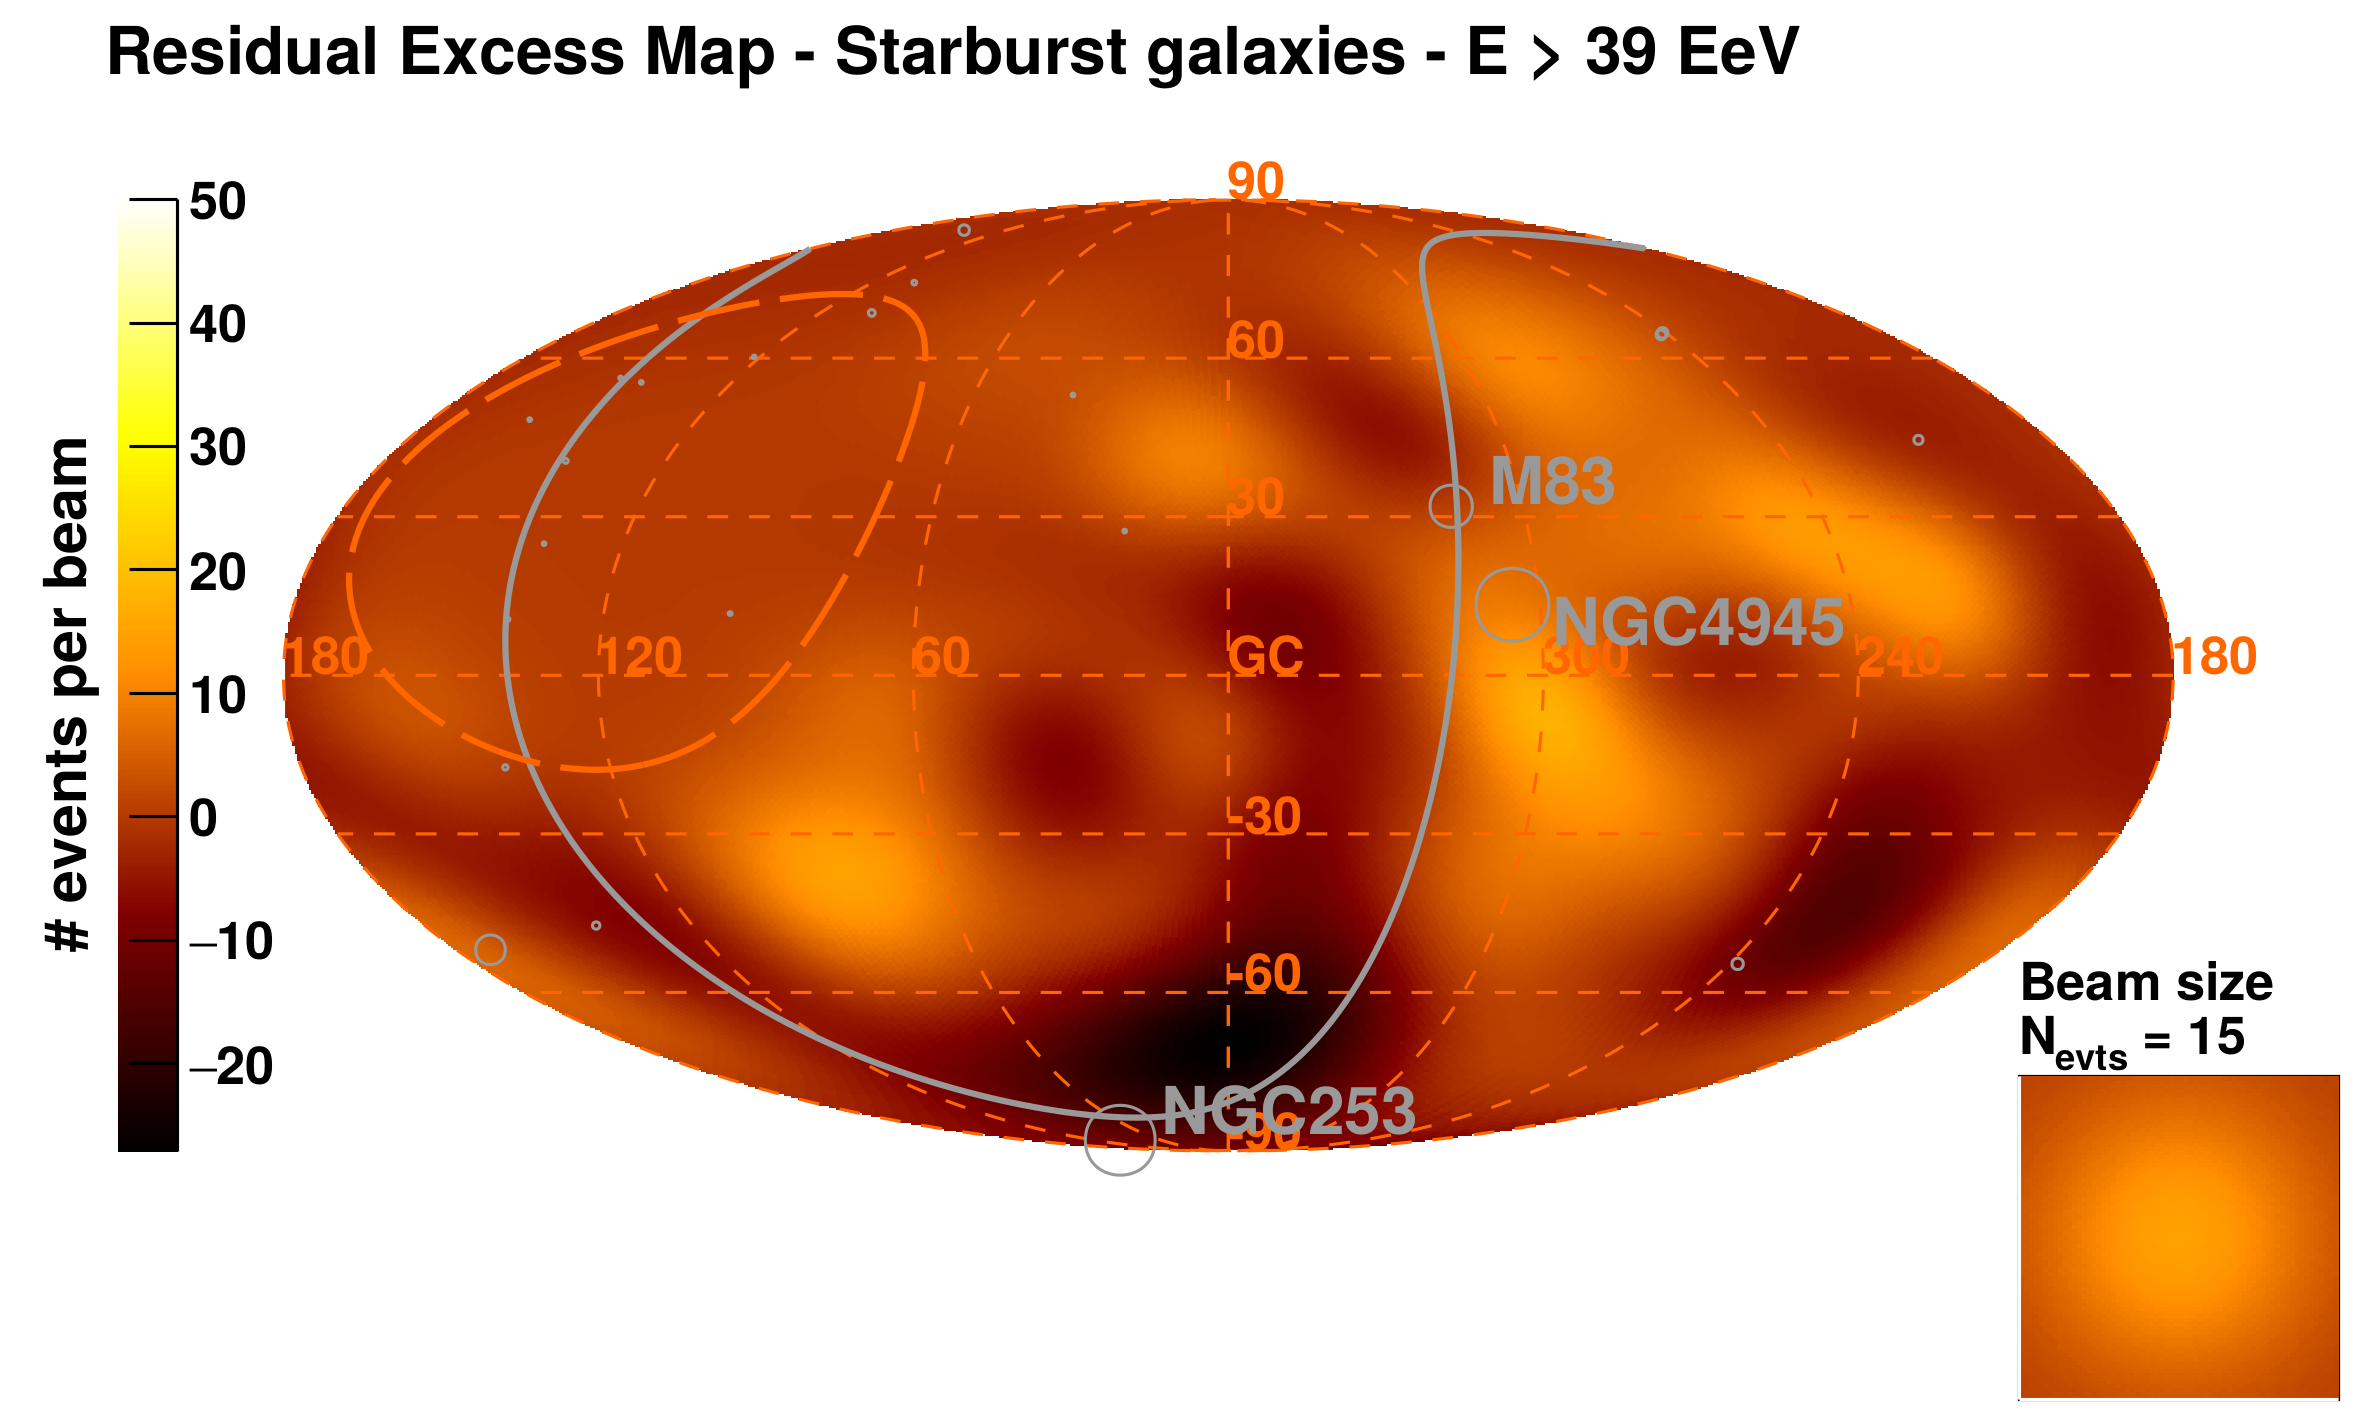
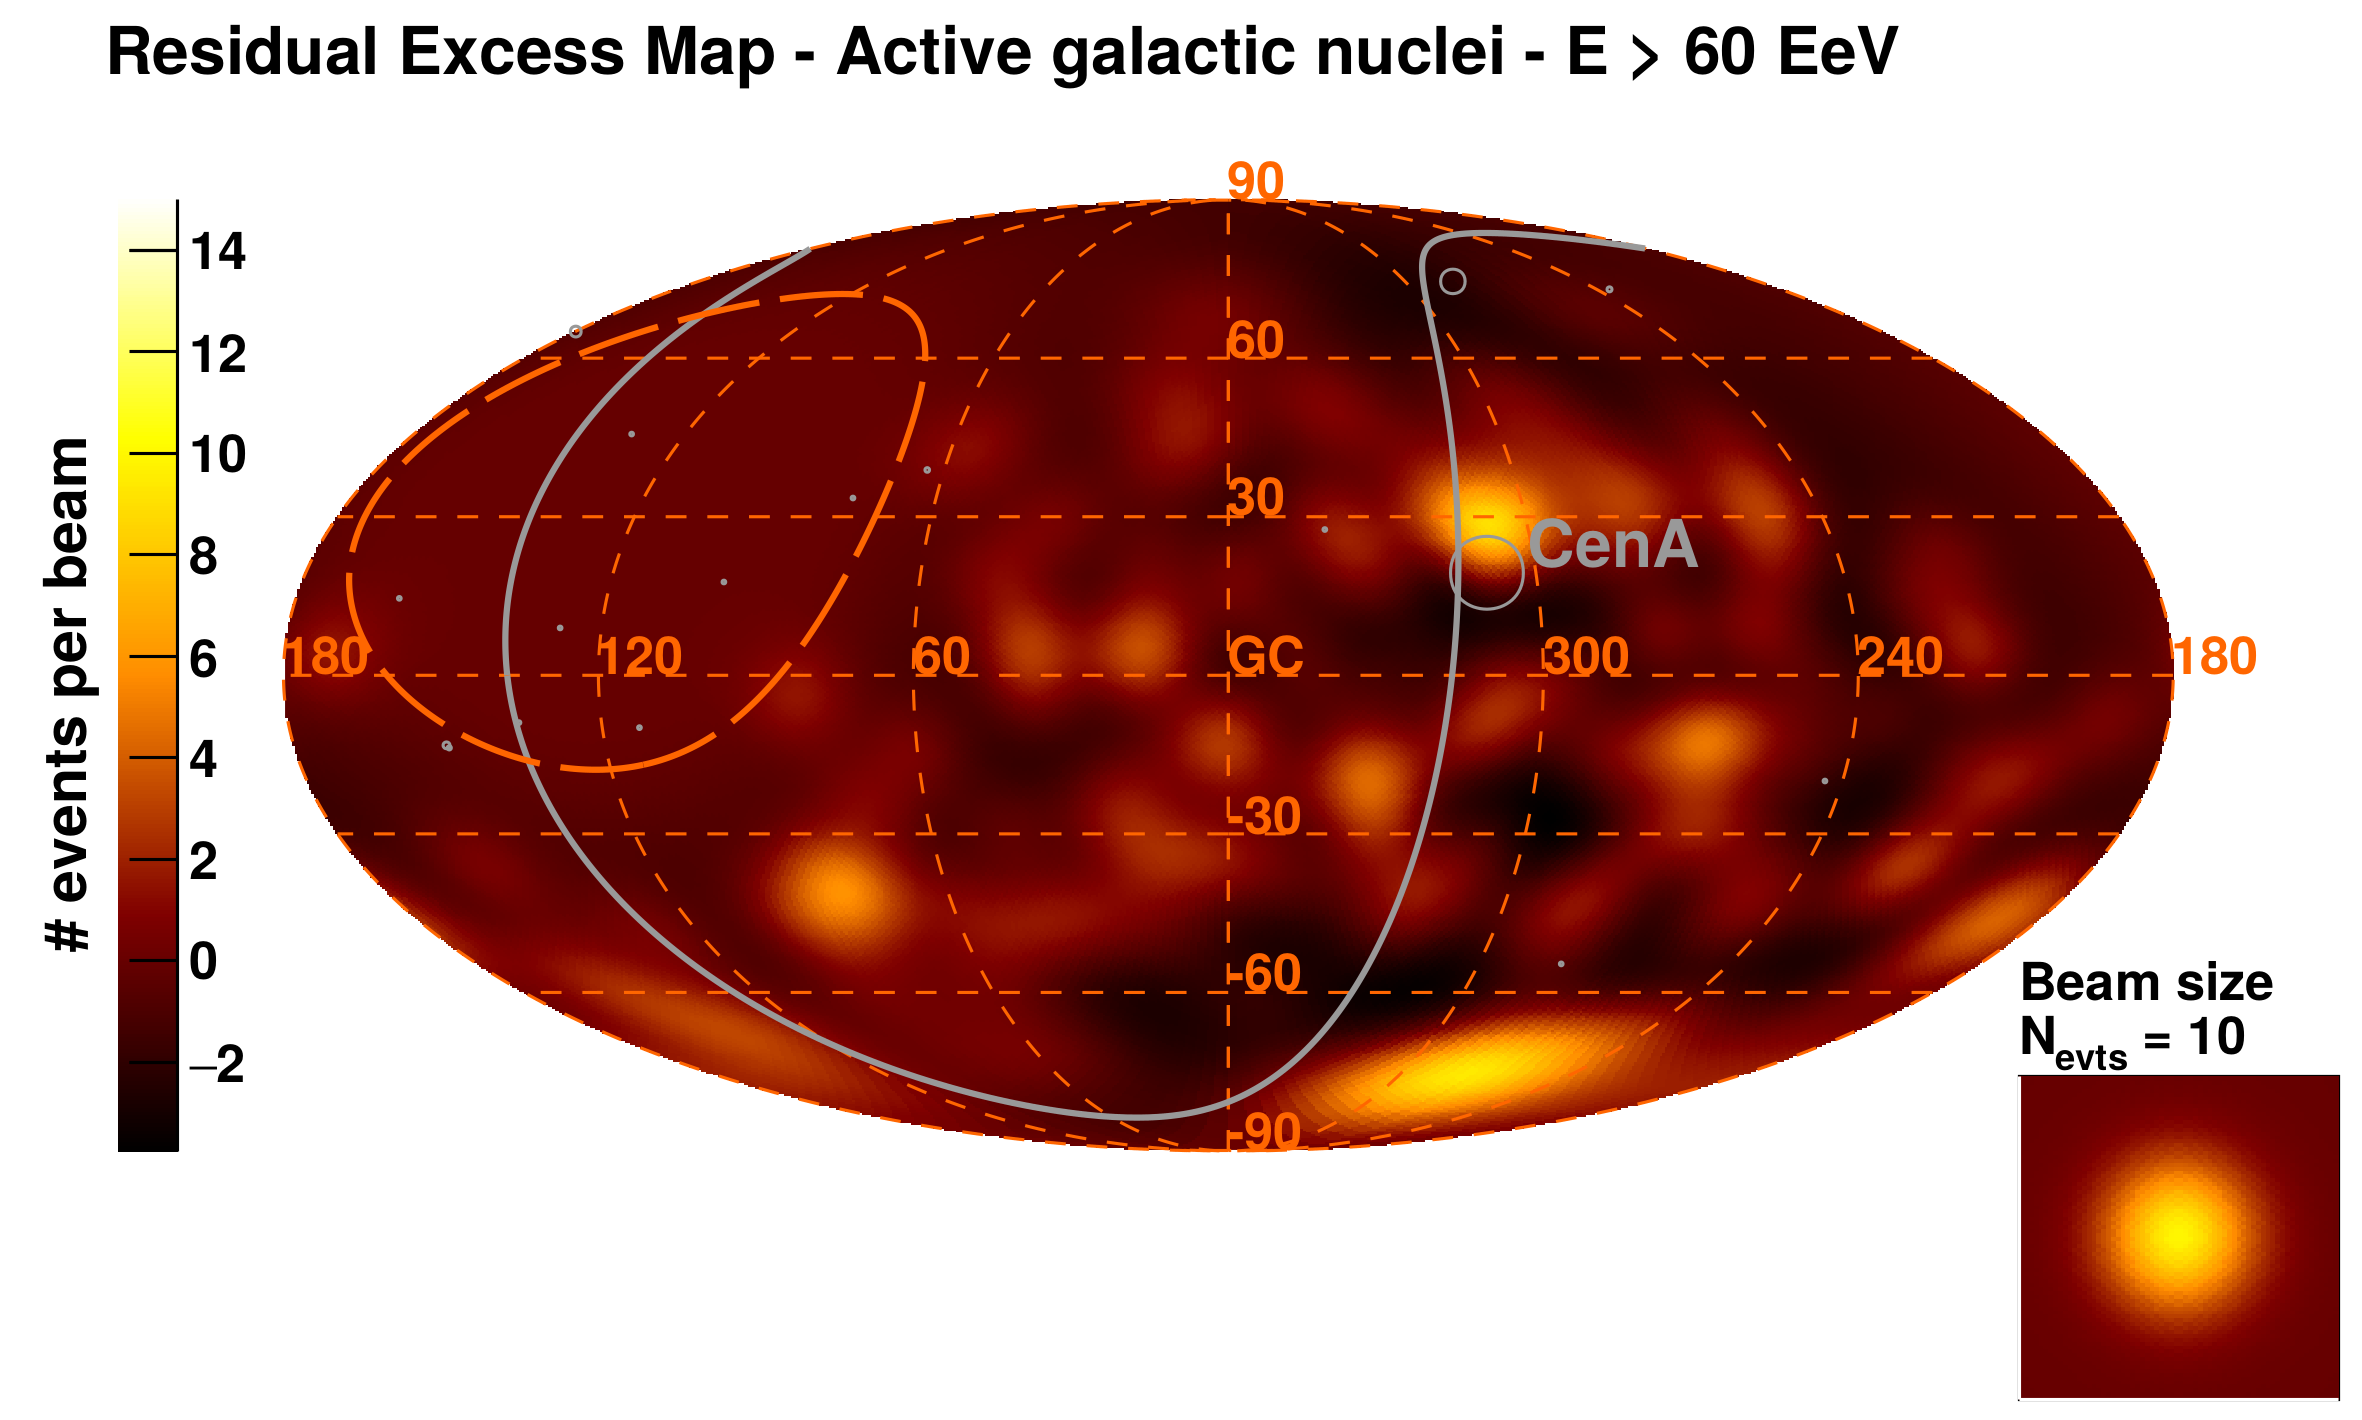
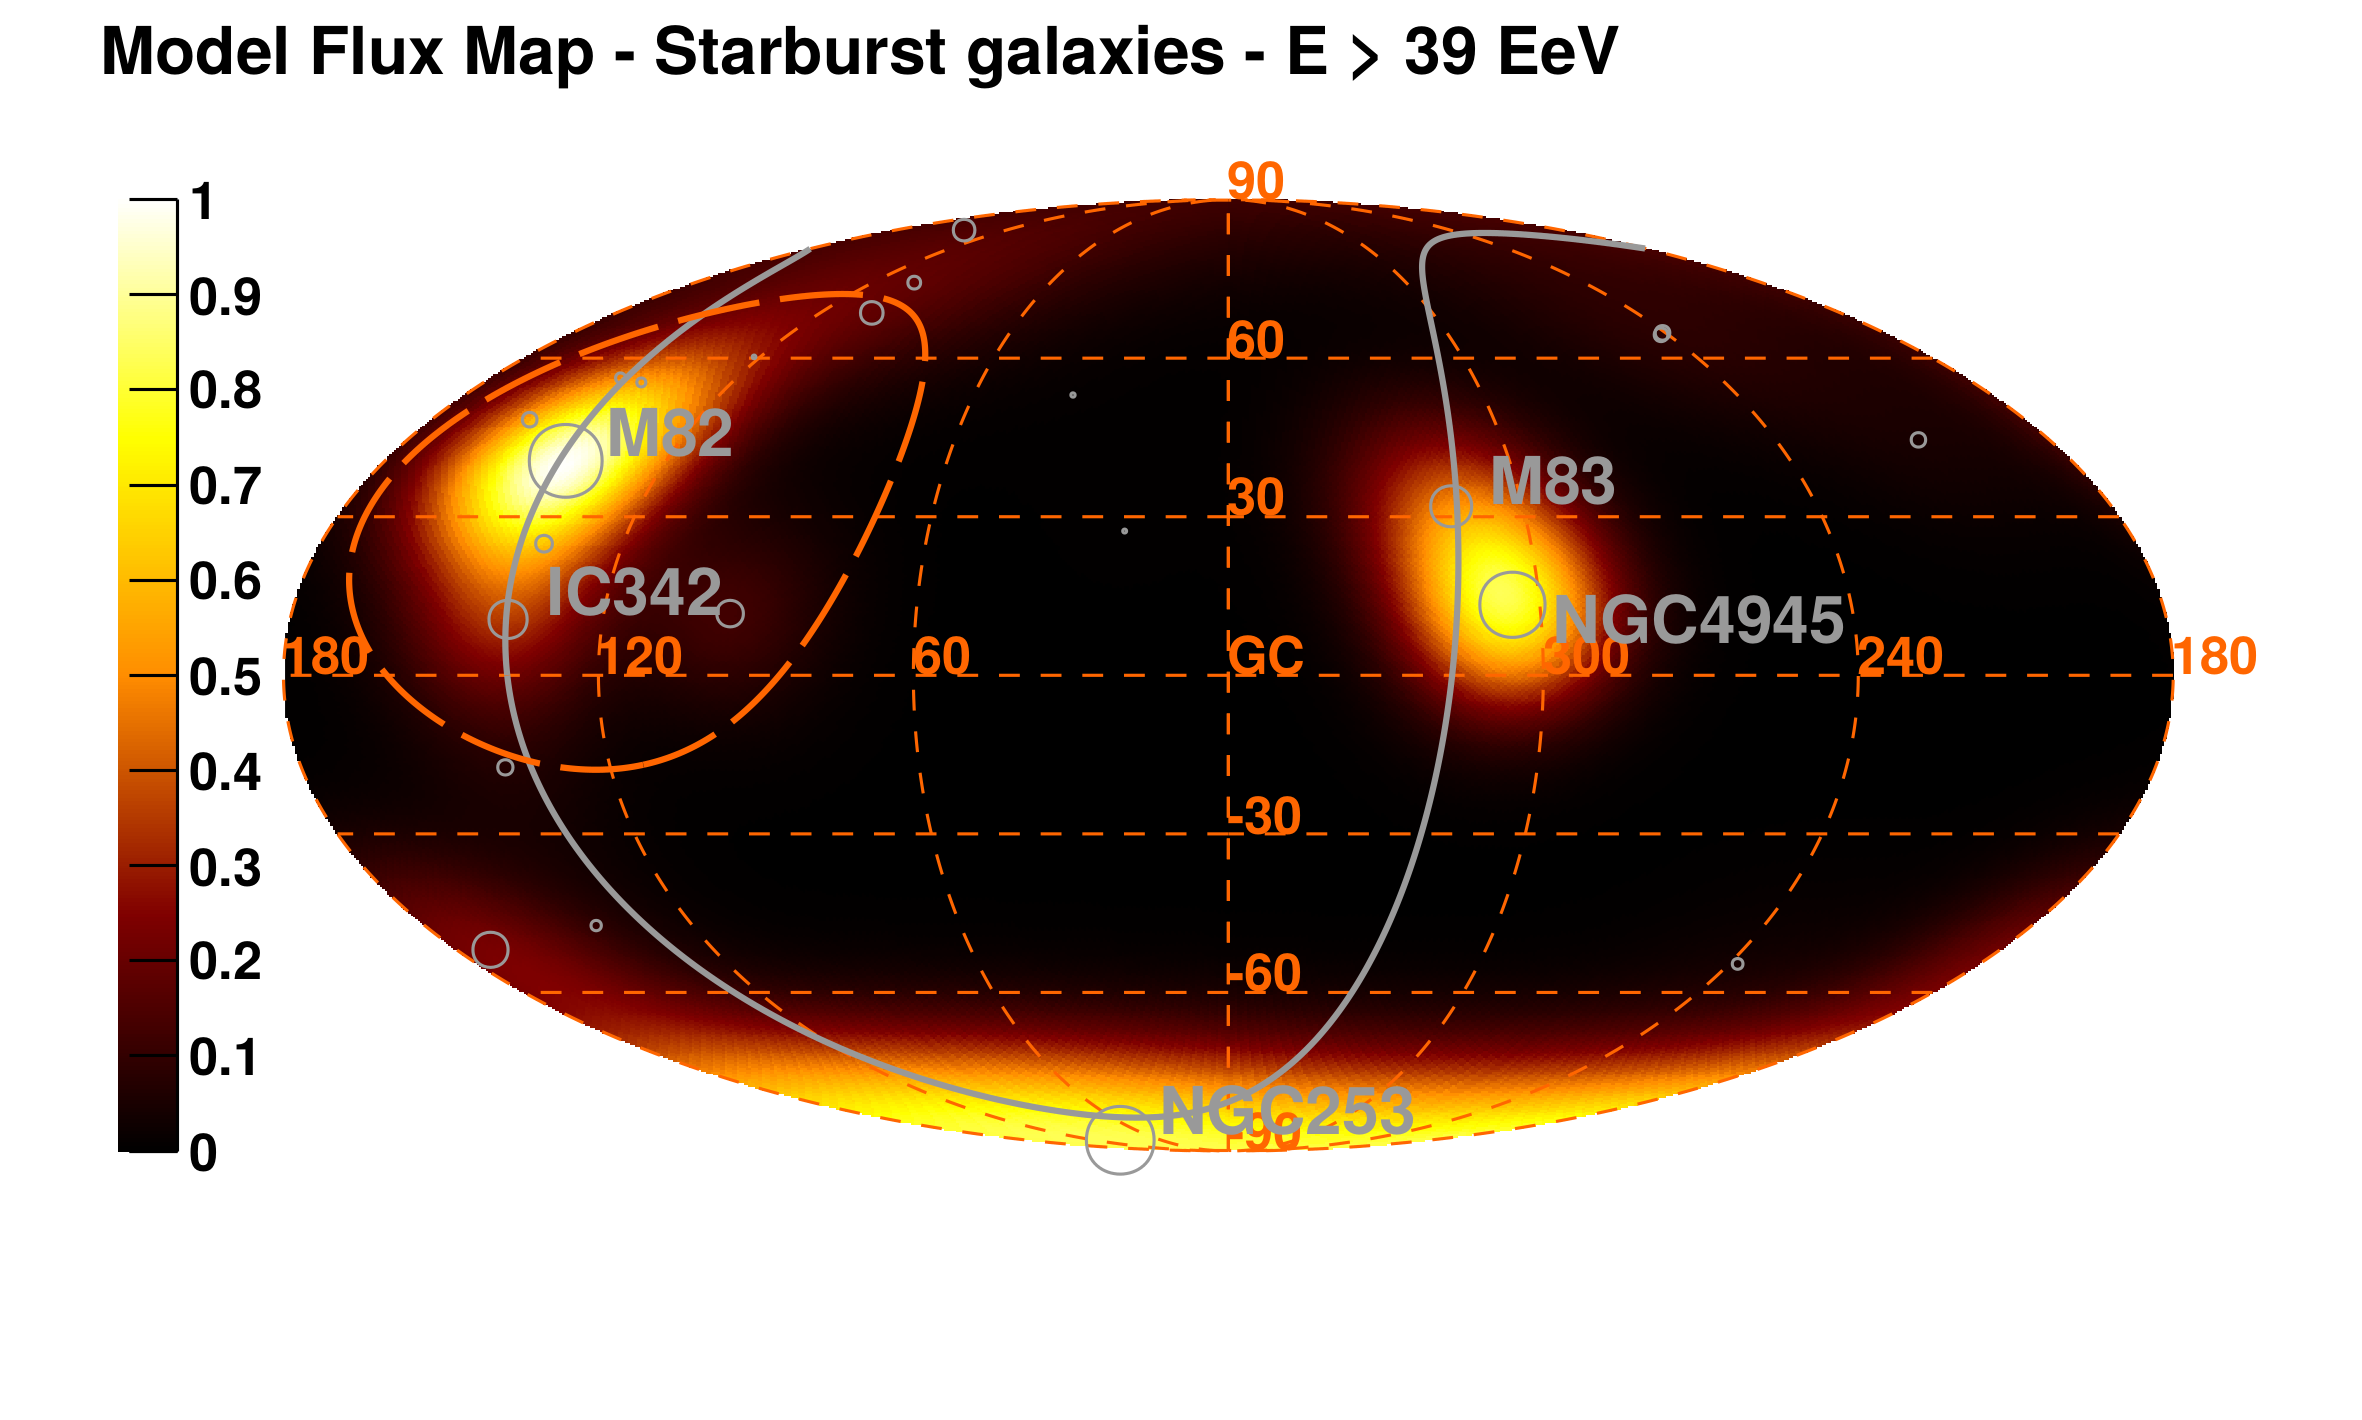
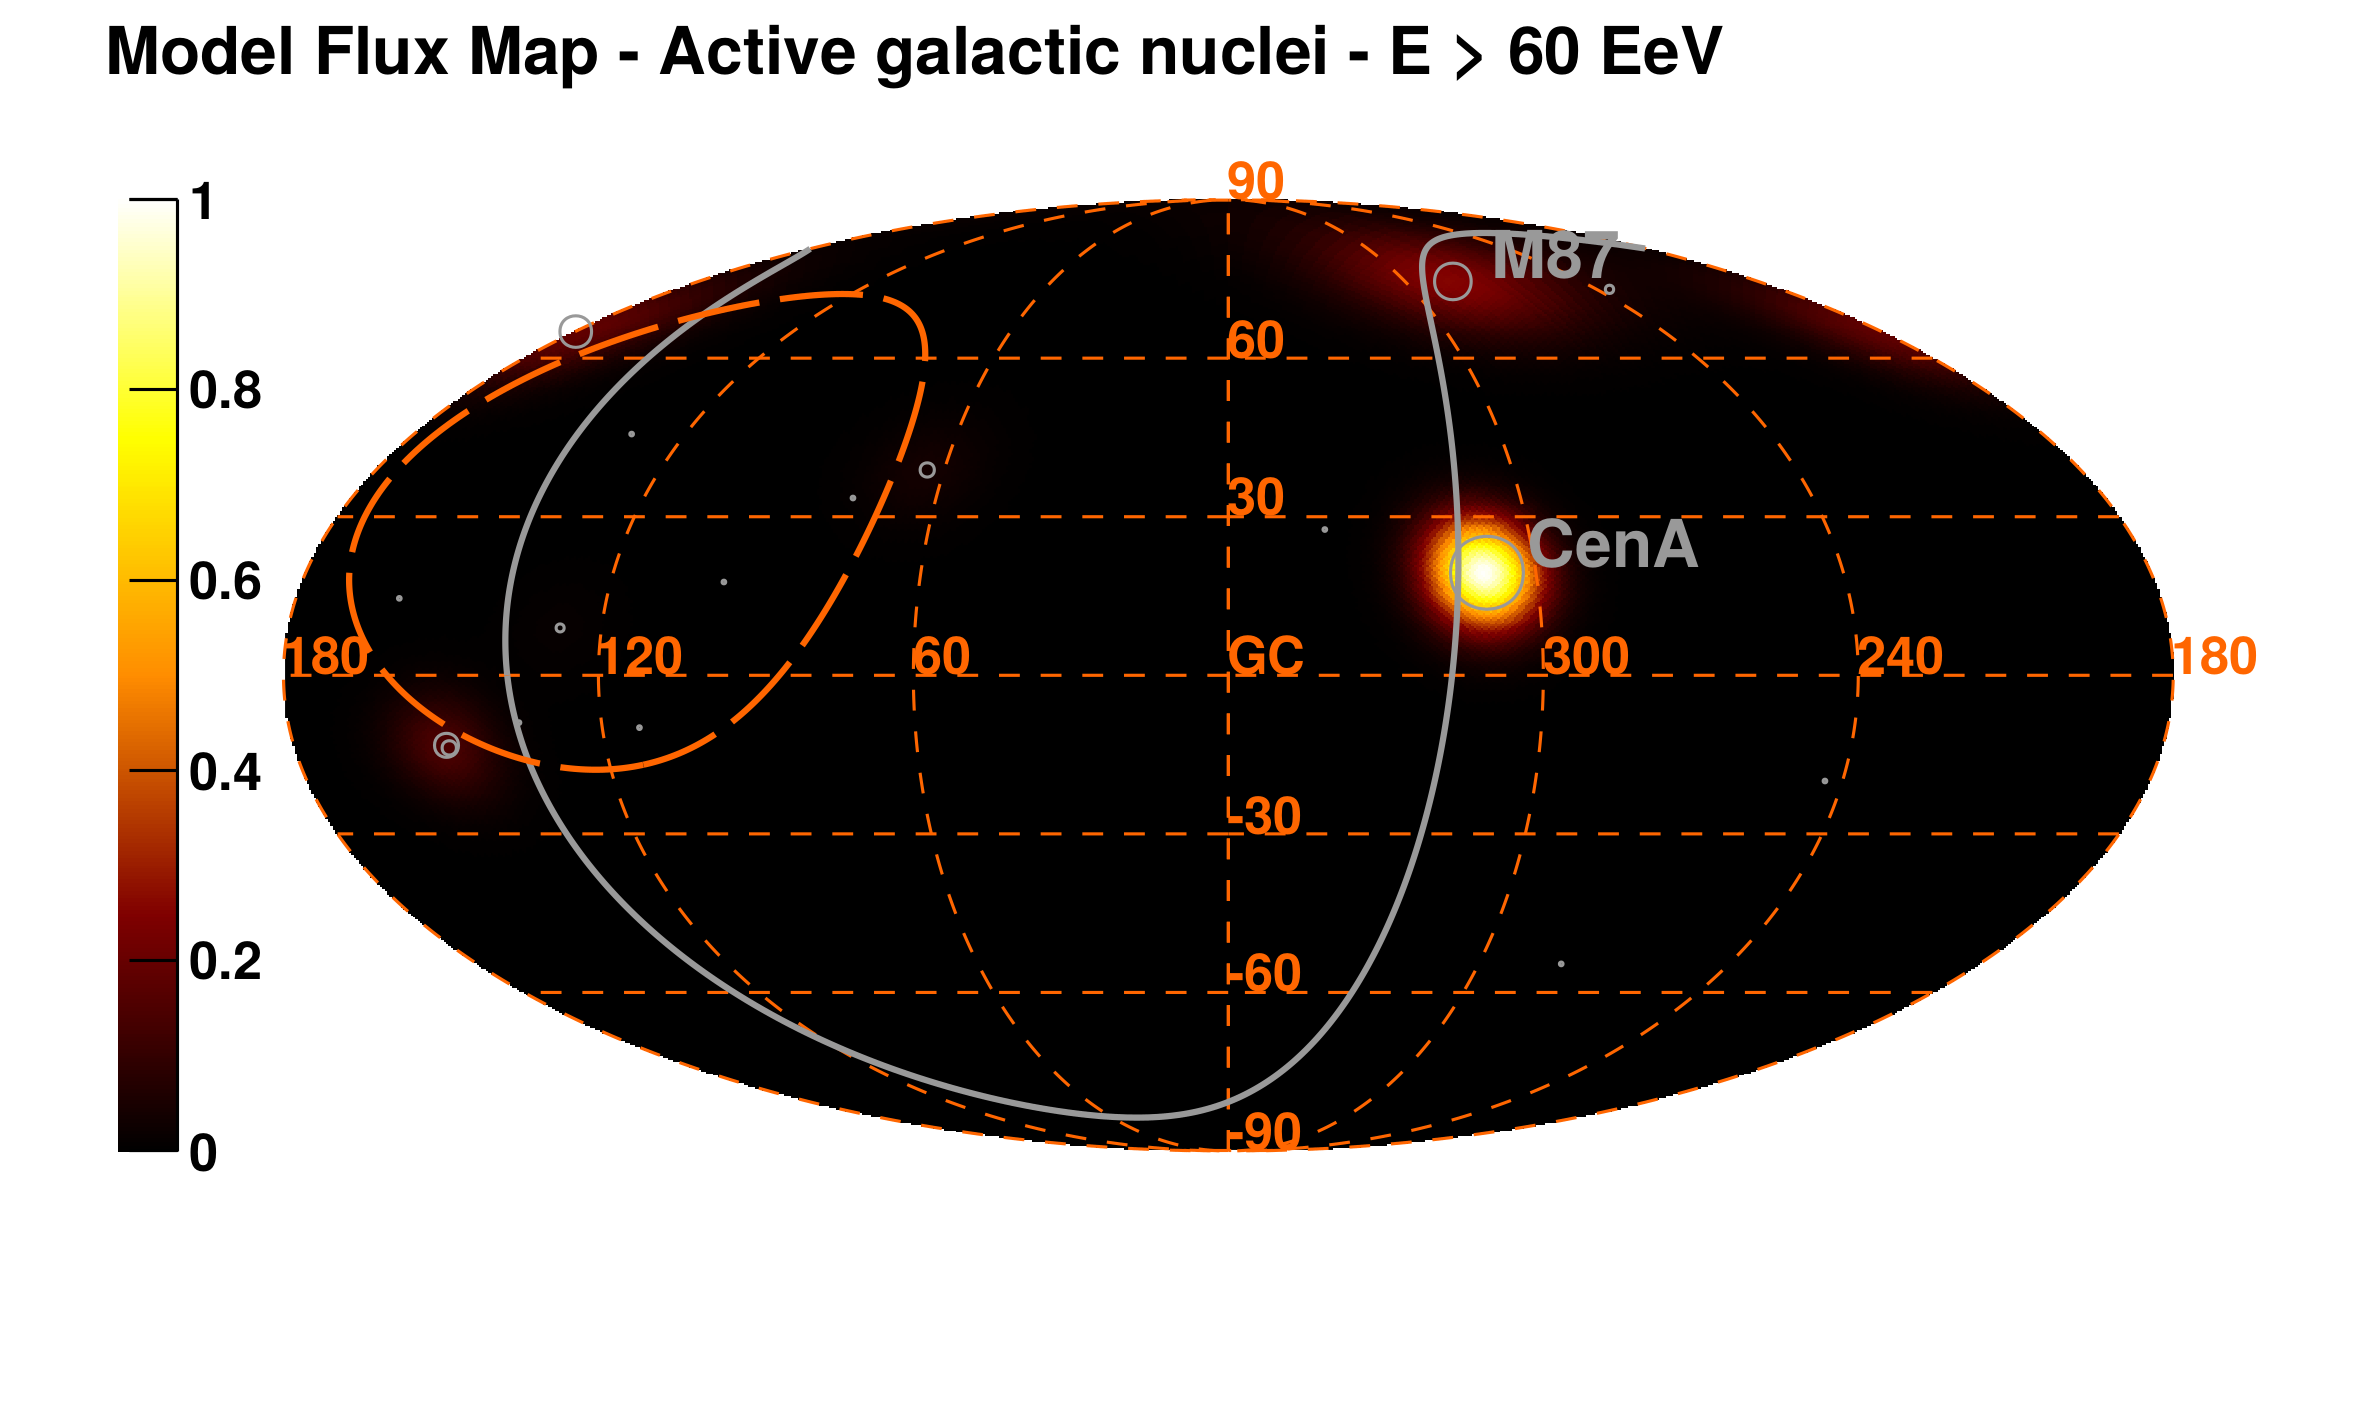
The different degrees of anisotropy obtained from each catalog can be understood from Fig. 3, top, showing a UHECR hotspot in the direction of the Centaurus A / M 83 / NGC 4945 group. The AGN model () and Swift-BAT model () are dominated by Centaurus A, which is and away from NGC 4945 and M 83, respectively. The starburst model additionally captures the UHECR excess close to the Galactic South pole, interpreted as contributions from NGC 1068 and NGC 253, yielding an increase in the anisotropy signal from to . Additional diffuse contributions from clustered sources in the 2MRS catalog are not favored by the data, resulting in the smaller deviation from isotropy.
| Test | Null | Threshold | TS | Local p-value | Post-trial | 1-sided | AGN/other | SBG | Search |
|---|---|---|---|---|---|---|---|---|---|
| hypothesis | hypothesis | energyaaFor composite model studies, no scan over the threshold energy is performed. | p-value | significance | fraction | fraction | radius | ||
| SBG + ISO | ISO | 24.9 | 4.0 | N/A | |||||
| AGN + SBG + ISO | AGN + ISO | 14.7 | N/A | 3.7 | |||||
| AGN + ISO | ISO | 15.2 | 2.7 | N/A | |||||
| AGN + SBG + ISO | SBG + ISO | 3.0 | N/A | 1.4 | bbMaximum TS reached at the boundary of the parameter space. | ||||
| Swift-BAT + ISO | ISO | 18.2 | 3.2 | N/A | |||||
| Swift-BAT + SBG + ISO | Swift-BAT + ISO | 7.8 | N/A | 2.6 | |||||
| 2MRS + ISO | ISO | 15.1 | 2.7 | N/A | |||||
| 2MRS + SBG + ISO | 2MRS + ISO | 10.4 | N/A | 3.0 |
4.3 Composite models against single populations
To compare the two distinct gamma-ray populations above their respective preferred thresholds, we investigate a composite model combining contributions from AGNs and SBGs, adopting a single search radius and leaving the fraction of events from each population free. The TS in this case is the difference between the maximum likelihood of the combined model and that of the null hypothesis of a single population at the selected energy threshold. The parameter added to the more complex model results in a distribution with one degree of freedom.
The best-fit anisotropic fractions obtained for the composite model (free search radius) are shown in Fig. 2, right. Above , the AGN-only model is disfavored by relative to a combined model with a contribution from SBGs and contribution from AGN. Above , the TS obtained with the composite model is not significantly higher than what is obtained by either model. This is illustrated in Fig. 2, right, by the agreement at the level of a model including SBGs / AGNs with a model including SBGs / AGNs above .
As summarized in Table 1, composite models including SBGs and either 2MRS or Swift-BAT sources best match the data above for fractions of events associated to SBGs and to the flux-limited samples. A advantage is found for the composite models including SBGs with respect to the 2MRS-only and Swift-BAT-only models.
5 Discussion
We have compared the arrival directions of UHECRs detected at the Pierre Auger Observatory with two distinct gamma-ray samples and two flux-limited samples of extragalactic sources. Our comparison with SBGs shows that isotropy of UHECRs is disfavored with confidence, accounting for the two free parameters and including the penalty for scanning over energy thresholds. This is the most significant evidence found in this study for anisotropy of UHECRs on an intermediate angular scale. It should be noted, however, that numerous anisotropy studies have been conducted with data from the Observatory, not only those that have been published by the Collaboration. There is no rigorous way to evaluate a statistical penalty for other searches.
The pattern of UHECR arrival directions is best matched by a model in which about of those cosmic rays arrive from directions that are clustered around the directions of bright, nearby SBGs.We evaluated the possibility of additional contributions from nearby AGNs, such as Centaurus A, and from more distant sources through a comparison with samples tracing the distribution of extragalactic matter. We find that the contribution from SBGs to the indication of anisotropy is larger than that of the alternative catalogs tested. Nonetheless, caution is required in identifying SBGs as the preferred sources prior to understanding the impact of bulk magnetic deflections.
The sky maps used in this analysis are derived without incorporating any effects of the extragalactic or Galactic magnetic fields and winds (e.g. Pshirkov et al., 2011; Jansson & Farrar, 2012; Biermann et al., 2015). In particular, the arrival directions of UHECRs from a given source are modeled by a symmetric Fisher distribution centered on the source position. We checked the plausibility of the best-fit search radius obtained above by simulating sky maps passed through the Galactic magnetic field from Jansson & Farrar (2012), including a random component with a coherence length of as in Erdmann et al. (2016). For large deflections, UHECRs from a given SBG can leak in the direction of a neighboring source. The three composition scenarios discussed in Sec. 3.3 yield reconstructed search radii of , bracketing the observed radius of . The agreement is considered satisfactory given the uncertainties in our knowledge of the composition above and of the deflections by the Galactic magnetic field (Unger & Farrar, 2017). Further studies aiming at possibly improving the model maps including deflections are underway.
It can be seen in Fig. 3, bottom, that M 82 is expected to be one of the dominant sources in the full-sky starburst model presented here. Its declination of N is outside the exposure of the Observatory but is covered in the Northern Hemisphere by the Telescope Array (Abu-Zayyad et al., 2012). As noted e.g. by Fang et al. (2014) and He et al. (2016), the excess of events observed at the Telescope Array (Abbasi et al., 2014) has some overlap with the position of M 82, as well as with the position of the blazar Mkn 421 that would be a bright Northern source in a low-attenuation scenario.
An analysis of full-sky data from the Pierre Auger Observatory and the Telescope Array may provide a more powerful test of the starburst and AGN models by probing all production regions of UHECRs. Combining the data is complicated, however, due to the spurious anisotropies that may be induced by possible mismatches in the relative exposures and/or systematic differences in the nominal energy scales used at each observatory. First attempts to conduct such surveys are being made (Di Matteo et al., 2017).
Additional exposure will bring better constraints on the brightest sources. At the same time, an instrumentation upgrade of the Observatory is being deployed on the water-Cherenkov detectors adding a planar plastic scintillator of area to each of them (Aab et al., 2016b). The upgrade will provide mass-sensitive observables for each shower enabling charge-discriminated studies with a duty cycle of nearly . Excluding highly charged nuclei from the analysis could eliminate a quasi-isotropic background that may mask the signature of individual sources imprinted by protons and other low-charge nuclei.
Finally, a large-scale dipolar anisotropy has been discovered above (Aab et al., 2017b). While a direct connection between the large and intermediate angular-scale patterns has not yet been identified, the emergence of anisotropies at ultra-high energy will certainly trigger further investigations of scenarios underlying the production of UHECRs.
References
- Aab et al. (2014a) Aab, A., Abreu, P., Aglietta, M., et al. 2014a, Phys. Rev. D, 90, 122006
- Aab et al. (2014b) —. 2014b, J. Cosmology Astropart. Phys, 8, 019
- Aab et al. (2015a) —. 2015a, J. Cosmology Astropart. Phys, 8, 049
- Aab et al. (2015b) —. 2015b, ApJ, 804, 15
- Aab et al. (2015c) —. 2015c, Nucl. Instrum. Meth., A798, 172
- Aab et al. (2016a) —. 2016a, Physics Letters B, 762, 288
- Aab et al. (2016b) —. 2016b, ArXiv e-prints, arXiv:1604.03637 [astro-ph.IM]
- Aab et al. (2017a) —. 2017a, J. Cosmology Astropart. Phys, 4, 038
- Aab et al. (2017b) —. 2017b, Science, 357, 1266
- Abbasi et al. (2014) Abbasi, R. U., Abe, M., Abu-Zayyad, T., et al. 2014, ApJ, 790, L21
- Abraham et al. (2010) Abraham, J., Abreu, P., Aglietta, M., et al. 2010, Nuclear Instruments and Methods in Physics Research A, 613, 29
- Abreu et al. (2010) Abreu, P., Aglietta, M., Ahn, E. J., et al. 2010, Astroparticle Physics, 34, 314
- Abu-Zayyad et al. (2012) Abu-Zayyad, T., Aida, R., Allen, M., et al. 2012, Nuclear Instruments and Methods in Physics Research A, 689, 87
- Acero et al. (2015) Acero, F., Ackermann, M., Ajello, M., et al. 2015, ApJS, 218, 23
- Ackermann et al. (2012) Ackermann, M., Ajello, M., Allafort, A., et al. 2012, ApJ, 755, 164
- Ackermann et al. (2016) Ackermann, M., Ajello, M., Atwood, W. B., et al. 2016, ApJS, 222, 5
- Aloisio et al. (2012) Aloisio, R., Boncioli, D., Grillo, A. F., Petrera, S., & Salamida, F. 2012, J. Cosmology Astropart. Phys, 10, 007
- Alves Batista et al. (2016) Alves Batista, R., Dundovic, A., Erdmann, M., et al. 2016, J. Cosmology Astropart. Phys, 5, 038
- Anchordoqui et al. (1999) Anchordoqui, L. A., Romero, G. E., & Combi, J. A. 1999, Phys. Rev. D, 60, 103001
- Becker et al. (2009) Becker, J. K., Biermann, P. L., Dreyer, J., & Kneiske, T. M. 2009, ArXiv e-prints, arXiv:0901.1775 [astro-ph.HE]
- Biermann et al. (2015) Biermann, P. L., Caramete, L. I., Meli, A., et al. 2015, ASTRA Proceedings, 2, 39
- Biermann et al. (2016) Biermann, P. L., Caramete, L. I., Fraschetti, F., et al. 2016, ArXiv e-prints, arXiv:1610.00944 [astro-ph.HE]
- Dermer & Razzaque (2010) Dermer, C. D., & Razzaque, S. 2010, ApJ, 724, 1366
- Di Matteo et al. (2017) Di Matteo, A., et al. 2017, in Proceedings UHECR2016 - submitted
- Domínguez et al. (2011) Domínguez, A., Primack, J. R., Rosario, D. J., et al. 2011, MNRAS, 410, 2556
- Erdmann et al. (2016) Erdmann, M., Müller, G., Urban, M., & Wirtz, M. 2016, Astroparticle Physics, 85, 54
- Erdoǧdu et al. (2006) Erdoǧdu, P., Huchra, J. P., Lahav, O., et al. 2006, MNRAS, 368, 1515
- Fang et al. (2014) Fang, K., Fujii, T., Linden, T., & Olinto, A. V. 2014, ApJ, 794, 126
- Fisher (1953) Fisher, R. 1953, Proceedings of the Royal Society of London Series A, 217, 295
- Greisen (1966) Greisen, K. 1966, Physical Review Letters, 16, 748
- Hayashida et al. (2013) Hayashida, M., Stawarz, Ł., Cheung, C. C., et al. 2013, ApJ, 779, 131
- He et al. (2016) He, H.-N., Kusenko, A., Nagataki, S., et al. 2016, Phys. Rev. D, 93, 043011
- Hillas (1984) Hillas, A. M. 1984, ARA&A, 22, 425
- Huchra et al. (2012) Huchra, J. P., Macri, L. M., Masters, K. L., et al. 2012, ApJS, 199, 26
- Jansson & Farrar (2012) Jansson, R., & Farrar, G. R. 2012, ApJ, 761, L11
- Peng et al. (2016) Peng, F.-K., Wang, X.-Y., Liu, R.-Y., Tang, Q.-W., & Wang, J.-F. 2016, ApJ, 821, L20
- Perley et al. (2016) Perley, D. A., Niino, Y., Tanvir, N. R., Vergani, S. D., & Fynbo, J. P. U. 2016, Space Sci. Rev., 202, 111
- Pshirkov et al. (2011) Pshirkov, M. S., Tinyakov, P. G., Kronberg, P. P., & Newton-McGee, K. J. 2011, ApJ, 738, 192
- Romero et al. (1996) Romero, G. E., Combi, J. A., Perez Bergliaffa, S. E., & Anchordoqui, L. A. 1996, Astroparticle Physics, 5, 279
- Tang et al. (2014) Tang, Q.-W., Wang, X.-Y., & Tam, P.-H. T. 2014, ApJ, 794, 26
- Tully et al. (2013) Tully, R. B., Courtois, H. M., Dolphin, A. E., et al. 2013, AJ, 146, 86
- Unger & Farrar (2017) Unger, M., & Farrar, G. R. 2017, ArXiv e-prints, arXiv:1707.02339
- Unger et al. (2015) Unger, M., Farrar, G. R., & Anchordoqui, L. A. 2015, Phys. Rev., D92, 123001
- Verzi et al. (2013) Verzi, V., et al. 2013, in Proceedings, 33rd International Cosmic Ray Conference (ICRC2013): Rio de Janeiro, Brazil, July 2-9, 2013, 0928
- Wilks (1938) Wilks, S. S. 1938, Ann. Math. Statist., 9, 60
- Wykes et al. (2017) Wykes, S., Taylor, A. M., Bray, J. D., Hardcastle, M. J., & Hillas, A. M. 2017, ArXiv e-prints, arXiv:1706.08229 [astro-ph.HE]
- Zatsepin & Kuz’min (1966) Zatsepin, G. T., & Kuz’min, V. A. 1966, Soviet Journal of Experimental and Theoretical Physics Letters, 4, 78
| SBGs | l [∘] | b [∘] | DistanceaaA standard, flat CDM model (, ) is assumed. Distances of SBGs are based on Ackermann et al. (2012), accounting for a small difference in . Distances of AGNs are based on their redshifts, except for the nearby Cen A (Tully et al., 2013). [Mpc] | Flux weight [%] | Attenuated weight: A / B / C [%] | % contributionbb% contributions account for the directional exposure of the array.: A / B / C [%] |
|---|---|---|---|---|---|---|
| NGC 253 | 97.4 | -88 | 2.7 | 13.6 | 20.7 / 18.0 / 16.6 | 35.9 / 32.2 / 30.2 |
| M82 | 141.4 | 40.6 | 3.6 | 18.6 | 24.0 / 22.3 / 21.4 | 0.2 / 0.1 / 0.1 |
| NGC 4945 | 305.3 | 13.3 | 4 | 16 | 19.2 / 18.3 / 17.9 | 39.0 / 38.4 / 38.3 |
| M83 | 314.6 | 32 | 4 | 6.3 | 7.6 / 7.2 / 7.1 | 13.1 / 12.9 / 12.9 |
| IC 342 | 138.2 | 10.6 | 4 | 5.5 | 6.6 / 6.3 / 6.1 | 0.1 / 0.0 / 0.0 |
| NGC 6946 | 95.7 | 11.7 | 5.9 | 3.4 | 3.2 / 3.3 / 3.5 | 0.1 / 0.1 / 0.1 |
| NGC 2903 | 208.7 | 44.5 | 6.6 | 1.1 | 0.9 / 1.0 / 1.1 | 0.6 / 0.7 / 0.7 |
| NGC 5055 | 106 | 74.3 | 7.8 | 0.9 | 0.7 / 0.8 / 0.9 | 0.2 / 0.2 / 0.2 |
| NGC 3628 | 240.9 | 64.8 | 8.1 | 1.3 | 1.0 / 1.1 / 1.2 | 0.8 / 0.9 / 1.1 |
| NGC 3627 | 242 | 64.4 | 8.1 | 1.1 | 0.8 / 0.9 / 1.1 | 0.7 / 0.8 / 0.9 |
| NGC 4631 | 142.8 | 84.2 | 8.7 | 2.9 | 2.1 / 2.4 / 2.7 | 0.8 / 0.9 / 1.1 |
| M51 | 104.9 | 68.6 | 10.3 | 3.6 | 2.3 / 2.8 / 3.3 | 0.3 / 0.4 / 0.5 |
| NGC 891 | 140.4 | -17.4 | 11 | 1.7 | 1.1 / 1.3 / 1.5 | 0.2 / 0.3 / 0.3 |
| NGC 3556 | 148.3 | 56.3 | 11.4 | 0.7 | 0.4 / 0.6 / 0.6 | 0.0 / 0.0 / 0.0 |
| NGC 660 | 141.6 | -47.4 | 15 | 0.9 | 0.5 / 0.6 / 0.8 | 0.4 / 0.5 / 0.6 |
| NGC 2146 | 135.7 | 24.9 | 16.3 | 2.6 | 1.3 / 1.7 / 2.0 | 0.0 / 0.0 / 0.0 |
| NGC 3079 | 157.8 | 48.4 | 17.4 | 2.1 | 1.0 / 1.4 / 1.5 | 0.1 / 0.1 / 0.1 |
| NGC 1068 | 172.1 | -51.9 | 17.9 | 12.1 | 5.6 / 7.9 / 9.0 | 6.4 / 9.4 / 10.9 |
| NGC 1365 | 238 | -54.6 | 22.3 | 1.3 | 0.5 / 0.8 / 0.8 | 0.9 / 1.5 / 1.6 |
| Arp 299 | 141.9 | 55.4 | 46 | 1.6 | 0.4 / 0.7 / 0.6 | 0.0 / 0.0 / 0.0 |
| Arp 220 | 36.6 | 53 | 80 | 0.8 | 0.1 / 0.3 / 0.2 | 0.0 / 0.2 / 0.1 |
| NGC 6240 | 20.7 | 27.3 | 105 | 1 | 0.1 / 0.3 / 0.1 | 0.1 / 0.3 / 0.1 |
| Mkn 231 | 121.6 | 60.2 | 183 | 0.8 | 0.0 / 0.1 / 0.0 | 0.0 / 0.0 / 0.0 |
| AGNs | ||||||
| Cen A Core | 309.6 | 19.4 | 3.7 | 0.8 | 60.5 / 14.6 / 40.4 | 86.8 / 56.3 / 71.5 |
| M 87 | 283.7 | 74.5 | 18.5 | 1 | 15.3 / 7.1 / 29.5 | 9.7 / 12.1 / 23.1 |
| NGC 1275 | 150.6 | -13.3 | 76 | 2.2 | 6.6 / 6.1 / 7.5 | 0.7 / 1.6 / 1.0 |
| IC 310 | 150.2 | -13.7 | 83 | 1 | 2.3 / 2.4 / 2.6 | 0.3 / 0.6 / 0.3 |
| 3C 264 | 235.8 | 73 | 95 | 0.5 | 0.8 / 1.0 / 0.8 | 0.4 / 1.3 / 0.5 |
| TXS 0149+710 | 127.9 | 9 | 96 | 0.5 | 0.7 / 0.9 / 0.7 | 0.0 / 0.0 / 0.0 |
| Mkn 421 | 179.8 | 65 | 136 | 54 | 11.4 / 48.3 / 14.7 | 1.8 / 19.1 / 2.8 |
| PKS 0229-581 | 280.2 | -54.6 | 140 | 0.5 | 0.1 / 0.5 / 0.1 | 0.2 / 2.0 / 0.3 |
| Mkn 501 | 63.6 | 38.9 | 148 | 20.8 | 2.3 / 15.0 / 3.6 | 0.3 / 5.2 / 0.6 |
| 1ES 2344+514 | 112.9 | -9.9 | 195 | 3.3 | 0.0 / 1.0 / 0.1 | 0.0 / 0.0 / 0.0 |
| Mkn 180 | 131.9 | 45.6 | 199 | 1.9 | 0.0 / 0.5 / 0.0 | 0.0 / 0.0 / 0.0 |
| 1ES 1959+650 | 98 | 17.7 | 209 | 6.8 | 0.0 / 1.7 / 0.1 | 0.0 / 0.0 / 0.0 |
| AP Librae | 340.7 | 27.6 | 213 | 1.7 | 0.0 / 0.4 / 0.0 | 0.0 / 1.3 / 0.0 |
| TXS 0210+515 | 135.8 | -9 | 218 | 0.9 | 0.0 / 0.2 / 0.0 | 0.0 / 0.0 / 0.0 |
| GB6 J0601+5315 | 160 | 14.6 | 232 | 0.4 | 0.0 / 0.1 / 0.0 | 0.0 / 0.0 / 0.0 |
| PKS 0625-35 | 243.4 | -20 | 245 | 1.3 | 0.0 / 0.1 / 0.0 | 0.0 / 0.5 / 0.0 |
| I Zw 187 | 77.1 | 33.5 | 247 | 2.3 | 0.0 / 0.2 / 0.0 | 0.0 / 0.0 / 0.0 |
Authors
A. Aab77, P. Abreu69, M. Aglietta50,49, I.F.M. Albuquerque18, I. Allekotte1, A. Almela8,11, J. Alvarez Castillo65, J. Alvarez-Muñiz76, G.A. Anastasi41,43, L. Anchordoqui83, B. Andrada8, S. Andringa69, C. Aramo47, N. Arsene71, H. Asorey1,27, P. Assis69, G. Avila9,10, A.M. Badescu72, A. Balaceanu70, F. Barbato57, R.J. Barreira Luz69, J.J. Beatty88, K.H. Becker34, J.A. Bellido12, C. Berat33, M.E. Bertaina59,49, X. Bertou1, P.L. Biermann1001, J. Biteau31, S.G. Blaess12, A. Blanco69, J. Blazek29, C. Bleve53,45, M. Boháčová29, C. Bonifazi24, N. Borodai66, A.M. Botti8,36, J. Brack1005, I. Brancus70, T. Bretz38, A. Bridgeman35, F.L. Briechle38, P. Buchholz40, A. Bueno75, S. Buitink77, M. Buscemi55,44, K.S. Caballero-Mora63, L. Caccianiga56, A. Cancio11,8, F. Canfora77, R. Caruso55,44, A. Castellina50,49, F. Catalani16, G. Cataldi45, L. Cazon69, A.G. Chavez64, J.A. Chinellato19, J. Chudoba29, R.W. Clay12, A.C. Cobos Cerutti7, R. Colalillo57,47, A. Coleman89, L. Collica49, M.R. Coluccia53,45, R. Conceição69, G. Consolati46,51, F. Contreras9,10, M.J. Cooper12, S. Coutu89, C.E. Covault81, J. Cronin90, S. D’Amico52,45, B. Daniel19, S. Dasso5,3, K. Daumiller36, B.R. Dawson12, R.M. de Almeida26, S.J. de Jong77,79, G. De Mauro77, J.R.T. de Mello Neto24,25, I. De Mitri53,45, J. de Oliveira26, V. de Souza17, J. Debatin35, O. Deligny31, M.L. Díaz Castro19, F. Diogo69, C. Dobrigkeit19, J.C. D’Olivo65, Q. Dorosti40, R.C. dos Anjos23, M.T. Dova4, A. Dundovic39, J. Ebr29, R. Engel36, M. Erdmann38, M. Erfani40, C.O. Escobar1004, J. Espadanal69, A. Etchegoyen8,11, H. Falcke77,80,79, J. Farmer90, G. Farrar86, A.C. Fauth19, N. Fazzini1004, F. Fenu59,49, B. Fick85, J.M. Figueira8, A. Filipčič74,73, M.M. Freire6, T. Fujii90, A. Fuster8,11, R. Gaïor32, B. García7, F. Gaté1003, H. Gemmeke37, A. Gherghel-Lascu70, P.L. Ghia31, U. Giaccari24, M. Giammarchi46, M. Giller67, D. Głas68, C. Glaser38, G. Golup1, M. Gómez Berisso1, P.F. Gómez Vitale9,10, N. González8,36, A. Gorgi50,49, A.F. Grillo43, T.D. Grubb12, F. Guarino57,47, G.P. Guedes20, R. Halliday81, M.R. Hampel8, P. Hansen4, D. Harari1, T.A. Harrison12, A. Haungs36, T. Hebbeker38, D. Heck36, P. Heimann40, A.E. Herve35, G.C. Hill12, C. Hojvat1004, E. Holt36,8, P. Homola66, J.R. Hörandel77,79, P. Horvath30, M. Hrabovský30, T. Huege36, J. Hulsman8,36, A. Insolia55,44, P.G. Isar71, I. Jandt34, J.A. Johnsen82, M. Josebachuili8, J. Jurysek29, A. Kääpä34, O. Kambeitz35, K.H. Kampert34, B. Keilhauer36, N. Kemmerich18, E. Kemp19, J. Kemp38, R.M. Kieckhafer85, H.O. Klages36, M. Kleifges37, J. Kleinfeller9, R. Krause38, N. Krohm34, D. Kuempel34, G. Kukec Mezek73, N. Kunka37, A. Kuotb Awad35, B.L. Lago15, D. LaHurd81, R.G. Lang17, M. Lauscher38, R. Legumina67, M.A. Leigui de Oliveira22, A. Letessier-Selvon32, I. Lhenry-Yvon31, K. Link35, D. Lo Presti55, L. Lopes69, R. López60, A. López Casado76, R. Lorek81, Q. Luce31, A. Lucero8, M. Malacari90, M. Mallamaci56,46, D. Mandat29, P. Mantsch1004, A.G. Mariazzi4, I.C. Mariş13, G. Marsella53,45, D. Martello53,45, H. Martinez61, O. Martínez Bravo60, J.J. Masías Meza3, H.J. Mathes36, S. Mathys34, J. Matthews84, G. Matthiae58,48, E. Mayotte34, P.O. Mazur1004, C. Medina82, G. Medina-Tanco65, D. Melo8, A. Menshikov37, K.-D. Merenda82, S. Michal30, M.I. Micheletti6, L. Middendorf38, L. Miramonti56,46, B. Mitrica70, D. Mockler35, S. Mollerach1, F. Montanet33, C. Morello50,49, G. Morlino41,43, M. Mostafá89, A.L. Müller8,36, G. Müller38, M.A. Muller19,21, S. Müller35,8, R. Mussa49, I. Naranjo1, L. Nellen65, P.H. Nguyen12, M. Niculescu-Oglinzanu70, M. Niechciol40, L. Niemietz34, T. Niggemann38, D. Nitz85, D. Nosek28, V. Novotny28, L. Nožka30, L.A. Núñez27, F. Oikonomou89, A. Olinto90, M. Palatka29, J. Pallotta2, P. Papenbreer34, G. Parente76, A. Parra60, T. Paul83, M. Pech29, F. Pedreira76, J. Pȩkala66, R. Pelayo62, J. Peña-Rodriguez27, L.A.S. Pereira19, M. Perlin8, L. Perrone53,45, C. Peters38, S. Petrera41,43, J. Phuntsok89, T. Pierog36, M. Pimenta69, V. Pirronello55,44, M. Platino8, M. Plum38, J. Poh90, C. Porowski66, R.R. Prado17, P. Privitera90, M. Prouza29, E.J. Quel2, S. Querchfeld34, S. Quinn81, R. Ramos-Pollan27, J. Rautenberg34, D. Ravignani8, J. Ridky29, F. Riehn69, M. Risse40, P. Ristori2, V. Rizi54,43, W. Rodrigues de Carvalho18, G. Rodriguez Fernandez58,48, J. Rodriguez Rojo9, M.J. Roncoroni8, M. Roth36, E. Roulet1, A.C. Rovero5, P. Ruehl40, S.J. Saffi12, A. Saftoiu70, F. Salamida54,43, H. Salazar60, A. Saleh73, G. Salina48, F. Sánchez8, P. Sanchez-Lucas75, E.M. Santos18, E. Santos8, F. Sarazin82, R. Sarmento69, C. Sarmiento-Cano8, R. Sato9, M. Schauer34, V. Scherini45, H. Schieler36, M. Schimp34, D. Schmidt36,8, O. Scholten78,1002, P. Schovánek29, F.G. Schröder36, S. Schröder34, A. Schulz35, J. Schumacher38, S.J. Sciutto4, A. Segreto42,44, A. Shadkam84, R.C. Shellard14, G. Sigl39, G. Silli8,36, R. Šmída36, G.R. Snow91, P. Sommers89, S. Sonntag40, J. F. Soriano83, R. Squartini9, D. Stanca70, S. Stanič73, J. Stasielak66, P. Stassi33, M. Stolpovskiy33, F. Strafella53,45, A. Streich35, F. Suarez8,11, M. Suarez Durán27, T. Sudholz12, T. Suomijärvi31, A.D. Supanitsky5, J. Šupík30, J. Swain87, Z. Szadkowski68, A. Taboada36, O.A. Taborda1, V.M. Theodoro19, C. Timmermans79,77, C.J. Todero Peixoto16, L. Tomankova36, B. Tomé69, G. Torralba Elipe76, P. Travnicek29, M. Trini73, R. Ulrich36, M. Unger36, M. Urban38, J.F. Valdés Galicia65, I. Valiño76, L. Valore57,47, G. van Aar77, P. van Bodegom12, A.M. van den Berg78, A. van Vliet77, E. Varela60, B. Vargas Cárdenas65, R.A. Vázquez76, D. Veberič36, C. Ventura25, I.D. Vergara Quispe4, V. Verzi48, J. Vicha29, L. Villaseñor64, S. Vorobiov73, H. Wahlberg4, O. Wainberg8,11, D. Walz38, A.A. Watson1000, M. Weber37, A. Weindl36, M. Wiedeński68, L. Wiencke82, H. Wilczyński66, M. Wirtz38, D. Wittkowski34, B. Wundheiler8, L. Yang73, A. Yushkov8, E. Zas76, D. Zavrtanik73,74, M. Zavrtanik74,73, A. Zepeda61, B. Zimmermann37, M. Ziolkowski40, Z. Zong31, F. Zuccarello55,44
(The Pierre Auger Collaboration)
1Centro Atómico Bariloche and Instituto Balseiro (CNEA-UNCuyo-CONICET), San Carlos de Bariloche, Argentina
2Centro de Investigaciones en Láseres y Aplicaciones, CITEDEF and CONICET, Villa Martelli, Argentina
3Departamento de Física and Departamento de Ciencias de la Atmósfera y los Océanos, FCEyN, Universidad de Buenos Aires and CONICET, Buenos Aires, Argentina
4IFLP, Universidad Nacional de La Plata and CONICET, La Plata, Argentina
5Instituto de Astronomía y Física del Espacio (IAFE, CONICET-UBA), Buenos Aires, Argentina
6Instituto de Física de Rosario (IFIR) – CONICET/U.N.R. and Facultad de Ciencias Bioquímicas y Farmacéuticas U.N.R., Rosario, Argentina
7Instituto de Tecnologías en Detección y Astropartículas (CNEA, CONICET, UNSAM), and Universidad Tecnológica Nacional – Facultad Regional Mendoza (CONICET/CNEA), Mendoza, Argentina
8Instituto de Tecnologías en Detección y Astropartículas (CNEA, CONICET, UNSAM), Buenos Aires, Argentina
9Observatorio Pierre Auger, Malargüe, Argentina
10Observatorio Pierre Auger and Comisión Nacional de Energía Atómica, Malargüe, Argentina
11Universidad Tecnológica Nacional – Facultad Regional Buenos Aires, Buenos Aires, Argentina
12University of Adelaide, Adelaide, S.A., Australia
13Université Libre de Bruxelles (ULB), Brussels, Belgium
14Centro Brasileiro de Pesquisas Fisicas, Rio de Janeiro, RJ, Brazil
15Centro Federal de Educação Tecnológica Celso Suckow da Fonseca, Nova Friburgo, Brazil
16Universidade de São Paulo, Escola de Engenharia de Lorena, Lorena, SP, Brazil
17Universidade de São Paulo, Instituto de Física de São Carlos, São Carlos, SP, Brazil
18Universidade de São Paulo, Instituto de Física, São Paulo, SP, Brazil
19Universidade Estadual de Campinas, IFGW, Campinas, SP, Brazil
20Universidade Estadual de Feira de Santana, Feira de Santana, Brazil
21Universidade Federal de Pelotas, Pelotas, RS, Brazil
22Universidade Federal do ABC, Santo André, SP, Brazil
23Universidade Federal do Paraná, Setor Palotina, Palotina, Brazil
24Universidade Federal do Rio de Janeiro, Instituto de Física, Rio de Janeiro, RJ, Brazil
25Universidade Federal do Rio de Janeiro (UFRJ), Observatório do Valongo, Rio de Janeiro, RJ, Brazil
26Universidade Federal Fluminense, EEIMVR, Volta Redonda, RJ, Brazil
27Universidad Industrial de Santander, Bucaramanga, Colombia
28Charles University, Faculty of Mathematics and Physics, Institute of Particle and Nuclear Physics, Prague, Czech Republic
29Institute of Physics of the Czech Academy of Sciences, Prague, Czech Republic
30Palacky University, RCPTM, Olomouc, Czech Republic
31Institut de Physique Nucléaire d’Orsay (IPNO), Université Paris-Sud, Univ. Paris/Saclay, CNRS-IN2P3, Orsay, France
32Laboratoire de Physique Nucléaire et de Hautes Energies (LPNHE), Universités Paris 6 et Paris 7, CNRS-IN2P3, Paris, France
33Laboratoire de Physique Subatomique et de Cosmologie (LPSC), Université Grenoble-Alpes, CNRS/IN2P3, Grenoble, France
34Bergische Universität Wuppertal, Department of Physics, Wuppertal, Germany
35Karlsruhe Institute of Technology, Institut für Experimentelle Kernphysik (IEKP), Karlsruhe, Germany
36Karlsruhe Institute of Technology, Institut für Kernphysik, Karlsruhe, Germany
37Karlsruhe Institute of Technology, Institut für Prozessdatenverarbeitung und Elektronik, Karlsruhe, Germany
38RWTH Aachen University, III. Physikalisches Institut A, Aachen, Germany
39Universität Hamburg, II. Institut für Theoretische Physik, Hamburg, Germany
40Universität Siegen, Fachbereich 7 Physik – Experimentelle Teilchenphysik, Siegen, Germany
41Gran Sasso Science Institute (INFN), L’Aquila, Italy
42INAF – Istituto di Astrofisica Spaziale e Fisica Cosmica di Palermo, Palermo, Italy
43INFN Laboratori Nazionali del Gran Sasso, Assergi (L’Aquila), Italy
44INFN, Sezione di Catania, Catania, Italy
45INFN, Sezione di Lecce, Lecce, Italy
46INFN, Sezione di Milano, Milano, Italy
47INFN, Sezione di Napoli, Napoli, Italy
48INFN, Sezione di Roma "Tor Vergata", Roma, Italy
49INFN, Sezione di Torino, Torino, Italy
50Osservatorio Astrofisico di Torino (INAF), Torino, Italy
51Politecnico di Milano, Dipartimento di Scienze e Tecnologie Aerospaziali , Milano, Italy
52Università del Salento, Dipartimento di Ingegneria, Lecce, Italy
53Università del Salento, Dipartimento di Matematica e Fisica “E. De Giorgi”, Lecce, Italy
54Università dell’Aquila, Dipartimento di Scienze Fisiche e Chimiche, L’Aquila, Italy
55Università di Catania, Dipartimento di Fisica e Astronomia, Catania, Italy
56Università di Milano, Dipartimento di Fisica, Milano, Italy
57Università di Napoli "Federico II", Dipartimento di Fisica “Ettore Pancini“, Napoli, Italy
58Università di Roma “Tor Vergata”, Dipartimento di Fisica, Roma, Italy
59Università Torino, Dipartimento di Fisica, Torino, Italy
60Benemérita Universidad Autónoma de Puebla, Puebla, México
61Centro de Investigación y de Estudios Avanzados del IPN (CINVESTAV), México, D.F., México
62Unidad Profesional Interdisciplinaria en Ingeniería y Tecnologías Avanzadas del Instituto Politécnico Nacional (UPIITA-IPN), México, D.F., México
63Universidad Autónoma de Chiapas, Tuxtla Gutiérrez, Chiapas, México
64Universidad Michoacana de San Nicolás de Hidalgo, Morelia, Michoacán, México
65Universidad Nacional Autónoma de México, México, D.F., México
66Institute of Nuclear Physics PAN, Krakow, Poland
67University of Łódź, Faculty of Astrophysics, Łódź, Poland
68University of Łódź, Faculty of High-Energy Astrophysics,Łódź, Poland
69Laboratório de Instrumentação e Física Experimental de Partículas – LIP and Instituto Superior Técnico – IST, Universidade de Lisboa – UL, Lisboa, Portugal
70“Horia Hulubei” National Institute for Physics and Nuclear Engineering, Bucharest-Magurele, Romania
71Institute of Space Science, Bucharest-Magurele, Romania
72University Politehnica of Bucharest, Bucharest, Romania
73Center for Astrophysics and Cosmology (CAC), University of Nova Gorica, Nova Gorica, Slovenia
74Experimental Particle Physics Department, J. Stefan Institute, Ljubljana, Slovenia
75Universidad de Granada and C.A.F.P.E., Granada, Spain
76Universidad de Santiago de Compostela, Santiago de Compostela, Spain
77IMAPP, Radboud University Nijmegen, Nijmegen, The Netherlands
78KVI – Center for Advanced Radiation Technology, University of Groningen, Groningen, The Netherlands
79Nationaal Instituut voor Kernfysica en Hoge Energie Fysica (NIKHEF), Science Park, Amsterdam, The Netherlands
80Stichting Astronomisch Onderzoek in Nederland (ASTRON), Dwingeloo, The Netherlands
81Case Western Reserve University, Cleveland, OH, USA
82Colorado School of Mines, Golden, CO, USA
83Department of Physics and Astronomy, Lehman College, City University of New York, Bronx, NY, USA
84Louisiana State University, Baton Rouge, LA, USA
85Michigan Technological University, Houghton, MI, USA
86New York University, New York, NY, USA
87Northeastern University, Boston, MA, USA
88Ohio State University, Columbus, OH, USA
89Pennsylvania State University, University Park, PA, USA
90University of Chicago, Enrico Fermi Institute, Chicago, IL, USA
91University of Nebraska, Lincoln, NE, USA
—–
1000School of Physics and Astronomy, University of Leeds, Leeds, United Kingdom
1001Max-Planck-Institut für Radioastronomie, Bonn, Germany
1002also at Vrije Universiteit Brussels, Brussels, Belgium
1003SUBATECH, École des Mines de Nantes, CNRS-IN2P3, Université de Nantes, France
1004Fermi National Accelerator Laboratory, USA
1005Colorado State University, Fort Collins, CO
Deceased