Rare decays at CMS
Abstract:
The Flavor Changing Neutral Current mediated decays and provide high sensitivity to new physics contributions. Sensitive observables include the branching fraction, the muon forward-backward asymmetry, the fraction of longitudinal polarisation and the differential branching fraction. We report herein the recent results from CMS on these decay modes.
1 Introduction
Heavy flavor physics is the study of high energy hadronic interactions among quark flavors. The production and decay of heavy flavor play an important role in testing Quantum Chromodynamics (QCD) based calculations. They provide ample experimental observables to study underlying physics enabling us to search for new phenomena beyond the standard model (SM) by comparing the experimental results with theoretical predictions. Any significant deviation of the measured observable from SM predictions would hint the presence of new physics (NP). In this paper, the heavy flavor results involving b-hadrons obtained by the CMS [1] experiment, based on the data collected at 7/8/13 TeV center-of-mass energy, are presented.
2 Dimuon spectrum with 13 TeV data
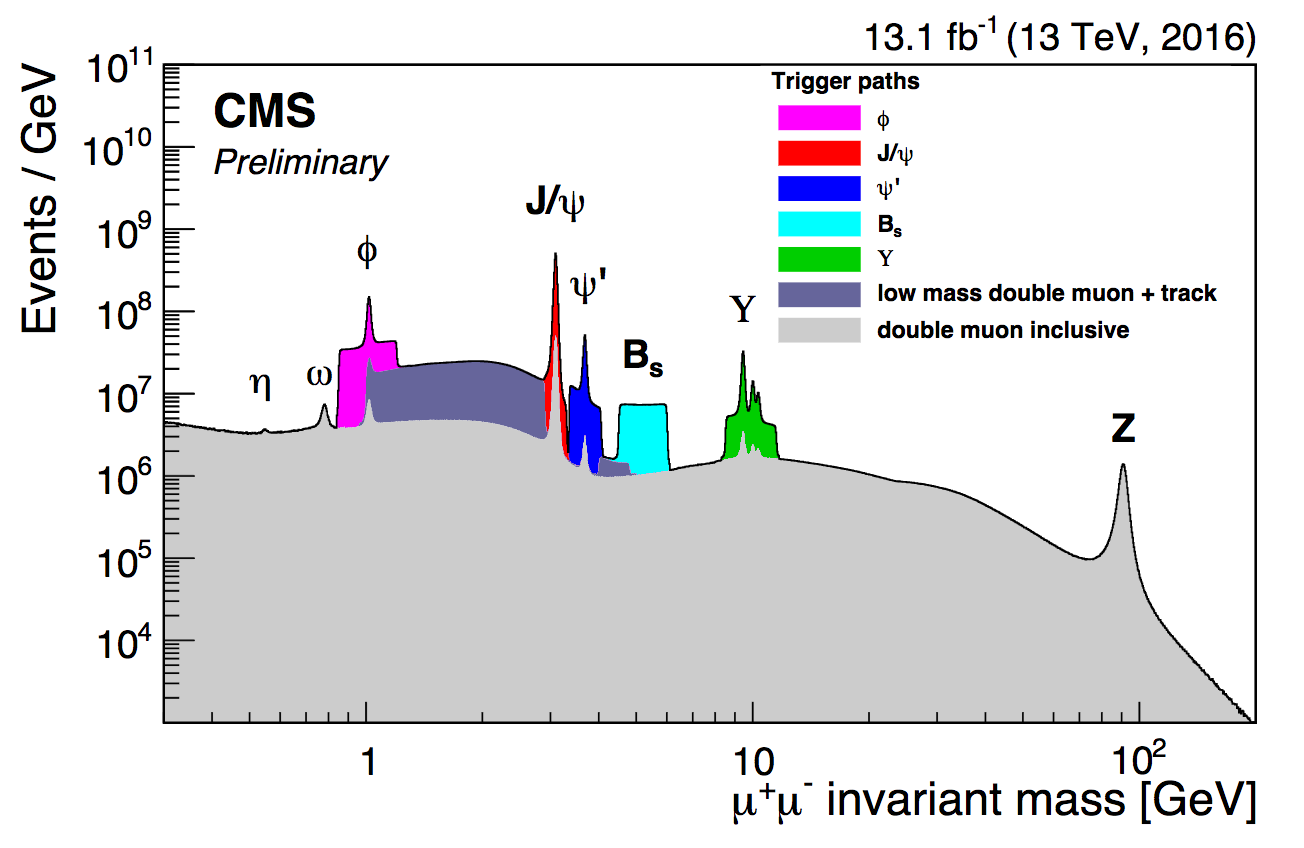
After the first long shut down of the LHC machine, the pp collisions have started again around middle of 2015. The center-of-mass energy was 13 TeV corresponding to this LHC run. The CMS, ATLAS and LHCb experiments have already produced many results using 13 TeV data. CMS could reproduce the dimuon mass spectrum, as seen earlier with 7 and 8 TeV data samples. Figure 1 shows the dimuon invariant mass with 13.1 fb-1 of data collected at 13 TeV during 2016 [2]. The colored paths correspond to dedicated dimuon triggers with low thresholds, in specific mass windows, while the light gray continuous distribution represents events collected with a dimuon trigger with high threshold. One can clearly see contributions from different resonances such as , J/, and in the distribution.
3 production cross-section with 13 TeV data
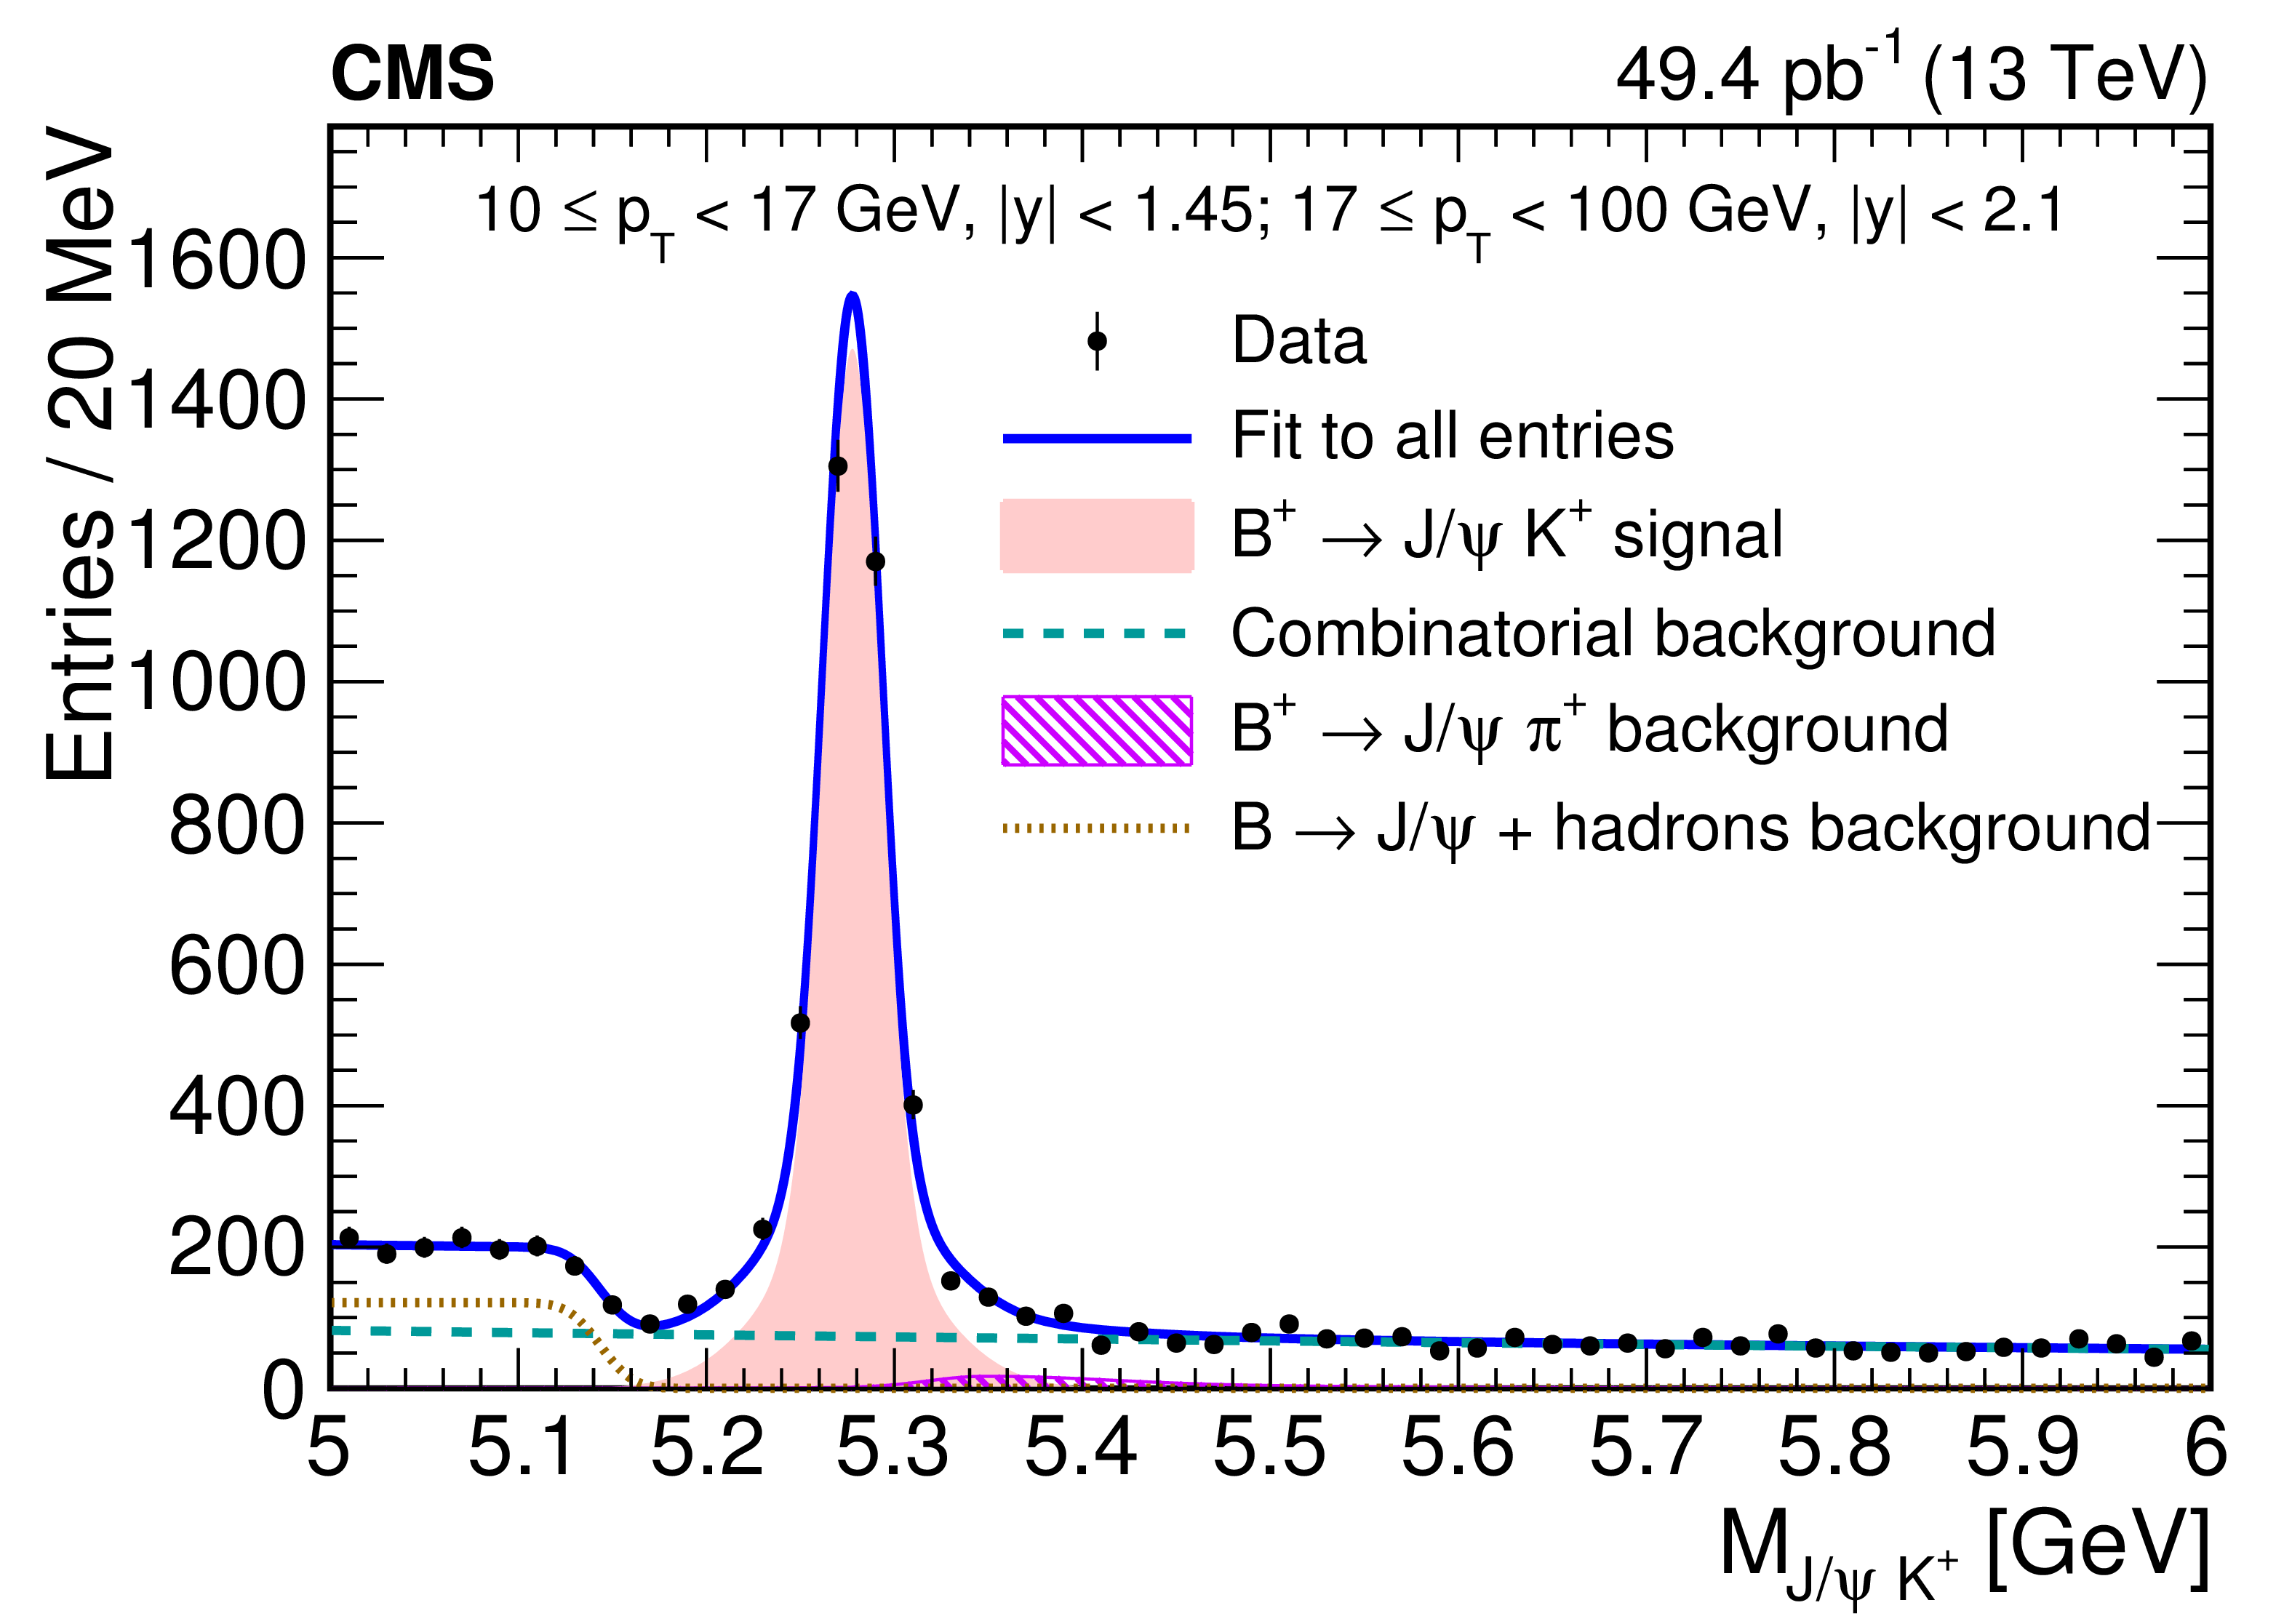
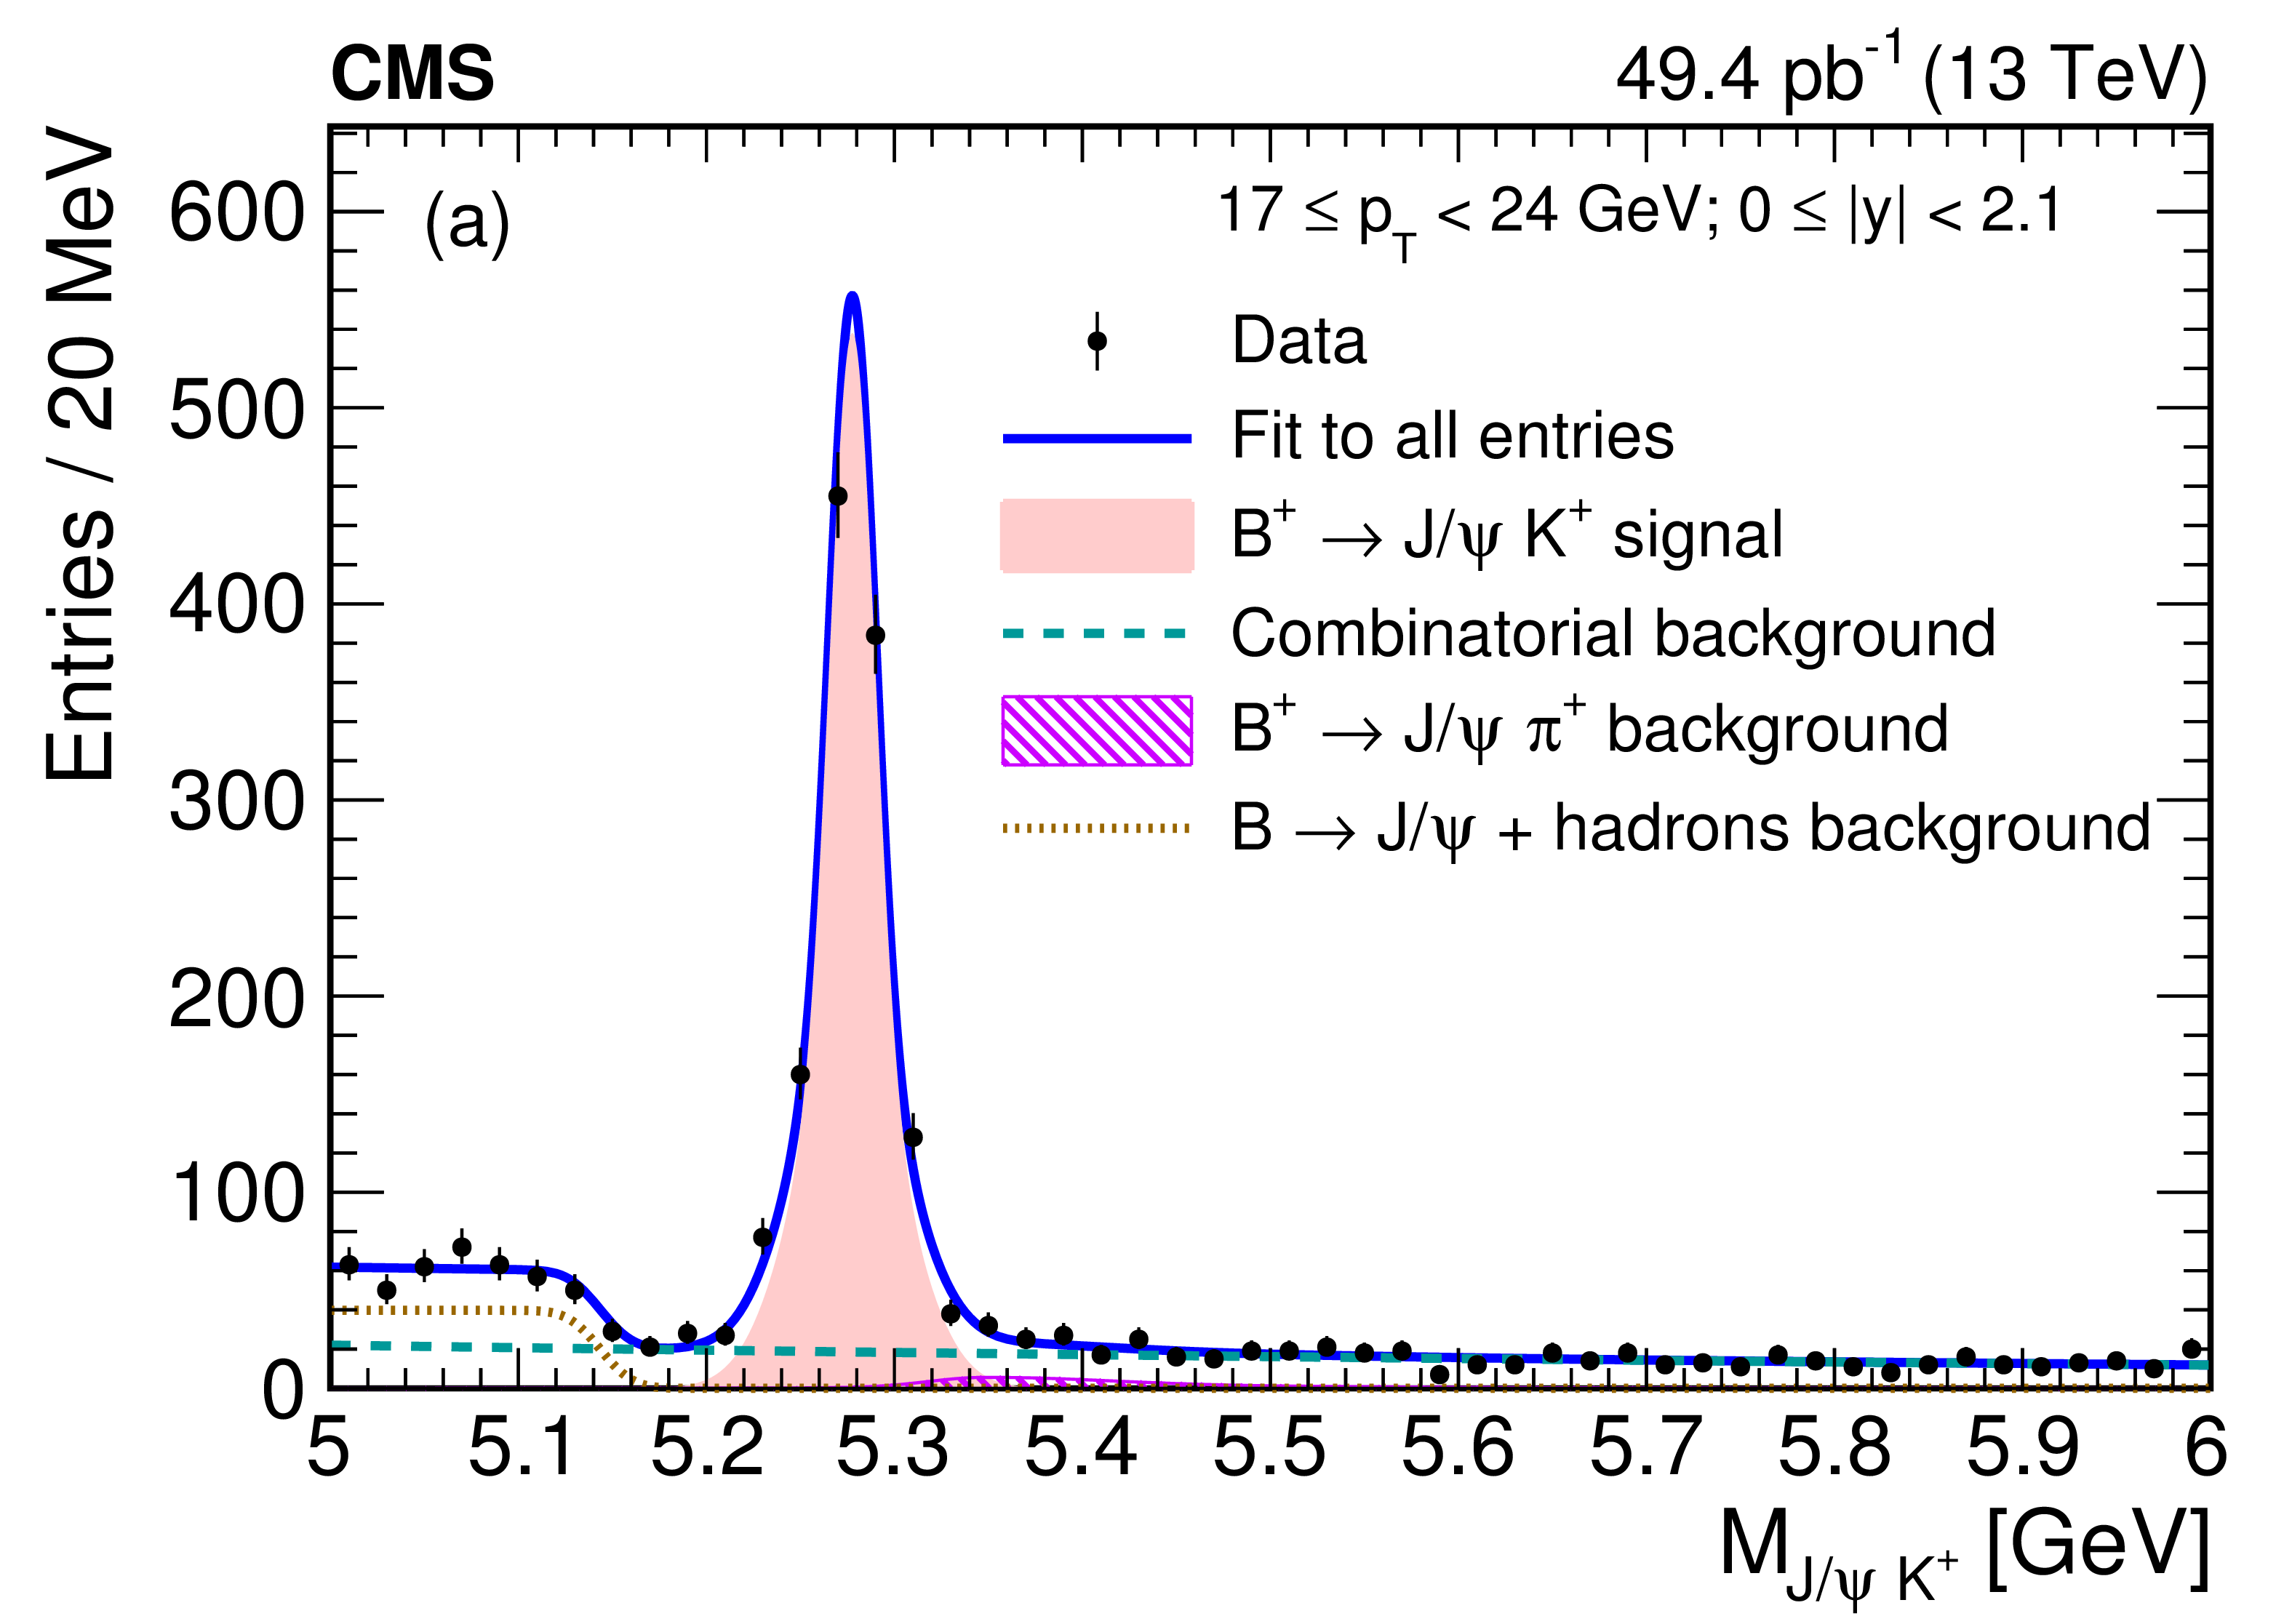
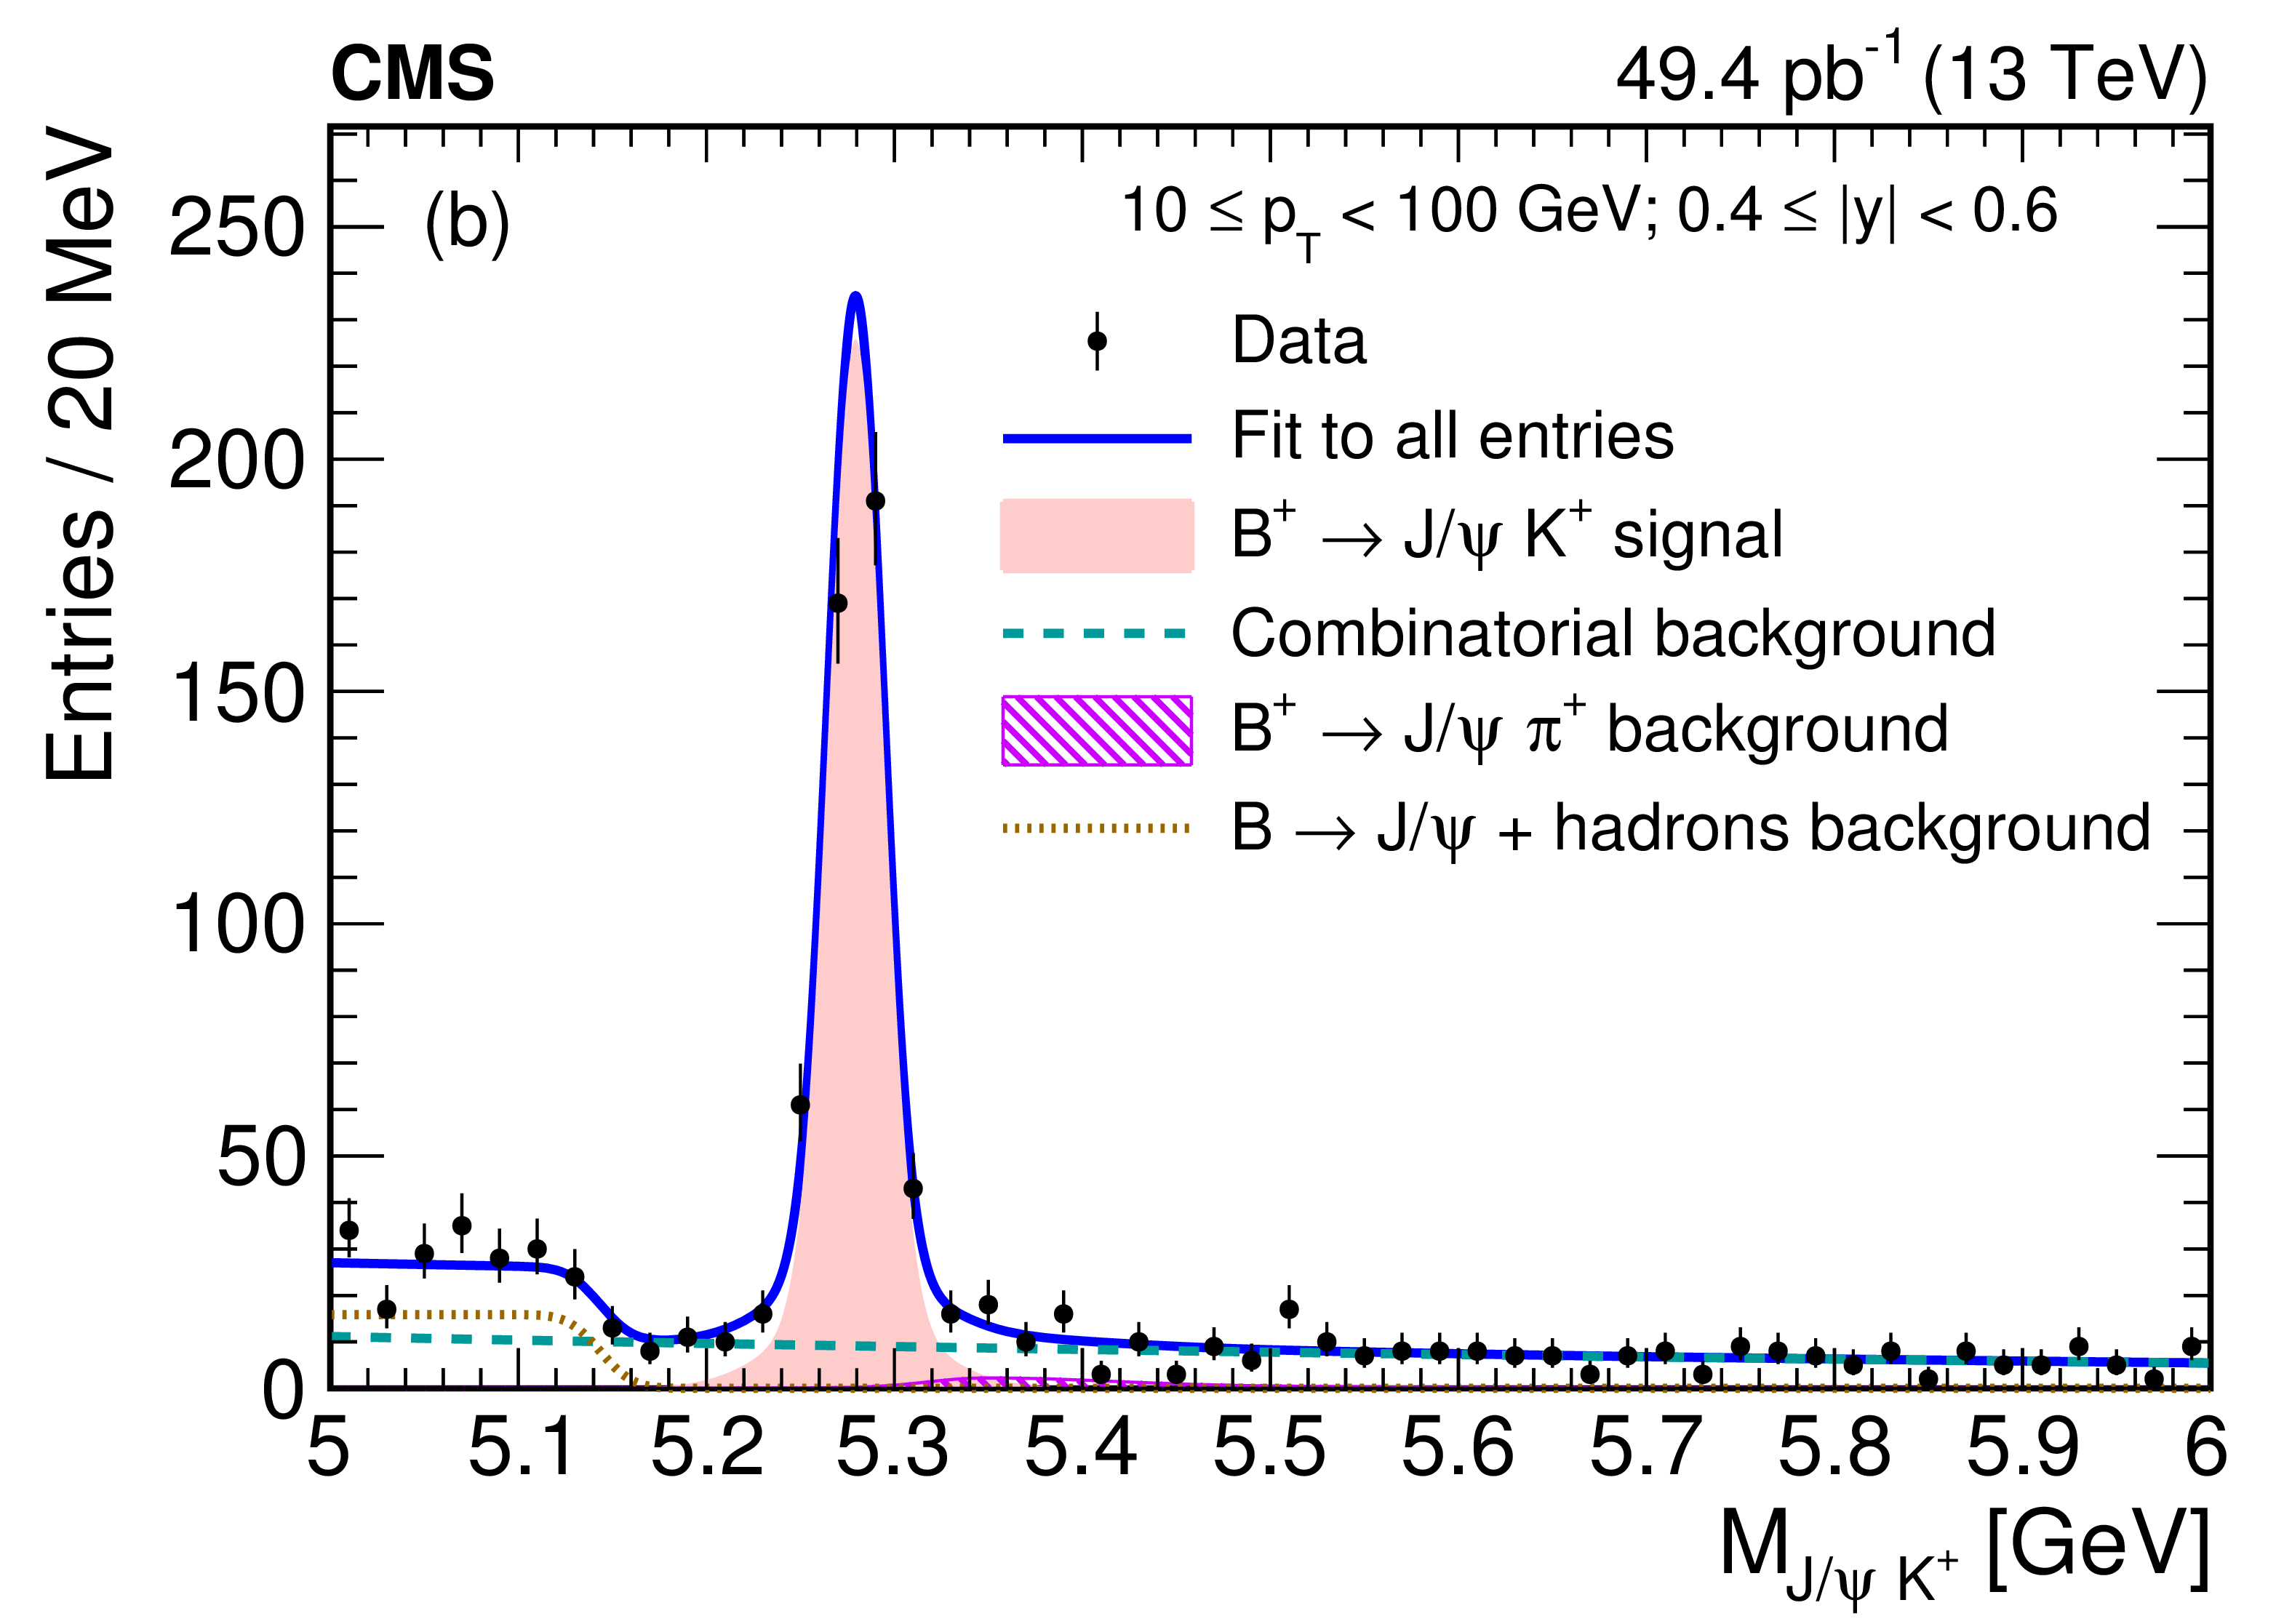
The measurements of -hadron production cross sections provide essential information to understand QCD. Such studies have been carried out by several collider experiments. The recent studies of -hadron production at the higher energies of the LHC Run 2 provide a new important test of theoretical calculations. We present herein the measurement of the differential cross-section in pp collisions at 13 TeV, as function of transverse momentum () and rapidity (). The result is based on a data sample collected by the CMS experiment, corresponding to an integrated luminosity of 49.4 pb-1, and uses the channel for selecting events where decays to a pair of muons. The muons are required to have at least one reconstructed segment in the muon stations that matches the extrapolated position of a track reconstructed in the silicon tracker satisfying GeV and and to have good quality in the fit to a track. The J/ candidate must have an invariant mass within MeV of the nominal J/ mass [3]. Each J/ candidate must have GeV and the probability of the dimuon vertex fit is required to be larger than 10%. Both muons must be either within or one of them must have GeV. candidates are reconstructed by combining a J/ candidate with a charged track of GeV. The track is assumed to be a kaon and the track-fit must be less than five times the number of degrees of freedom. To reduce the peaking and non-peaking backgrounds, many kinematic and topological cuts have been applied. Finally, the signal yield is extracted with an extended unbinned maximum likelihood fit to the invariant mass of the candidates in each of the and bins. Figure 2 shows the invariant mass distribution of all the candidates included in the analysis together with the corresponding fit results [4].
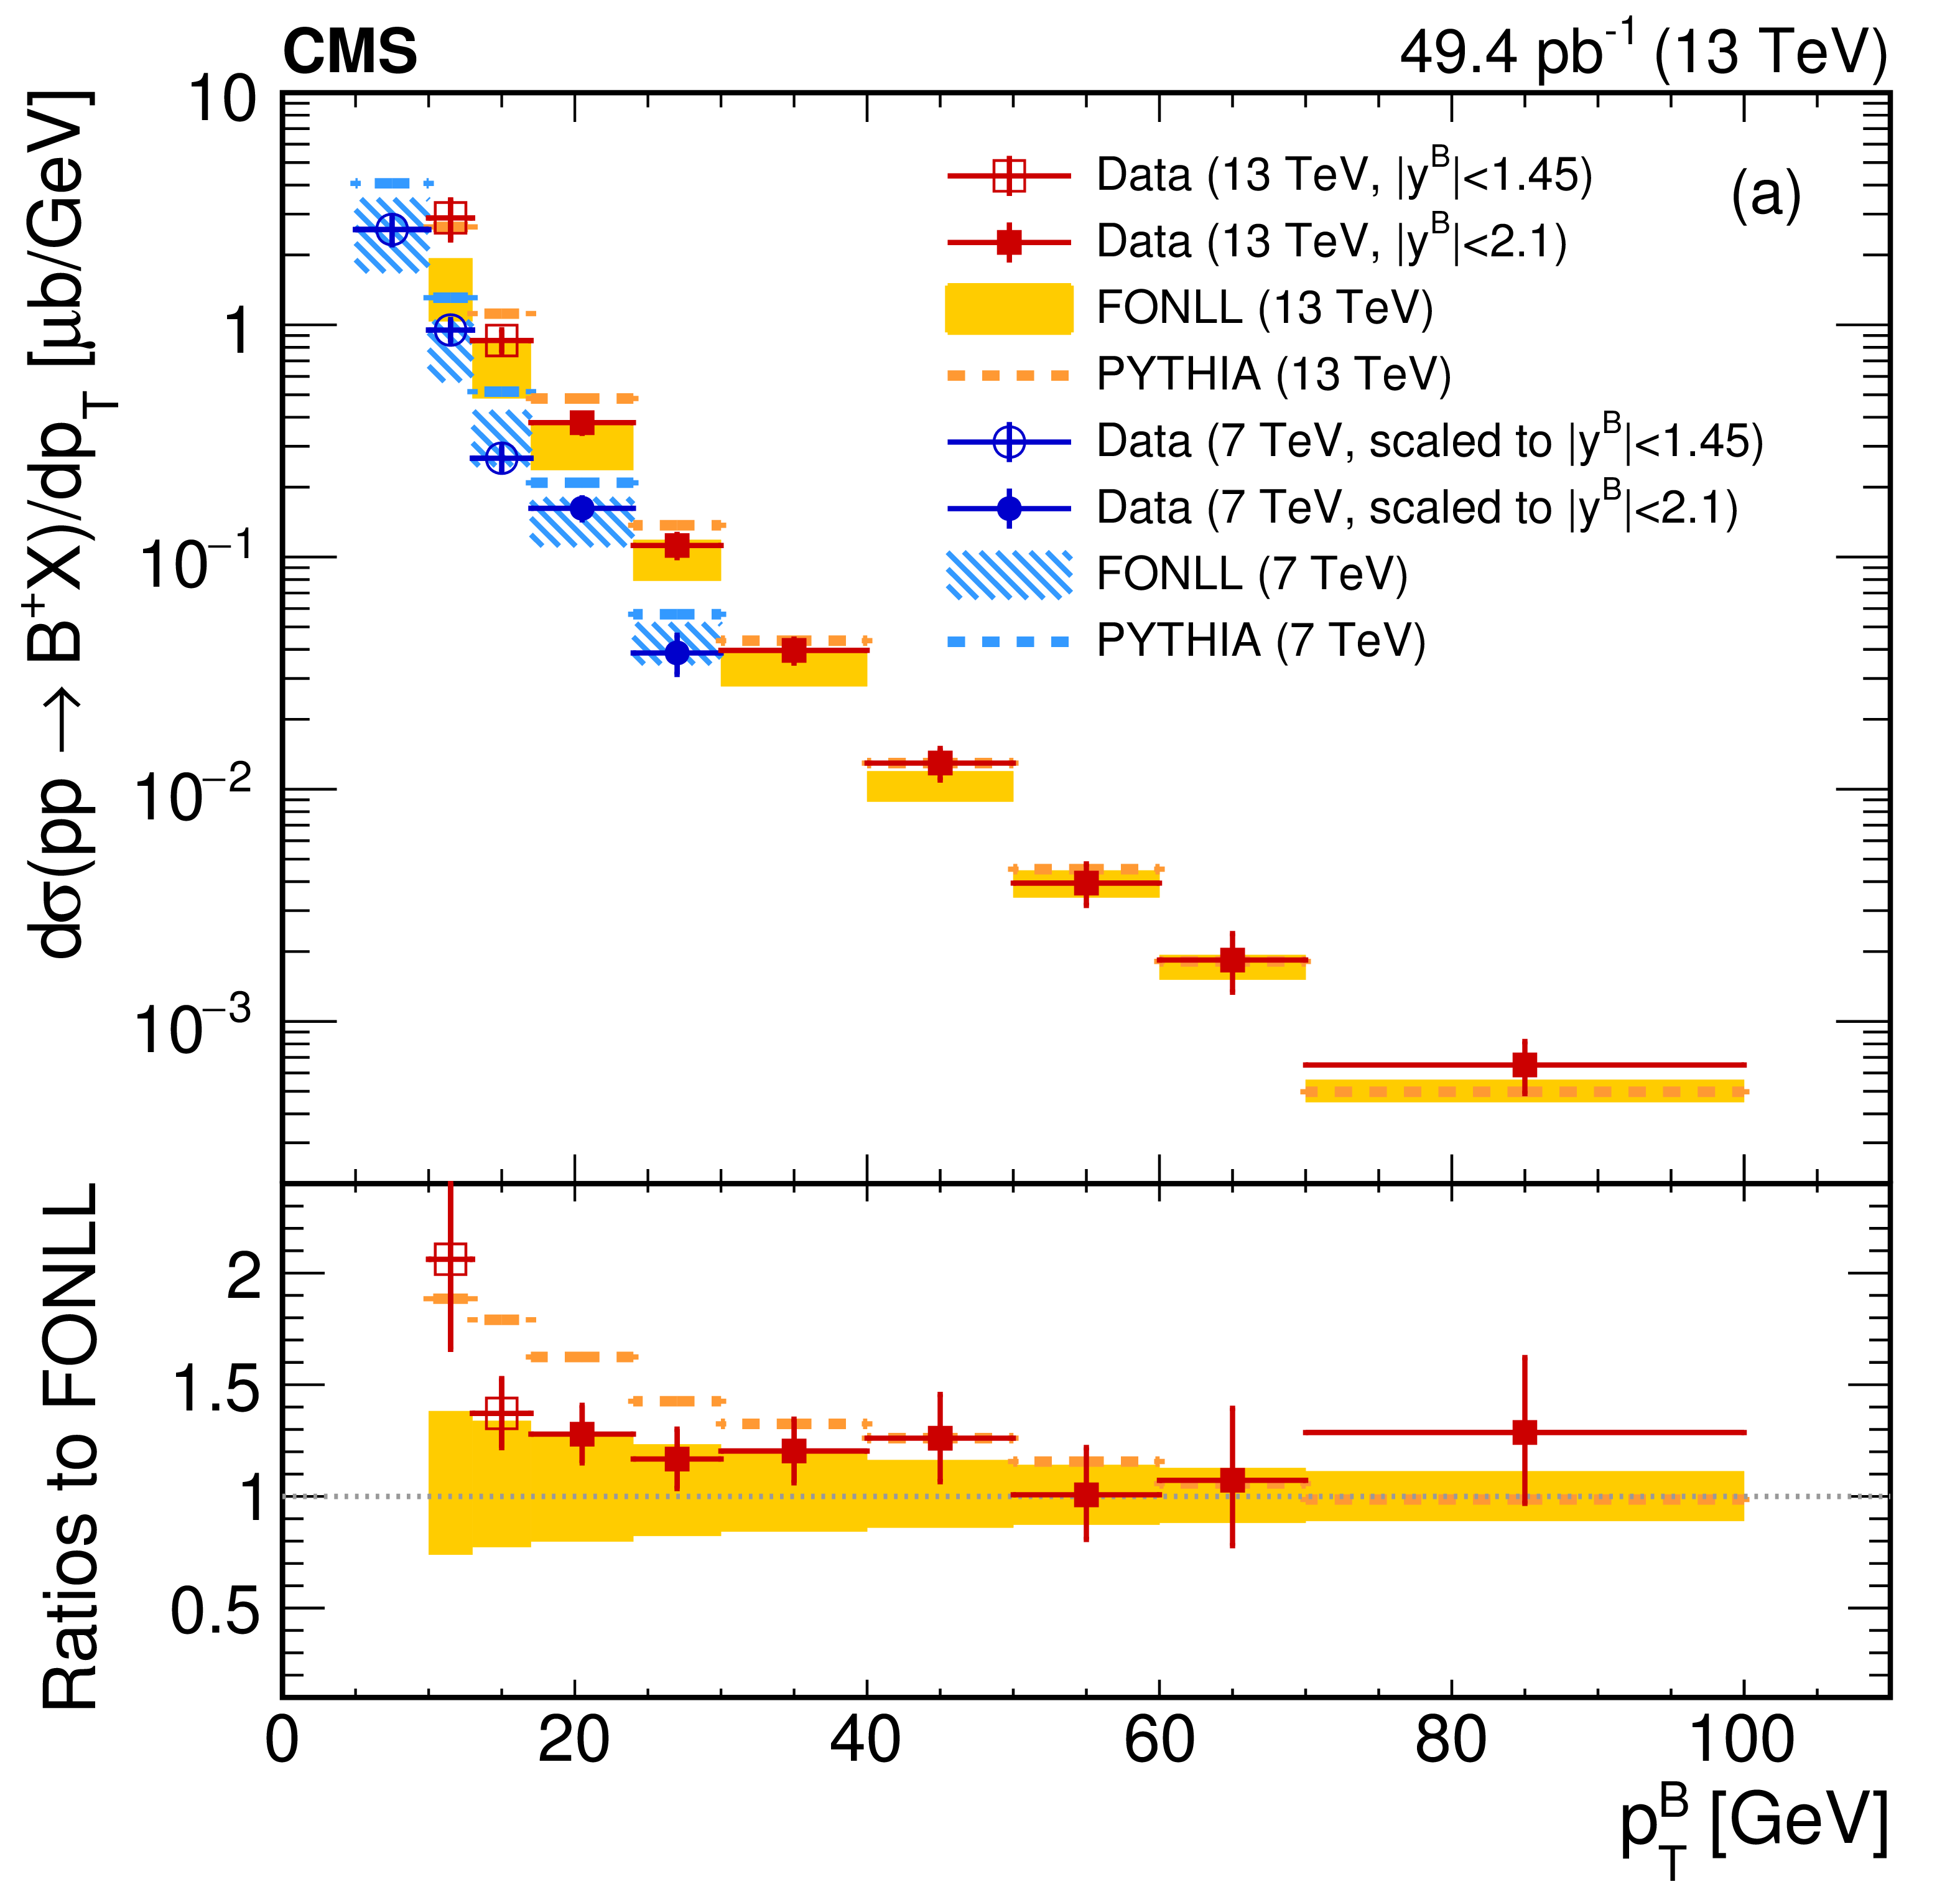
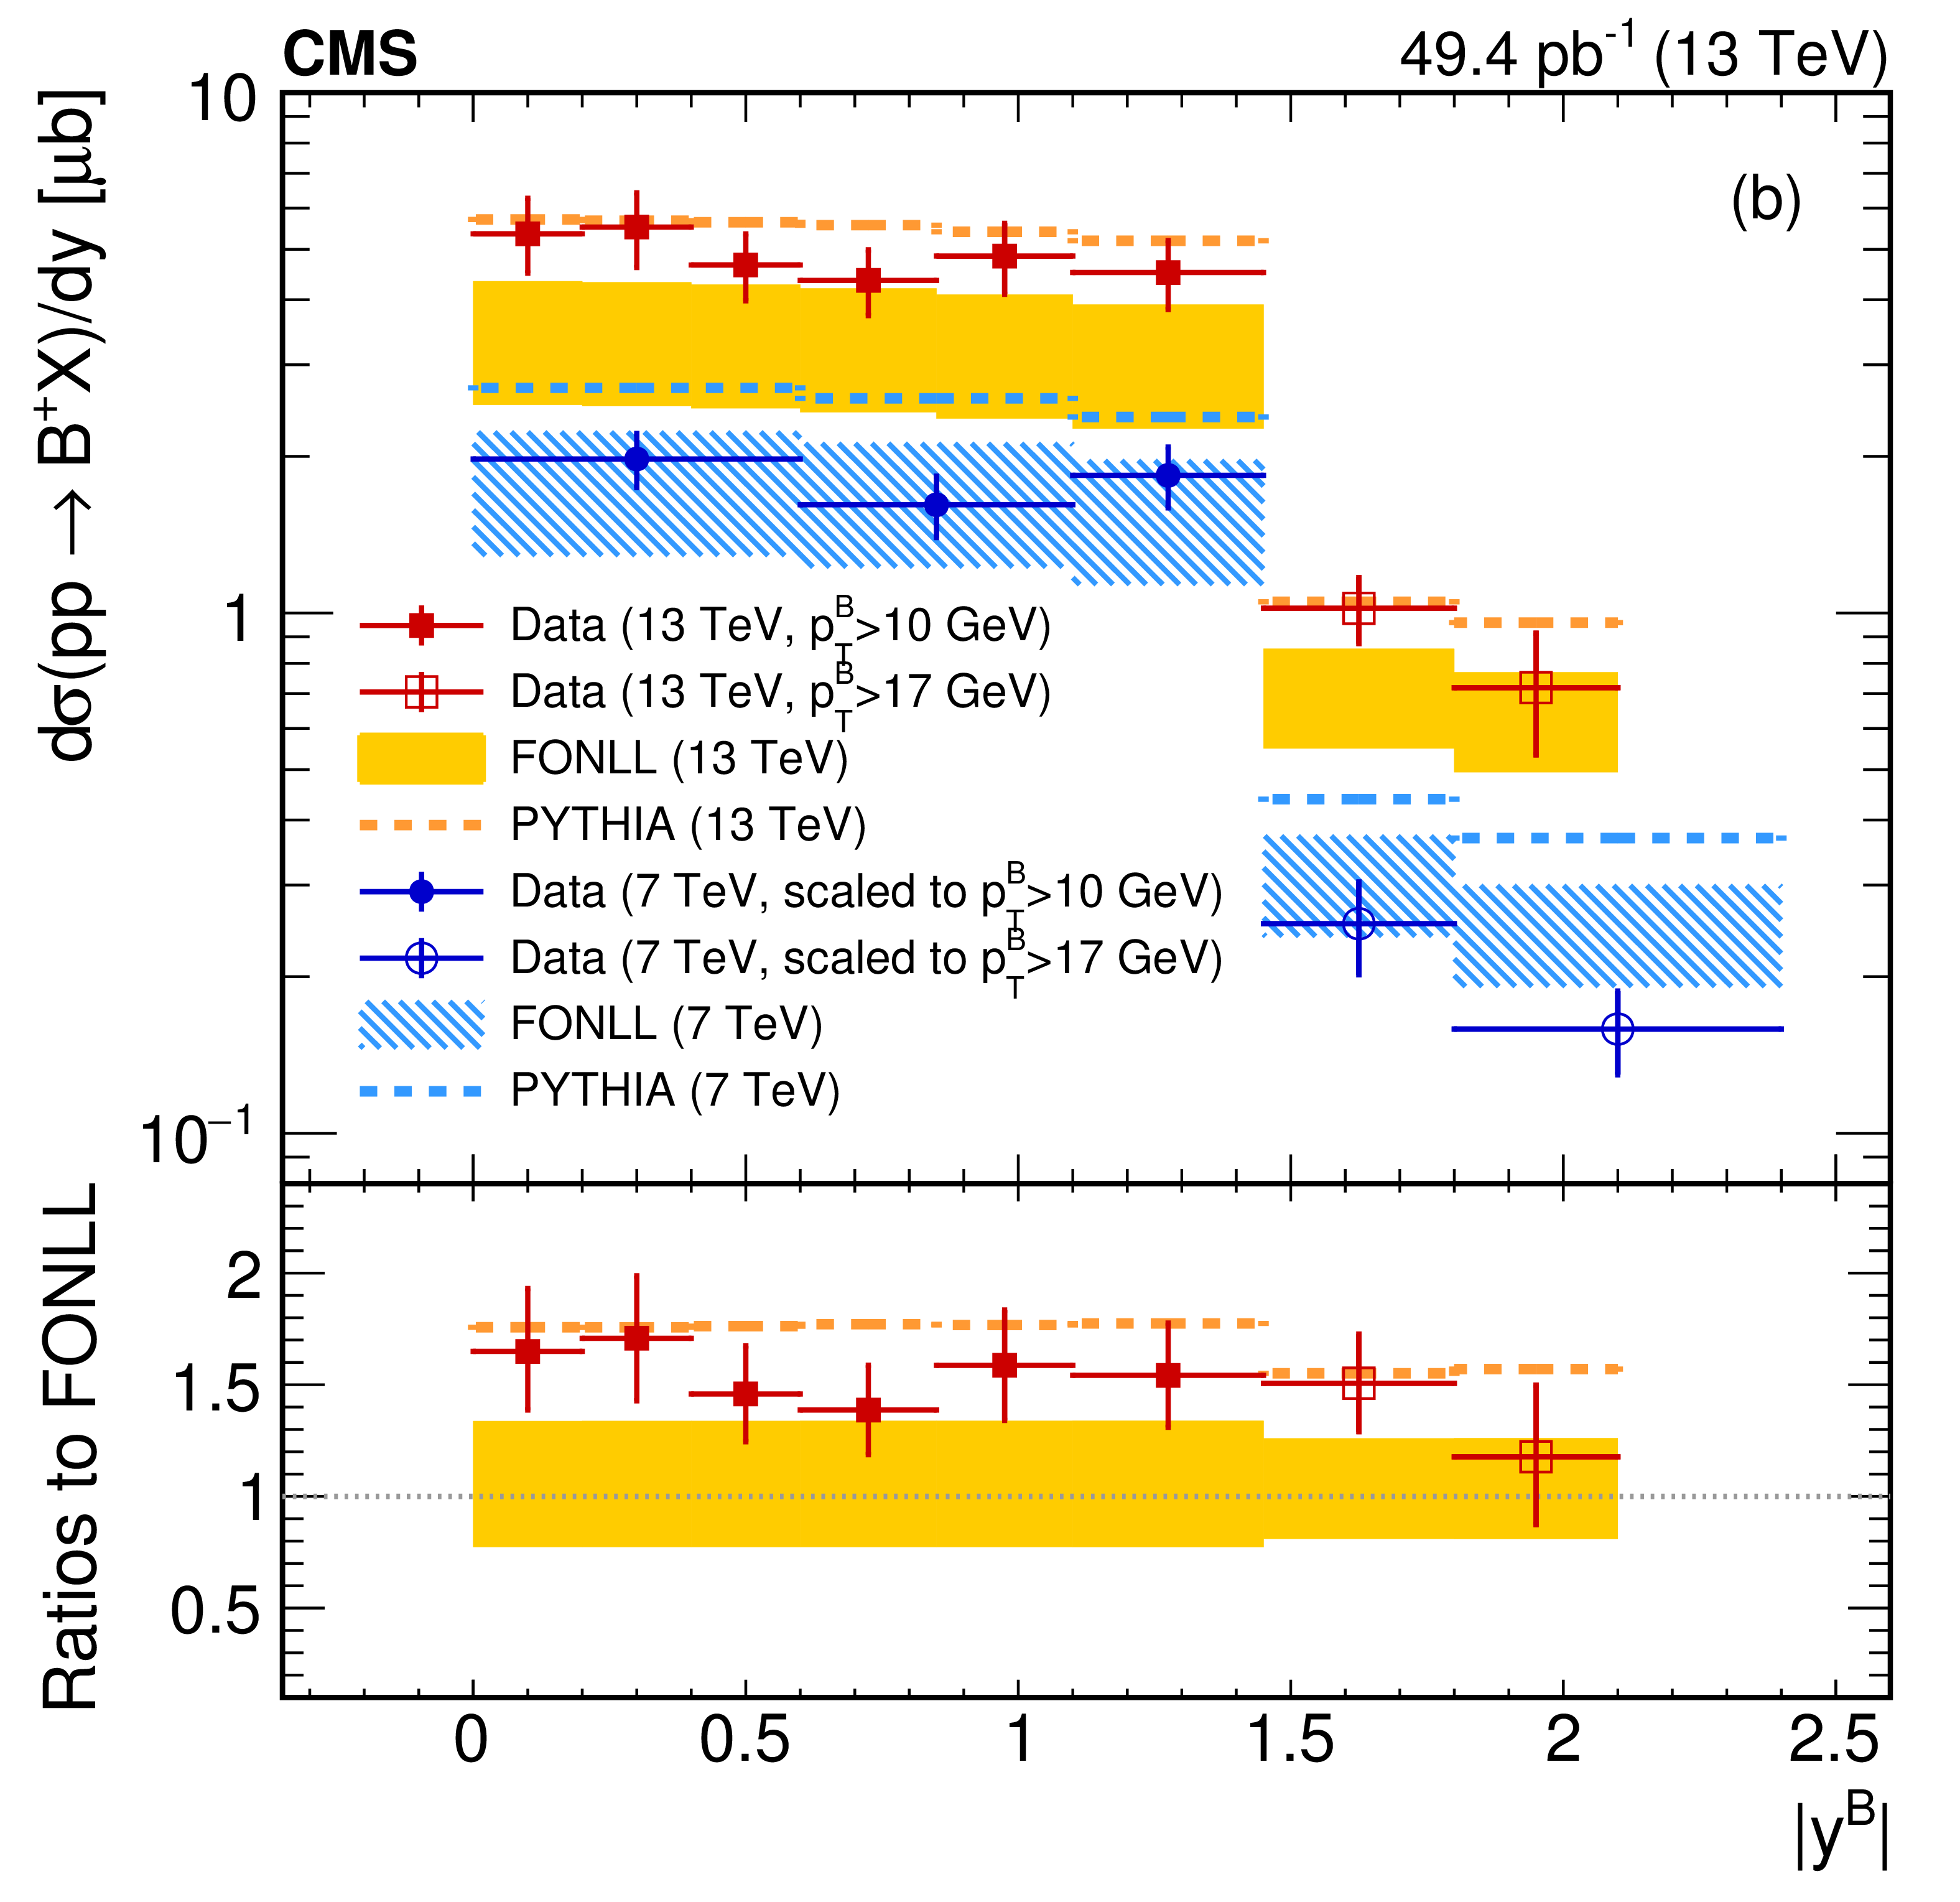
The differential cross sections as a function of , integrated within or for , and as a function of , with GeV or GeV, are shown in Figure 3 where they are compared to FONLL (shaded boxes) and PYTHIA (dashed lines) calculations. The 7 TeV results are also displayed on the plots for completeness. The bottom panels of Figure 3 display the data over FONLL cross-section ratios; the PYTHIA over FONLL ratios are also shown as dashed lines. The measured values show a reasonable agreement, both in terms of shape and normalization with FONLL calculations and with the results obtained with PYTHIA event generator.
4 Study of
In the SM, tree level diagrams do not contribute to Flavor Changing Neutral Current (FCNC) mediated decays. Such decays mainly proceed through higher-order loop diagrams, opening up the possibility for contributions from non-SM particles. Within the SM, the rare FCNC decays have small branching fractions, i.e, and [5]. Several extensions of the SM, such as supersymmetric models with non-universal Higgs boson masses, models containing leptoquarks, and the minimal supersymmetric standard model with large tan, predict enhancements to the branching fractions for these rare decays. The decay rates can also be suppressed for specific choices of model parameters. Over the past 30 years, a significant progress in the search sensitivity has been made with exclusion limits on the branching fractions improving by five orders of magnitude.
A search for the signal, where denotes or , is performed by the CMS experiment in the dimuon invariant mass regions around the nominal or mass. To avoid possible biases, the signal region GeV was kept blind until all selection criteria were established. The candidates are reconstructed from two oppositely charged muons that are required to have GeV and be consistent in direction and momentum with the muons that triggered the event. A boosted decision tree (BDT) constructed within the TMVA framework [6] is trained to further separate genuine muons from those arising from misidentified charged hadrons. The variables used in the BDT can be divided into four classes: basic kinematic quantities, silicon-tracker fit information, combined silicon and muon track fit information, and muon detector information. The BDT is trained on MC simulation samples of meson decays to kaons and muons. Compared to the “tight” muons, the BDT working point used to select muons for this analysis reduces the hadron-to-muon misidentification probability by 50% while retaining 90% of true muons. The probability to misidentify a charged hadron as a muon because of decay in flight or detector punch-through is measured in data from samples of well-identified pions, kaons and protons. This probability ranges from , , and for pions, kaons, and protons, respectively, depending on whether the particle is in the barrel or endcap, the running period, and the momentum. Each of these probabilities is assigned an uncertainty of 50%, based on differences between data and MC simulation.
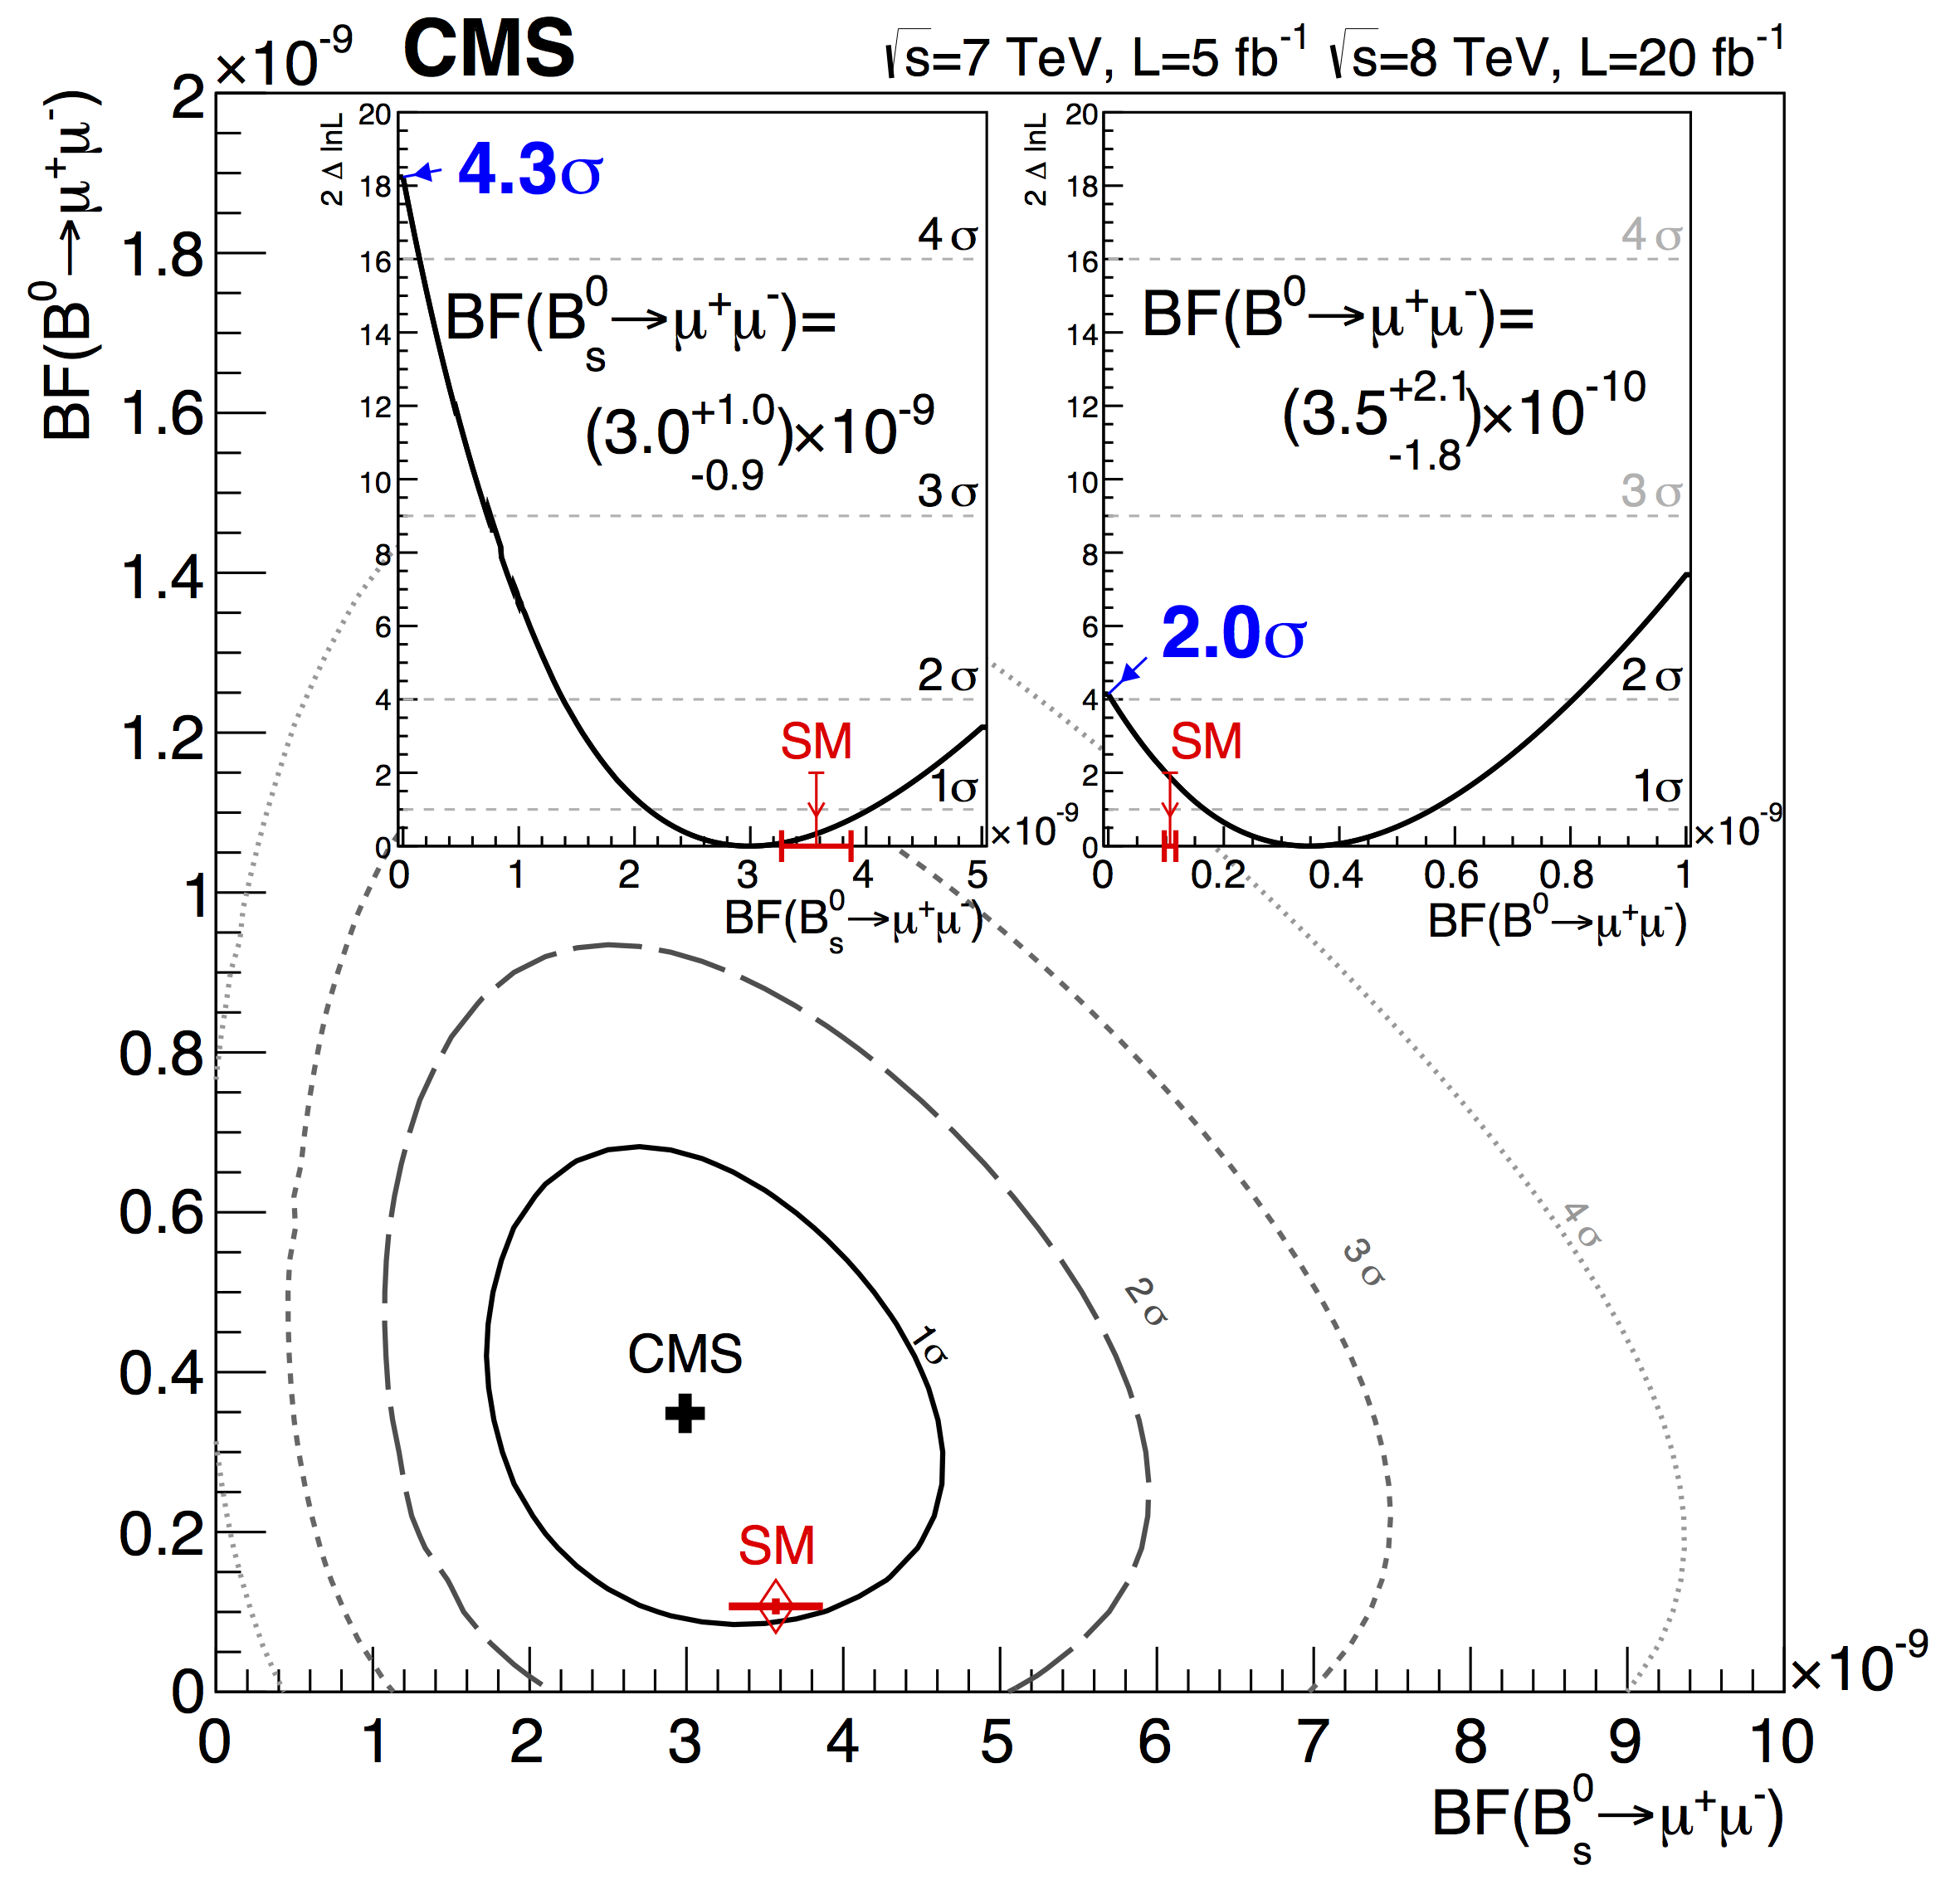
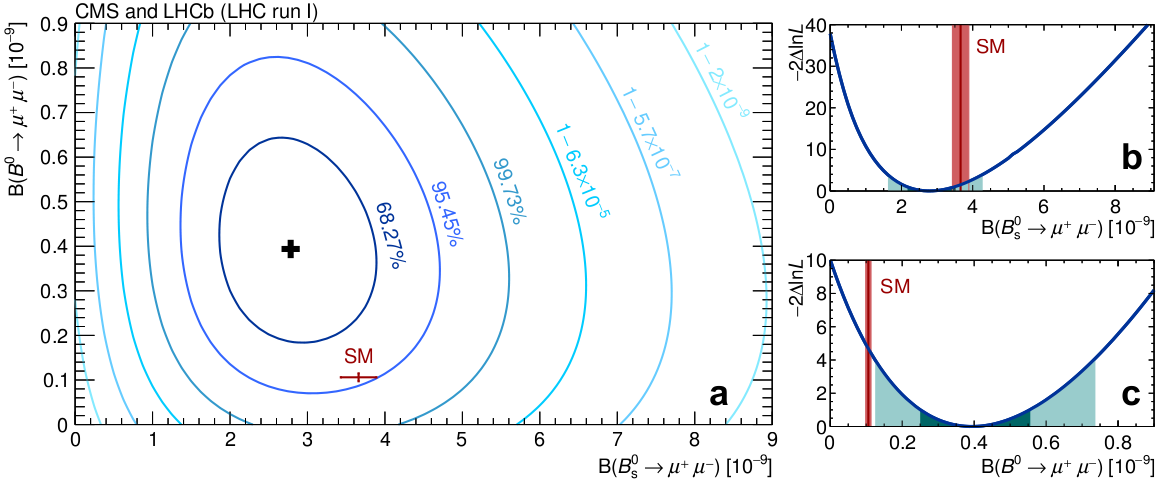
An unbinned maximum-likelihood fit to the distribution is used to extract the signal and background yields. Events in the signal window can result from genuine signal, combinatorial background, background from semileptonic -hadron decays, and peaking background. The probability density functions for the signal, semileptonic and peaking backgrounds are obtained from fits to MC simulation. The dimuon mass distributions for the four channels (barrel and endcap in 7 and 8 TeV data), further divided into categories corresponding to different bins in the BDT output, are fitted simultaneously. No significant excess is observed for and an upper limit of is set at 95% confidence level. For , an excess of events with significance of 4.3 standard deviations is observed, and a branching fraction of is determined, in agreement with the SM expectation [7]. The CMS and LHCb collaborations reported the combined result [8] for to exploit fully the statistical power of the data while accounting for the main correlations between them. The results are shown in Figure 4.
5 Angular analysis of the decay
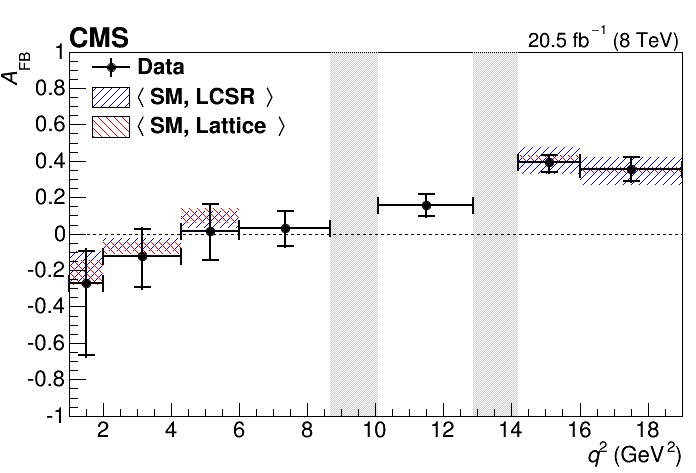
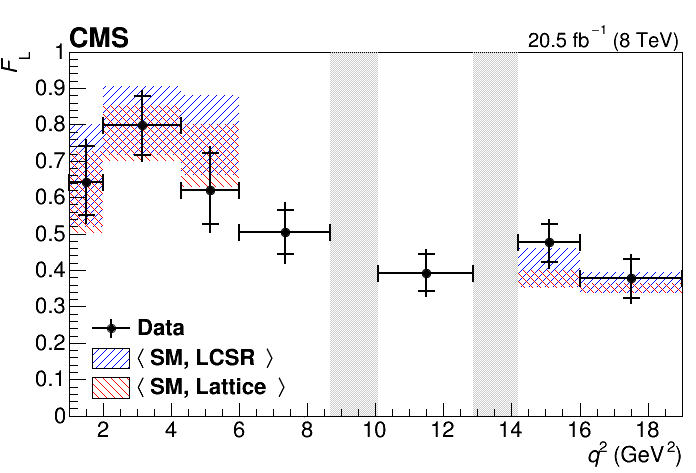
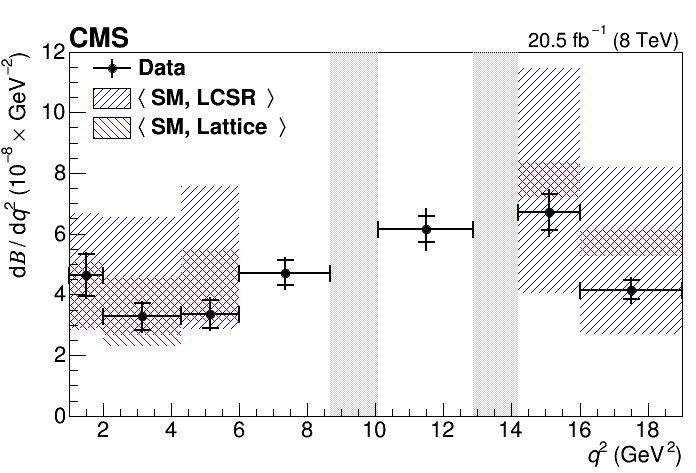
The FCNC decay provides many observables to search for new phenomena beyond the SM. The most notable ones are the forward-backward asymmetry of the muons, , the longitudinal polarization fraction of the , , and the differential branching fraction, . To better decipher NP effects, these quantities can be measured as a function of the dimuon invariant mass squared ().
The reconstruction of decay candidates requires two muons of opposite charge and two oppositely charged hadrons. The muons are required to match those that triggered the event readout, and also to pass general muon identification requirements [9]. The hadron tracks, required to fail the muon identification criteria, must have GeV and have a distance of closest approach to the beamspot in the transverse plane greater than twice the sum in quadrature of the distance uncertainty and the beamspot transverse size. The two hadrons with an invariant mass within 90 MeV of the nominal mass are selected for further consideration. The candidates are obtained by fitting the four charged tracks to a common vertex, which leads to an improvement in the resolution of the track parameters. Other selection requirements are also applied to further purify the selected sample.
For each bin, the observables of interest are extracted from an unbinned extended maximum likelihood fit to three variables: the invariant mass and the two angular variables and . Here, is the angle between the kaon momentum and the direction opposite to the () in the () rest frame, and is the angle between the positive (negative) muon momentum and the direction opposite to the () in the dimuon rest frame. We find the results (presented in Figure 5) to be consistent with SM predictions and previous measurements [10].
6 Conclusions
The results presented here show excellent prospects for rare decays at CMS. The Run1 and Run2 results are in good agreement with the theoretical predictions as well as with other experiments. CMS is collecting data at higher center-of-mass energy in Run2. At the end of Run2, the collected statistics would be enough in various cases to reach the level of NP prediction.
References
- [1] S. Chatrchyan et al. [CMS Collaboration], JINST 3 (2008) S08004, http://iopscience.iop.org/article/10.1088/1748-0221/3/08/S08004/pdf
- [2] CMS-DP-2016-059, http://cds.cern.ch/record/2212114?ln=en
- [3] K.A. Olive et al. [Particle Data Group], Chin. Phys. C 38 (2014) 090001, http://iopscience.iop.org/article/10.1088/1674-1137/38/9/090001/pdf
- [4] V. Khachatryan et al. [CMS Collaboration], arXiv:1609.00873 [hep-ex].
- [5] C. Bobeth et al., Phys. Rev. Lett. 112, 101801 (2014), https://journals.aps.org/prl/pdf/10.1103/PhysRevLett.112.101801 [arXiv:1311.0903 [hep-ph]].
- [6] A. Hoecker, P. Speckmayer, J. Stelzer, J. Therhaag, E. von Toerne, and H. Voss, arXiv:physics/0703039.
- [7] S. Chatrchyan et al. [CMS Collaboration], Phys. Rev. Lett. 111, 101804 (2013), http://journals.aps.org/prl/pdf/10.1103/PhysRevLett.111.101804 [arXiv:1307.5025 [hep-ex]].
- [8] V. Khachatryan et al. [CMS and LHCb Collaborations], Nature 522, 68 (2015), http://www.nature.com/nature/journal/v522/n7554/full/nature14474.html [arXiv:1411.4413 [hep-ex]].
- [9] S. Chatrchyan et al. [CMS Collaboration], JINST 7 (2012) P10002, http://iopscience.iop.org/article/10.1088/1748-0221/7/10/P10002/pdf [arXiv:1206.4071].
- [10] V. Khachatryan et al. [CMS Collaboration], Phys. Lett. B 753, 424 (2016), http://www.sciencedirect.com/science/article/pii/S0370269315009685 [arXiv:1507.08126 [hep-ex]].