CEMPlifying reionization
Abstract
The massive stars that ionised the Universe have short lifetimes and can only be studied near the time of formation, but any low mass stars that formed contemporaneously might be observable in the local Universe today. We study the abundance pattern and spatial distribution of these ‘siblings of reionizers’ (SoRs) in the eagle cosmological hydrodynamical simulation. SoRs tend to be enriched to super-solar levels in -elements compared to iron. In eagle galaxies resembling the Milky Way, percent of carbon-enhanced metal poor (CEMP) stars are SoRs. Conversely, percent of all SoRs are CEMP stars. This fraction increases to percent for SoRs of metallicity [Fe/H], and at such low metallicities, most of the CEMP stars are of CEMP-no subtype that are lacking neutron capture elements. Although these numbers may well depend on the details of the physical models implemented in eagle, the trends we describe are robust as they result from the strong feedback from star formation in early galaxies, itself a key ingredient of most current models of galaxy formation. We further find that most SoRs today reside in halos with mass M⊙, and 50 percent of them are in the halo of their central galaxy (distance kpc), mainly because they were accreted onto their current host rather than formed in-situ. To a good approximation, the SoRs are CEMP-no stars that reside in the stellar halos of massive galaxies, with nearly half of them contributing to the intracluster light in groups and clusters.
keywords:
dark ages, reionization – Galaxies : evolution – Galaxy : stellar content – solar neighbourhood1 Introduction
The measurement of the Thomson optical depth towards the surface of last scattering suggests that the intergalactic medium was completely reionized between redshift 6 and 9 (Planck Collaboration et al., 2015). The details of this process are uncertain and the nature of the sources that dominated the production of ionising photons is hotly debated, with ‘first’ stars (with zero-metallicity and thought to be relatively massive) and the first generation of galaxies, the leading candidates (e.g. Bouwens et al., 2015; Robertson et al., 2015; Sharma et al., 2016b). The contribution of quasars is controversial (compare e.g. Madau & Haardt 2015 to Parsa et al. 2017). Studying these candidate reionizers in detail is one of the main science drivers of the James Webb Space Telescope (JWST, Gardner et al., 2006); see e.g. Zackrisson et al. (2017).
An alternative way of learning about the source of reionization is through ‘galactic archaeology’(or ‘near field cosmology’): studying the properties of the oldest stars, in particular those that formed before , in the local Universe (e.g. Trenti et al., 2010; Frebel & Norris, 2015). High-mass stars, the likely dominant sources of ionising photons, have short lifetimes ( Myr), and hence only their remnants - black holes or neutron stars if they have remnants at all - would exist today; therefore the ‘reionizers’ themselves cannot be studied locally. However, lower-mass stars that formed contemporaneously with the reionizers may survive until the present day, and be detectable in the Milky Way and its dwarf satellites. We will refer to such stars as the ‘siblings of reionizers’ (SoRs for short). Their numbers, spatial distribution, and composition, may provide valuable clues to star formation during the epoch of reionization. Determining the ages of such old stars accurately is challenging, but their composition - the abundance of elements heavier than helium111We will use the symbol to refer to the mass fraction of such elements. - can be used as a proxy for age and it can provide a wealth of information on the assembly history of galaxies and the epoch of reionization (e.g. Beers & Christlieb, 2005; Bromm & Yoshida, 2011; Beers & Christlieb, 2005; Frebel & Norris, 2015). Specific stellar populations (e.g. SoRs) can then be identified by searching for the expected abundance patterns in metal poor stars (e.g. Frebel et al., 2008).
A number of surveys have searched the Milky Way and its dwarf satellites for metal poor stars (see Frebel & Norris, 2015, for a review). Bond (1970) conducted one of the first surveys to identify metal poor stars in the Galactic halo. Beers et al. (1985) (see also Beers et al. 1992) undertook an objective prism survey to identify low metallicity stars. More recently, the ESO-Hamburg Survey (Christlieb, 2003) and SEGUE/SDSS survey (Spite et al., 2011) detected a large number of stars with [Fe/H] (Norris et al., 2013) and a few with even lower abundance, up to [Fe/H] (Christlieb et al., 2002; Frebel et al., 2008; Keller et al., 2014), which interestingly appear to be the oldest stars discovered to date (Frebel & Norris, 2015). Many more stars will be discovered by upcoming surveys such as LAMOST (Li et al., 2015) and GAIA (Gaia Collaboration et al., 2016). The peculiar metallicity pattern of some of the detected stars has been suggested to point to enrichment by very early low- supernova (e.g. Aoki et al., 2014).
Rather than studying individual peculiar stars, it might be possible to study the abundances of large numbers of old stars and constrain the nature of reionizers as well as the properties of their host galaxy. Sharma et al. (2016a) used simulations to demonstrate that the bursty nature of star formation in galaxies at redshifts , combined with poor metal mixing in early enrichment events, gives rise to characteristic abundance patterns at low metallicity. In these simulations, Sharma et al. (2016a) found that the first generation of SoRs is enriched by massive low metallicity type II supernovae (SNe), whose yields exhibit large over abundances of carbon compared to iron (usually referred to as ‘CEMP’ stars - carbon enhanced metal poor stars) amongst other abundance peculiarities. Strong outflows powered by these same SNe then temporarily suppress further star formation in the young galaxy and enrich the surroundings with type II ejecta. Such winds are thought to be the origin of the metals detected in the intergalactic medium (e.g. Becker et al., 2006; Cai et al., 2017).
Star formation can resume once the galaxy accretes gas as part of the galaxy’s build-up. The newly accreted pristine gas can be enriched with carbon produced by asymptotic giant branch stars (AGB stars), yielding a second population of SoRs that are carbon enhanced compared to iron and to oxygen as well, additionally exhibiting s-process characteristics. The episodic inflow and outflows of gas in galaxies during their first star formation episodes - which we refer to as breathing modes - combined with the yields of stars at low metallicity, therefore predicts a large spread in [C/O] at low , with stars with high [C/O] that were enriched by AGB stars displaying additionally evidence for s-process burning, and stars with lower [C/O] displaying evidence for low- type II nucleosynthesic processing, such as CEMP-no characteristics (see Beers & Christlieb 2005 for an overview of the properties and nomenclature of CEMP stars, and, in particular, the definition of CEMP-s (for s-process enriched), CEMP-r (for r-process enriched), and CEMP-no stars). Sharma et al. (2016a) argue that the abundance pattern measured in low- Milky Way stars provides some support for this sequence of events. In this paper, we further investigate the connection between SoRs and CEMPs, by studying their chemical abundance patterns, statistics and spatial distributions in simulations.
The theoretical studies by White & Springel (2000) and Brook et al. (2007) have used dark matter only cosmological simulations to track dark matter particles judiciously chosen to be SoRs. This technique has also been adopted in semi-analytic models (e.g. Salvadori et al., 2010; Tumlinson, 2010). These studies suggest that the oldest Milky Way stars reside in the bulge - where they might be difficult to detect given the high stellar density there. Hydrodynamical simulations show that fragments of pre-reionization galaxies containing SoRs may be contained in local group dwarf galaxies today (Gnedin & Kravtsov 2006; see also Madau et al. 2008; Bovill & Ricotti 2011).
Simulations that include gas physics such as e.g. eagle (Schaye et al., 2015), do not have resolution at the scale of a star, but still can identify the fossils of early galaxies in the present day Universe and hence provide a clue to where to look for SoRs. Starkenburg et al. (2017) used the apostle simulation (Sawala et al., 2016) and found that though the overall population of metal poor old stars is centrally concentrated, the fraction of such stars to all stars, increases with distance from the centre. They further find that more than half of the most metal poor stars should be located outside the solar circle. The main driver of these trends has not been examined in detail yet, with radial migration of stars and the manner in which the MW accretes SoRs, both likely playing a role. These mechanisms were invoked by Navarro et al. (2017) (but see Haywood et al. (2015)) to explain the separation between the thin and the thick discs in the [/Fe] versus [Fe/H] diagrams for MW stars (Bovy et al., 2016).
In this paper, we use the eagle cosmological hydrodynamical simulation (Schaye et al., 2015; Crain et al., 2015) to identify SoRs among the metal poor stars. We further examine the spatial distribution of SoRs in galaxies and examine the processes that give rise to the trends that we find. The paper is structured as follows. Section 2 starts with a brief overview of the eagle simulations, and continues with a discussion of the key aspects of our model for reionizers and their siblings. In Section 3, we investigate the connection between SoRs and the observed stars in the Milky way. In Section 4, we explore the distribution of stars in other galaxies. We summarise our findings in Section 5.
2 Simulations and model assumptions
2.1 The eagle simulation
eagle (Schaye et al., 2015) is a suite of cosmological hydrodynamical simulations based on the gadget smoothed particle hydrodynamic (SPH) code (Springel, 2005). The simulation code includes modification to the hydro-solver to resolve known issues with standard SPH, as well as a set of ‘subgrid’ physics modules to capture the unresolved physics of interstellar medium, and of feedback from stars and accreting supermassive black holes. Numerical parameters that appear in these modules are calibrated to observations of galaxies, in particular the galaxy stellar mass function, the relation between galaxy mass and galaxy size, and the relation between galaxy mass and black hole mass, see Crain et al. (2015) for details. Galaxies are identified in post-processing with the subfind algorithm described by Springel et al. (2001); Dolag et al. (2009).
We briefly discuss the subgrid modules here (see Schaye et al. 2015 for full details). A spatially uniform but evolving background of UV, X-ray, CMB and ionising photons, as computed by Haardt & Madau (2001), is switched on at redshift 11 to mimic reionisation of hydrogen and of He i to He ii. The ionising radiation photo-heats gas and suppresses radiative cooling, the implementation of this process in eagle is discussed in detail by Wiersma et al. (2009a). The implementation of star formation follows Schaye & Dalla Vecchia (2008): a collisional gas particle is stochastically converted to a collisionless star particle above a metallicity-dependent density threshold, at a rate that guarantees that simulated galaxies follow the Kennicutt-Schmidt law (Kennicutt, 1998). Star particles in the simulation represent a single population of stars with a Chabrier (2003) initial mass function (IMF) in the mass range M⊙. Feedback from star formation is implemented using a scheme in which the loss of energy due to lack of resolution is compensated for by the additional injection of energy, see Crain et al. 2015. Stellar evolution is implemented as described by Wiersma et al. (2009b). The simulation traces the abundances of 11 elements (H, He, C, N, O, Ne, Mg, Si, S, Ca, Fe) and tracks how these are burned and synthesised by AGB stars, type Ia SNe, and massive stars and their type II SNe end stages, see Wiersma et al. (2009b) for a description of the stellar life-times and metallicity dependent yields used. Many properties of the simulated galaxies can be queried in the public data base described by McAlpine et al. (2016), and the particle data of the simulation has been made public as well (EagleTeam, 2017).
In this paper we use the eagle simulation labelled Recal-L025N0752 in table 2 of Schaye et al. (2015). The cubic simulation volume has comoving sides of 25 Mpc, and the simulation has dark matter particles of mass M⊙ and gas particles with initial mass M⊙; the Plummer-equivalent gravitational softening is at . We refer to this particular member of the eagle simulation suite as ‘the eagle simulation below.
2.2 Reionizers in eagle, and their siblings
Our model for reionization is described by Sharma et al. (2016b, 2017), we begin with a brief summary of this work. The model postulates that the escape fraction of ionising photons increases with redshift. Such a rapid increase is required to simultaneously explain the low values of measured in the local Universe, not overproduce the amplitude of the ionising background at redshifts , and yet have galaxies emit the required number of ionising photons to reionise the Universe by (e.g. Haardt & Madau, 2012; Khaire et al., 2015). In our model, the increase in is a consequence of star formation (in eagle and many other simulations, and presumably also in the Universe) becoming increasingly bursty at high , with bursts creating channels in the galaxy’s interstellar medium through which ionising photons can escape. The model follows Heckman (2001) in linking such bursty outflows to regions where star formation occurs where the surface density222 is the surface density of star formation averaged on , scale, similar to the star formation surface density appearing in the Kennicutt-Schmidt law (Kennicutt, 1998). of star formation, , is higher than a threshold value of . The model further assumes that when , the escape fraction of ionising photons is low, , whereas when , per cent.
There is some observational evidence to support the basic assumptions of our model. Most star formation in the local Universe occurs at surface densities (Brisbin & Harwit, 2012), hence the model predicts , consistent with the low values inferred observationally which are of order a few per cent or less (e.g. Bland-Hawthorn & Maloney, 2001; Bridge et al., 2010; Mostardi et al., 2015), even up to . In contrast high values of per cent are measured in the few local cases of extremely compact vigorously star forming galaxies (Borthakur et al., 2014; Izotov et al., 2016; Leitherer et al., 2016; Marchi et al., 2017), which indeed have . There is growing evidence that such compact galaxies with high star formation rate, and hence high values of , indeed are associated with strong outflows or at least have a strongly turbulent interstellar medium (e.g. Amorín et al., 2017; Chisholm et al., 2017), consistent with such turbulent motions creating channels allowing ionising photons to escape. The bursty nature of star formation in small galaxies at high- is well established in high-resolution numerical simulations (e.g. Wise & Cen, 2009; Kimm & Cen, 2014; El-Badry et al., 2016) where it allows ionising photons to escape (Trebitsch et al., 2017). In addition, the detection of metals in the intergalactic medium at (e.g. Becker et al., 2006) provides fossil evidence that outflows are indeed ubiquitous at high .
Galaxies at high redshift are small and compact in eagle (Furlong et al., 2017; Sharma et al., 2017) as well as in the observed Universe (e.g. Shibuya et al., 2015). We find that more than 80 percent of star formation at in eagle occurs at , which we take to yield percent. Given this we will assume in this paper that all star formation before contributes to reionization. We then divide stars formed at into two categories, ‘reionizers’ - those stars that produced the ionising photons and which have no age datable remnants today - and their siblings (SoRs) - stars that formed contemporaneously and are of low enough mass to survive to the present. Although SoRs do not necessarily have extremely low metallicity, their metallicity patterns may nevertheless provide evidence for enrichment by reionizers. Since detailed observations of individual stars is only possible locally, we begin by examining SoRs in Milky Way-like eagle galaxies.
3 SoRs in the Milky Way
To compare our predictions to data ideally involves studying the distribution of the oldest observed stars, for example in the Milky Way (MW) or its satellites. In this section we identify MW-like galaxies with central eagle galaxies that inhabit a dark matter halo of mass in the range M⊙ (see e.g. Wang et al. (2015) and references therein for motivation of this range).
3.1 Old but rich
Determining the ages of stars accurately is challenging, see e.g. the review by Soderblom (2010) on age-dating methods, which starts with the statement that ‘ages of individual stars cannot be measured’. Isochrone modelling requires high-resolution and high signal-to-noise spectra, which are now available for hundreds of stars in the MW’s bulge. With this method, uncertainties in the ages of individual stars are typically of the order of several gigayears or more (e.g. Bensby et al., 2017). Nucleocosmochronometry is based on radioactive-decay of elements and can in principle give more accurate and arguably less model dependent age estimates. This method also requires the best spectra possible, but even then the age uncertainty is of the order of gigayears; see e.g. Christlieb (2016) who collates data from a range of papers on ages of r-process enhanced, low- halo stars. The abundance of O and N can be used to determine ages of red giants that agree well with those inferred from astroseismology determinations (Martig et al., 2016). This promising new method still gives root mean square errors of the order of 40 per cent. Therefore even with the best data available, observations cannot really reliably determine whether an old star formed before (age of the Universe 1 Gyr) or (age = 1.6 Gyr), say.
Stellar metallicity is therefore often used in Local Group studies as a proxy for stellar age, under the reasonable assumption that on average stars that formed early on have low (e.g. Frebel & Norris, 2015). In eagle, an enriching particle spreads its metals to neighbouring gas particles as described by Wiersma et al. (2009b), without any further metal mixing or metal diffusion (neither physical nor numerical). We do so because at our resolution of per gas particle, we cannot hope to follow the intricacies of the turbulent metal mixing that might be occurring; see Sarmento et al. (2017) for a detailed model. Nevertheless eagle predicts a distribution of metallicities and metallicity gradients in MW-like galaxies that reproduces several observed trends; for example the statistics and trends of CEMP stars (Sharma et al., 2016a), and the emergence of a radially flaring thin disk of relative young stars with low [/Fe] and a non-flaring thick disk of mostly older stars with high [/Fe] (see the analysis by Navarro et al. 2017 of the apostle zooms of MW-like galaxy simulations (Sawala et al., 2016) performed with the eagle code).
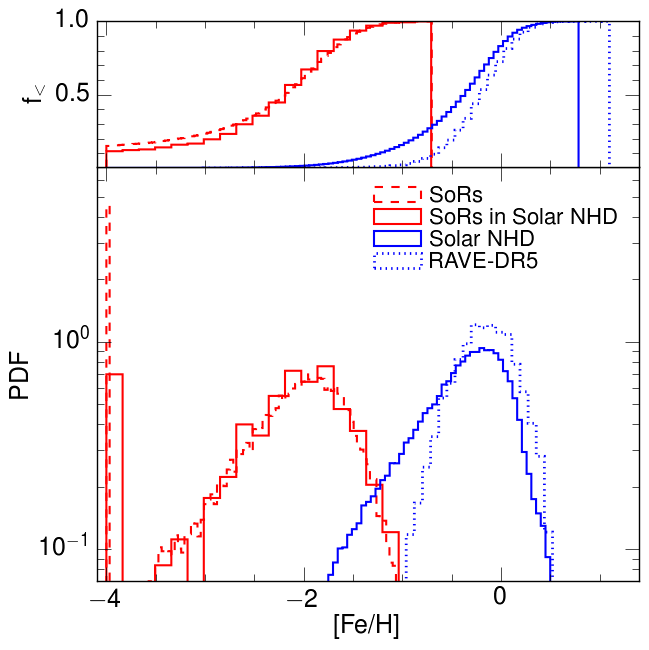
With this prescription for enrichment it is true that old stars in eagle MW galaxies tend to have low [Fe/H] (Fig. 1): 60 per cent of stars that formed before have [Fe/H], the usual criterium for being classified as metal poor (e.g. Beers & Christlieb, 2005). However the reverse is not necessarily true: only 15 per cent of stars that are metal poor formed before (see also Starkenburg et al. (2017)). Conversely, a small fraction of stars that formed before have a metallicity as high as - these stars are ‘old but (metal) rich’.
The distribution in [Fe/H] of stars in the solar neighbourhood (defined here as stars with height above the disc of kpc, and distance from the centre in the range, , of MW type eagle galaxies (blue histogram in Fig. 1) resembles that from observed stars from the rave database (Kunder et al., 2017) (dashed blue line), peaking at solar [Fe/H] and with a rapidly decreasing fraction of stars with super-solar [Fe/H]. However it is clear from Fig. 1 that eagle has considerably more stars with low [Fe/H] than are present in rave, an apparent inconsistency that has been seen in previous simulations as well. Pilkington et al. (2012) attributed it to a lack of metal diffusion and mixing in their simulations. Consistent with this assumption, Williamson et al. (2016) show that including metal diffusion, even at low levels, suppresses the number of low metallicity stars that form in their dwarf galaxy simulation. Given this limitation in the eagle simulation, we will mostly concentrate on metal ratios which are not so sensitive to lack of metal mixing, particularly when studying abundances of elements that are both produced by the same type II SNe. We therefore explore in the next sections whether the simulation can help to distinguish between SoRs () and metal poor stars ([Fe/H]) based on spatial location and abundance patterns.
3.2 Elemental abundance patterns of SoRs
The first generation of extremely low- or indeed metal free stars is expected to produce elements with characteristic patterns (e.g. Chan & Heger, 2016). Low-mass stars enriched with a mixture of metals may prove to be a smoking gun for the occurrence of such SNe and enable us to study their properties. Abundances in stars (Aoki et al., 2014; Cooke & Madau, 2014; Ishigaki et al., 2014; Frebel & Norris, 2015) and in low- damped-Lyman- systems (DLAs) (Cooke et al., 2011; Cooke et al., 2017) have been interpreted as evidence for such early star formation. However, rather than examining in detail the abundance pattern associated with a given single SN, less extreme early nucleosynthesis may also leave its imprint in the abundance pattern of a large number of low-mass stars that form contemporaneously. What do we expect?
The standard model of stellar evolution comprises three main nucleosynthesis channels: (i) Hydrostatic burning in massive stars, M⊙, and explosive burning in their type II core-collapse SNe descendants, which results in -element rich ashes (that possibly are r-process enriched 333The origin of r-process elements is debated. It is possible that this process only operates in sufficiently metal rich type II SNe, and/or it could also be that neutron star - neutron star mergers are the main source; see e.g. Thielemann et al. (2017); Pian et al. (2017).), (ii) Hydrostatic burning in intermediate mass stars (), yielding C, O and s-process neutron capture rich ejecta when the star is on the asymptotic giant branch (AGB stars), and (iii) explosive burning in Type Ia SNe yielding Fe-rich ejecta; see e.g. Nomoto et al. (2013) for a recent review. Given the short lifetimes of massive stars, compared to that of AGB or the lower-mass progenitors of type Ia SNe, then suggest that old stars are likely to be overabundant in elements; see e.g. the discussion by Bensby et al. (2014). If the massive stars that produce these elements are themselves metal poor, then we do not expect to detect large contributions from either the s- or the r-process. The abundance of elements with higher atomic number, A, is also likely to be suppressed compared to that of lower A elements, such as C, O and Mg for example (see e.g Sharma et al. 2016a for more discussion). CEMP-no stars (metal poor stars with [Fe/H] that are carbon enhanced, [C/Fe], and without evidence for either slow or fast neutron capture elements) are therefore good candidates. This motivates us to examine -element abundances of eagle MW-stars and of the SoRs.
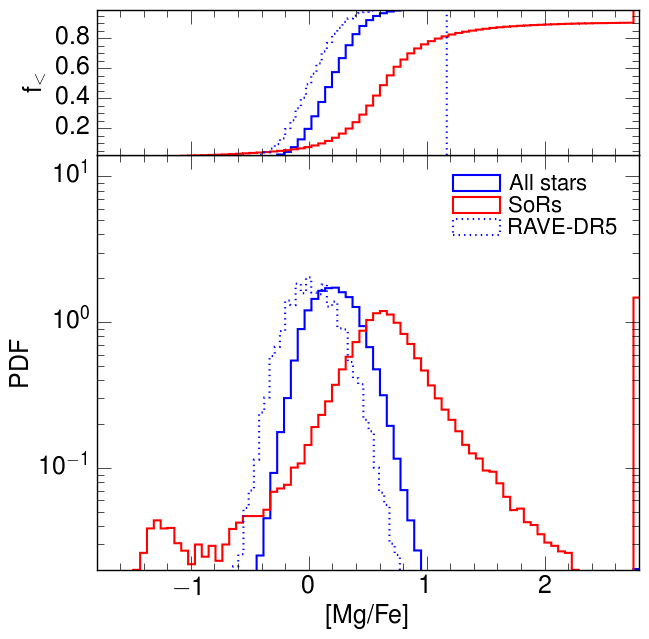
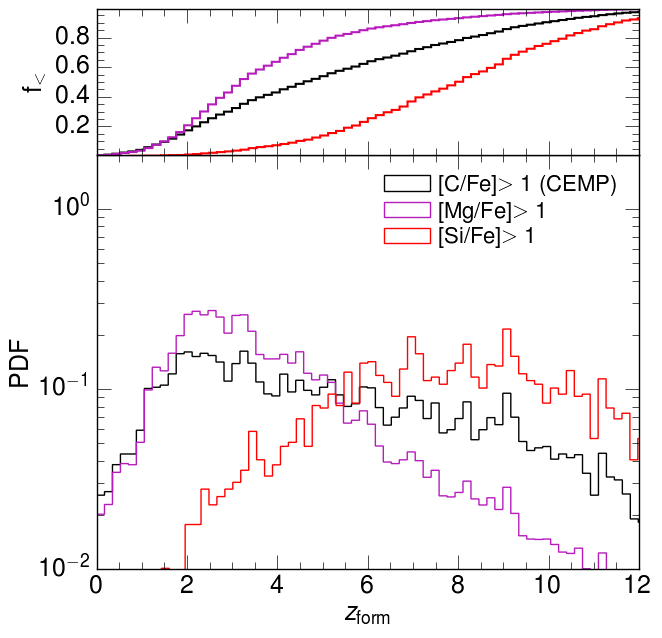
Stars that formed before indeed are -enriched, with typically [Mg/Fe] (Fig.2) - consistent with enrichment by type II ejecta. The distribution in [Mg/Fe] is broad in SoRs (and plausibly overestimated because of lack of metal mixing in eagle early galaxies444A striking feature of Fig. 2 is the abrupt lower limit in [Mg/Fe], which is very apparent in SoRs (red curve) and to a much lesser extent in the PDF of all eagle stars (blue curve). The origin of this lower limit is predominant enrichment by type Ia SNe. Indeed, the type Ia yields used in eagle have [Mg/Fe]. Stars also enriched with Fe by type II SNe have higher values of [Si/Fe].). Comparing the blue and red curves suggests that selecting stars with [Mg/Fe], say, could be used to identify SoRs. To examine this in more detail we plot the PDF of formation redshifts for stars with [/Fe] in Fig.3, for elements C, Mg, and Si. From this we see that 80% of stars with [C/Fe] or [Mg/Fe] formed before , whereas 80% of stars with [Si/Fe] even formed before . This would suggest that a high value of [Si/Fe] is therefore an even better indicator that the star is very old.
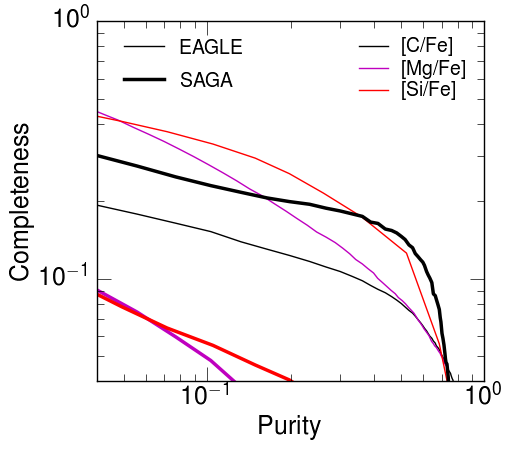
We characterise a selection criterion (e.g. [C/Fe]) for SoRs in terms of its ‘purity‘, , and ‘completeness’, , defined as
| (1) |
Here, denotes the fraction of stars that are SoRs, the fraction of stars that satisfy and are SoRs, etc. A pure selection criterion has , meaning a star that satisfies is most likely a SoR, a complete selection criterion has , meaning almost all SoRs satisfy it. For given , we can compute and , and varying the value of yields a curve in a diagram of versus . In Fig. 4, we plot these curves for [C/Fe], [Mg/Fe] and [Si/Fe] obtained for all the SoRs in MW-like galaxies in eagle (thin solid lines). At face value, these curves suggest that [Si/Fe] is the best compromise between purity and completeness, since, for example, [Si/Fe]= yields (i.e. only 30 per cent of stars with [Si/Fe] are not SoRs) and (i.e. 30 per cent of SoRs also have [Si/Fe]).
We attempt to compare these trends in eagle to those measured in observed very low metallicity stars taken from the saga database (Suda et al., 2011) 555The observational data represent a diverse collection of abundances of metal poor stars collected from the literature, and this comparison data is therefore neither complete nor unbiased - see Suda et al. (2011) for details.. To do so we assume that all saga stars are SoRs, which is not unreasonable given their very low [Fe/H]. This allows us to compute the completeness, , for saga stars. Of course we cannot compute their values, since this requires knowledge of the value of for all MW stars, and in addition which of these is a SoR. We therefore use the value of measured from eagle instead; this results in the thick solid lines in Fig. 4. It is immediately clear that for a given abundance ratio, [Mg/Fe] and [Si/Fe] are much more complete in eagle than in saga. We discuss this apparent discrepancy in more detail in Appendix Appendix: supernovae yields and the distribution of [/Fe]. However eagle does reproduce the dependence of on [C/Fe] measured in saga well: the fraction of SoRs stars that have [C/Fe] greater than some value agrees relatively well. For example the fraction of SoRs with [C/Fe] greater than 0.6, 0.8 and 1.0 in eagle is 17, 12 and 10 per cent, respectively, whereas when using saga (for computing completeness) it is slightly higher at 26, 20 and 17 per cent.
In eagle, high values of [C/Fe] select SoRs with high purity and completeness: a large fraction of CEMP stars are SoRs, and vice-versa. Given the relative good agreement in [C/Fe] ratios measured for SoRs in the saga database, suggests that the same is true for MW stars.
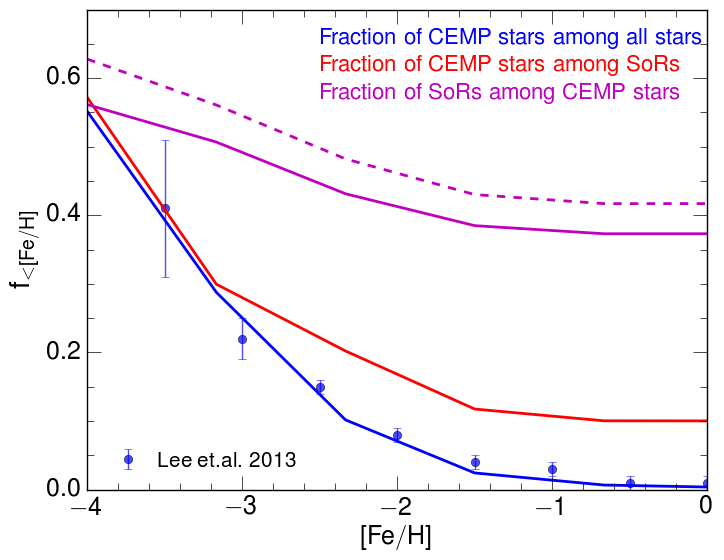
The approximate correspondence between CEMP stars and SoRs is illustrated in more detail in Fig. 5, where we plot the fraction of stars that are carbon enhanced as a function of [Fe/H]. This fraction increases with decreasing metallicity, rising from 10 per cent for stars with [Fe/H] to per cent for stars with [Fe/H] (blue solid curve). The trend in eagle agrees strikingly well with the observational data from Lee et al. (2013) (blue points with error bars)666The upcoming revised numbers from the observations are expected to be higher (Tim Beers pvt. comm. and Yoon et al. 2018)., which may be fortuitous. If we restrict the analysis to stars that formed before (SoRs), then the fraction is percent at [Fe/H] and percent at [Fe/H]. This demonstrates once more that a large fraction of SoRs are CEMPs, particularly at the lowest metallicities. Vice versa, the purple lines show that a large fraction of CEMPs are SoRs: 40 per cent of stars with [Fe/H] and [C/Fe] formed before in eagle rising to 60 per cent for [Fe/H]. We conclude that, at low metallicities ([Fe/H]), to a good approximation, CEMP stars and SoRs are the same population.
3.3 Spatial distribution of SoRs and CEMP stars in the Milky Way
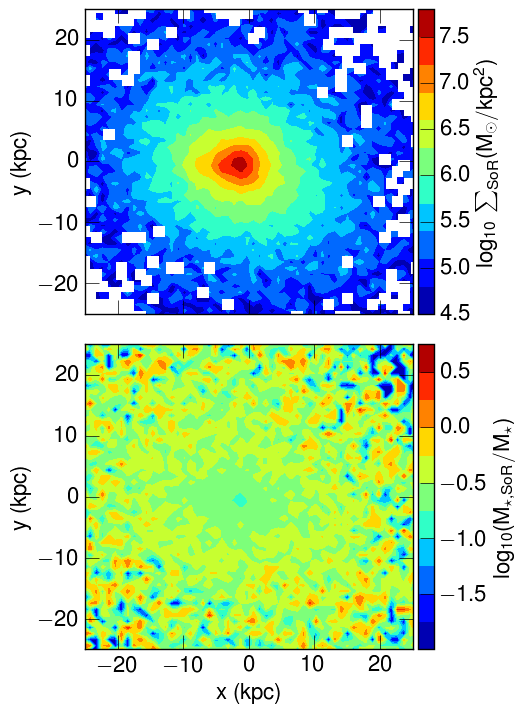
Observational searches for CEMP stars often scour the stellar halo (by studying halo stars that pass close to the Sun), and indeed meet with considerable success as discussed in the Introduction. Here we examine the spatial distribution of both SoRs and CEMPs in eagle MW galaxies.
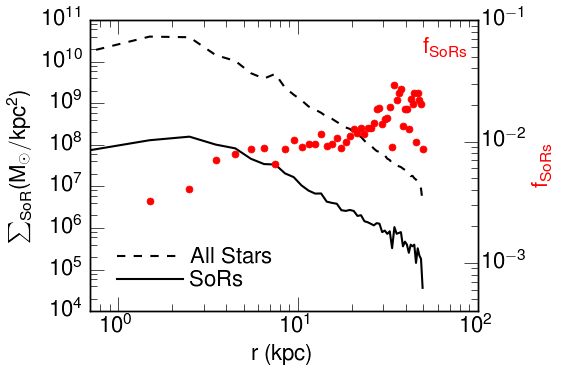
We find that the distribution of SoRs is centrally concentrated, reaching a central surface density of M⊙ kpc-2. However stars that form more recently are even more centrally concentrated, so that the fraction of stars that are SoRs increases with distance from the centre (Fig. 6). At the location of the Sun, kpc, we predict that per cent of stars within kpc of the disc are SoRs. So even though the number density of SoRs is higher in the bulge, it might still be easier to find them in the Solar neighbourhood.
These findings agree with earlier work. White & Springel (2000) used dark matter only simulations, labelling some of them as a ‘first stars’, and found that such old stars are concentrated in the bulge. Brook et al. (2007) confirm these findings but also report the possibility of there being a population of metal poor stars in the Galactic halo. Tumlinson (2010) and the semi analytic work by Salvadori et al. (2010), also conclude that the central region of the galaxy hosts most of its metal poor stellar population. The simulation of the MW-Andromeda ‘Local Group’, analysed by Starkenburg et al. (2017), that has the same subgrid physics as in this study, also predicts that most of the metal poor stars are centrally concentrated. In Fig. 6 we selected stars by age rather than metallicity, however as we discussed previously, more than 50 per cent of stars that are metal poor, [Fe/H], are also old, formation redshift . So the good agreement between our findings and those of other groups is not surprising.
We now turn our attention to the spatial distribution of CEMP stars. CEMP stars are further divided into CEMP-s stars (which are overabundant in slow neutron capture (‘s-process’) elements such as barium), CEMP-r stars (which are overabundant in rapid neutron capture (‘r-process’) elements), and CEMP-no that are not overabundant in either neutron capture element, and CEMP-rs that are overabundant in both; Beers & Christlieb (see e.g. 2005). The origin of CEMP-s stars is typically attributed to mass transfer from an AGB binary companion, but Sharma et al. (2017) suggests they may also originate from star formation in gas enriched only (or at least mostly) by ejecta from AGB stars. In contrast, CEMP-no stars may result from enrichment by low- type II SNe. Observationally, CEMP-no stars have typically lower [Fe/H] than CEMP-s stars (Aoki et al., 2007): at [Fe/H] most observed CEMP stars are of type CEMP-no (Frebel & Norris, 2015). Interestingly, the fraction of CEMP-no stars increases with distance from the galaxy’s centre (Carollo et al., 2014). What can be the reason for this?
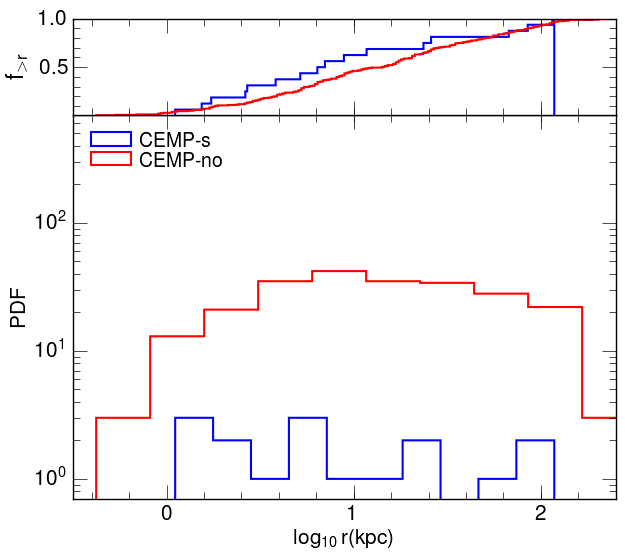
In eagle we found that a considerable fraction of SoRs are CEMPs, and hence we expect the fraction of CEMP stars to increases with distance from the centre, and with height above the disc, as do SoRs. We further divide CEMP stars ([C/Fe], [Fe/H]) in eagle into subtypes by using their absolute carbon abundance, A(C), and select CEMP-s stars by requiring A(C), and CEMP-no stars by requiring A(C), as in Yoon et al. (2016). In Figure 7 we plot the radial distribution of CEMP-no and CEMP-s stars in eagle MW galaxies. We find that CEMP-no stars have a more extended distribution compared to the CEMP-s stars: 50 per cent of CEMP-no stars have kpc, whereas 50 per cent of CEMP-s stars have kpc; at kpc most of the stars CEMP stars are CEMP-no. This is remarkably similar to observed, (Carollo et al., 2014; Lee et al., 2017). For example, Carollo et al. (2014) find that 70 percent of stars in the outer halo are of CEMP-no subtype.
The reason that most CEMP stars are CEMP-no in the outskirts of the eagle MW galaxies is closely related to the nature of star formation in progenitors of MW galaxies, as discussed by Sharma et al. (2016b, 2017). Star formation in these dwarf galaxies is very bursty leading to poor mixing of type II SN and AGB ejecta - this is what gives rise to the CEMP-no and CEMP-s stars in the first place, with CEMP-no stars forming during blow-out of a galaxy. When such galaxy fragments merge during the hierarchical build-up of the MW, many of their collisionless stars do not end-up in the centre of the merger remnant but rather in its outskirts: most of the extended population of CEMP-no stars was accreted (formed ex situ), while the majority of the centrally concentrated CEMP-s and CEMP-no stars were formed later and in situ (see Fig. 10 and 11).
3.4 SoRs in the integrals of motion plane
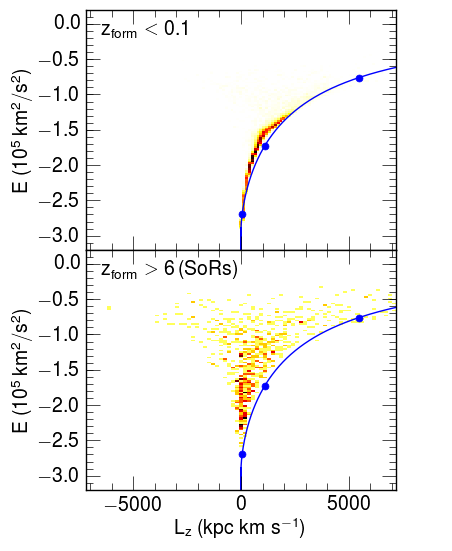
The spatial distribution of SoRs or CEMPs is usually described in terms of their distance to the centre and their height above the disc, , but of course these are not constants of the motion. A better description is in terms of their energy per unit mass, and spin angular momentum about the symmetry axis of the galaxy, ), which are at least approximately conserved. This distribution is plotted in Fig. 8 as a 2D histogram of the density of stars with given and , for stars in one eagle MW-galaxy.
Not surprisingly, the distributions of old and young stars is strikingly different: recently formed stars (top panel) hug the blue line, which corresponds to stars that are on nearly circular orbits in the disc, whereas old stars (bottom panel) lie almost symmetrically in the funnel-shaped region delineated by the (same) blue line on the right, and its mirror with respect to on the left. Clearly disc stars and accreted stars can be distinguished easily in the ‘integrals of motion’ plane (e.g. Helmi et al., 2017).
It is useful to make a simple model that captures where disc stars (i.e. stars on a circular orbit) and halo stars are located in an plane (e.g. Sellwood & Binney, 2002). We begin by writing , in terms of the velocity of a star on a circular orbit with radius , , where is enclosed mass, and ; is the gravitational potential. Once a potential-density pair is given, can be computed.
In the particular case of a Navarro, Frenk and White (NFW) halo (Navarro et al., 1996), with scale radius and maximum circular velocity , this relation can be written in parametric form as
| (2) |
where . For a given energy , the angular momentum of any star is , with given by Eq. (2), since a circular orbit has the largest angular momentum. Any star in this spherical halo therefore lies in the funnel-shaped region, defined by the curves and . The third equation is the first non-zero term in a Taylor expansion close to the centre, . In these relations, depends on and the concentration, , of the NFW halo, as
| (3) |
We used common notation, in which the radius of the halo is , defined such that the mean density within is 200 times the critical density, and is the total mass enclosed within .
4 SoRs in other galaxies
4.1 Distribution of SoRs across the galaxy population
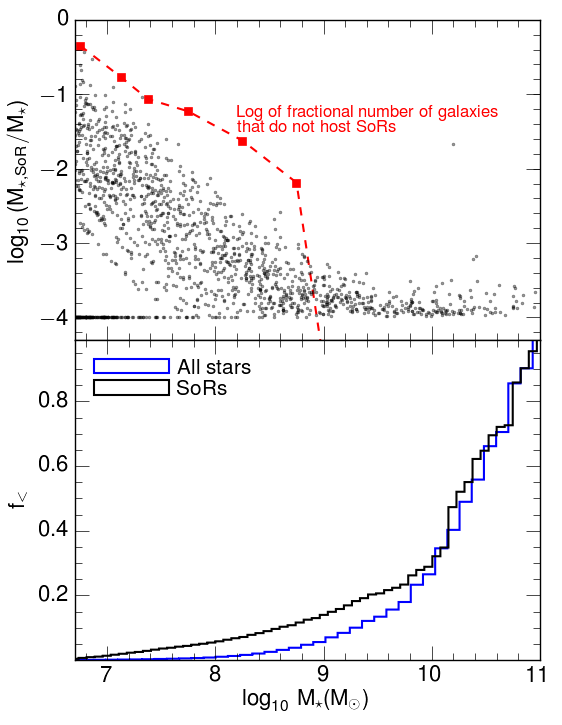
The shape of the galaxy stellar mass function at redshift is well described by a Schechter function (Schechter, 1976), i.e. a power-law at low mass and an exponential cut-off above a characteristic mass. Since the galaxy stellar-mass function is part of the calibration of eagle’s sub-grid parameterisation, the simulation reproduces the observed galaxy stellar mass function well (Schaye et al., 2015). For such a function, most mass is in massive galaxies, in particular we find that in eagle more than 70 per cent of the total stellar mass is in galaxies with M⊙ (blue line in Fig. 9).
The distribution of SoRs among those galaxies (black line in the lower panel of Fig. 9) is not very different from that of total mass for massive galaxies, but there is a noticeable difference at the low mass end: 20 per cent of SoRs reside in galaxies with M⊙, whereas for all stars that limit is M⊙: a larger fraction of SoRs is contained in lower-mass galaxies compared to the total stellar mass. Even though most SoRs are hosted by massive galaxies (70 per of the total mass in SoRs is in galaxies with M⊙), the fraction of mass in SoRs in these galaxies is typically quite low, of order 0.03 per cent. Vice versa, a small fraction of the total SoRs is in low-mass galaxies, yet some of these can have as much as 10 per cent of their total mass in SoRs. This is not contradictory, because a large fraction of low-mass galaxies do not host any SoRS at all: at M⊙, as much as 6 per cent of galaxies do not host any SoRs. We find that there is no obvious dependence of the SoRs mass fraction on whether a galaxy is a central or a satellite.
How do these results compare to previous findings? From their simulations, Gnedin & Kravtsov (2006) conclude that low mass dwarf satellites of the Milky Way may contain a high fraction of SoRs (see also Madau et al., 2008), with 5-15 per cent of the objects that exist at surviving to the present without undergoing significant evolution. Consistent with this, Frebel et al. (2014) reported that the nearby dwarf satellite Segue-I contains an unusually high fraction of metal poor stars (with all seven observed stars metal poor, [Fe/H]-1.4, and -enhanced, [/Fe]0.5); see also Webster et al. (2016). This is not inconsistent with our findings, however we suggest that the scatter in the abundance of SoRs at low values of may be very large.
4.2 Spatial distribution of SoRs in galaxies
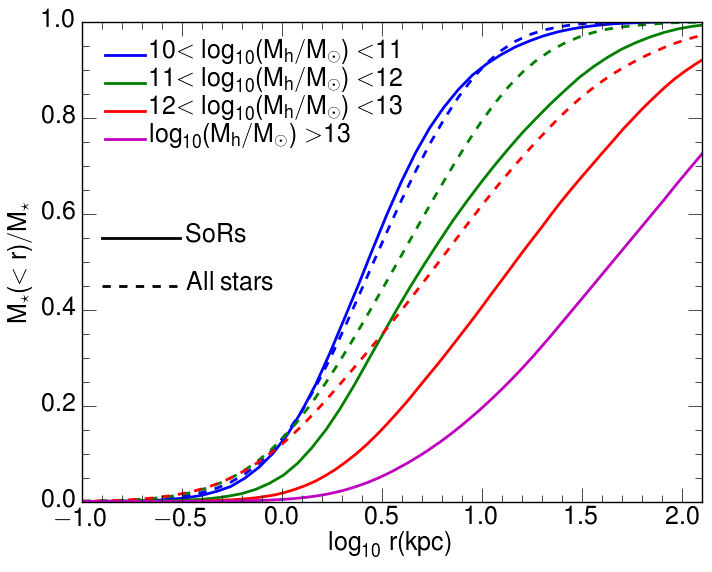
The radial profile of total stellar mass is compared to that of SoRs in Figure 10, for three bins in halo mass. There is a clear trend: SoRs are less centrally concentrated than the total stellar distribution, and this is more so in more massive halos. We demonstrated that the distribution of SoRs is more extended than that of all stars in MW-like galaxies in section 3.3, clearly this is true for all galaxies. There we argued that this is because many SoRs are accreted, building up an extended halo of very old stars.
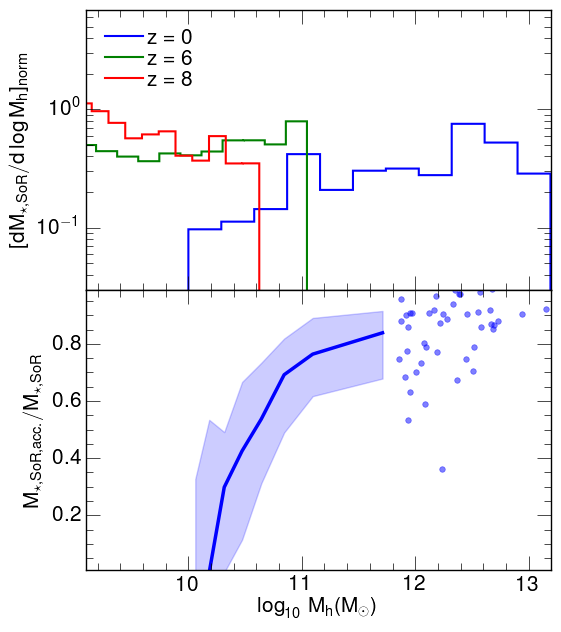
The fraction of SoRs in a galaxy that are accreted, rather than formed in situ, increases with halo mass, (Fig. 11, bottom panel). For a MW-like halo mass of M⊙ we find that 80 per cent of SoRs are accreted, and this fraction rises further with increasing . However, there is considerable scatter. At low values of , the accreted fraction drops quickly, to as low as 20 per cent at M⊙.
The relation between the mass of the halo in which a SoR formed, and the mass of the halo in which it resides today, is illustrated further in Fig. 11, top panel), which shows the fraction of mass in SoRs that resides in halos of a given mass. At high-, SoRs reside predominantly in relatively low halos, and M ⊙ at , and , respectively. Therefore SoRs form in relatively low mass galaxies. Yet today, they are found predominantly in massive halos, as we showed before. This is consistent with these massive halos having mostly accreted their SoRs, which explains why their spatial distribution is so much more extended than that of the in situ formed stars, which dominate the stellar mass of a galaxy.
From the above we conclude that SoRs formed in low-mass halos. When these halos merged hierarchically to form more massive halos, these stars were accreted as well and build-up the stellar halo of the merger remnant. As a result, SoRs at , inhabit mostly the outskirts of the more massive halos.
In fact, in more massive haloes, , which includes groups and clusters, approximately 80 percent of the SoRs reside in the outskirts of the central galaxy at distances kpc (magenta curve in Fig. 10). Furthermore, 3 percent of all the stars at kpc in such massive haloes are SoRs. Combined with the fact that about 50 per cent of SoRs are associated with these massive galaxies (Fig. 9), we conclude that almost half of all SoRs in the Universe form part of the stellar halo of massive galaxies, where they contribute to their intra-cluster light.
5 Summary and Conclusion
The Universe was most likely reionized by massive stars. These have short lifetimes, and hence leave no age-datable remnants today. However any low-mass stars that formed contemporaneously with these ‘reionizers’ can be studied in the local universe and the galactic archaeology of such ‘siblings of reionization’ (SoRs) is an alternative way to study reionization.
In this paper, we identified SoRs in the eagle simulations (Schaye et al., 2015; Crain et al., 2015) as stars that formed before redshift . This is motivated by the model for reionization by Sharma et al. (2017), who suggest that stars formed at high surface density of star formation are mostly responsible for producing the ionising photons that escaped their galaxy and ionised the intergalactic medium. Their reasoning is that, when star formation occurs at high surface density, it efficiently drives winds that create channels through which ionising photons can escape. In the eagle simulations we find that most star formation above occurs at the required threshold surface density - because high- galaxies form stars vigorously and are small - hence our identification of SoRs with stars that form before (none of our results would change significantly if we used or instead).
We examined the properties of SoRs in eagle galaxies that resemble the Milky Way (MW) in Section 3, assuming MW galaxies are hosted in halos of mass M ⊙. We find that SoRs are significantly overabundant in -elements, a consequence of rapid enrichment by low- type II SNe. Comparing these overabundances to MW stars from the saga database (Suda et al., 2011), we find that overabundances in Si and Mg are higher in eagle than observed, plausibly as a result of the lack of mixing with type Ia ejecta and overly high type II yields in the simulation. This does not affect carbon as much because carbon is not produced in type Ia SNe. Indeed, we find good agreement between [C/Fe] as a function of [Fe/H] between eagle and sage.
Examining [C/Fe] abundances in eagle MW-galaxies in more detail, we find that a significant fraction of SoRs are CEMP stars and similarly, a large fraction of CEMP stars, in particular of CEMP-no stars (lacking in neutron capture elements), are SoRs. Quantitatively, 45 per cent of CEMP stars ([C/Fe]) at [Fe/H] are SoRs, and conversely 20 per cent of SoRs at [Fe/H] are CEMP stars (with [C/Fe]). These numbers may well depend on the physical models implemented in the simulation; nevertheless the trends that we obtain are likely robust.
One of the trends that we find is that the fraction of stars (and SoRs) that are carbon enhanced (CEMP) increases rapidly with decreasing metallicity (Fig. 5). At metallicities of [Fe/H], more than half of CEMP stars are SoRs, and conversely, a similar fraction ( per cent) of SoRs are CEMP stars. Furthermore, the CEMP stars at such low metallicities are of CEMP-no subtype. This leads us to conclude that, at lowest metallicities, to a good approximationCEMP-no stars and SoRs are the same population.
We also examined the distribution of SoRs in other galaxies in the simulation (Section 4). Some low-mass galaxies have no SoRs at all, whereas some have a very high fraction of SoRs, up to 10 per cent. More massive galaxies typically have a small fraction of SoRs, of order 0.01 per cent. The shape of the galaxy stellar mass function still results in most SoRs inhabiting massive galaxies: approximately 70 per cent of SoRs are in galaxies of mass M⊙. A large fraction of these are accreted rather than formed in situ. The net result is that SoRs tend to inhabit the outskirts of massive galaxies.
We therefore conclude that CEMP-no stars are the siblings of the stars that reionized the Universe. These stars formed in small galaxies before and percent of them ended up in the outskirts of massive galaxies today, where they contribute to the intracluster light. Determination of the mass in such intracluster stars can be translated into constraints on the initial mass function of the stars that reionized the Universe since these low mass stars formed contemporaneously with the high mass stars that produced the ionizing photons. Obtaining more details on the abundances of CEMP-no stars in the intracluster light may be challenging, but a good start could be made by studying them in the Milky Way, where we predicted that SoRs (and CEMP-no stars) are mostly found in the stellar halo. Our model of reionization would be invalidated if such investigations were to uncover a very low overall number of such stars.
Acknowledgements
We thank an anonymous referee for thoughtful comments. We thank our colleagues (J. Schaye, M. Schaller, R. Crain and R. Bower) for sharing with us the data from the eagle simulation. This study was funded by the Science and Technology Facilities Council [grant number ST/F001166/1] and by the Interuniversity Attraction Poles Programme of the Belgian Science Policy Office ([AP P7/08 CHARM]). The DiRAC Data Centric system at Durham University was used this study. This system is run by the Institute for Computational Cosmology on behalf of the STFC DiRAC HPC Facility (www.dirac.ac.uk); the equipment was funded by BIS National E-Infrastructure capital grant ST/K00042X/1, STFC capital grant ST/H008519/1, and STFC DiRAC; as a part of the National E-Infrastructure. M. S. is supported by an STFC post-doctoral fellowship.
References
- Amorín et al. (2017) Amorín R., et al., 2017, Nature Astronomy, 1, 0052
- Aoki et al. (2007) Aoki W., Beers T. C., Christlieb N., Norris J. E., Ryan S. G., Tsangarides S., 2007, ApJ, 655, 492
- Aoki et al. (2014) Aoki W., Tominaga N., Beers T. C., Honda S., Lee Y. S., 2014, Science, 345, 912
- Becker et al. (2006) Becker G. D., Sargent W. L. W., Rauch M., Simcoe R. A., 2006, ApJ, 640, 69
- Beers & Christlieb (2005) Beers T. C., Christlieb N., 2005, ARA&A, 43, 531
- Beers et al. (1985) Beers T. C., Preston G. W., Shectman S. A., 1985, AJ, 90, 2089
- Beers et al. (1992) Beers T. C., Preston G. W., Shectman S. A., 1992, AJ, 103, 1987
- Bensby et al. (2014) Bensby T., Feltzing S., Oey M. S., 2014, A&A, 562, A71
- Bensby et al. (2017) Bensby T., et al., 2017, A&A, 605, A89
- Bland-Hawthorn & Maloney (2001) Bland-Hawthorn J., Maloney P. R., 2001, ApJ, 550, L231
- Bond (1970) Bond H. E., 1970, ApJS, 22, 117
- Borthakur et al. (2014) Borthakur S., Heckman T. M., Leitherer C., Overzier R. A., 2014, Science, 346, 216
- Bouwens et al. (2015) Bouwens R. J., Illingworth G. D., Oesch P. A., Caruana J., Holwerda B., Smit R., Wilkins S., 2015, ApJ, 811, 140
- Bovill & Ricotti (2011) Bovill M. S., Ricotti M., 2011, The Astrophysical Journal, 741, 18
- Bovy et al. (2016) Bovy J., Rix H.-W., Schlafly E. F., Nidever D. L., Holtzman J. A., Shetrone M., Beers T. C., 2016, ApJ, 823, 30
- Bridge et al. (2010) Bridge C. R., et al., 2010, ApJ, 720, 465
- Brisbin & Harwit (2012) Brisbin D., Harwit M., 2012, ApJ, 750, 142
- Bromm & Yoshida (2011) Bromm V., Yoshida N., 2011, ARA&A, 49, 373
- Brook et al. (2007) Brook C. B., Kawata D., Scannapieco E., Martel H., Gibson B. K., 2007, ApJ, 661, 10
- Cai et al. (2017) Cai Z., Fan X., Dave R., Finlator K., Oppenheimer B., 2017, preprint, (arXiv:1709.10111)
- Carollo et al. (2014) Carollo D., Freeman K., Beers T. C., Placco V. M., Tumlinson J., Martell S. L., 2014, ApJ, 788, 180
- Chabrier (2003) Chabrier G., 2003, PASP, 115, 763
- Chan & Heger (2016) Chan C., Heger A., 2016, preprint, (arXiv:1610.06339)
- Chisholm et al. (2017) Chisholm J., Orlitová I., Schaerer D., Verhamme A., Worseck G., Izotov Y. I., Thuan T. X., Guseva N. G., 2017, A&A, 605, A67
- Christlieb (2003) Christlieb N., 2003, in Schielicke R. E., ed., Reviews in Modern Astronomy Vol. 16, Reviews in Modern Astronomy. p. 191 (arXiv:astro-ph/0308016), doi:10.1002/9783527617647.ch8
- Christlieb (2016) Christlieb N., 2016, Astronomische Nachrichten, 337, 931
- Christlieb et al. (2002) Christlieb N., et al., 2002, Nature, 419, 904
- Cooke & Madau (2014) Cooke R. J., Madau P., 2014, ApJ, 791, 116
- Cooke et al. (2011) Cooke R., Pettini M., Steidel C. C., Rudie G. C., Nissen P. E., 2011, MNRAS, 417, 1534
- Cooke et al. (2017) Cooke R. J., Pettini M., Steidel C. C., 2017, MNRAS, 467, 802
- Crain et al. (2015) Crain R. A., et al., 2015, MNRAS, 450, 1937
- Dolag et al. (2009) Dolag K., Borgani S., Murante G., Springel V., 2009, MNRAS, 399, 497
- EagleTeam (2017) EagleTeam 2017, preprint, (arXiv:1706.09899)
- El-Badry et al. (2016) El-Badry K., Wetzel A., Geha M., Hopkins P. F., Kereš D., Chan T. K., Faucher-Giguère C.-A., 2016, ApJ, 820, 131
- Frebel & Norris (2015) Frebel A., Norris J. E., 2015, ARA&A, 53, 631
- Frebel et al. (2008) Frebel A., Collet R., Eriksson K., Christlieb N., Aoki W., 2008, ApJ, 684, 588
- Frebel et al. (2014) Frebel A., Simon J. D., Kirby E. N., 2014, ApJ, 786, 74
- Furlong et al. (2017) Furlong M., et al., 2017, MNRAS, 465, 722
- Gaia Collaboration et al. (2016) Gaia Collaboration et al., 2016, A&A, 595, A1
- Gardner et al. (2006) Gardner J. P., et al., 2006, Space Sci. Rev., 123, 485
- Gnedin & Kravtsov (2006) Gnedin N. Y., Kravtsov A. V., 2006, The Astrophysical Journal, 645, 1054
- Haardt & Madau (2001) Haardt F., Madau P., 2001, in Neumann D. M., Tran J. T. V., eds, Clusters of Galaxies and the High Redshift Universe Observed in X-rays. (arXiv:astro-ph/0106018)
- Haardt & Madau (2012) Haardt F., Madau P., 2012, ApJ, 746, 125
- Haywood et al. (2015) Haywood M., Di Matteo P., Snaith O., Lehnert M. D., 2015, A&A, 579, A5
- Heckman (2001) Heckman T. M., 2001, in Hibbard J. E., Rupen M., van Gorkom J. H., eds, Astronomical Society of the Pacific Conference Series Vol. 240, Gas and Galaxy Evolution. p. 345 (arXiv:astro-ph/0009075)
- Helmi et al. (2017) Helmi A., Veljanoski J., Breddels M. A., Tian H., Sales L. V., 2017, A&A, 598, A58
- Ishigaki et al. (2014) Ishigaki M. N., Tominaga N., Kobayashi C., Nomoto K., 2014, ApJ, 792, L32
- Izotov et al. (2016) Izotov Y. I., Orlitová I., Schaerer D., Thuan T. X., Verhamme A., Guseva N. G., Worseck G., 2016, Nature, 529, 178
- Keller et al. (2014) Keller S. C., et al., 2014, Nature, 506, 463
- Kennicutt (1998) Kennicutt Jr. R. C., 1998, ARA&A, 36, 189
- Khaire et al. (2015) Khaire V., Srianand R., Choudhury T. R., Gaikwad P., 2015, preprint, (arXiv:1510.04700)
- Kimm & Cen (2014) Kimm T., Cen R., 2014, ApJ, 788, 121
- Kunder et al. (2017) Kunder A., et al., 2017, AJ, 153, 75
- Lee et al. (2013) Lee Y. S., et al., 2013, AJ, 146, 132
- Lee et al. (2017) Lee Y. S., Beers T. C., Kim Y. K., Placco V., Yoon J., Carollo D., Masseron T., Jung J., 2017, ApJ, 836, 91
- Leitherer et al. (2016) Leitherer C., Hernandez S., Lee J. C., Oey M. S., 2016, ApJ, 823, 64
- Li et al. (2015) Li H.-N., Zhao G., Christlieb N., Wang L., Wang W., Zhang Y., Hou Y., Yuan H., 2015, ApJ, 798, 110
- Madau & Haardt (2015) Madau P., Haardt F., 2015, ApJ, 813, L8
- Madau et al. (2008) Madau P., Kuhlen M., Diemand J., Moore B., Zemp M., Potter D., Stadel J., 2008, The Astrophysical Journal Letters, 689, L41
- Marchi et al. (2017) Marchi F., et al., 2017, preprint, (arXiv:1710.10184)
- Martig et al. (2016) Martig M., et al., 2016, MNRAS, 456, 3655
- McAlpine et al. (2016) McAlpine S., et al., 2016, Astronomy and Computing, 15, 72
- Mostardi et al. (2015) Mostardi R. E., Shapley A. E., Steidel C. C., Trainor R. F., Reddy N. A., Siana B., 2015, ApJ, 810, 107
- Navarro et al. (1996) Navarro J. F., Frenk C. S., White S. D. M., 1996, ApJ, 462, 563
- Navarro et al. (2017) Navarro J. F., et al., 2017, preprint, (arXiv:1709.01040)
- Nomoto et al. (2013) Nomoto K., Kobayashi C., Tominaga N., 2013, ARA&A, 51, 457
- Norris et al. (2013) Norris J. E., et al., 2013, ApJ, 762, 28
- Parsa et al. (2017) Parsa S., Dunlop J. S., McLure R. J., 2017, preprint, (arXiv:1704.07750)
- Pian et al. (2017) Pian E., et al., 2017, preprint, (arXiv:1710.05858)
- Pilkington et al. (2012) Pilkington K., et al., 2012, MNRAS, 425, 969
- Planck Collaboration et al. (2015) Planck Collaboration et al., 2015, preprint, (arXiv:1502.01589)
- Robertson et al. (2015) Robertson B. E., Ellis R. S., Furlanetto S. R., Dunlop J. S., 2015, ApJ, 802, L19
- Salvadori et al. (2010) Salvadori S., Ferrara A., Schneider R., Scannapieco E., Kawata D., 2010, MNRAS, 401, L5
- Sarmento et al. (2017) Sarmento R., Scannapieco E., Pan L., 2017, ApJ, 834, 23
- Sawala et al. (2016) Sawala T., et al., 2016, MNRAS, 457, 1931
- Schaye & Dalla Vecchia (2008) Schaye J., Dalla Vecchia C., 2008, MNRAS, 383, 1210
- Schaye et al. (2015) Schaye J., et al., 2015, MNRAS, 446, 521
- Schechter (1976) Schechter P., 1976, ApJ, 203, 297
- Sellwood & Binney (2002) Sellwood J. A., Binney J. J., 2002, MNRAS, 336, 785
- Sharma et al. (2016a) Sharma M., Theuns T., Frenk C., Cooke R., 2016a, preprint, (arXiv:1611.03868)
- Sharma et al. (2016b) Sharma M., Theuns T., Frenk C., Bower R., Crain R., Schaller M., Schaye J., 2016b, MNRAS, 458, L94
- Sharma et al. (2017) Sharma M., Theuns T., Frenk C., Bower R. G., Crain R. A., Schaller M., Schaye J., 2017, MNRAS, 468, 2176
- Shibuya et al. (2015) Shibuya T., Ouchi M., Harikane Y., 2015, ApJS, 219, 15
- Soderblom (2010) Soderblom D. R., 2010, ARA&A, 48, 581
- Spite et al. (2011) Spite M., et al., 2011, A&A, 528, A9
- Springel (2005) Springel V., 2005, MNRAS, 364, 1105
- Springel et al. (2001) Springel V., White S. D. M., Tormen G., Kauffmann G., 2001, MNRAS, 328, 726
- Starkenburg et al. (2017) Starkenburg E., Oman K. A., Navarro J. F., Crain R. A., Fattahi A., Frenk C. S., Sawala T., Schaye J., 2017, Monthly Notices of the Royal Astronomical Society, 465, 2212
- Suda et al. (2011) Suda T., Yamada S., Katsuta Y., Komiya Y., Ishizuka C., Aoki W., Fujimoto M. Y., 2011, MNRAS, 412, 843
- Thielemann et al. (2017) Thielemann K. F., Eichler M., Panov I. V., Wehmeyer B., 2017, Annual Review of Nuclear and Particle Science, 67, annurev
- Trebitsch et al. (2017) Trebitsch M., Blaizot J., Rosdahl J., Devriendt J., Slyz A., 2017, MNRAS, 470, 224
- Trenti et al. (2010) Trenti M., Stiavelli M., Bouwens R. J., Oesch P., Shull J. M., Illingworth G. D., Bradley L. D., Carollo C. M., 2010, ApJ, 714, L202
- Tumlinson (2010) Tumlinson J., 2010, ApJ, 708, 1398
- Wang et al. (2015) Wang W., Han J., Cooper A. P., Cole S., Frenk C., Lowing B., 2015, MNRAS, 453, 377
- Webster et al. (2016) Webster D., Frebel A., Bland-Hawthorn J., 2016, ApJ, 818, 80
- White & Springel (2000) White S. D. M., Springel V., 2000, in Weiss A., Abel T. G., Hill V., eds, The First Stars. p. 327 (arXiv:astro-ph/9911378), doi:10.1007/10719504˙62
- Wiersma et al. (2009a) Wiersma R. P. C., Schaye J., Smith B. D., 2009a, MNRAS, 393, 99
- Wiersma et al. (2009b) Wiersma R. P. C., Schaye J., Theuns T., Dalla Vecchia C., Tornatore L., 2009b, MNRAS, 399, 574
- Williamson et al. (2016) Williamson D., Martel H., Kawata D., 2016, ApJ, 822, 91
- Wise & Cen (2009) Wise J. H., Cen R., 2009, ApJ, 693, 984
- Yoon et al. (2016) Yoon J., et al., 2016, ArXiv e-prints: 1607.06336,
- Yoon et al. (2018) Yoon J., Beers T. C., Kim Y. K., Placco V., Yoon J., Carollo D., Masseron T., Sharma M., 2018, ApJ, 836, 91
- Zackrisson et al. (2017) Zackrisson E., et al., 2017, ApJ, 836, 78
Appendix: supernovae yields and the distribution of [/Fe]
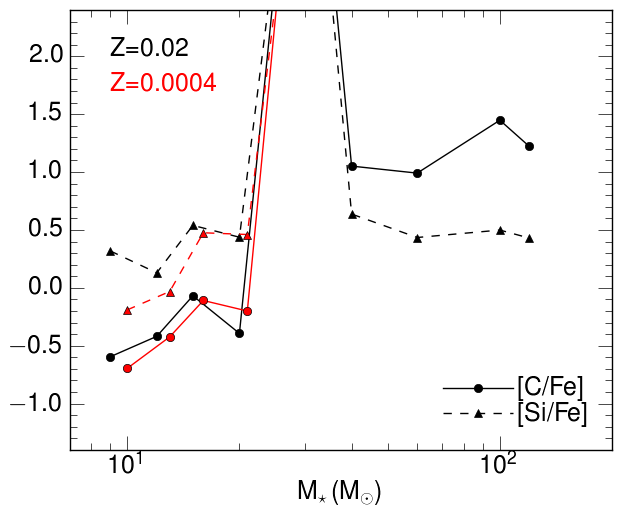
As discussed in the main text, the oldest stars were mostly enriched by low metallicity type II SNe. The yields for massive stars and their associated supernovae, as used in eagle, are described in detail by Wiersma et al. (2009b) and are shown in Fig. 12 for two different values of the progenitor metallicity as a function of initial stellar mass. The net ejecta of these massive stars is typically super-solar in both [C/Fe] and [Si/Fe] (as well as other -elements), in particular for massive progenitors stars at low .
Enrichment in eagle is time resolved, meaning that a recently formed star particle will enrich its gas neighbours with the yields from its most massive progenitor stars first, before enriching it with ejecta from lower mass SNe. It is thus possible for a gas particle to be enriched with produce that originates only from, say, very massive stars. In the onion model for the SN precursor, elements with higher atomic number A lie deeper in the stellar interior. These deeper layers may not be able to escape fall back after the star explodes, which is thought to happen at low initial when the precursor massive star is more strongly bound. This model therefore predicts that low- SNe have yields that are very high in [C/Fe] (potentially only producing C and no Fe at all), but less so in [Mg/Fe] and even less in in [Si/Fe] (because eventually neither the Si, nor the Fe core, is blasted into space). The enrichment implementation in eagle should be able to capture this, with the caveat that injection of SN energy is currently not time resolved: all energy associated with SNe is injected 30 Myears after the star particle formed. As a consequence it is possible that most gas particles are typically enriched by the whole initial mass function worth of massive stars, because the enriched gas particle remains near the star particle.
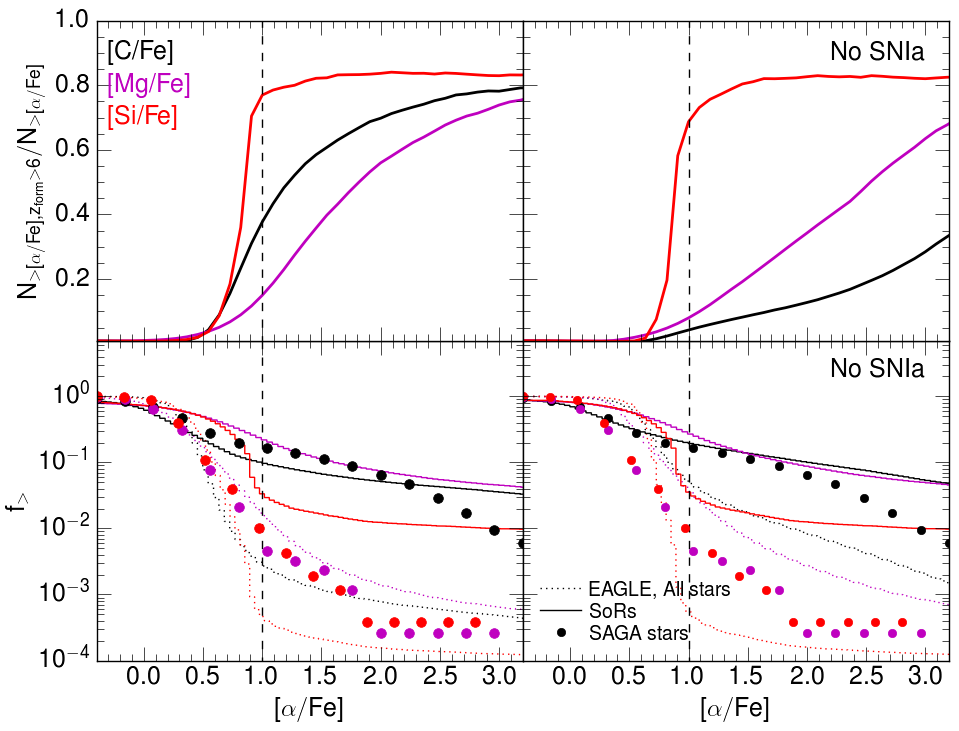
The resulting enrichment pattern in eagle is analysed in more detail in Fig. 13: as expected, a relatively significant fraction of stars that form early (SoRs, formed before ) is highly over abundant in [C/Fe], [Mg/Fe] and [Si/Fe] (full lines in bottom left panel) as compared to all stars in MW galaxies (corresponding dotted lines). Comparing the trends for the different elements in SoRs in more detail, we notice that C and Mg track each other much better than that they track Si, consistent with Si having much higher atomic number: for a range of progenitor mass and initial metallicity, the lighter elements C and Mg are ejecta from the SN, when Si, and to a much larger extent Fe, are not. This is the origin of the very high [C/Fe] and [Mg/Fe] stars, while there are far fewer high [Si/Fe] stars. Also striking is the sharp upturn in the [Si/Fe] curve around [Si/Fe]=1, below which both Si and Fe are ejected yielding near solar [Si/Fe]. The transition from supersolar to near solar abundances in [C/Fe] and [Mg/Fe] is much more gentle. The different behaviour of Si compared to Mg and C is also clear from the top left panel of Fig. 13: very high overabundances in [Si/Fe] are very much restricted to the very earliest episodes of star formation, with nearly 80 per cent of stars with [Si/Fe] formed before . In contrast, only 40 and 15 per cent of stars formed before have [Mg/Fe] and [C/Fe], respectively.
Interestingly, although the eagle -element patterns exhibit the behaviour expected from the onion model of SN progenitors, if anything the trend is more pronounced in the saga data (Suda et al., 2011). In the observations, we do indeed find stars very highly enriched in [C/Fe], as we did in eagle but the fraction of stars very highly obver abundant in [Si/Fe] is much lower, consistent with Si enrichment tracking Fe better than C enrichment does. Similarly many fewer saga stars have extremely high [Mg/Fe] compared to eagle.
In addition to biases and lack of completeness in the data, there are several possible reasons for the discrepancy, including (i) exaggerated lack of pollution of early stars with Fe from type Ia in eagle, (ii) lack of mixing of gas enriched by type II SNe with different progenitor masses, (iii) issues with the yields of massive stars used, or (iv) differences in the initial stellar initial mass function. The right panels in Fig. 13 show that the impact of type Ia SNe is not large in eagle, although of course we could have underestimated the amount of Fe produced by these stars - and how well that Fe is mixed with gas enriched by type II SNe. Such effects due to lack of mixing are difficult to quantify, but it is striking how well the fraction of stars with a given [C/Fe] in SoRs tracks that measured in saga. In the data we see a relatively pronounced upturn in the curves of [Mg/Fe] and [Si/Fe], pointing to a substantial increase in the fraction of SoRs with abundances of [Mg/Fe] and [Si/Fe]. For [Si/Fe], this upturn is reminiscent of the much sharper upturn which occurs at [Si/Fe], possibly a hint that low- SNe have too high Si yields in the simulation. In the simulation, this is even more the case for Mg.