Modeling of Multicomponent Three-Dimensional Vesicles
Abstract
In many interfacial flow systems, variations of surface properties lead to novel and interesting behaviors. In this work a three-dimensional model of flow dynamics for multicomponent vesicles is presented. The surface composition is modeled using a two-phase surface Cahn-Hilliard system, while the interface is captured using a level set jet scheme. The interface is coupled to the surrounding fluid via a variation of energy approach. Sample energies considered include the total bending, variable surface tension energy, and phase segregation energy. The fully coupled system for surface inhomogeneities, and thus varying interface material properties is presented, as are the associated numerical methods. Numerical convergence and sample results demonstrate the validity of the model.
I Introduction
Surface inhomogeneities on a moving interface, such as surfactants on bubbles Ceccio (2010); Takagi and Matsumoto (2011) and multicomponent vesicles Veatch and Keller (2003); Baumgart et al. (2003), play a significant role in dictating interfacial dynamics. This has been observed in number of a biophysical applications such as ions and molecules on cell membranes Simons and Ikonen (1997); Simons and Vaz (2004), protein surfactants on air bubbles Goerke (1998); Pattle (1958), sintering Herring (1951); Mullins (1995), grain boundary morphology Mullins (1995), enhanced oil recovery Morrow and Mason (2001), and electromigration Li et al. (1999). Such a vast variety of physical applications have motivated numerous studies to examine the impact of surface inhomogeneities on interfacial flows.
Of particular interest are multicomponent vesicle systems. Vesicles are relatively simple bio-compatible systems which closely mimic many of the dynamics seen in more complicated biological cells. In these vesicle systems the membrane is composed of lipid molecules which will typically form a bilayer structure, thus forming the membrane. Much prior work has focused on single component membranes which are composed of a single lipid species. Examples include experimental and theoretical works of the dynamics when exposed to shear flow Deschamps et al. (2009); Biben and Misbah (2003), electric fields Aranda et al. (2008); Staykova et al. (2008); Vlahovska et al. (2009), and extensional flows Vlahovska and Gracia (2007); Kantsler et al. (2008).
Much less work has focused on multicomponent vesicles. A common example of such a system is one where the membrane has three components: two lipid species and cholesterol. The cholesterol preferentially migrates towards one of the lipid species forming a relatively ordered phase, while the remaining lipid species is highly disordered Veatch and Keller (2005). Using such a system the phase coarsening rate has be explored experimentally Stanich et al. (2013). Additionally, a wide variety of interfacial patterns can be observed Baumgart et al. (2003) and electric field induced membrane flow can be visualized Staykova et al. (2008).
Modeling efforts for multicomponent vesicles are much rarer than experimental investigations. The highly non-linear and coupled system makes modeling difficult. Most have focused on either highly idealized systems, such as those that remain nearly spherical Funkhouser et al. (2014), are limited to two-dimensional systems Li et al. (2012); Liu et al. (2017); Sohn et al. (2010), do not consider the fluid Wang and Du (2008); Li et al. (2013), or use coarse-graining techniques Zheng et al. (2010).
In this work a model for the dynamics of three-dimensional multicomponent vesicles is presented. The method uses an implicit representation of the interface coupled to a Navier-Stokes solver which enforces local and global surface area and volume conservation. The multiple lipid species are modeled via a conservative surface Cahn-Hilliard equation. The surface phases, interface, and fluid field are coupled via a variation of energy approach.
The remainder of this paper is organized thusly. First, the mathematical formulation including the governing and constitutive equations for three-dimensional multicomponent vesicles are presented. Important non-dimensional quantities are also outlined. This is followed by a description of the numerical method for all of the physical fields. Results, including qualitative convergence, sample dynamics, and the dynamics in shear flow, are shown. This is followed by a short conclusion and prospects for future work.
II Mathematical Formulation
Consider a three dimensional vesicle encapsulating volume and area . The deviation of the vesicle shape from a perfect sphere is measured by the reduced volume parameter . The reduced volume is defined as the ratio of vesicle volume to the volume of a sphere with the same surface area, , where is the characteristic length given by . For the vesicles of interest the characteristic length is approximately m while the thickness of the membrane separating the inner and outer fluid is approximately nm. This membrane is composed of cholesterol, saturated lipid and unsaturated lipids and the total number of these molecules remain constant over time, which leads to constant volume and constant area constraints in the system.

II.1 Governing Equations
A schematic of a system is shown in Fig. 1, where properties outside the membrane could differ from the properties inside the membrane. This membrane separates the fluid outside () from the fluid inside () and the entire computational domain is given as .
Let the outward unit normal (pointing from to ) be given by . The surface gradient is a vector field tangent to the interface and given by , where is the surface projection operator, also known as the Laplace-Beltrami operator. In addition to the surface gradient, the surface Laplacian operator is given by .
II.1.1 Fluid Field
Under the assumption that the fluids are Newtonian and incompressible momentum balance in each fluid domain results in the Navier-Stokes equations,
where is the density, is the fluid velocity vector, and is the bulk hydrodynamic stress tensor given by
| (1) |
where is the pressure and is the fluid viscosity.
On the surface of the membrane the velocity is assumed to be continuous, , where represents the jump of a parameter across the interface. Since there is force exerted by the interface on the fluid the normal component of the hydrodynamic stress tensor undergoes a jump across the interface,
| (2) |
where is the total membrane force. Finally, as the membrane area is conserved, the local area is inextensible,
II.1.2 Surface Material Field
On the surface of the vesicle saturated lipids combine with cholesterol to form energetically stable ordered domains Baumgart et al. (2003). These ordered domains are surrounded by unsaturated lipids, which is also called the disordered phase. To examine this multicomponent system a two phase Cahn-Hilliard equation is considered. Let there be two possible phases, and . The surface concentration indicates the amount of phase while indicates the amount of phase. Assume that no reactions occur and that phases are distributed on the surface of the membrane only. Consequently, the mass of the surface concentration with unit surface density is conserved,
| (3) |
This surface concentration evolves via a mass-conserving convection-diffusion equation,
| (4) |
where is the surface flux and is defined in the next section. Note that the advection as written accounts for advection in both the tangential and normal directions. Each phase could potentially have different material properties, for example the bending rigidity of the phase is given by while that for the is given by .
II.2 Constitutive Equations
In this section, the constitutive relations of the surface phase field and fluid field are discussed. The total energy of the system, , consists of four contributions,
| (5) |
where
| (6) | ||||
| (7) | ||||
| (8) | ||||
| (9) |
The first energy functional, , is the total bending energy of the interface where , , and are the bending rigidity, spontaneous curvature and total curvature, respectively. The total curvature is defined as , where and are the principal curvatures on the surface. The energy functional is the energy component due to splay distortion of the membrane where is the Gaussian bending rigidity and is the Gaussian curvature defined as . The energy due to surface tension is given by where is the non-uniform surface tension. Finally, is the surface phase field energy. The first term of , , defines the mixing energy and in this work takes the form of a double well potential, . Consequently, the minima of the two surface phases is at and . The second component of the surface phase field free energy is associated with surface domain boundaries where is the constant associated with the surface domain line energy.
The forces applied by the membrane can be computed by taking the variation of energy with respect to the interface position,
| (10) |
where
| (11) |
Each component is given by
| (12) | ||||
| (13) | ||||
| (14) | ||||
| (15) |
where is the surface curvature tensor. For details of the derivation of these expressions see Appendix A.
The surface flux in the phase evolution is given by Fick’s law,
| (16) |
where is the mobility and is the chemical potential. This chemical potential is computed by variation of the total energy in the system with respect to the surface concentration,
| (17) |
with
| (18) | ||||
| (19) | ||||
| (20) | ||||
| (21) |
Full details of the derivation of these expressions can also be found in Appendix A.
II.3 Non-Dimensional Quantities
With a given characteristic length and time the characteristic velocity is defined as . All fluid properties are normalized with respect to the outer fluid while surface material quantities are normalized with respect to lipid phase , which is given by .
Two standard dimensionless parameters associated with vesicles are the Reynolds number and bending capillary number. The Reynolds number relates the strength of fluid advection to viscosity and is taken to be . The strength of the membrane bending compared to viscous effects results in a bending capillary parameter, .
The variable membrane introduces additional dimensionless parameters. The strength of the bending forces to the domain tension force is characterized by , while the Cahn number defines the relative strength of domain line tension to the chemical potential, , where is the characteristic surface chemical potential. Finally, the speed at which the surface phases adjust compared to the characteristic time is given by the Peclet number, , where is a characteristic mobility.
III Numerical Methods
This section describes the numerical methods that are used to model multicomponent vesicle dynamics. Assume that the Gaussian bending rigidity, , is a constant value. The flow field with variable fluid properties is computed using a continuum surface force method Kolahdouz and Salac (2015). In such a method the singular interface forces are extended into the embedding domain via a smoothed Dirac delta function and discontinuous fluid properties are taken to vary smoothly from one domain to another. As will be shown this results in a single Navier-Stokes equation valid over the entire computational domain.
The remainder of this section briefly covers four topics: the description of the interface using a level set method, the solution of the surface phase evolution equation, the solution of the Navier-Stokes equations, and the steps taken during each computational iteration.
III.1 Defining the Curved Surface Using Level-Sets
The surface of the vesicle is tracked using a level set Jet scheme. Consider an interface or membrane separating two domains, and , see Fig. 1. The interface can be represented using the zero of a mathematical function,
| (22) |
where is known as the level set function. Although any function can be used to define the interface, for stability reasons a signed distance function is typically used. For a signed distance function the absolute value of the level set function gives the shortest distance from a point in the domain to the interface, while the sign of the level set function is negative inside and positive inside .
Using a level set description of an interface numerous geometric quantities can be easily computed. For example, the outward normal and the total curvature are given as
| (23) |
Another advantage of this method is that any bulk material property, such as fluid viscosity or density can be easily calculated as,
| (24) |
where is the value of material parameter outside the interface, is the value of the material parameter inside the interface, and He is the Heaviside function.
In a given flow field , the motion of the interface can be captured by a standard advection equation,
| (25) |
This indicates that the level set function behaves as if it was a material property being advected by the underlying fluid field.
To improve the accuracy of the method an extension of the base level set method is employed in this work. Since the interface may not lie on the grid points, interpolation is required to compute the location of the interface. The idea is to track the derivatives of the level set function along with the level set function over time. This “jet” of information is utilized to construct a higher order Hermite interpolation function Seibold et al. (2012). This eliminates the need to compute derivatives and results in a more accurate scheme. For details on Jet level-set method, readers can refer to the work of Seibold, Rosales, and Nave Seibold et al. (2012).
To advance the level set forward in time a semi-implicit scheme as outline in Ref. Velmurugan et al. (2016) is used. In this method the advection equation is augmented to suppress high-frequency fluctuations. Using a second-order semi-Lagrangian scheme this is written as
| (26) |
where and are the departure level set values at the two prior time steps and where is a constant time step. This particular scheme, when applied to a level set jet, is denoted as the SemiJet. Complete details, including convergence results, can be found in Velmurugan et. al. Velmurugan et al. (2016).
III.2 Phase Field Solver
The Cahn-Hilliard system, Eqs. (4), (16), and (17) can be written in non-dimensional form as a pair of coupled second-order differential equations Lowengrub et al. (2007); Li et al. (2012),
| (27) | ||||
| (28) |
As the advection of the surface phase field is handled separately (see below) and using a second-order backward-finite-difference scheme Fornberg (1988) to discretize the time derivative, the system can be written in semi-discrete form as
| (29) |
where and are the solutions at times and , respectively, with a constant time step and is the remainder of Eq. (28) after is brought to the left-hand side. In the above block system is the identity matrix, the constant-coefficient surface Laplacian is given by , and the variable-coefficient surface Laplacian is given by .
As this is a surface partial differential equation, specialized methods are required to evolve it properly. In this work the Closest Point Method is used. The Closest Point Method was first developed and analyzed by Ruuth and Merriman Ruuth and Merriman (2008) and has been modified to increase numerical stability and accuracy Macdonald and Ruuth (2009). The basic idea is to extend the solution of a surface differential equation away from the interface such that it is constant in the normal direction. With this extension, it is possible to write a surface differential equation as a standard differential equation in the embedding space. It has been previously shown that the surface Laplacian operator can be computed with second order accuracy using linear and cubic polynomial interpolations Chen and Macdonald (2015).
Let be a linear polynomial interpolation operator and be a cubic polynomial interpolation operator. For any point not on the interface these operators return the value of a function at the interface point closest to . For example, the operation returns the value of at the point on the interface closest to using the cubic interpolation function. Using this notation, the block matrix in Eq. (29) is re-written as
| (30) |
where represents the Cartesian finite difference approximation to the constant standard Laplacian and represents the Cartesian finite difference approximation to the variable-coefficient Laplacian. Quantities denoted with indicate that the value has been extended off the interface. The addition of the terms, also known as a side condition, ensures that the solutions are constant in the normal direction. When this extension holds then surface operators can be replaced with standard Cartesian operators. See Chen and Macdonald for complete details Chen and Macdonald (2015).
The block system shown in Eq. (30) is solved using the preconditioned Flexible GMRES algorithm available in PETSc Balay et al. (2012a, b, 1997). The preconditioner is based on an incomplete Schur complement. Let and . The preconditioner is then
| (31) |
The Schur complement is written as . The application of the approximate Schur complement inverse, , is obtained via 5 iterations of an algebraic multigrid preconditioning method Gee et al. (2006).
After solving the system given by Eq. (30), there will be certain amount of loss of surface phase concentration due to numerical diffusion. The accumulative effect may have a drastic change on the average surface concentration over time. There have been numerous attempts to fix this issue in the past, see Refs. Enright et al. (2002); Sussman et al. (1998); Sussman and Puckett (2000) for examples. In this work a correction method is implemented. This method was introduced by Xu et al. Xu et al. (2006), with the idea of adjusting the surface phase concentration at the end of every time step to ensure mass conservation. Let , , and be the solution of the discrete surface phase concentration equation Eq. (30), level set and interface at a given point in time, and let , , and be the initial phase concentration, initial level set function and initial interface, respectively. Then a surface phase concentration conservation parameter, , is chosen such that the following condition is true,
| (32) |
Hence, is computed as
| (33) |
where is the Dirac delta function and the integrals are now performed over the embedding domain. The surface phase concentration is then modified at each time step as . For further details regarding the surface phase adjustment we refer the reader to Xu et al. Xu et al. (2006). Information about the overall surface phase field solver, including convergence and sample results can be found in Gera and Salac Gera and Salac (2017).
III.3 Fluid Field Solver
During the course of a vesicle simulation the four conservation conditions that must be satisfied include 1) local surface area, 2) total surface area, 3) local fluid volume, and 4) total fluid volume. Vesicle dynamics are very sensitive to any changes of these quantities, and errors in the solution of fluid equation along with the non-conservation properties of the level set method can induce large amount of errors. Therefore, it becomes necessary to modify the fluid solver appropriately. This section outlines the basic fluid solver of Kolahdouz and Salac Kolahdouz and Salac (2015).
In this work a projection method is used to determine the velocity, pressure, and tension. First, a semi-implicit update is performed to obtain a tentative velocity field,
| (34) |
where the material derivative is described using a Lagrangian approach with being the departure velocity at time and is the departure velocity at time and noting that the Gaussian bending terms have no effect when the Gaussian bending rigidity is constant. The vectors and are the bending and surface phase field forces given by
| (35) | ||||
| (36) |
The vector fields , and are all extrapolated to time using values at time and .
Next, the tentative velocity field is projected onto the divergence and surface-divergence free velocity space,
| (37) |
where and are the corrections needed for the pressure and tension, respectively. Finally, the pressure and tension are updated by including the corrections,
| (38) | ||||
| (39) |
The four conservation conditions can be written as Laadhari et al. (2012)
| (local volume conservation), | (40) | ||||
| (global volume conservation), | (41) | ||||
| (local area conservation), | (42) | ||||
| (global area conservation). | (43) |
The use of only the pressure and tension is not sufficient to satisfy all four conservation conditions. Therefore, the pressure and tension fields are split into constant and spatially-varying components:
| (44) | ||||
| (45) |
where and are spatially varying while and are constant. Note that , , , and all vary in time. Conceptually, this splitting allows for the enforcement of local conservation through and while global conservation is enforced through and .
The corresponding corrections are now , and , while the projection step, Eq. (37), is now written as
| (46) |
Noting that the time derivatives of the volume and area are to correct any accumulated errors in the solution, and using Eq. (46), the four conservation equations can be written in terms of the four unknowns (, , , and ), the current area and volume, and the initial area and volume. Specifically, applying the local area conservation equation requires that
| (47) |
while the total volume conservation requires that
| (48) |
where is the current volume and the time-derivative of the volume is chosen so that at the end of the time-step the volume equals the initial volume, .
Conservation of local and global area results in the following two equations:
| (49) |
and
| (50) |
where is the initial surface area and is the current surface area. This results in four equations for the four unknowns. Complete details of the solution method, convergence results, and sample results for vesicle electrohydrodynamics can be found in Ref. Kolahdouz and Salac (2015).
III.4 Field Coupling
The various fields (velocity, tension, surface phase field, et. al.) are highly non-linear and coupled. A fully implicit scheme would be prohibitively expensive, particularly in three dimensions. Instead, a staggered in time approach is taken here. During every iteration the following steps are taken, in this order:
-
1.
Using the current interface location and surface phase field the fluid field is updated using the scheme of Sec. III.3.
-
2.
Using the updated fluid field the level set jet, tension field, and surface phase field are advected.
-
3.
Using the updated interface location, the surface phase field system is updated using the scheme of Sec. III.2.
To ensure that the results no longer depend on the grid size or time step, a qualitative convergence results are presented below.
IV Results
In this section the dynamics of a multicomponent vesicle is investigated. The vesicle surface area is fixed to in all the situations while the enclosed volume is varied. For all results presented here a collocated Cartesian mesh with uniform grid spacing in each direction is used. Unless otherwise stated all domains span the range and use a mesh size of . Shear flow is modeled with periodic boundary conditions in the and directions while the externally applied shear flow is given by imposing a velocity of on the wall boundaries, where is the normalized shear rate, on the direction boundaries. Simulations without shear flow use wall boundary conditions in all directions.
In all cases the initial vesicle shape is given by , where . This results in a vesicle initially elongated along the -axis. Additionally, compact finite difference approximations for all spatial derivatives have been implemented (e.g. the pressure-Poisson term is approximated by at the discrete level). For all results surface area and volume are all conserved to within of their initial values.
In the following results two types of initial conditions for the surface concentration are considered. In the first initial condition, denoted as pre-segregated, the initial surface concentration is given by . When a vesicle is elongated along the -axis this results in phase interfaces at and . The second condition, denoted as the random initial condition, consists of a random perturbation of 0.01 about an average concentration . It is always assumed that the bending rigidity of the phase, which is given by the color blue below, is while the phase, given by the color red below, has . In all cases the Cahn number is taken to be while the bending capillary number is taken to be and the Reynolds number is fixed at . For simplicity the spontaneous curvature and Gaussian rigidity are matched between the two phases, while uniform viscosity and density is assumed throughout the domain and a constant unit mobility is assumed for the surface phases.
In addition to tracking the location of the interface and the surface concentration, the energy associated with the system and the location of two marker-particles placed on the interface are tracked. Specifically, the energy as determined via the integrals of Eqs. (6) and (9) is evaluated at every time step using the method shown in Ref. Towers (2008). The marker particles are initially placed at the tips of the initial shape and are tracked using the same advection scheme used for the level set jet function.
IV.1 Verification of Domain Parameters
To verify the domain parameters, specifically the grid size and time step, the dynamics of a pre-segregated vesicle in shear flow with strength is investigated. The initial shape is given by and , which results in a vesicle with reduced volume of . Using the pre-segregated concentration field given above the average concentration for this case is 0.4. From an initially quiescent fluid the dynamics using grid sizes , , and are considered. In this case the time steps are , , and , respectively, resulting in a constant grid spacing to time step ratio of approximately . For this result the physical parameters are , , and .
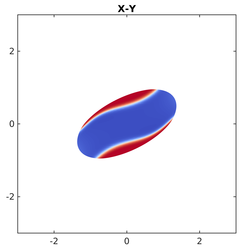
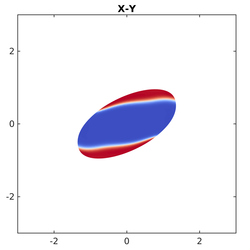
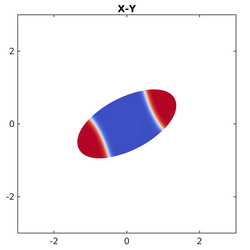
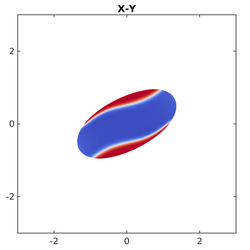
Five results are considered. These are the inclination angle, marker particle location, bending energy, phase energy, and sample phase location until a time of , see Figs. 2, 3, and 4. The inclination angle is determined as the angle between the major-axis of an ellipsoid with the same inertial matrix as the current shape and the -axis. As can be seen, the result differs from the others, while the and are qualitatively similar. Additionally, a small instability is seen in the phase energy result for the grid which is not present in the finer meshes. As there is no qualitative difference between the and results, a grid is chosen for the remainder of the simulations.


IV.2 Sample Dynamics
To demonstrate the influence of variable surface properties and to motivate the following section, sample dynamics for a multicomponent vesicle are shown. In this case the initial shape is given by and , resulting in a vesicle of reduced volume .
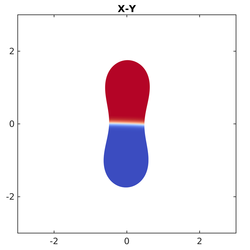
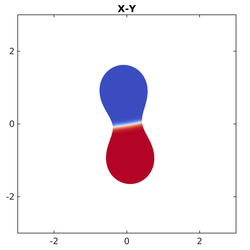
Let the initial surface concentration be random with an average of , the bending rigidity be matched (e.g. ) and a Peclet number of . First consider the dynamics with a relatively weak interfacial line tension, , see Fig. 5. Initially rapid phase segregation occurs, which is common when starting from a well-mixed initial condition Gera and Salac (2017). After this the phases segregate completely and slowly begin to coarsen, with the end result having one-half of the vesicle one phase and the other half the other phase. To minimize the surface interfacial energy associated with domain boundaries, the interface between the two phases occurs at the narrow neck. Due to the relatively weak phase line tension this shape is very reminiscent of the minimum bending energy shapes for prolate vesicles Seifert (1997).
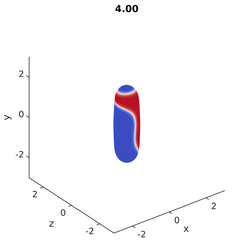
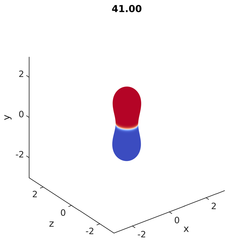
Now consider the case where the phase line tension is the same magnitude as the bending energy, . The dynamics are seen in Fig. 6. Initially the results are similar to the case shown above, with rapid phase segregation occurring. Unlike the previous case the larger influence of the line tension disturbs the fluid field, inducing a slight tilt in the equilibrium shape not observed in the prior case. Finally, to reduce the length of the domain boundary on the surface, the neck region is reduced in radius. This results in a higher local curvature than the case. Any further decrease in the neck radius is opposed by the higher bending energy.
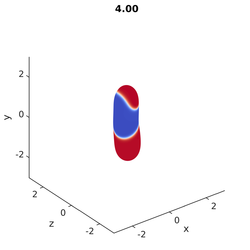
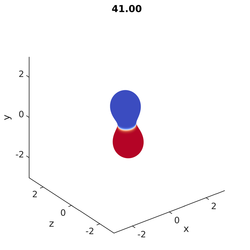
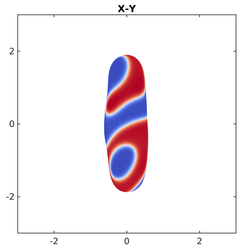
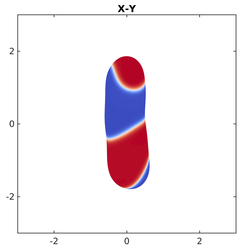
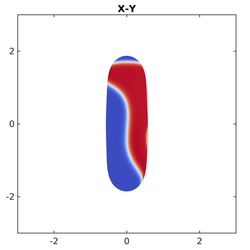
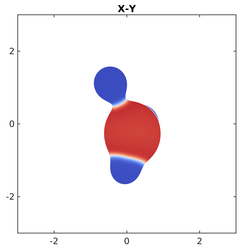
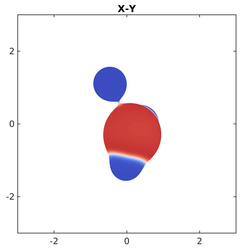
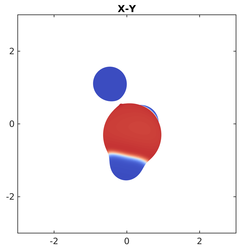
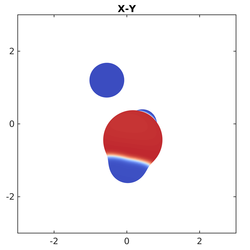
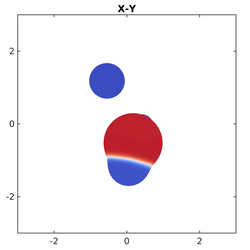
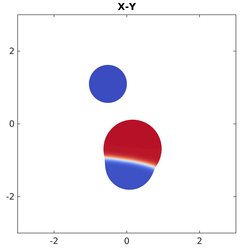
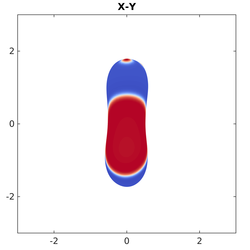
Now consider the dynamics with a strong phase line tension given by and mismatched bending rigidity, , and a Peclet number of . Recall that with the line tension is approximately ten times stronger than the bending forces. The dynamics up to a time of are shown in Figs. 7 and 8.
As before there is a relatively rapid initial phase segregation, although the higher Peclet number results in a slower phase segregation process than in Figs. 5 and 6. When observing the dynamics it is worth considering the fact that the surface domain boundary energy is directly related to the length of the surface domain boundaries. There are two general ways that the system can reduce this energy. First, given the constraints on the average concentration it is clear that the domain boundaries will attempt to reach regions of the interface that have the highest curvature, as these will generally be the regions with the smallest geodesic distances between points. This is clearly observed in Figs. 5 and 6, where the interface is in the narrow neck region.
The second way that the domain line energy can be reduced is by removing it completely via budding, which is the case seen in Figs. 7 and 8. Here, a relatively large amount of the blue phase segregates in the upper-left corner of the vesicle. The phase interface is relatively circular and thus the line tension forces act inwards, driving the vesicle to pinch-off this phase. This type of behavior has been observed using molecular dynamics simulations Yamamoto and Hyodo (2003) and also experimentally Baumgart et al. (2003). Several experimental studies with vesicle budding Döbereiner et al. (1993); Tanaka et al. (2004); Leirer et al. (2009) have also shown that thin stalks form between the larger mother vesicle and the small daughter vesicle, which is observed here around a time of .
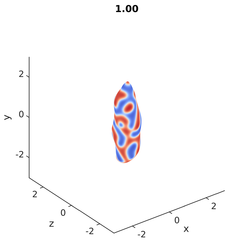
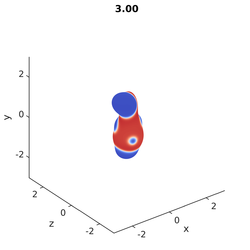
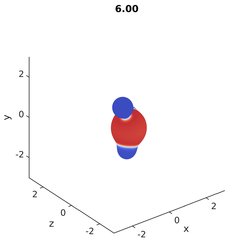
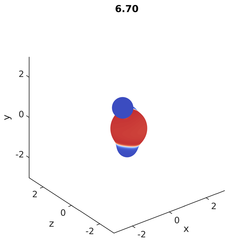
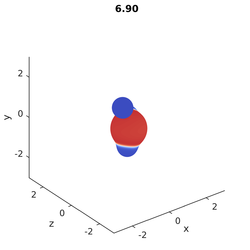
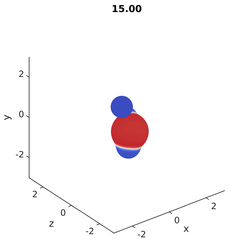
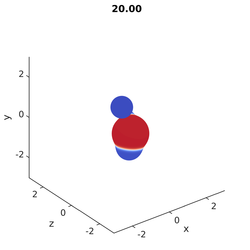
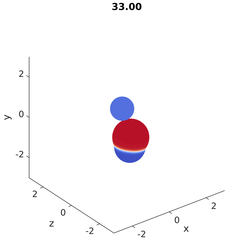
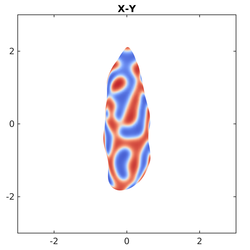
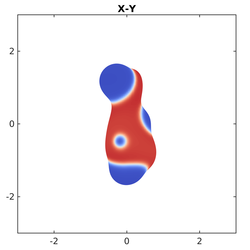
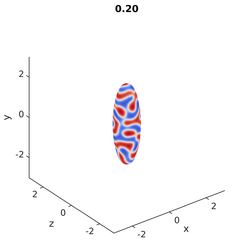
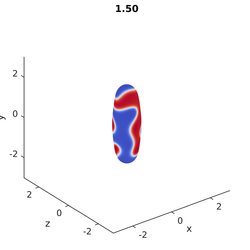
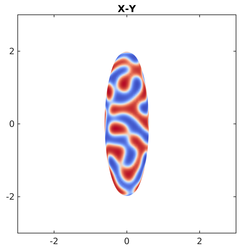
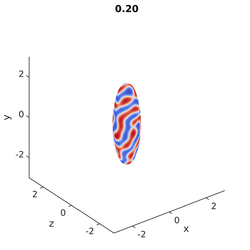
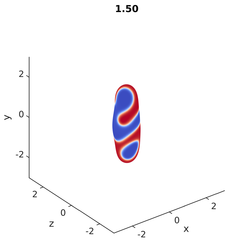
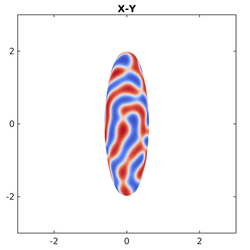
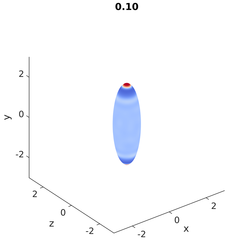
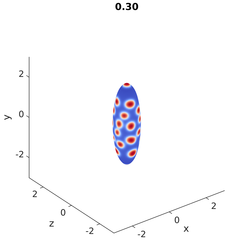
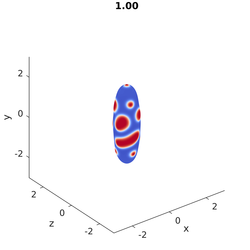
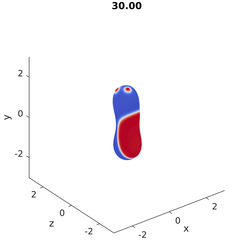
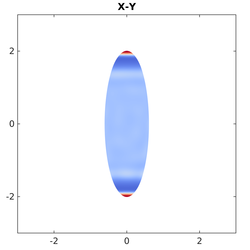
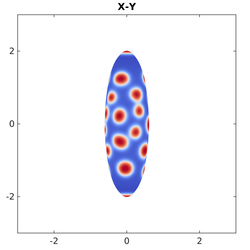
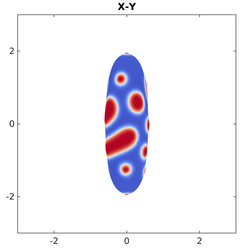
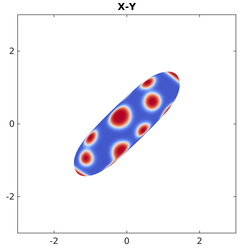
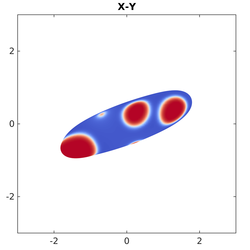
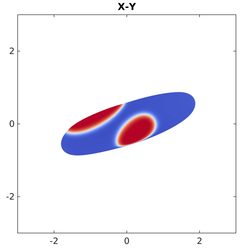
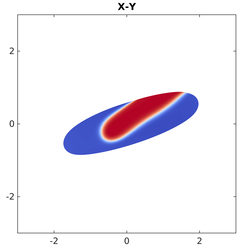
For the last sample test case the random initial condition has an average concentration of where the bending rigidity of the blue phase is . Additionally, the phase line tension is relatively weak as . Due to a Peclet number of rapid phase segregation is observed, with fully segregated domains observed at a time of . It is interesting to note that the first regions which segregate, as seen in Fig. 9(a), are the high-curvature tips of the vesicle. This is due to the red domains having a lower bending rigidity of and therefore are driven to the tips to reduce the bending energy. With time the morphology of the underlying vesicle changes as the domains begin to coarsen. Eventually the central region of the vesicle develops a large curvature, favoring the red surface phase which diffuses to that region. Since , the total bending energy dominates the domain line tension on the vesicle. This is evident in Fig. 9 where no budding or narrow neck regions separating the two phases appear.
IV.3 Investigation of Shear Flow
In this section the dynamics of a multicomponent vesicle in the presence of shear flow is presented. For the first case a prolate ellipsoidal vesicle given by and , resulting in a reduced volume of , is placed in a shear flow of strength . The average surface phase concentration is , while the initial random perturbation has a magnitude of . For this example, mismatched bending rigidity is employed, where the bending rigidity of the red domain is . The surface phase line tension is the same order of magnitude as bending since and a unit Peclet number indicates forces due to shear is of equal magnitude as the forces due to surface phase field.
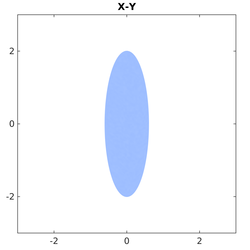
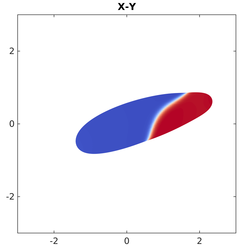
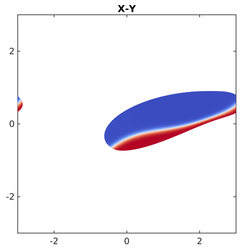
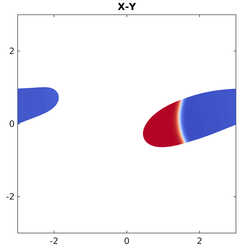
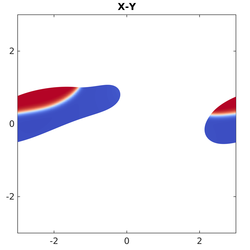
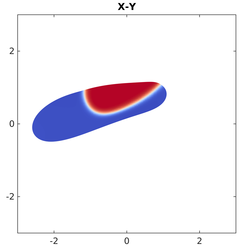
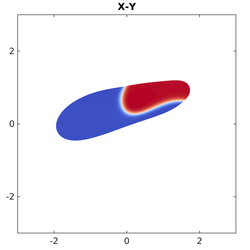
Five results are presented for this case. The vesicle inclination angle with respect to the x-axis, center of mass, bending energy, and phase energy are provided in Fig. 10, while the location of the vesicle and the surface phase distribution are shown in Fig. 11(l). The initially homogeneous vesicle quickly segregates and it is worth noting that, as in Fig. 9, the initial segregation occurs at the high curvature tips of the vesicle. Circular domains then start to appear and the process of coarsening begins to occur.
It is well known that a vesicle with a homogeneous membrane exposed to a shear flow will reach a steady-state tank-treading inclination angle Deschamps et al. (2009); Zabusky et al. (2011). In ideal cases, such as those observed in simulations, the vesicle remains centered with a symmetric flow field Veerapaneni et al. (2009); Salac and Miksis (2011). In the current case, the vesicle begins to tilt and a relatively stable angle of inclination is achieved by a time of . Shortly thereafter the domains are fully segregated and the bending rigidity mismatch plus the non-symmetric phase domain locations induces a breaking of the flow symmetry. This breaking of the flow symmetry induces lateral motion of the vesicle, which can observed by the large change in the -location of the vesicle center of mass. Please note that the drop in the inclination angle is an artifact when the vesicle crosses the periodic boundary. Neglecting this time, which occurs from approximately to , the inclination angle is relatively stable.
It is also interesting to compare the bending energy and the location of the red domain. Note that the bending energy is maximum when the red domain, which has a lower bending rigidity than the blue domain, is on the flat, long axis of the ellipsoidal vesicle where the curvature is low. As the red domain reach the high curvature regions of the vesicle the bending energy is minimized. The surface phase field forces are also minimum when the red domains are at the tips of the ellipsoidal vesicle. This is because in general at the tips of the vesicle where the curvature is the highest smallest geodesic distance between points and thus the domain boundaries become relatively short, producing a local minimum to the surface phase energy.


.
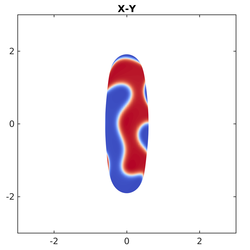
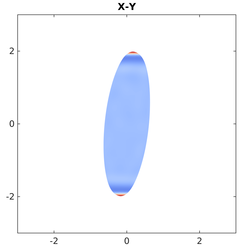
The remainder of this section will consider the influence of the Peclet number on the dynamics of a pre-segregated vesicle in shear flow. The initial vesicle shape is an ellipsoid with a reduced volume of , which corresponds to and . The bending rigidity of the red domains is , while bending energy dominates the line tension as . In the following the inclination angle, bending energy, and phase energy are reported. Additionally, the location of the surface phases and of two marker particles, initially at the tips of the vesicle, are also shown. Please note that due to the symmetric nature of the initial phase field lateral motion, such as that seen in Fig. 11(l), is not observed.
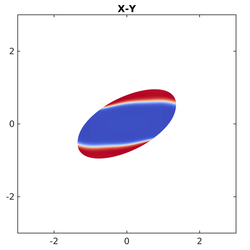
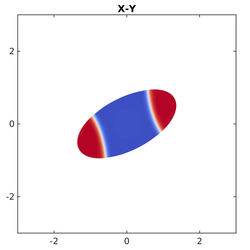
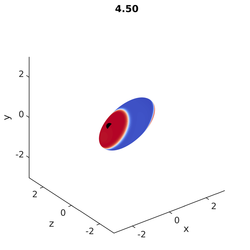
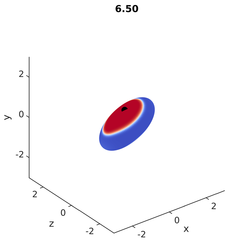
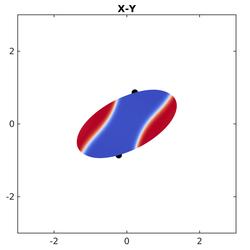
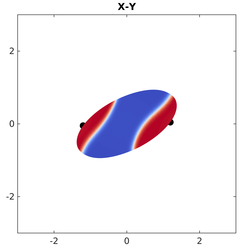
The first case uses a Peclet number of , which indicates that surface phases can not respond quickly to the external fluid flow, see Figs. 12 and 13. Due to the high shear force compared to surface diffusion, the red domains on the surface are advected along the vesicle surface. The marker particles, which are advected by the underlying flow field, generally remain in the center of the red domains, demonstrating that there is little difference between surface advection velocity of the surface domains and the surrounding fluid field. Additionally, there is a slight swinging motion to the vesicles, as the inclination angle oscillates between an angle of 0.466 and 0.491.
The bending energy generally follows the result shown in Figs. 10 and 11(l). When the red domains, which have a low bending rigidity than the blue domains, are away from high curvature tip regions of the vesicle both the the bending energy and phase energy high. When the red regions pass through the tips the bending energy and phase energy are at a minimum. Using the energy plots it is also possible to approximate the period of the phase treading. Both the bending and phase energy have a peak-to-peak period of approximately 8.


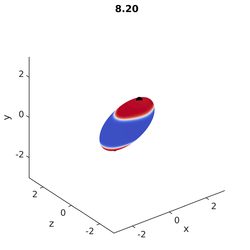
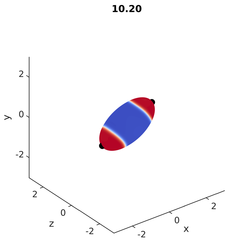
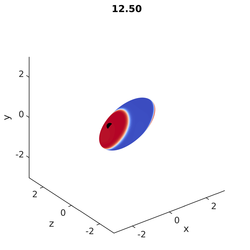
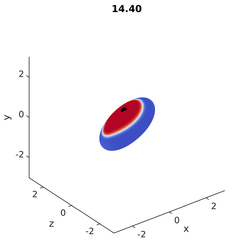
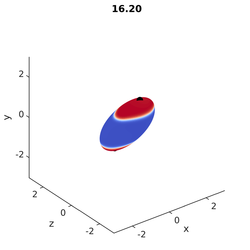
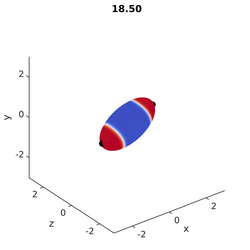
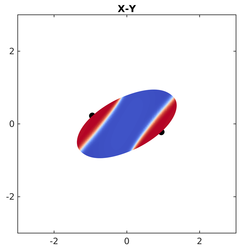
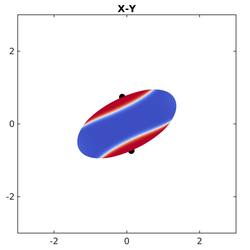
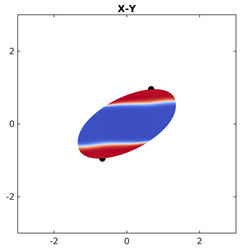
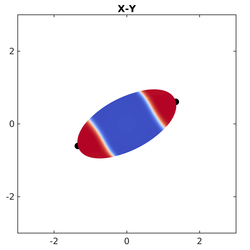
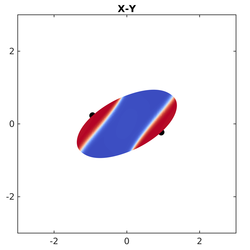
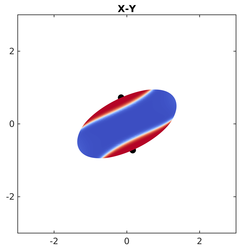
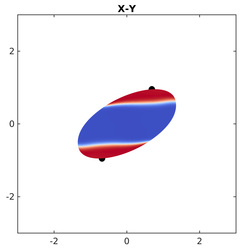
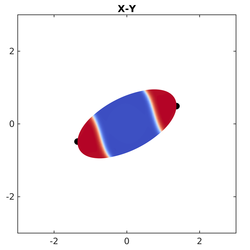
In the next case the Peclet number is reduced to . Compared to the case shown above, the surface diffusion can now occur 20 times faster. The time evolution of the inclination angle and energies can be seen in Fig. 15 From Figs. 16 and 17 it is evident that phase treading around the membrane still occurs, albeit at a slower rate. In this case the peak-to-peak period is approximately 10, indicating that the lower Peclet number slows the surface advection of the phases compared to the prior case. This is verified when considering the marker particles, which no longer remain at the center of the domains but travel at a faster rate along the interface.
Another interesting observation can be made by comparing the shapes of the surface domains when using and . In the case the domains remain relatively circular, with little distortion from the underlying flow field. For the case, the red surface domains elongate and spend a longer amount of time at the high curvature tips. As the overall energy of the system is lower when the red phases occupy the tips of the vesicle, the faster surface diffusion dynamics allow the phases to adjust and remain at the tips. Once the red phase is advected away from the tips, the phase boundary line energy returns the surface phases to something closer to a circle, which can be seen when comparing the results at time and .


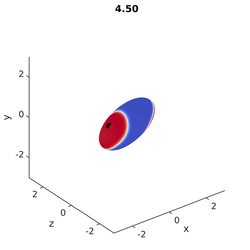
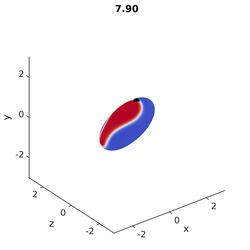
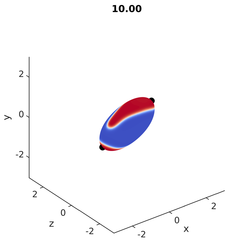
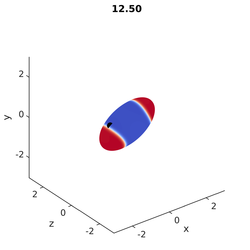
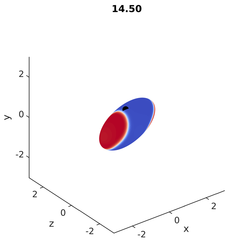
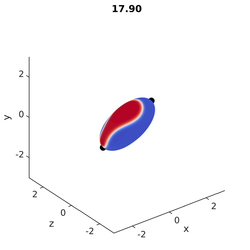
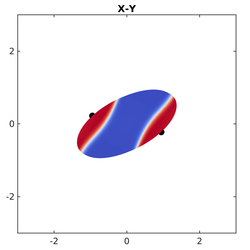
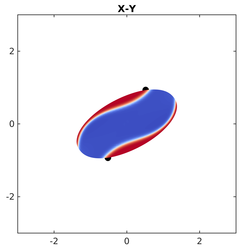
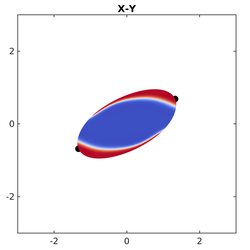
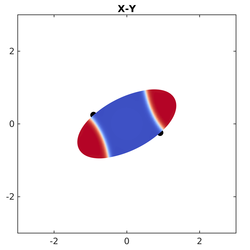
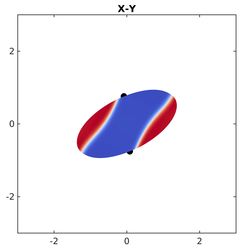
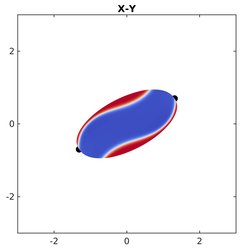
Now further decrease the Peclet number to . In this case the speed of surface diffusion is twice that of the case and forty times that of the case. As in the prior two cases the surface domains phase tread around the membrane, albeit at a slower rate. Unlike the prior cases, the surface domains can remain in the tip regions long enough for them to merge, resulting in a single domain spanning the long-axis of the vesicle. After merging the new single domain continues to phase tread around the membrane, which can be observed by comparing the results at time and . Longer simulation times would be required to determine if this phase treading behavior has a regular period, as observed for the higher Peclet numbers.


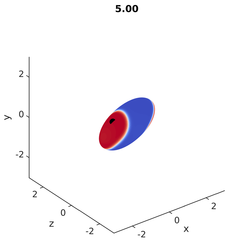
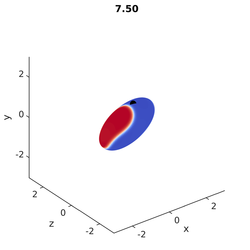
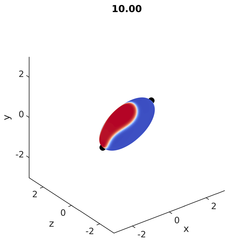
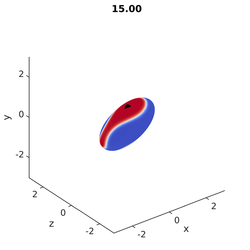
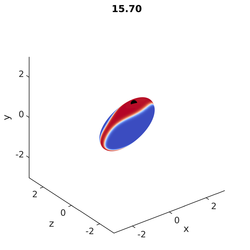
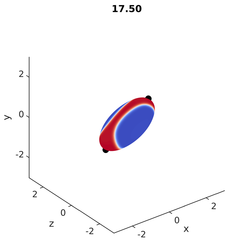
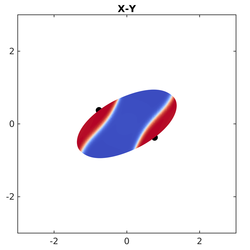
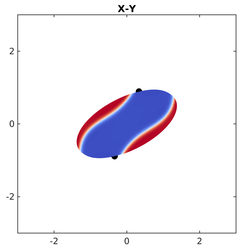
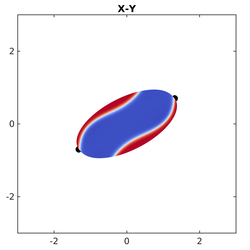
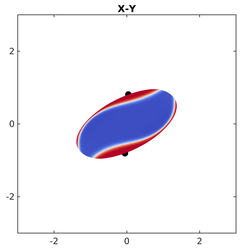
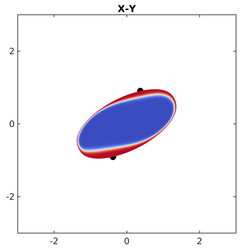
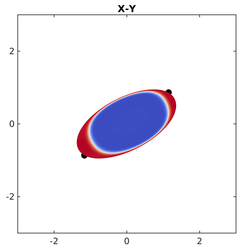
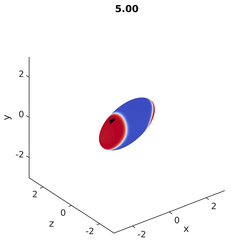
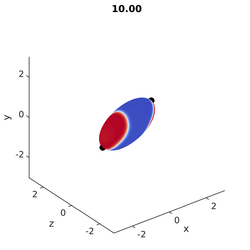
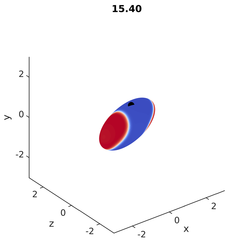
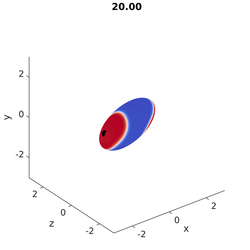
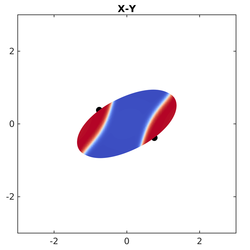
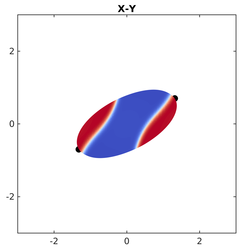
As a final case, further reduce the Peclet number to . As was discussed earlier the bending energy favors lower bending rigidity domains occupying the high curvature tip regions. The shear flow favors phase treading of the domains along the vesicle. With , the surface diffusion is fast enough that it can completely counter the shear flow, and allows the red domains to remain at the high curvature tip region, see Figs. 22 and 23. While the red domains are stationary, the marker particle still migrates along the interface, indicating that the surrounding fluid field does try to induce phase treading.
When considering the bending and phase energy, they stabilize once an equilibrium inclination angle is achieved. It should be noted that both the bending and phase energies in this case are larger than the minimum values observed for a phase treading vesicle. This is due to the fact that while the red phases are stationary, they still extend on to the lower curvature regions of the vesicle. The phase treading situations allow for a more compact red domain which covers more of the tip.


V Conclusion
In this work a three-dimensional model for multicomponent vesicles is presented. The lipid membrane consists of two types of domains: liquid order, which consists a saturated lipid species plus cholesterol, and liquid disorder, which consists of an unsaturated lipid species. The dynamics of this multicomponent membrane are modeled via a fourth-order, conservative Cahn-Hilliard equation restricted to the interface. The interface itself is modeled using a semi-implicit level set jet scheme. Both the interface and the surface phases are coupled to the underlying flow field via an energy variational approach.
In addition to a description of the numerical methods, qualitative convergence results are presented which demonstrate that the dynamics no longer change when a certain grid size and time step are reached.
Two types of results were presented. The first provided sample results using an initial random surface phase concentration and various material parameters. It was demonstrated that increasing the surface phase line tension results in the narrowing of the neck region for a prolate vesicle. If high enough, this line tension may induce vesicle budding. When exposed to a shear flow and variable surface bending properties, motion of the vesicle was also observed.
The second type of result investigated the influence of the Peclet number on the dynamics of a pre-segregated vesicle in shear flow. When the Peclet number is large, the surface phases were observed to migrate along the surface. When the Peclet number is small, the surface phases no longer migrate and are stationary on the interface. In all cases marker particles placed on the surface tread around the surface. This indicates that with a lower Peclet number surface phases can quickly adjust to external forces allowing the surface domains to remain in low energy states. Higher Peclet numbers do not allow the surface phases to adjust quickly enough to the external shear flow.
The results also indicate that there exists a critical Peclet number below which phase treading should not occur. This is similar to the results of Liu, et. al., which observed a transition from stationary phases to phase treading with an increase of the shear rate for two-dimensional vesicles Liu et al. (2017). The results here indicate that it is not the shear rate per se that controls the stationary to phase treading behavior, but the competition between the external forces driving the treading behavior (e.g. shear flow) and the forces driving the surface phases to lower energy. Further investigations will need to be performed to see how this behavior depends on other factors, such as viscosity, domain line tension, and bending rigidity difference.
Acknowledgements.
This work has been supported by the National Science Foundation through the Division of Chemical, Bioengineering, Environmental, and Transport Systems Grant #1253739. Simulations were performed at the Center for Computational Research, University at Buffalo, Buffalo, NY, 14203.Appendix A Energy Variation
The mathematical framework used here is based on the work of Napoli and Vergori Napoli and Vergori (2010). In this prior work a systematic method is developed to obtain the equilibrium equations for nematic crystal vesicles. The prior results relevant to the current work is briefly outlined.
Consider a closed interface with an outward facing unit normal of which separates two fluids. There could possibly be two components to this interface, with the concentration given by . This interface is characterized by the second fundamental form, also called the shape tensor, given by , where represents the surface gradient. This is a symmetric second-order tensor field which only has components tangent to the interface. It also only has two non-zero eigenvalues, and , which are called the principle curvatures. Using this definition the total and Gaussian curvature can be defined as
| (A.1) | ||||
| (A.2) |
respectively. The free energy functional for the interface is defined on the closed surface as
| (A.3) |
where is the free energy density which may depend on surface quantities , , , and and the position of the interface, .
Using the transport theorem, the variation of the free energy can be written as Napoli and Vergori (2010)
| (A.4) |
where
| (A.5) |
The component provides the change of the free energy when the interface undergoes bulk shape changes while the others capture changes for interface-only quantities. The individual components are
| (A.6) | ||||
| (A.7) | ||||
| (A.8) | ||||
| (A.9) |
The derivation of the above expressions has been previously shown Napoli and Vergori (2010); Gera (2017). Introduce the conjugate variables , , , , and ,
| (A.10) |
where only applies to those terms of with explicit dependence on spatial location . It is then possible to write Eq. (A.5) as
| (A.11) | |||||
where is
| (A.12) |
with and . Using these expressions the variation of the free energy can then be written as
| (A.13) |
where
| (A.14) |
From this the variation of the energy due to changes in the interface is given by
| (A.15) |
while the variation of the energy due to changes in the concentration field is given by
| (A.16) |
At equilibrium for arbitrary and and thus both Eqs. (A.15) and (A.16) must equal zero. When not in equilibrium the variations are related to the forces which drive the system to equilibrium. For example, consider an interface surrounded by fluid where the surface concentration is modeled using the Cahn-Hilliard equation. The variation associated with the interface, , would be related to the force exerted by the interface on the surrounding fluid while the variation with respect to the surface concentration, , would define the chemical potential.
Using the framework shown above the resulting variations are derived for the case of an interface with total and Gaussian curvature energy, variable surface tension, and where the surface concentration is described using a phase-field energy form. The energies considered here are:
| (A.17) | ||||
| (A.18) | ||||
| (A.19) | ||||
| (A.20) |
A.1 Total Bending Energy
The bending free energy in Eq. (A.17) leads to the following free energy density ,
| (A.21) |
From this energy density the conjugate variables become
| (A.22) | ||||
| (A.23) | ||||
| (A.24) | ||||
| (A.25) | ||||
| (A.26) |
where is the derivative of spontaneous curvature and is derivative of bending rigidity with respect to . Note that this free energy density does not have an explicit dependence on the position of the interface and thus . For this section and all after, the functional dependencies of various quantities on the concentration will be suppressed from the notation after defining the conjugate variables. Introduce the modified total curvature as . The tensor due to the bending energy can be computed using Eq. (A.14) as follows,
| (A.27) |
The surface divergence of the first term can be expanded to
| (A.28) |
while the second is
| (A.29) |
In the last term the quantity can be written as
| (A.30) |
which leads to
| (A.31) |
Using these expressions the surface divergence of Eq. (A.27) can be written as
| (A.32) |
Using the expressions for and the variation of the energy with respect to the interface is
| (A.33) | |||||
The standard Euler-Lagrange equation associated with the normal shape variation can be obtained by setting and assuming that and are constant values on the interface Napoli and Vergori (2010):
| (A.34) |
Next, consider the variation associated with the concentration field . As this is simply
| (A.35) |
In the situation that material properties do not depend on the concentration field the total bending energy has no influence on the concentration field.
A.2 Splay Bending Energy
The splay bending energy in Eq. (A.18) leads to the following free energy density ,
| (A.36) |
From this the conjugate variables are
| (A.37) | ||||
| (A.38) | ||||
| (A.39) | ||||
| (A.40) | ||||
| (A.41) |
where is derivative of bending rigidity with respect to .
The tensor due to splay energy can be computed as
| (A.42) | |||||
Using the Cayley-Hamilton Theorem, , this simplifies to
| (A.43) |
The inner expression can be evaluated as
| (A.44) |
When including the projection operator and noting that this becomes
| (A.45) |
Thus the tensor simplifies to
| (A.46) |
The surface divergence of the first term results in
| (A.47) |
The surface divergence of the second term is
| (A.48) |
Combining these two results with the Cayley-Hamilton Theorem the variation of with respect to the interface is
| (A.49) |
Due to the simple nature of the conjugate variables, the variation of the energy with respect to the concentration field is simply
| (A.50) |
In the case that material properties are de-coupled from the concentration field both and are zero. The fact that in this case should be expected as the Gauss-Bonnet theorem states that is a constant for an interface with a fixed Euler characteristic. So long as the interface has a fixed topology, the splay bending energy should not have any influence when is a constant.
A.3 Tension Energy
The tension energy leads to the following free energy density ,
| (A.51) |
The conjugate variables are given by
| (A.52) | ||||
| (A.53) | ||||
| (A.54) | ||||
| (A.55) | ||||
| (A.56) |
where is derivative of tension with respect to .
The tensor due to tension can be computed using Eq. (A.14),
| (A.57) |
The variation of the tension energy with respect to interface changes is given by
| (A.58) |
The variation of the energy with respect to the concentration field is simply
| (A.59) |
A.4 Phase Energy
The phase free energy density is
| (A.60) |
From this energy density the conjugate variables become
| (A.61) | ||||
| (A.62) | ||||
| (A.63) | ||||
| (A.64) | ||||
| (A.65) |
which defines the tensor as
| (A.66) |
The surface divergence of the first term is
| (A.67) |
while the the surface divergence of the second term is
| (A.68) |
The final term results in
| (A.69) |
From these expressions the variation of the free energy with respect to the interface is
| (A.70) |
where the relation has been proved Gera (2017). The variation of the energy with respect to changes of the concentration field is
| (A.71) |
which matches prior results for the chemical potential in the Cahn-Hilliard formulation.
References
- Ceccio (2010) S. L. Ceccio, Annual Review of Fluid Mechanics 42, 183 (2010).
- Takagi and Matsumoto (2011) S. Takagi and Y. Matsumoto, Annual Review of Fluid Mechanics 43, 615 (2011).
- Veatch and Keller (2003) S. L. Veatch and S. L. Keller, Biophysical journal 85, 3074 (2003).
- Baumgart et al. (2003) T. Baumgart, S. T. Hess, and W. W. Webb, Nature 425, 821 (2003).
- Simons and Ikonen (1997) K. Simons and E. Ikonen, Nature 387, 569 (1997).
- Simons and Vaz (2004) K. Simons and W. Vaz, Annual Review Of Biophysics And Biomolecular Structure 33, 269 (2004).
- Goerke (1998) J. Goerke, Biochimica et Biophysica Acta (BBA)-Molecular Basis of Disease 1408, 79 (1998).
- Pattle (1958) R. Pattle, Proceedings of the Royal Society of London B: Biological Sciences 148, 217 (1958).
- Herring (1951) C. Herring, New York: McGrew-Hill p. 143 (1951).
- Mullins (1995) W. Mullins, Metallurgical and Materials Transactions A 26, 1917 (1995).
- Morrow and Mason (2001) N. R. Morrow and G. Mason, Current Opinion in Colloid & Interface Science 6, 321 (2001).
- Li et al. (1999) Z. Li, H. Zhao, and H. Gao, Journal of Computational Physics 152, 281 (1999).
- Deschamps et al. (2009) J. Deschamps, V. Kantsler, E. Segre, and V. Steinberg, Proceedings Of The National Academy Of Sciences Of The United States Of America 106, 11444 (2009).
- Biben and Misbah (2003) T. Biben and C. Misbah, Physical Review E 67, 031908 (2003).
- Aranda et al. (2008) S. Aranda, K. A. Riske, R. Lipowsky, and R. Dimova, Biophysical journal 95, L19 (2008).
- Staykova et al. (2008) M. Staykova, R. Lipowsky, and R. Dimova, Soft Matter 4, 2168 (2008).
- Vlahovska et al. (2009) P. M. Vlahovska, R. S. Gracia, S. Aranda-Espinoza, and R. Dimova, Biophysical journal 96, 4789 (2009).
- Vlahovska and Gracia (2007) P. M. Vlahovska and R. S. Gracia, Physical Review E 75, 016313 (2007).
- Kantsler et al. (2008) V. Kantsler, E. Segre, and V. Steinberg, Physical review letters 101, 048101 (2008).
- Veatch and Keller (2005) S. L. Veatch and S. L. Keller, Biochimica et Biophysica Acta (BBA)-Molecular Cell Research 1746, 172 (2005).
- Stanich et al. (2013) C. A. Stanich, A. R. Honerkamp-Smith, G. G. Putzel, C. S. Warth, A. K. Lamprecht, P. Mandal, E. Mann, T.-A. D. Hua, and S. L. Keller, Biophysical journal 105, 444 (2013).
- Funkhouser et al. (2014) C. M. Funkhouser, F. J. Solis, and K. Thornton, Journal Of Chemical Physics 140, 144908 (2014).
- Li et al. (2012) S. Li, J. Lowengrub, and A. Voigt, Communications in Mathematica Sciences 10, 645 (2012).
- Liu et al. (2017) K. Liu, G. R. Marple, J. Allard, S. Li, S. Veerapaneni, and J. Lowengrub, Soft Matter 13, 3521 (2017).
- Sohn et al. (2010) J. Sohn, Y. Tseng, S. Li, A. Voigt, and J. Lowengrub, Journal Of Computational Physics 229, 119 (2010).
- Wang and Du (2008) X. Wang and Q. Du, Journal Of Mathematical Biology 56, 347 (2008).
- Li et al. (2013) J. Li, H. Zhang, and F. Qiu, The Journal of Physical Chemistry B 117, 843 (2013).
- Zheng et al. (2010) C. Zheng, P. Liu, J. Li, and Y.-W. Zhang, Langmuir 26, 12659 (2010).
- Kolahdouz and Salac (2015) E. M. Kolahdouz and D. Salac, SIAM Journal on Scientific Computing 37, B473 (2015).
- Seibold et al. (2012) B. Seibold, R. R. Rosales, and J.-C. Nave, Discrete & Continuous Dynamical Systems-Series B 17 (2012).
- Velmurugan et al. (2016) G. Velmurugan, E. M. Kolahdouz, and D. Salac, Computer Methods in Applied Mechanics and Engineering 310, 233 (2016).
- Lowengrub et al. (2007) J. Lowengrub, J. Xu, and A. Voigt, Fluid Dyn. Mater. Proc 3, 1 (2007).
- Fornberg (1988) B. Fornberg, Mathematics Of Computation 51, 699 (1988).
- Ruuth and Merriman (2008) S. J. Ruuth and B. Merriman, Journal of Computational Physics 227, 1943 (2008).
- Macdonald and Ruuth (2009) C. B. Macdonald and S. J. Ruuth, SIAM Journal on Scientific Computing 31, 4330 (2009).
- Chen and Macdonald (2015) Y. Chen and C. Macdonald, SIAM Journal on Scientific Computing 37, A134 (2015).
- Balay et al. (2012a) S. Balay, F. Brown, K. Buschelman, W. Gropp, D. Kaushik, M. Knepley, L. McInnes, B. Smith, and H. Zhang, PETSc Web page (2012a), http://www.mcs.anl.gov/petsc.
- Balay et al. (2012b) S. Balay, F. Brown, K. Buschelman, V. Eijkhout, W. Gropp, D. Kaushik, M. Knepley, L. McInnes, B. Smith, and H. Zhang, Tech. Rep. ANL-95/11 - Revision 3.3, Argonne National Laboratory (2012b).
- Balay et al. (1997) S. Balay, W. Gropp, L. McInnes, and B. Smith, in Modern Software Tools in Scientific Computing, edited by E. Arge, A. M. Bruaset, and H. P. Langtangen (Birkhäuser Press, 1997), pp. 163–202.
- Gee et al. (2006) M. Gee, C. Siefert, J. Hu, R. Tuminaro, and M. Sala, Tech. Rep. SAND2006-2649, Sandia National Laboratories (2006).
- Enright et al. (2002) D. Enright, R. Fedkiw, J. Ferziger, and I. Mitchell, Journal of Computational Physics 183, 83 (2002).
- Sussman et al. (1998) M. Sussman, E. Fatemi, P. Smereka, and S. Osher, Computers & Fluids 27, 663 (1998).
- Sussman and Puckett (2000) M. Sussman and E. G. Puckett, Journal of Computational Physics 162, 301 (2000).
- Xu et al. (2006) J.-J. Xu, Z. Li, J. Lowengrub, and H. Zhao, Journal of Computational Physics 212, 590 (2006).
- Gera and Salac (2017) P. Gera and D. Salac, Applied Mathematics Letters 73, 56 (2017).
- Laadhari et al. (2012) A. Laadhari, P. Saramito, and C. Misbah, Physics of Fluids 24, 031901 (2012).
- Towers (2008) J. D. Towers, Journal of Computational Physics 227, 6591 (2008).
- Seifert (1997) U. Seifert, Advances In Physics 46, 13 (1997).
- Yamamoto and Hyodo (2003) S. Yamamoto and S. Hyodo, Journal Of Chemical Physics 118, 7937 (2003).
- Döbereiner et al. (1993) H. Döbereiner, J. Käs, D. Noppl, I. Sprenger, and E. Sackmann, Biophysical Journal 65, 1396 (1993).
- Tanaka et al. (2004) T. Tanaka, R. Sano, Y. Yamashita, and M. Yamazaki, Langmuir 20, 9526 (2004).
- Leirer et al. (2009) C. Leirer, B. Wunderlich, V. Myles, and M. Schneider, Biophysical Chemistry 143, 106 (2009).
- Zabusky et al. (2011) N. Zabusky, E. Segre, J. Deschamps, V. Kantsler, and V. Steinberg, Physics of Fluids 23, 041905 (2011).
- Veerapaneni et al. (2009) S. Veerapaneni, D. Gueyffier, D. Zorin, and G. Biros, Journal of Computational Physics 228, 2334 (2009).
- Salac and Miksis (2011) D. Salac and M. Miksis, Journal of Computational Physics 230, 8192 (2011).
- Napoli and Vergori (2010) G. Napoli and L. Vergori, Journal of Physics A: Mathematical and Theoretical 43, 445207 (2010).
- Gera (2017) P. Gera, Ph.D. thesis, State University of New York at Buffalo (2017).