Simulations of extragalactic magnetic fields and of their observables.
Abstract
The origin of extragalactic magnetic fields is still poorly understood. Based on a dedicated suite of cosmological magneto-hydrodynamical simulations with the ENZO code we have performed a survey of different models that may have caused present-day magnetic fields in galaxies and galaxy clusters. The outcomes of these models differ in cluster outskirts, filaments, sheets and voids and we use these simulations to find observational signatures of magnetogenesis. With these simulations, we predict the signal of extragalactic magnetic fields in radio observations of synchrotron emission from the cosmic web, in Faraday Rotation, in the propagation of Ultra High Energy Cosmic Rays, in the polarized signal from Fast Radio Bursts at cosmological distance and in spectra of distant blazars. In general, primordial scenarios in which present-day magnetic fields originate from the amplification of weak () uniform seed fields result more homogeneous and relatively easier to observe magnetic fields than than astrophysical scenarios, in which present-day fields are the product of feedback processes triggered by stars and active galaxies. In the near future the best evidence for the origin of cosmic magnetic fields will most likely come from a combination of synchrotron emission and Faraday Rotation observed at the periphery of large-scale structures.
-
February 2017
1 Introduction
Despite the progress in measuring magnetic fields across cosmic scales in the last few decades, the origin of extragalactic magnetic fields is still a mystery (e.g. Widrow, 2002; Ryu et al., 2012; Widrow et al., 2012). We understand by and large how the inhomogeneities of the cosmic microwave background (CMB) at are related to the distribution of dark and baryonic matter, but we know little about how magnetic fields in galaxies and clusters of galaxies have formed. It is generally believed that today’s magnetic fields in galaxies (e.g. Beck et al., 2012; Pakmor et al., 2014; Rieder and Teyssier, 2016, 2017, for a few recent works on the subject) or in the intracluster medium (e.g. Dolag et al., 1999; Brüggen et al., 2005; Ryu et al., 2008; Xu et al., 2009; Beresnyak and Miniati, 2016) must have been the result of amplification of so-called seed fields. But are the seed fields already in place at the epoch of the CMB and just too weak to be detected? Or did the seed fields arise during galaxy formation, and were powered by magnetized winds and jets from compact objects? These are tough questions since observations of magnetic fields in rarefied environment are scarce and their interpretation is difficult.
On one hand, the discovery of primordial magnetic fields will inspire interesting physics of the early Universe that may involve the generation of currents during inflation, phase transitions and baryogenesis (e.g. Harrison, 1973; Kahniashvili et al., 2010; Widrow et al., 2012; Kahniashvili et al., 2011; Durrer and Neronov, 2013; Subramanian, 2016; Kahniashvili et al., 2016).
Depending on the particular magnetization mechanism at play, these primordial seed fields may be characterized by small (, e.g. Chernin 1967) or large (e.g. Zel’dovich, 1970; Turner and Widrow, 1988) coherence lengths, whose structure may still persist in todays voids, possibly also carrying information on the generation of primordial helicity (e.g. Semikoz and Sokoloff, 2005; Campanelli, 2009; Kahniashvili et al., 2016).
On the other hand, if magnetic fields have been released by processes triggered during galaxy formation, they might have affected the transport of heat, entropy, metals and cosmic rays in forming cosmic structures (e.g. Planelles et al., 2016).
Additional processes such as the “Biermann-battery” mechanism (Kulsrud et al., 1997), aperiodic plasma fluctuations in the inter-galactic plasma (Schlickeiser et al., 2012), resistive mechanisms (Miniati and Bell, 2011) or ionization fronts around the first stars (Langer et al., 2005) might provide additional amplification to the primordial fields. Overall, the present uncertainty in primordial magnetic fields is uncomfortably large, allowing for fields in the range of G.
Inside cosmic structures, weak seed fields can be amplified by a small-scale dynamo triggered by the turbulence induced by mergers and accretions (Ryu et al., 2008; Federrath et al., 2011; Schleicher et al., 2013; Cho, 2014; Marinacci et al., 2015). Whether or not this scale is reached depends on the age of the system, on the magnetic Reynolds number and on the nature of the turbulent forcing (Federrath et al., 2014; Beresnyak and Miniati, 2016). In addition, astrophysical sources at lower redshift () inject magnetic fields into the cosmos. Galaxies can seed magnetic fields in large-scale structures, in an inside-out fashion: star formation drives winds of magnetized plasma into the circumgalactic medium (e.g. Kronberg et al., 1999; Völk and Atoyan, 2000; Donnert et al., 2009; Bertone et al., 2006; Samui et al., 2017), and into voids (Beck et al., 2013), while active galactic nuclei (AGN) can magnetize the central volume of clusters (e.g. Dubois and Teyssier, 2008; Xu et al., 2009) and even the intergalactic medium during their quasar phase (Furlanetto and Loeb, 2001). The efficiency of any magnetization process connected to galaxy formation is predicted to drop with the degree of overdensity (over the cosmic mean density), due to the dilution of injected fields with the expansion of the Universe as well as the fact that there are fewer sources in less dense regions. Some authors have suggested a lower limit to magnetic fields in voids of , due to the activity of magnetized outflows from isolated dwarf galaxies (Beck et al., 2013). A few studies obtained volume-averaged limits on magnetic fields on cosmological scales: using different methods, field strengths have been found (Blasi et al., 1999; Kahniashvili et al., 2010; Böhringer et al., 2016). However, it is difficult to translate this into magnetic field strengths in cosmological objects such as galaxy clusters.
Galaxy clusters host magnetic fields of several with coherence scales of several tens of , up to a few from the cluster center that seems to be consistent with various models for the magnetization of the Universe. A few cosmological magneto-hydrodynamical simulations could qualitatively reproduce the typical magnetization of galaxy clusters, starting from either fully primordial (e.g. Dolag et al., 2001; Brüggen et al., 2005; Bonafede et al., 2011; Ruszkowski et al., 2011; Vazza et al., 2014; Marinacci et al., 2015, 2017) or astrophysical (i.e. driven by AGN and/or star formation, e.g. Donnert et al., 2009; Xu et al., 2009, 2012) mechanisms. However, in the periphery of galaxy clusters the magnetic field profiles resulting from different models is expected to diverge because dynamo amplification is less efficient as gas motions become increasingly supersonic (e.g. Ryu et al., 2008; Brüggen et al., 2011; Schleicher et al., 2013; Vazza et al., 2014).
However, observations of cosmological magnetic fields will remain complex and hard interpret, given the weakness of the expected signal and the combination with other effects. In this contribution, we will discuss how the combination of state-of-the-art MHD simulations in cosmology and observations may be crucial to reveal the origin of extragalactic magnetic fields. In Sec. 2 we present our new suite of numerical simulations. In Sec. 3 we present our results, first by discussing the three-dimensional properties of magnetic fields (Sec.3.1), and second by predicting their signature in various observations: synchrotron radio emission (Sec. 3.2), Faraday Rotation (Sec. 3.3), Ultra-high Energy Cosmic Rays (Sec: 3.4.1) and Fast Radio Bursts (Sec. 3.4.2). Our discussion and conclusions are given in Sec. 4, while technical details on the numerical methods are given in the Appendix.
2 Cosmological magneto-hydrodynamical simulations
Simulating the evolution of extragalactic magnetic fields requires the joint modeling of the evolution of dark matter (DM), gas and magnetic fields ab-initio in expanding space. In addition to gas compression, one of the key processes behind the emergence of large-scale fields within structures is the small-scale dynamo, driven by turbulent motions (e.g. Subramanian et al., 2006; Ryu et al., 2008; Porter et al., 2015). The simulation of the turbulent dynamo is hard because of the difficulty to reach the required magnetic Reynolds numbers of for the exponential stage of the dynamo amplification to start (e.g. Beresnyak and Miniati, 2016).
The simulations presented here have been performed with a customized version of the ENZO code (Bryan et al., 2014). ENZO solves the equations describing the dynamics of the two main matter components in the Universe, baryonic matter and DM, driven by the gravitational field generated by the combined mass distributions. The DM component is evolved using a particle-mesh N-body method, while the baryonic component is represented as an ideal fluid, discretized on a mesh. The gravitational potential of the baryonic plus DM is calculated solving the Poisson equation through a combined multi-grid plus Fast Fourier Transform approach.
The magneto-hydrodynamical (MHD) module used in our simulations is the conservative Dedner formulation (Dedner et al., 2002) which uses hyperbolic divergence cleaning to keep the term as small as possible. The MHD solver adopts the PLM (Piecewise Linear Method) reconstruction, fluxes at cell interfaces are calculated using the using the Harten-Lax-van Leer (HLL) approximate Riemann solver. Time integration is performed using the total variation diminishing (TVD) second-order Runge-Kutta (RK) scheme (Shu and Osher, 1988). Recent papers have shown that this MHD approach is robust and competitive compared to other MHD solvers (Kritsuk et al., 2011; Pakmor et al., 2014; Hopkins and Raives, 2016). In our version of the code we used the GPU-accelerated MHD version of ENZO by Wang et al. (2010).
Although the use of AMR helps in resolving the turbulent flow inside forming structures (e.g. Vazza et al., 2017; Wittor, Vazza and Brüggen, 2017) in the simulations presented here we use a fixed resolution approach, using large ( ) grids. This has the advantage of providing the best resolved view of magnetic fields even in low-density regions, which would typically not be refined in AMR schemes. However, these regions are important if we look at the effects of cosmic magnetic fields on the propagation of ultra-high energy cosmic rays or Faraday Rotation. This choice allows high resolution in cluster outskirts and filaments, characterized by modest over-densities (). Dedicated studies of the amplification of magnetic fields in the innermost regions of galaxy clusters, based on AMR resimulations, will be presented elsewhere.
| cooling | BH feedback | SF feedback | other sources of B | ID | ||||
| [kpc] | [Mpc] | [nG] | ||||||
| 83.3 | 200 | n | n | n | 1 | n | P | |
| 83.3 | 200 | primordial | n | 0.01 | AGN () | CF1 | ||
| 83.3 | 200 | primordial | n | 0.01 | AGN () | CF2 | ||
| 83.3 | 85 | n | n | n | 1 | no | P | |
| 83.3 | 85 | n | n | n | 1 (Zeld.) | no | Pz | |
| 83.3 | 85 | n | n | n | 1 (Zeld. 2nd) | no | Pz2 | |
| 83.3 | 85 | n | n | n | dynamo, | DYN1 | ||
| 83.3 | 85 | n | n | n | dynamo, | DYN4 | ||
| 83.3 | 85 | n | n | n | dynamo, | DYN5 | ||
| 83.3 | 85 | n | n | n | dynamo, | DYN6 | ||
| 83.3 | 85 | n | n | n | dynamo, | DYN7 | ||
| 83.3 | 85 | n | n | n | 1 | dynamo, | DYN8 | |
| 83.3 | 85 | primordial | n | n | n | C | ||
| 83.3 | 85 | primordial | n | AGN() | CF1 | |||
| 83.3 | 85 | primordial | n | AGN() | CF2 | |||
| 83.3 | 85 | chemistry | n | CSF1 | ||||
| 83.3 | 85 | chemistry | n | CSF2 | ||||
| 83.3 | 85 | chemistry | n | CSF3 | ||||
| 83.3 | 85 | chemistry | n | 1 | no | CSF4 | ||
| 83.3 | 85 | chemistry | n | 0.01 | CSF5 | |||
| 83.3 | 85 | chemistry | , | CSFBH1 | ||||
| 83.3 | 85 | chemistry | , | CSFBH2 | ||||
| 83.3 | 85 | chemistry | , | CSFBH3 | ||||
| 83.3 | 85 | chemistry | , | CSFBH4 | ||||
| 83.3 | 85 | chemistry | , | CSFBH5 | ||||
| 83.3 | 85 | chemistry | n | 1 | , dynamo | CSFDYN1 |
2.1 The Chronos++ Suite of simulations
We have produced a large suite of cosmological MHD simulations with ENZO, the ”Chronos++ suite” 111http://cosmosimfrazza.myfreesites.net/the_magnetic_cosmic_web in order to explore various scenarios for the emergence of large-scale magnetic fields. In the past, only few attempts have been made to compare the outcomes of competing scenarios for the origin of magnetic fields in galaxy clusters (Donnert et al., 2009; Marinacci et al., 2015). Most authors have focused on specific mechanisms for the origin of cosmic magnetic fields (e.g. Dolag et al., 1999; Dubois and Teyssier, 2008; Xu et al., 2009; Marinacci et al., 2017). Our aim here is to produce the most complete survey of realistic models of magnetogenesis and model observations of large-scale fields. This suite includes three main classes of runs: primordial, dynamo and astrophysical magnetogenesis scenarios. We give a brief explanation of each model below, while a more detailed explanation of the numerical aspects of each implementations is given in the Appendix:
-
•
primordial models: Here, we assume a volume-filling magnetic seed field at the beginning of the simulation (). This field is then subject to compression, rarefaction and amplification in the course of structure formation. The simplest way of initializing the seed field is by imposing a uniform value for every component of the initial magnetic field . In addition, we generated seed magnetic fields with the same spatial structure of the matter perturbations using the standard Zeldovich approximation (see Sec. C). While the first approach mimics a scenario in which large- cale () magnetic field domains are generated due to inflationary mechanisms, the second mimics high-z seeding mechanisms that are related to very early structure formation (e.g. Biermann battery, ionization fronts around first stars, etc). In order to compare to the outcome of the simpler uniform initialization, the r.m.s values of the field generated in the Zeldovich approximation are renormalized within the volume so that . In this project we compared to set of initial conditions obtained in this way, with two different spatial orientation of the initial magnetic field vectors. For the runs presented here, we used a value of (comoving) which is closed to the maximum allowed by the most recent constraints from the CMB (Planck Collaboration, Ade, Aghanim, Arnaud, Arroja, Ashdown, Aumont, Baccigalupi, Ballardini, Banday and et al., 2016), i.e. . In most of our simulations of primordial scenarios, we use a non-radiative setup for gas physics. This is particularly helpful to understand the dependence of the magnetic fields on the spatial resolution and thus the effective Reynolds number (e.g. Vazza et al., 2014). It also helps to disentangle the role of gas cooling, feedback and dynamo amplification in the growth of simulated magnetic field (which is otherwise non-trivial, Marinacci et al. 2015).
-
•
dynamo models: Here, we start with much weaker seed fields () but we allow for the dynamo amplification of fields by the solenoidal turbulence developed in large-scale structures. As the spatial resolution in our runs is often too coarse to allow for the development of a saturated dynamo, we implemented a simplistic subgrid model for the dynamo, that computes the fraction of turbulent (solenoidal) kinetic energy flux which should go onto the amplification of seed fields (Porter et al., 2015; Beresnyak and Miniati, 2016). We rely on the numerical survey of turbulence in a box runs by Federrath et al. (2014), and use their fitting formulas to the observed growth of magnetic fields as a function of the local Mach number and plasma parameters. See D for more details.
-
•
astrophysical models: In these models magnetic fields are seeded by a) stellar activity and/or b) supermassive black holes at the center of active galactic nuclei. Star formation is modelled following the prescription by Kravtsov (2003), with tunable star formation efficiencies, timescales and feedback parameters. We explored several combination of possible parameters, by benchmarking our models against the observed cosmic star formation rate (see A). We implemented the possibility of accounting for magnetic feedback energy from ”star forming particles”, with a tunable efficiency usually set to of the total feedback energy. We refer to A for more details. The growth of supermassive black holes and their thermal/magnetic feedback on the surrounding gas is simulated with ”BH particles”, injected at the location of massive halos at (Kim et al., 2011). The feedback energy is released as an extra thermal energy output from each black hole particle, and also in this case we link each episode of AGN feedback to the release of magnetic field from magnetized dipoles jets (assuming efficiencies in the range ). In our largest runs we also used an alternative approach where impulsive feedback from high-density regions () undergoing cooling is released with a fixed thermal energy per event, erg. This approach yields a fairly good representation of the large-scale impact of the combined sellar and AGN feedback in simulations too expensive to allow also for the inclusion of more chemistry, stellar or BH particles (see B for more details).
In all runs we assumed a CDM cosmological model, with density parameters , , , and a Hubble constant km/sec/Mpc (Planck Collaboration, Ade, Aghanim, Arnaud, Ashdown, Aumont, Baccigalupi, Banday, Barreiro, Bartlett and et al., 2016). All runs started at and have the constant spatial resolution of (comoving) and the constant mass resolution for DM of per particle. The most relevant parameters that controls the magnetization levels in our runs are given in Tabl. 1, while a more detailed list of parameters involved in the simulation of star forming particles and supermassive black hole is given in the Appendix (Tab. 2).
In a first set of runs we resimulated a (85 Mpc)3 volume with cells and DM particles with many physical variations, in order to monitor the effect of gas physics and magnetic field scenarios on the large-scale distribution of magnetic fields. Manifestly, the resolution in our runs is too coarse to properly resolve the complex and multi-phase process of star formation in galaxies, for which many more advanced models have been developed over the years (e.g. Scannapieco et al., 2012; Teyssier et al., 2013; Genel et al., 2014; Kim et al., 2014; Schaye et al., 2015; Dubois et al., 2016; Dolag et al., 2017, just to least a few seminal works on the subject). Our main goal here is to monitor the impact of effective (i.e. resolution dependent and ad-hoc calibrated) galaxy formation models on the large-scale generation of magnetic fields.
In this work we focus on a subset of the 23 most realistic runs in the Chronos++ suite. Besides gas and DM, the radiative runs of this dataset also followed the evolution of seven chemical species (HI, HII, HeI, HeII, HeIII, free electrons and ”metals”). While in most runs we only focus on one set of models, in a couple we combine them, to see the maximum concurrent effect of all sources of magnetization (e.g. runs DYN8 and CSFDYN1). The typical time needed to complete these runs from to is core hours for each non-radiative run and core hours (on average) for our runs with cooling, chemistry, star formation and BH particles.
A second set of three larger simulations of a (200 Mpc)3 box was run using cells/DM particles to allow us a better comparison with the large volumes which radio (e.g. LOFAR, MWA, SKA etc ) and X-ray (e.g. eRosita, Athena) observations will probe. In this second case, we simulated a simple primordial scenario () and two variations of the astrophysical scenarios (with a fixed energy release per feedback event of or of , in both cases assuming ). In the astrophysical scenarios, we also included radiative equilibrium gas cooling, for a constant metallicity of , but no other chemistry in order to limit the memory requirement of the simulation. The typical computing time needed to complete these runs from to is million core hours for the non-radiative run and million hours for the radiative runs.
The most computationally demanding simulations have been run on the Piz Daint HPC system, operated by the Swiss National Supercomputing Centre (ETHZ-CSCS222www.cscs.ch), a Cray XC50/XC40 supercomputer with more than 5000 computing nodes, each equipped with 12 cores Intel Xeon E5-2690/2695 CPUs and an NVIDIA Tesla P100 GPUs. Our simulations typically used 64 computing nodes of Piz-Daint, while our simulations required up to 2400 computing nodes. A subset of our simulations was run on the Jureca cluster of the Juelich Supercomputing Centre (JSC), using 64 standard nodes.
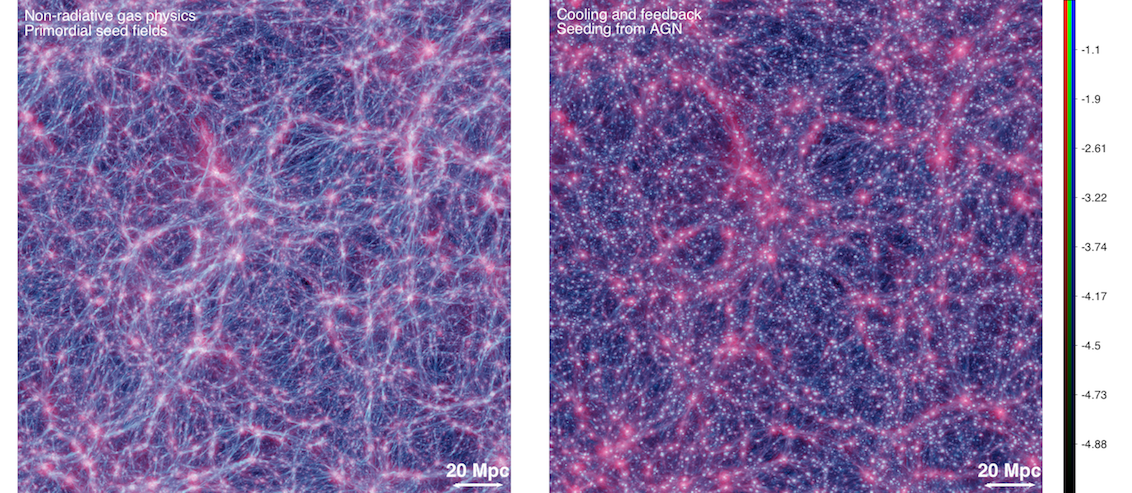
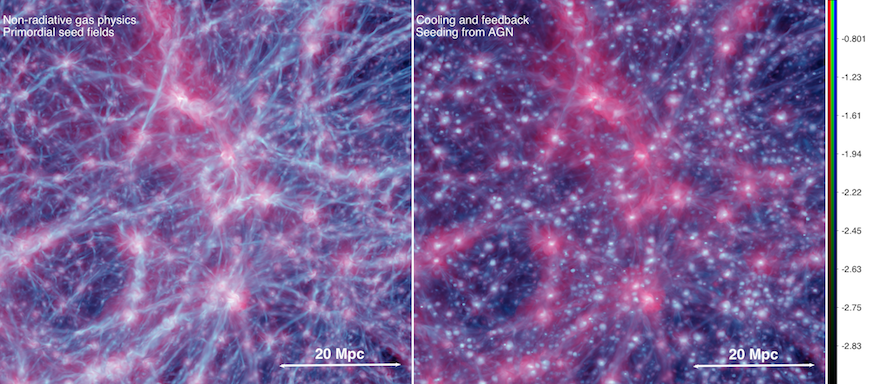
Figs. 1-2 show the projected gas temperature and magnetic field strength for the two extreme scenarios explored in our our largest runs at : the primordial (P) and the astrophysical scenario (run CF1), for two different levels of zoom. Clearly, the two models lead to a very similar magnetic fields inside the densest knots of the cosmic web such as clusters or groups of galaxies, but they increasingly diverge in cluster outskirts, filaments and voids. The large-scale morphology of the magnetic cosmic web is different in the two scenarios: it resembles the matter cosmic web in the primordial scenario, but is mostly made of percolating magnetic ”bubbles” if the sources of magnetic fields are located in galaxies.
3 Results
3.1 The distribution of magnetic fields across cosmic environment
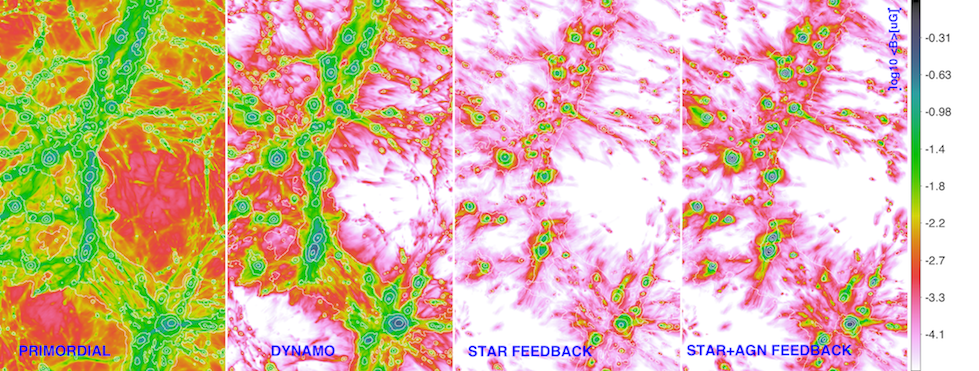
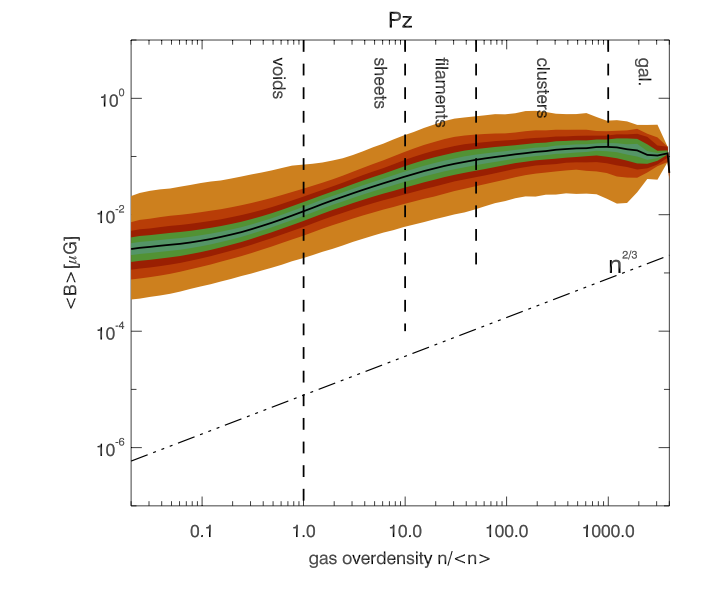
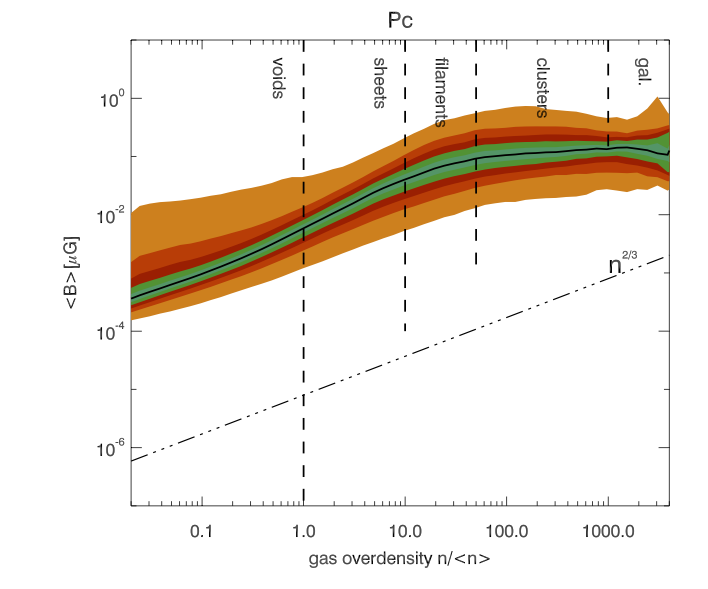
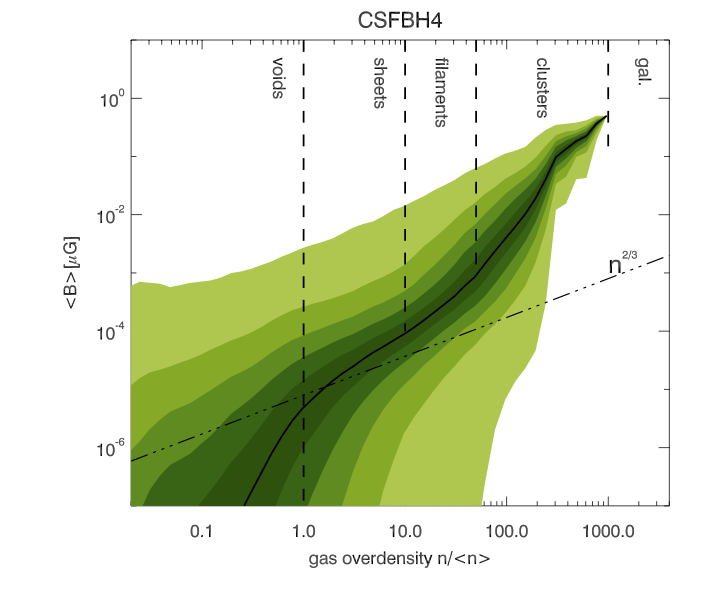
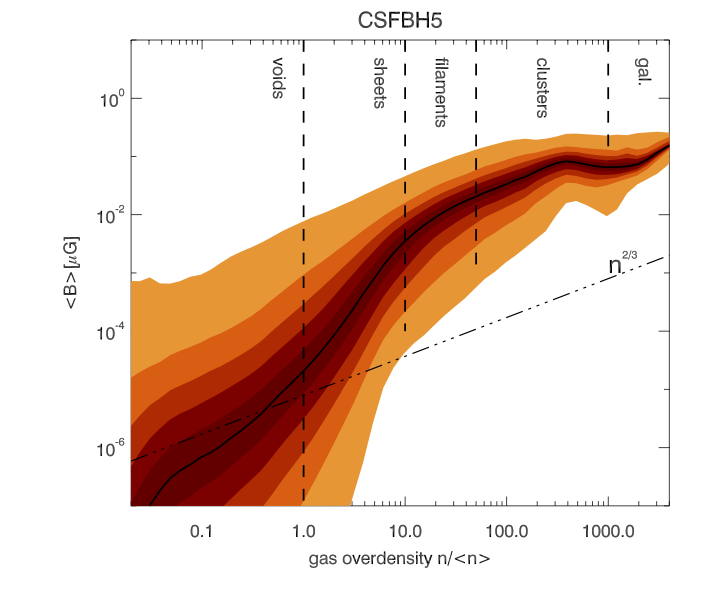
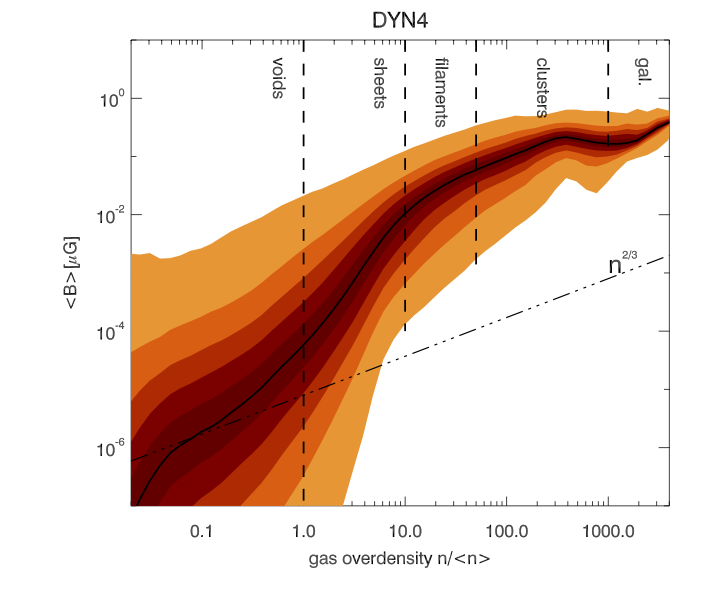
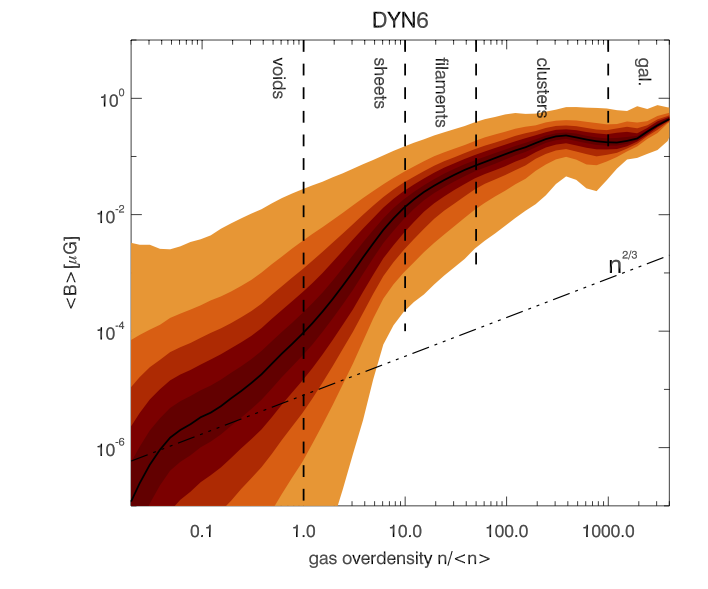
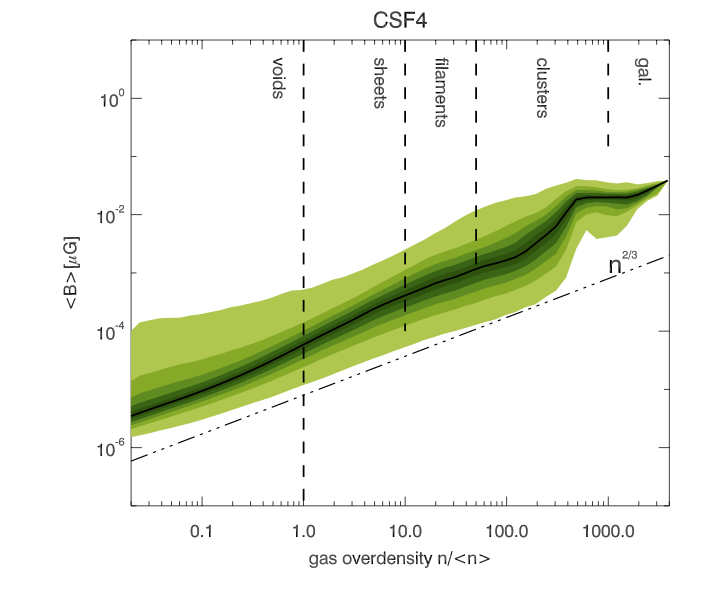
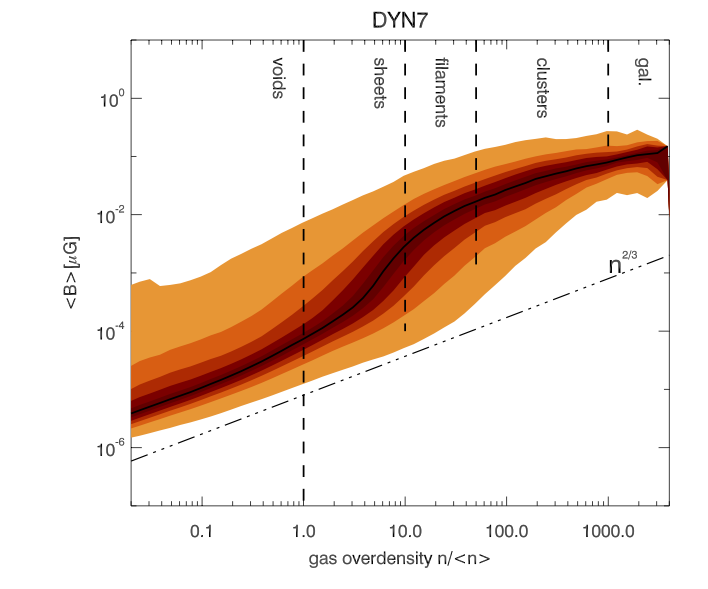
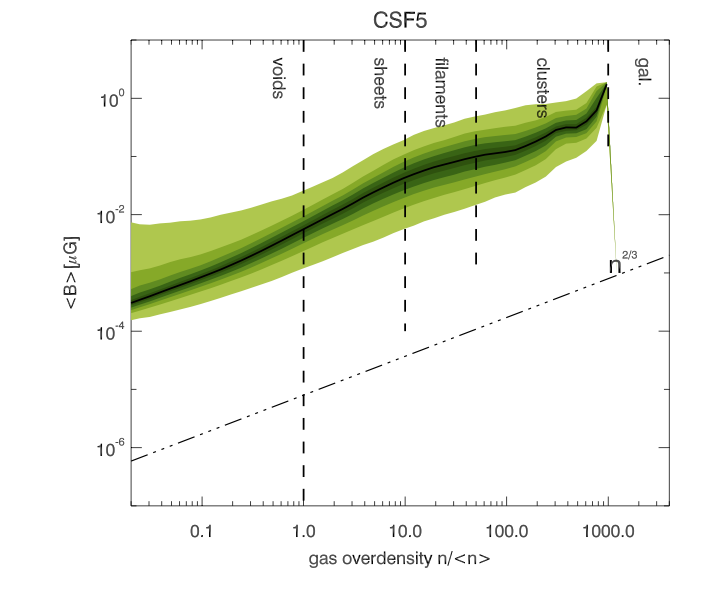
Fig. 3 shows the mass-weighted magnetic fields at , as simulated in four representative resimulations of the (85 Mpc)3 box. Evidently, the distribution of gas pressure is nearly identical in all runs, at least on scales where cooling and feedback effects play a minor role. However, the three-dimensional distributions of the magnetic fields in the different scenarios show significant differences. Inside clusters and groups of galaxies, the magnetic fields are similar in all cases (), which is not surprising because all these recipes have been designed to match the magnetic field typically observed in large-scale structures. However, the agreement gets much worse in the periphery of large-scales structures because of the different efficiency with which each model produces large-scale fields. In the primordial scenario, voids are magnetized at the level, which is the remnant of the initial seed field, rarefied by the density drop . Filaments and clusters outskirts have a magnetic field times larger than in voids, due to compression and amplification.
On the other hand, if the observed magnetization in large-scale structures follows from the dynamo amplification of weaker initial fields (second panel), the magnetic fields in voids will be orders of magnitude smaller at z=0 (). The magnetic fields caused by dynamo amplification in filaments and cluster outskirts are roughly as large as in the previous scenario (), but with a strong dependence on gas density because of the increased level of solenoidal turbulent motions in denser regions (e.g. Ryu et al., 2008; Vazza et al., 2014).
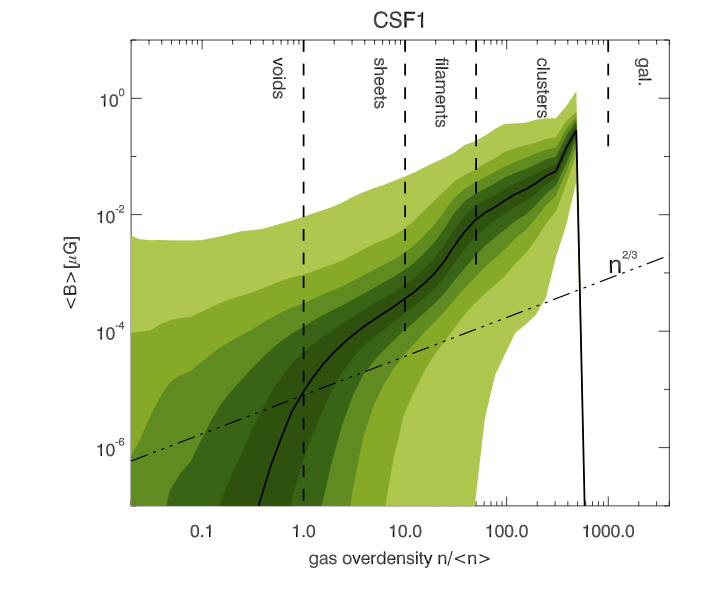
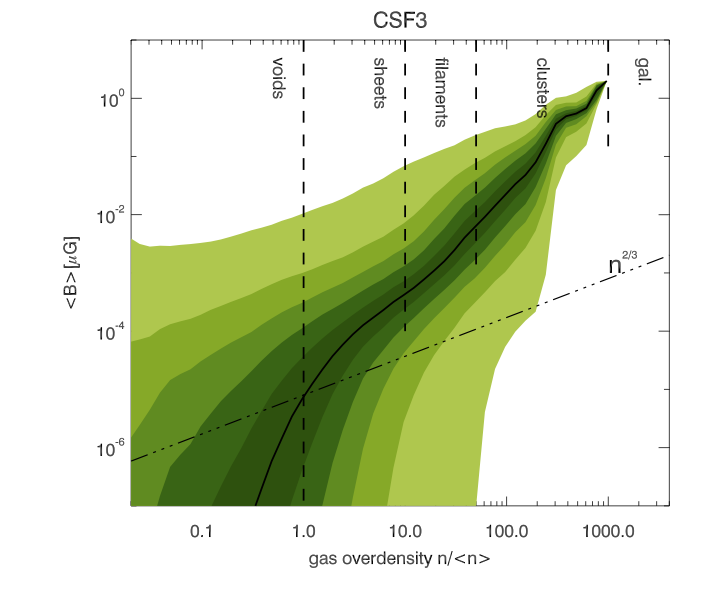
In the other astrophysical scenarios, filaments are much less magnetized, typically at the level if the initial seed field is negligible. The distribution of magnetic fields in the cosmic web mirrors that of active galaxies, and magnetization proceeds from ”blobs” expanding from the densest objects and these blobs eventually merge. A few away from supermassive black holes and their induced AGN activity, we do not see much difference between models in which the magnetization only comes from star-powered outflows (third vs fourth panel).
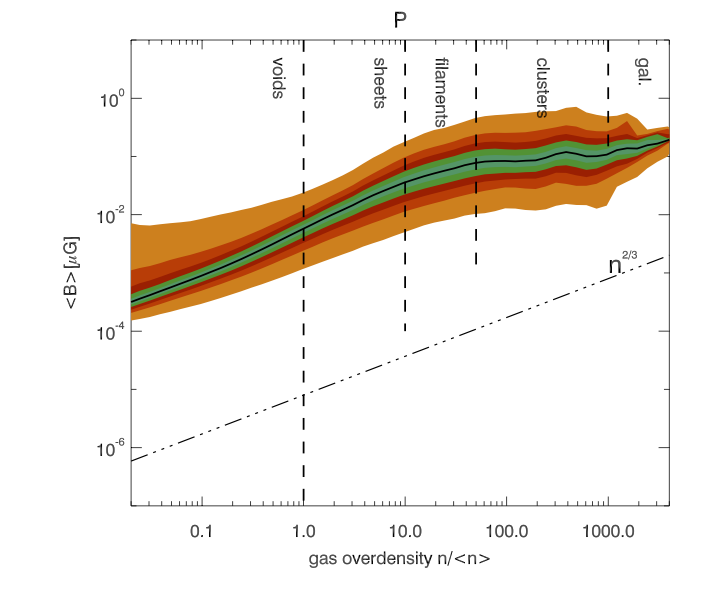
In Fig. 4, we show the () phase diagrams of twelve representative runs at (three primordial, astrophysical and dynamo run, plus three ”mixed” models). The main points to take away from them are:
-
•
only a very mild amplification with respect to the is observed in our primordial runs, that does not resolve the small-scale dynamo inside virialized halos 333With a tailored campaign of adaptive mesh refinement simulations of galaxy clusters, we find indeed that a achieving a resolution of the order of , in a nearly uniform way inside the virial volume of halos is necessary to resolve the small-scale dynamo (Vazza et al., submitted). Hence we do not expect to recover realistic fields inside galaxy clusters because the dynamo is artificially quenched or delayed by the lack of resolution (e.g. Beresnyak and Miniati, 2016). . Moreover, the onset of a cooling flow compresses the field to even larger values at high densities. [run P vs Pz vs Pc, top row.]
-
•
Differences in the initial topology of the primordial field have a small effect on the overall () relation. However, we observe larger fluctuations of magnetic fields in voids in the Zeldovich initialization. [run P vs Pz]
-
•
The effect of cooling, star formation and feedback from supermassive black holes significantly increases the scatter in the magnetic fields at all overdensities. This is an effect of outflows and intermittent activity from galaxy formation processes. [second vs first row]
-
•
The maximum magnetic fields that can be achieved from star formation slightly depends on the assumed minimum density to trigger such process, and almost linearly scales with the magnetization efficiency from the stellar feedback. This is also consistent with the run-time magnetic output of the star formation recipes, see A. [CSF1 vs CSF3]
-
•
The additional seeding from supermassive black holes only has a modest impact on the global magnetisation. It is also limited to high-density regions if star formation is already included, mostly because the reservoir of cool gas which triggers feedback has been already expelled by star formation before large enough supermassive black holes can form. [CSFBH4 vs CSF1 and CSF3]
-
•
If we include the effect of dynamo amplification in a subgrid fashion, magnetization level of halos can be recovered even by starting with extremely weak fields. The final magnetic field level scales almost linearly with the assumed magnetization efficiency of the dynamo. [third row]
-
•
For seed fields, the effect of dynamo amplification is more important than compression in filament or in denser environments. For lower seed fields, the effect of dynamo amplification may be larger even at the density of cosmic sheets. [DYN7 vs DYN4 and DYN5].
-
•
A scenario in which all sources of magnetization have maximum efficiency is not very dissimilar from a primordial model starting from . However, the scatter in magnetization as a function of overdensity is smaller than in a purely astrophysical scenario because large primordial fields and the small-scale dynamo produce a floor of magnetization as a function of overdensity. [CSF5 vs CSF1 and CSF3]
As evident from Fig. 3, the median magnetic field in different scenarios clearly evolve differently in filaments or even lower-density structures. This is one of the most important properties we will use in the following sections to identify future observations. The amount of scatter in magnetic field strength measured at each overdensity is an additional key feature that discriminates between models: for example at the overdensity of filaments, we expect a roughly times larger scatter in magnetic fields in astrophysical models compared to primordial and dynamo models because density is not the only variable leading to a given magnetization level (e.g. also the past star-formation history contributes to it).
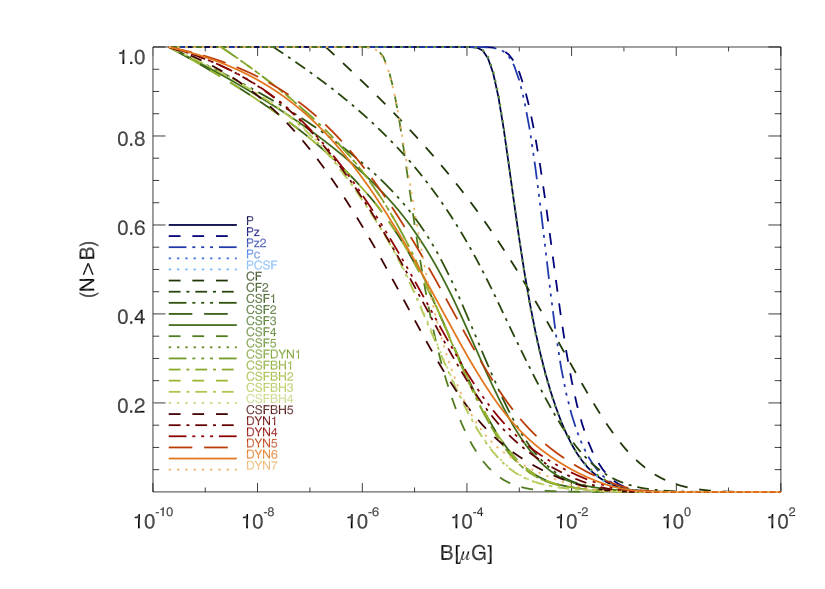
The volume distribution function of all simulations is shown in Fig. 5. This statistics is particular important for processes that are mostly affected by the magnetization on the largest scales, such as the propagation of Ultra-High Energy Cosmic Rays (Alves Batista and Sigl, 2014; Hackstein et al., 2016), as we will discuss in Sec. 3.4.1. Roughly speaking, of the simulated volume in our primordial models has , while the same is true only in of the simulated volume for dynamo models, and for most astrophysical models.
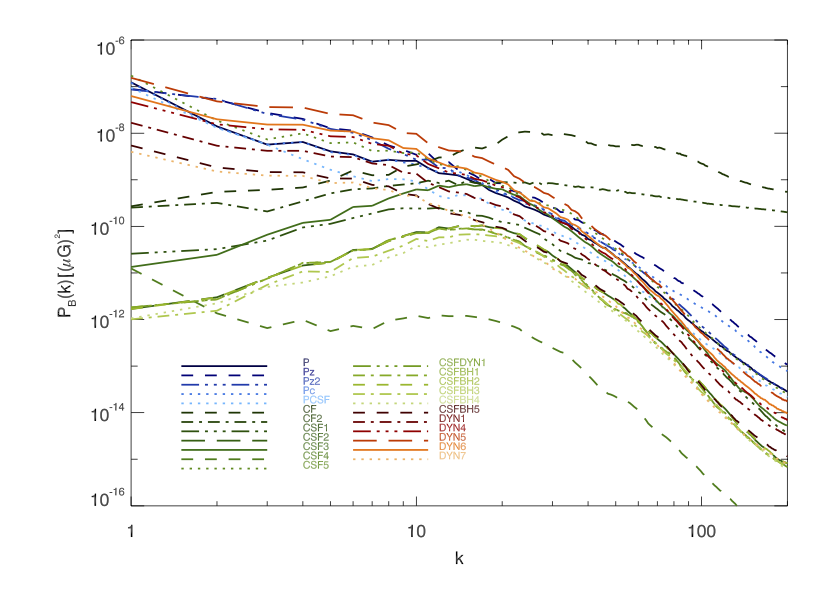
The large-scale topological distribution of simulated fields is captured by the three-dimensional power spectra of the magnetic field (here only the -component is shown), calculated with a standard Fast Fourier Transform (FFT) approach and assuming periodic boundary conditions (Fig. 6). Besides the obvious differences in normalization, it is evident that the astrophysical models concentrate more spectral power on scales of , while most of magnetic energy in primordial and dynamo models comes from the largest scales (). While the difference in magnetic energy is orders of magnitude at low spatial wave-numbers, the difference is reduced to orders of magnitude at the highest wave-numbers. Furthermore, in most scenarios the typical slope of the magnetic energy spectrum is with . This is not far from the typical slope of the velocity spectrum on the same scales (e.g. Ryu et al., 2008), which in turn reflects the clustering of matter on these scales (e.g. Widrow et al., 2009).
3.2 Synchrotron radio emission from shock-accelerated electrons (in cluster outskirts and filaments)
Although the warm-hot intergalactic medium (WHIM) should contain about a half of the total matter in the Universe (e.g. Nicastro, 2016, for a recent review), its direct observation is limited to a few cases in X-rays (Eckert et al., 2015; Akamatsu et al., 2017) or through the Sunyaev-Zeldovich effect (Planck Collaboration et al., 2013). However, the opening of the radio window on the magnetized cosmic web expected with the next generation of radio telescopes (LOFAR, MWA, MEERKAT and SKA) will change this.
Considering that in most magnetogenesis models the memory of the initial seed field is preserved in filaments, the detection of the WHIM at radio wave lengths holds large promises. The geometric and thermodynamical properties of the gas in filaments can be predicted across a wide range of scales in our simulations (Gheller et al., 2015), and they show well-defined scaling relations which mirror the scaling relations of the DM within them (e.g. Cautun et al., 2014). Simulated filaments show very little evolution of their properties for and their thermodynamical properties display strong correlations with the number and stellar mass of the galaxies they host (Gheller et al., 2016). These correlations are confirmed by observations (Alpaslan et al., 2014).
Filaments and cluster outskirts should be surrounded by strong accretion shocks (), where cosmic rays may be accelerated (e.g. Ryu et al., 2003). Relativistic electrons accelerated at these shocks must emit polarized radio emission, analogous to the radio relics detected in merging clusters (e.g. Hoeft and Brüggen, 2007; van Weeren et al., 2010; Feretti et al., 2012; Bonafede et al., 2012; de Gasperin et al., 2014). This class of large-scale radio emission has different properties from the other important class of diffuse emission in clusters, i.e. ”radio halos” (e.g. Ferrari et al., 2008; Feretti et al., 2012), whose origin is most likely explained by the Fermi II re-acceleration of mildly relativistic particles in the turbulent intracluster medium (e.g. Brunetti et al., 2001; Cassano and Brunetti, 2005). Despite of a few claims of possible detections (Giovannini et al., 2010; Farnsworth et al., 2013), the observation of large-scale shocks along filaments remains a challenge (e.g. Brown, 2011).
In recent work, we have looked at the potential of existing and future surveys to detect the cosmic web in emission at radio wavelengths. We assumed particle acceleration by diffusive shock acceleration 444Even though this model reproduces some properties of radio relics (e.g. Skillman et al., 2011; Nuza et al., 2017), it is challenged by several relics apparently associated with weak shocks (e.g. Kang et al., 2012; Pinzke et al., 2013; Vazza and Brüggen, 2014; Vazza, Eckert, Brüggen and Huber, 2015)., following the formalism by Hoeft and Brüggen (2007), and combined the Mach number and the magnetic fields measured in the simulation to predict the radio flux and the spectrum of synchrotron radiation. In the typical regime of the WHIM and for strong shocks, the emission as a function of frequency () scales as
| (1) |
where is the upstream gas density, is the (unknown) acceleration efficiency of electrons, is the up-stream sound speed and is the shock surface. The dependence between the acceleration efficiency of electrons and the Mach number is expected to be a steep function of for weak shocks rapidly saturate for . In our simulations we assume as a limiting value.
We showed that the shocks inside the cosmic web may be detected by the next generation of radio telescopes (Vazza, Ferrari, Bonafede, Brüggen, Gheller, Braun and Brown, 2015; Vazza, Ferrari, Brüggen, Bonafede, Gheller and Wang, 2015; Vazza, Brueggen, Gheller, Ferrari and Bonafede, 2016). The expected flux density is quite weak ( at ), typically diffuse on large angular scales () and highly polarized () 555It shall be noticed that the additional contribution from radio emitting secondary electrons produced in hadronic collisions (e.g. Miniati et al., 2001) and/or dark matter annihilation (e.g. Storm et al., 2017) may add to the signal from shocked electrons. However, these two additional mechanisms are predicted to rapidly fall off outside of the innermost core of halos, and can be safely neglected in predicting the radio signal from the shocked cosmic web (see e.g. Appendix in Vazza, Ferrari, Brüggen, Bonafede, Gheller and Wang 2015).. The SKA-LOW and its low-frequency precursors and pathfinders (e.g. LOFAR, MWA) may detect the tip of the iceberg of this emission, and allow to constrain the combination provided we know something about the thermal properties of the shock.
With the same formalism, we predicted the radio flux for the different models in the Chronos++ suite. Here we focus on the large (200 Mpc)3 resimulations, which gives us the largest sample of galaxy clusters and the closest match to the large radio survey of the future.
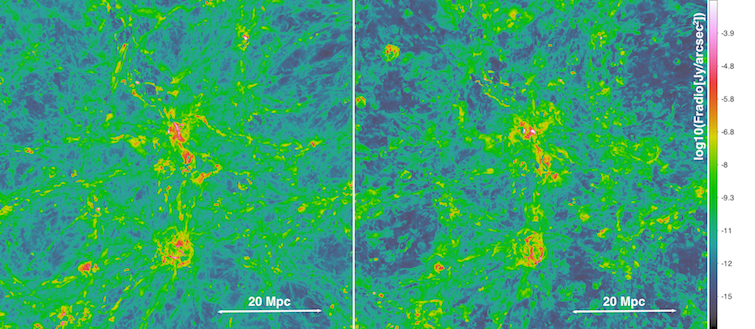
Fig. 8 shows the predicted radio flux density at (corresponding to a luminosity distance ) and at the central frequency of , both in the primordial and in the AGN (strong) seeding scenario, for the same selection of Fig. 2. While the radio flux from within clusters is remarkably similar, at the level of mJy/arcsec2, such emission drops faster with decreasing overdensity in the AGN seeding scenario, declining by 1-2 orders of magnitude outside filaments.
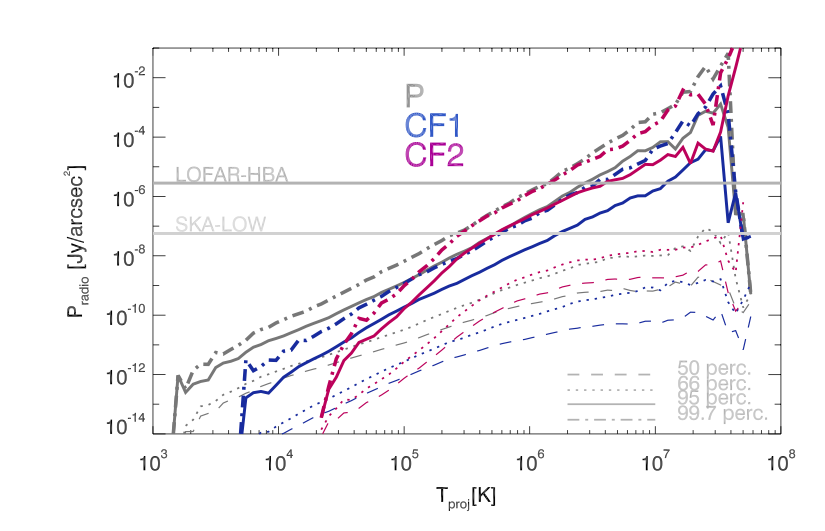
By correlating the radio emission with the mean mass-weighted temperature of our sky model, we can predict the typical relation between radio emission and gas properties across environments. In Fig. 7, we show the prediction for () in our three runs of the (200 Mpc)3 volume. Different percentiles of the distribution at each temperature bin are shown, to highlight the fact that while the median emission is clearly different between scenarios, the high percentiles have similar values and are therefore more difficult to distinguish. Only the top of the distribution is typically above the detection level for existing (e.g. LOFAR HBA) or future (e.g. SKA-LOW) radio surveys at low frequencies, in this case 120 MHz.
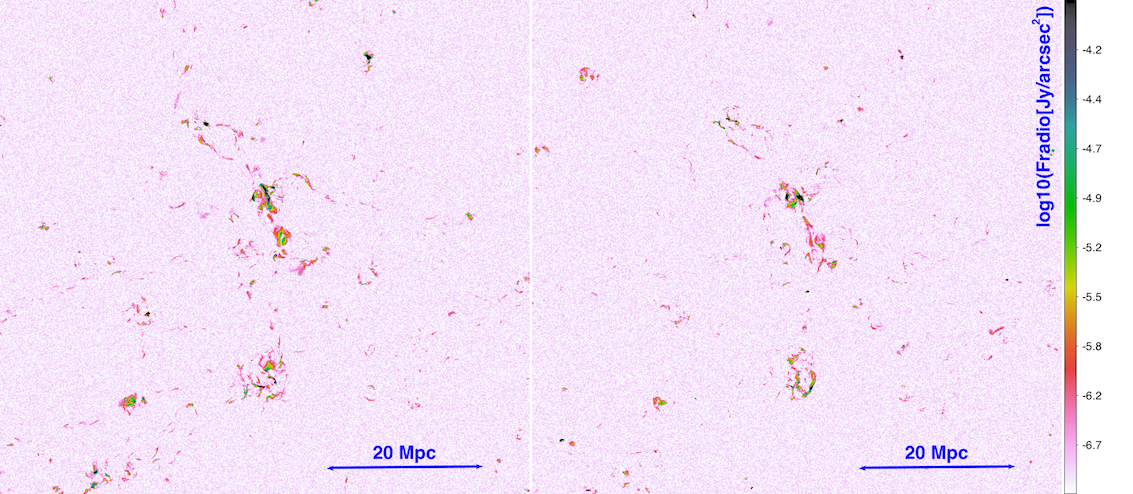
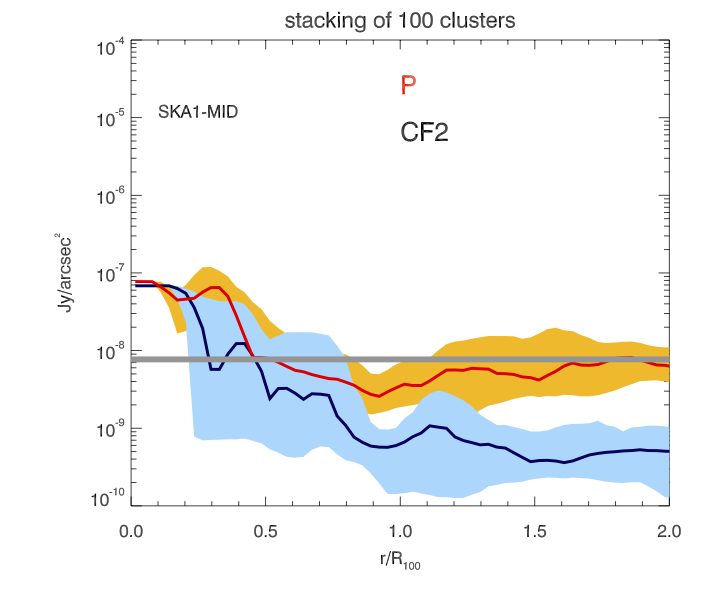
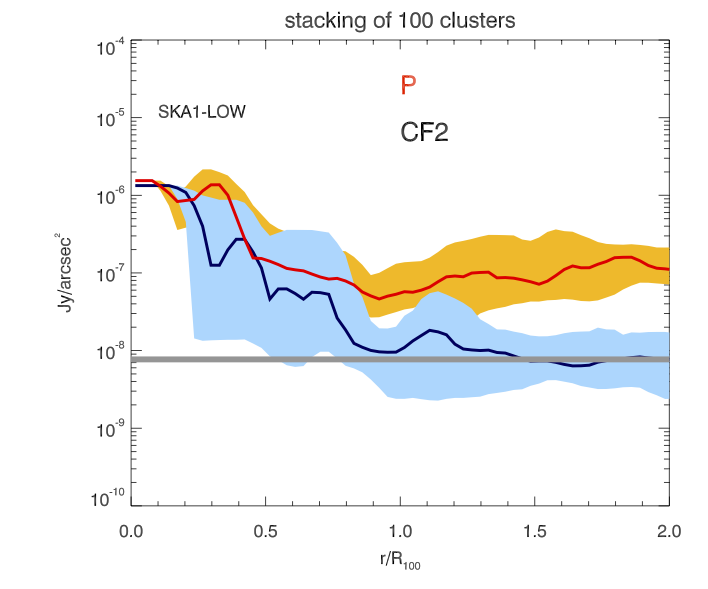
This is evident also by looking at the lower panels of Fig. 8, where we show the mock observation of the same region, assuming a hours integration for a survey with SKA-LOW survey at the central frequency of . Here we followed the same procedure of our previous works (but with the most updated performances expected for SKA-LOW), including the effect of thermal and confusion noise (Jy/beam) in the final image, the finite resolution beam () and the minimum baseline of the observation ( m). The differences in the two models are now mostly obscured by the noise. Still, significant differences are present, but they are best highlighted with the use of statistical techniques. For example, in Fig. 9 we show the result of the stacking of 100 mock radio maps of clusters with , in the primordial and in the AGN (high power) case at . The analysis has been performed both at GHz for SKA-MID observations and at for SKA-LOW observations, for which the approximated noise level (also including the estimate confusion noise level) has been overplotted as horizontal lines. While the two models display a similar average level of stacked flux in the innermost cluster regions, at both frequencies, the expected result of the stacking vary from , becoming statistically significant () at . However, only SKA-LOW should have the sensitivity on sufficiently large scales to perform this test, while in the case of SKA-MID the stacked emission will be below the detection limit in both cases.
In addition to stacking clusters or filaments, there may be other ways to extract signals from the cosmic web (Brown, 2011; Vazza, Brüggen, Gheller, Ferrari and Bonafede, 2015). For example, recent statistical studies based on the cross-correlation between radio surveys and galaxy surveys have derived upper limits on the magnetization of filaments of the order of , based on the absence of a strong correlation between synchrotron emission and the underlying galaxy distribution (Vernstrom et al., 2017; Brown et al., 2017). Given the difficulty of modeling the position-dependent contribution of galactic foregrounds and of resolved and unresolved radio galaxies to the weak large-scale structure emission, non-standard approaches to identify diffuse emission with a low signal-to-noise ratio might have to be adopted (e.g. based on Convolutional Neural Networks, Gheller et al., in prep.).
Finally, the role of shock obliquity, defined as the angle between the shock normal and the up-stream magnetic field, in the acceleration of particles remains unclear. In the Earth’s bow shock and in interplanetary shocks, electrons are directly observed to be accelerated to relativistic energies preferentially in quasi-perpendicular configurations, i.e. (e.g. Shimada et al., 1999; Oka et al., 2006). Recent particle-in-cell simulations of electron acceleration by weak intracluster shocks observed that only quasi-perpendicular shocks can pre-accelerate electrons, via shock-drift-acceleration (SDA), before being injected into DSA (Guo et al., 2014a, b). With a higher-resolution version of clusters from the Chronos++ sample obtained with adaptive mesh refinement and starting from a simple primordial model, we have recently explored the link between the obliquity on scales resolved in the simulations and the acceleration of cosmic rays (Wittor et al., 2016; Wittor, Vazza and Brüggen, 2017). Fig. 10 illustrates how switching off the acceleration of electrons for quasi-parallel shocks () may change the observed synchrotron emission in internal (top) and external (bottom) accretion shocks Wittor, Vazza and Brüggen (2017). The left panels show the radio emission if shock acceleration of electrons only depends on the Mach number (same synchrotron model by Hoeft and Brüggen 2007 as above), while in the right panels we limit the acceleration of electrons to shocks, based on Guo et al. (2014a). In typical merger shocks at low redshift the effect of an obliquity-dependent efficiency is small because the turbulent dynamics of the innermost ICM produces a distribution of angles close to random (). Therefore, even by restricting the acceleration to quasi-perpendicular shocks, the radio emission is found to be reduced by just a factor . On the other hand, the radio emission from outer accretion shocks is more significantly reduced in the case of acceleration by quasi-perpendicular shocks only (lower panels): not only the total power of the shock is significantly decreased (i.e. by a factor in this case), but also the morphology of the emission becomes thinner.
These results are consistent with the finding of Wittor, Vazza and Brüggen (2017), who found more parallel shocks compared to the random expectation, which occurs when large-scale primordial fields align with accretion shocks.
To complicate matters, Masters et al. (2017) recently detected significant electron acceleration by the and quasi-parallel shock, during the crossing the Saturn bow shock by the Cassini space mission. These plasma conditions are similar to the intracluster medium, and the acceleration may occur in the portion of the shock where upstream CR streaming instabilities generate perpendicular small-scale magnetic field components at the shock surface. This could leading to particle acceleration (e.g. Riquelme and Spitkovsky, 2011) and therefore stronger radio emission than in the case we just explored, with a suppression of acceleration for all shocks with on scales.

3.3 Faraday Rotation (in filaments and cluster outskirts)
The three-dimensional distribution of magnetic fields in large-scale structures can be probed by Faraday Rotation measurement (RM) of the emission from background polarized sources. The signal goes as
| (2) |
where denotes the component parallel to the direction of integration (e.g. Carilli and Taylor, 2002; Murgia et al., 2004). For a few decades, the study of RM from galaxy clusters has been essential to infer the tangled structure of intracluster fields (Vogt and Enßlin, 2003; Murgia et al., 2004; Guidetti et al., 2008; Bonafede et al., 2010; Vacca et al., 2010). So far, the RM of polarized sources shining through the cosmic web has been carried out with statistical studies on the heterogeneous output of radio surveys (Blasi et al., 1999; Johnston-Hollitt et al., 2015; Pshirkov et al., 2016; Böhringer et al., 2016). For example, Pshirkov et al. (2016) observed that the RM from distant radio sources do not exhibit any trend with redshift, while the extragalactic contribution grows with distance, and from this they propose to constrain the amplitude of magnetic fields below within the gas Jeans length of structures. However, the reliability of these estimates is limited by the fact that they only use two close frequencies in the NVSS survey (Condon et al., 1998), thereby being prone to the ambiguity in the estimate of the rotation angle, and the effect of beam depolarization is not taken into account for the the beam of NVSS. So far, the study of RM in the outer regions of nearby galaxy clusters has been limited to the prominent case of the Coma cluster Bonafede et al. (2013). Using the RM of seven polarized sources in the direction of the Coma radio relic and of an ongoing accretion from a possible intracluster filament, Bonafede et al. (2013) inferred a magnetic field of close to the virial radius of the Coma cluster, significantly higher than what predicted by extrapolating the previous trend of RM from sources observed in innermost volume of Coma (Bonafede et al., 2010).
In the near future, the SKA-MID should be able to detect tiny differences in the magnetic field properties of the ICM, which are far beyond the capabilities of the present instruments, allowing the detection of hundreds of sources in the background of massive galaxy clusters (Govoni et al., 2013; Johnston-Hollitt et al., 2015; Govoni et al., 2015; Bonafede et al., 2015a). Statistical methods based on Bayesian inference are also being developed to allow a robust removal of the various galactic and extragalactic contribution to the observed RM (Vacca et al., 2016). However, the RM data from the innermost cluster regions are not expected to teach us much about the origin of magnetic fields. This is because the small-scale dynamo amplification developed inside the inner cluster regions should be very efficient in removing any memory of seed fields as the bulk of observed magnetic energy is extracted from the cluster kinetic energy reservoir (e.g. Cho, 2014; Beresnyak and Miniati, 2016). For example, Donnert et al. (2009) reported basically identical RM profiles of clusters simulated starting from competing seeding scenarios.
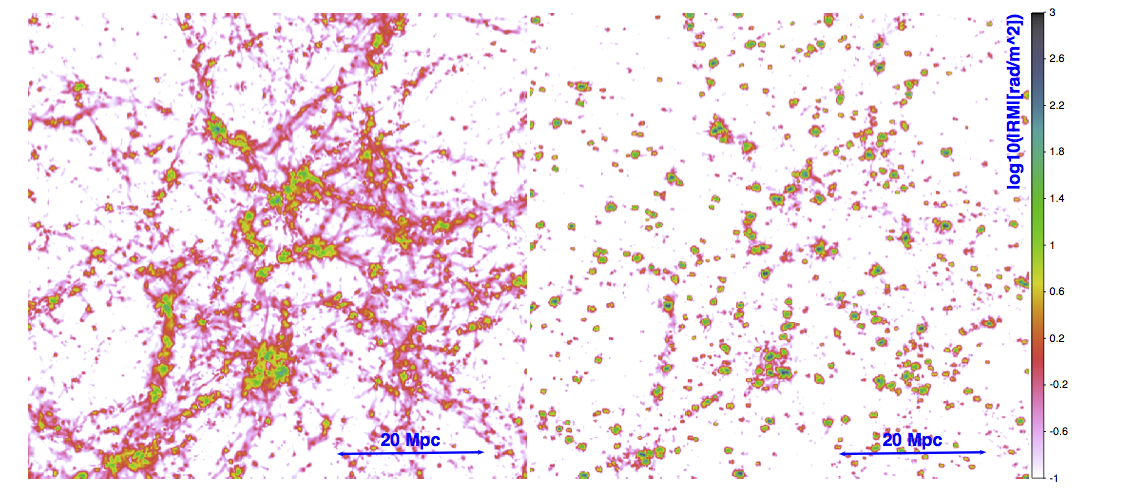
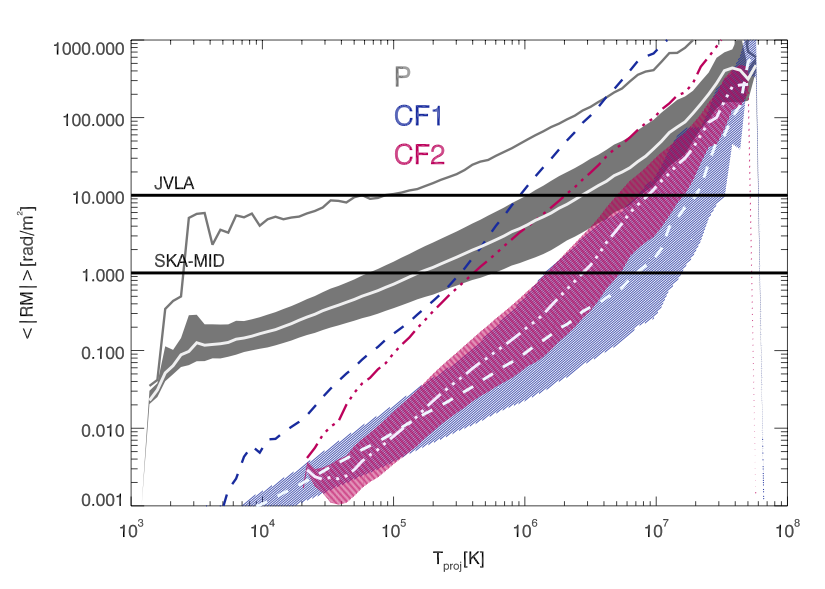
With the Chronos++ suite we can predict how RM should behave moving into the low density cosmic environment and away from the center of galaxy clusters. In a recent work (Vazza et al., submitted) we estimated that for this MHD scheme a resolution of at least is necessary to properly resolve the small-scale dynamo up to its final non-linear stage in a Coma-like cluster. The requirements on resolution should be less stringent for the RM in the external regions of clusters and in filaments, at least unless a dynamo on very small scales is possible (which is presently excluded by our numerical tests in Vazza et al. 2014). As in the previous case, we show here the extreme comparison between the primordial and the astrophysical seeding scenario in our volume, for exactly the same field of view of the synchrotron emission (Fig. 11). The RM signal is similar inside dense structures, and gets significantly different from cluster outskirts and filaments: in filaments in the primordial case, and in the astrophysical scenario. Unfortunately, these levels of RM are close to the sensitivity of existing and future polarimetric observations. As for the synchrotron emission, we show in Fig. 12 the () relation from our simulated sky models. Similar to the previous case, the primordial scenario yields higher values of RM at all temperatures, but unlike the synchrotron case this is also true for the peaks in the RM distribution at all temperatures. Again, we expect to be able to detect the peak of the RM distribution for with current instrumentation (e.g. the JVLA in the Figure), and in with the SKA-MID.
For example, the planned deep polarization survey with Band 2 and Band 3 with SKA-MID is expected to detect between and polarised sources per square degree at 1.4 GHz, with 0.1-1 mJy and resolution (e.g. Bonafede et al., 2015b; Taylor et al., 2015). For a Coma-like cluster, this translates into a RM of for polarized background sources, with a formal error in RM of the order of . Also before the advent of SKA, deep surveys in polarisation with ASKAP (Possum survey) and Meerkat (Mightee-Pol survey) are expected to enable a first testing of extreme scenarios of magnetogenesis.
3.4 High-energy physics probing large scale fields (in filaments and voids)
Although voids are the most challenging cosmic environment for the study of cosmic magnetism due to the drop of all emission mechanisms there, they constitute the
environment where the largest differences between the various models is expected. Our simulations show extremes ranging from (primordial models) to . The first limit follows from the constraints from CMB analysis (Kahniashvili et al., 2010; Planck Collaboration, Ade, Aghanim, Arnaud, Arroja,
Ashdown, Aumont, Baccigalupi, Ballardini, Banday and et al., 2016)666The analysis of higher-order statistics in the PLANCK data has been used to infer even lower limits, , even if these estimates are more uncertain (Trivedi et al., 2014)., while the lower limit is consistent with that derived from the spectra of high-z blazar sources (e.g. Neronov and Vovk, 2010; Arlen et al., 2014; Caprini and Gabici, 2015). 777See however Broderick et al. (2012) for a different interpretation of these results.
Several interesting high-energy phenomena may offer clues about magnetic fields on cosmological scales, dominated by voids and hardly affected by the details of galaxy formation.
3.4.1 Ultra-high Energy Cosmic Rays (UHECR)
Cosmic rays with energies are thought to have a predominantly extra-galactic origin. Their propagation towards Earth should be deflected by the Lorentz force of intervening magnetic fields. (e.g. Sigl et al., 2003; Dolag et al., 2005). Large deflection angles might hamper the possibility of locating the real sources of UHECRs at the highest energies, which is one of the main unknowns in this field of research (e.g. Biermann et al., 2016), but the deflections quoted in the literature greatly vary depending on the numerical methods and seeding models, ranging from to (e.g. Dolag et al., 2005; Berezinsky, 2014; Alves Batista and Sigl, 2014). With recent work (Hackstein et al., 2016) we studied the propagation of UHECRs in ENZO-MHD simulations with the CRPropa3 code (Alves Batista et al., 2016), finding that the observed level of isotropy of UHECR events (Abbasi et al., 2016) can be used to limit the magnetic field in voids, which must be (Hackstein et al., 2017). However, for lower magnetic fields the differences in the spectrum and in the spatial distribution of UHECRs between primordial and astrophysical seeding models are hard to tell.
Here, we present a more recent analysis based on three resimulations of the (85 Mpc)3 simulation, which have a better resolution and subgrid physics compared to our previous work. In detail, we used CRPropa3 to inject iron particles with random momentum in the energy range, and we integrated their propagation until they were observed by 10 observers (located at the centre of halos, randomly chosen in the box). The evolution of the trajectory of each cosmic ray included the deflection by the Lorentz force of magnetic fields, energy losses, nuclear decay and photo-disintegration into secondary particles, and we assumed period boundary conditions in the computational volume. Since the distribution of the sources of UHECRs is unknown, as in Hackstein et al. (2016) we bracketed uncertainties with two injection scenarios: a random distribution of sources or a scenario in which the probability of any cell to inject a cosmic ray is an increasing function of the gas density, i.e. UHECRs are preferentially originate from within large-scale structures. Here we present the results only for the latter scenario, noting we did not find large differences between the two. The above recipes were applied to three representative cases of the Chronos++ suite: the simplest primordial model, a dynamo model and a model with seeding from star winds (with the largest efficiency).
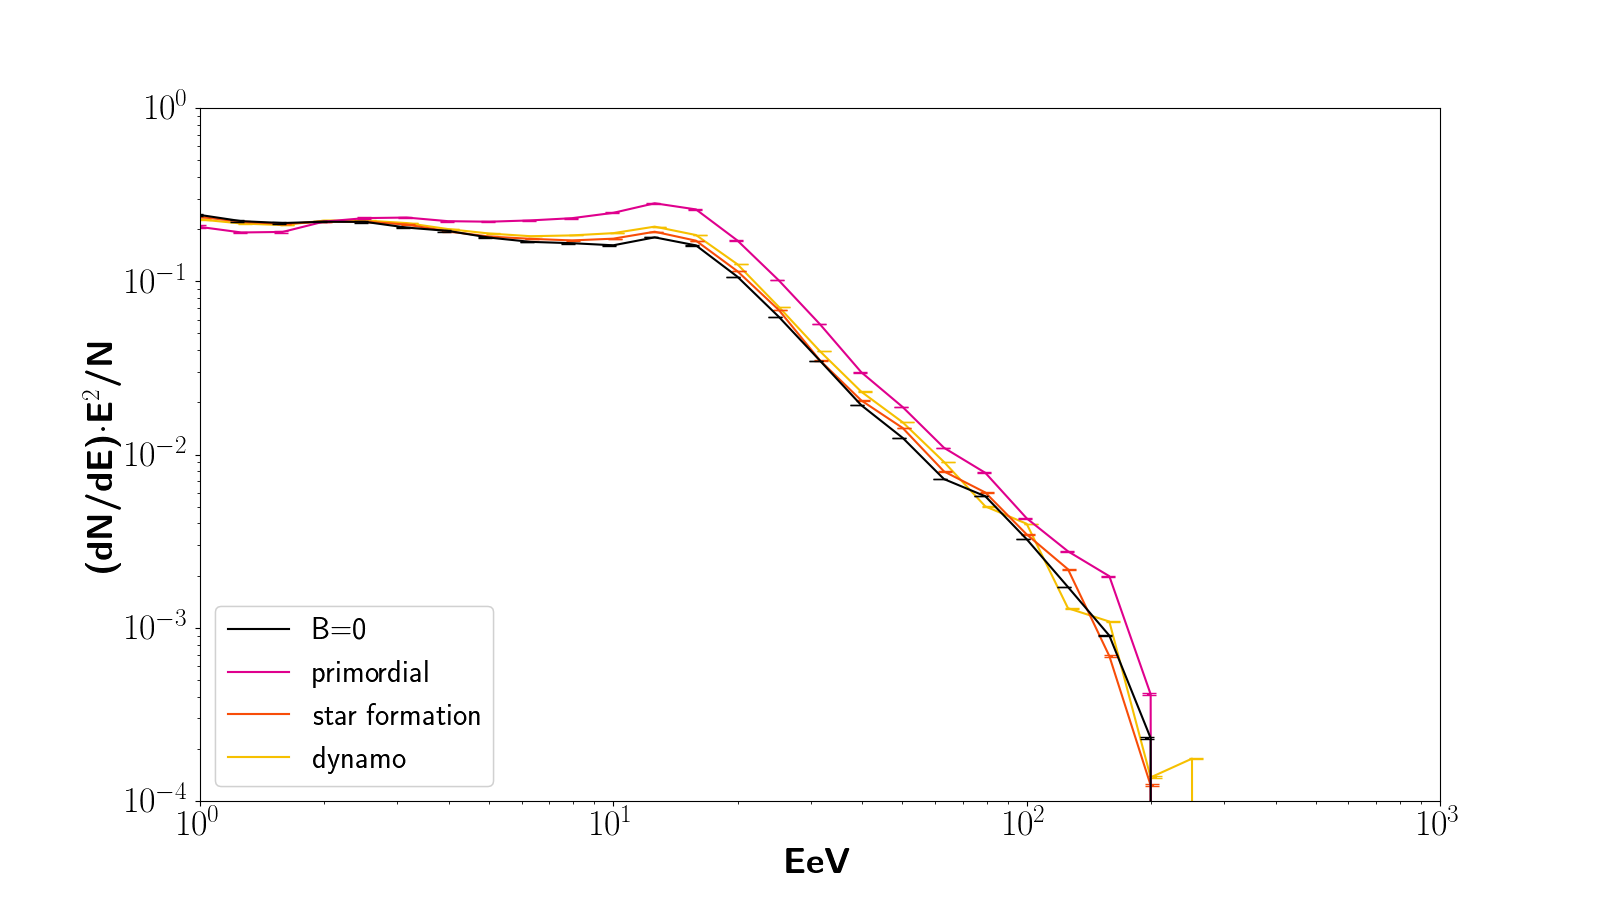
The left panel of Fig. 13 shows the arrival spectrum for each model, averaged over our 10 random observers. Within the error bars set by cosmic variance and number statistics of our simulations, we measure no significant difference in the received energy spectra of particles across most of the energy range, also when comparing with the control case without magnetic fields (i.e. the UHECRs only propagate in a ballistic way). Minor differences are found in the very high energy regime (a few ), where the primordial model have slightly flatter spectrum, which stems from the enhanced capture of high-energy cosmic rays around observers, whose halos are typically more magnetized than in the other scenarios. However, the difference will be hard to tell with any new observation, because the number statistics of these events is extremely small, i.e less than .
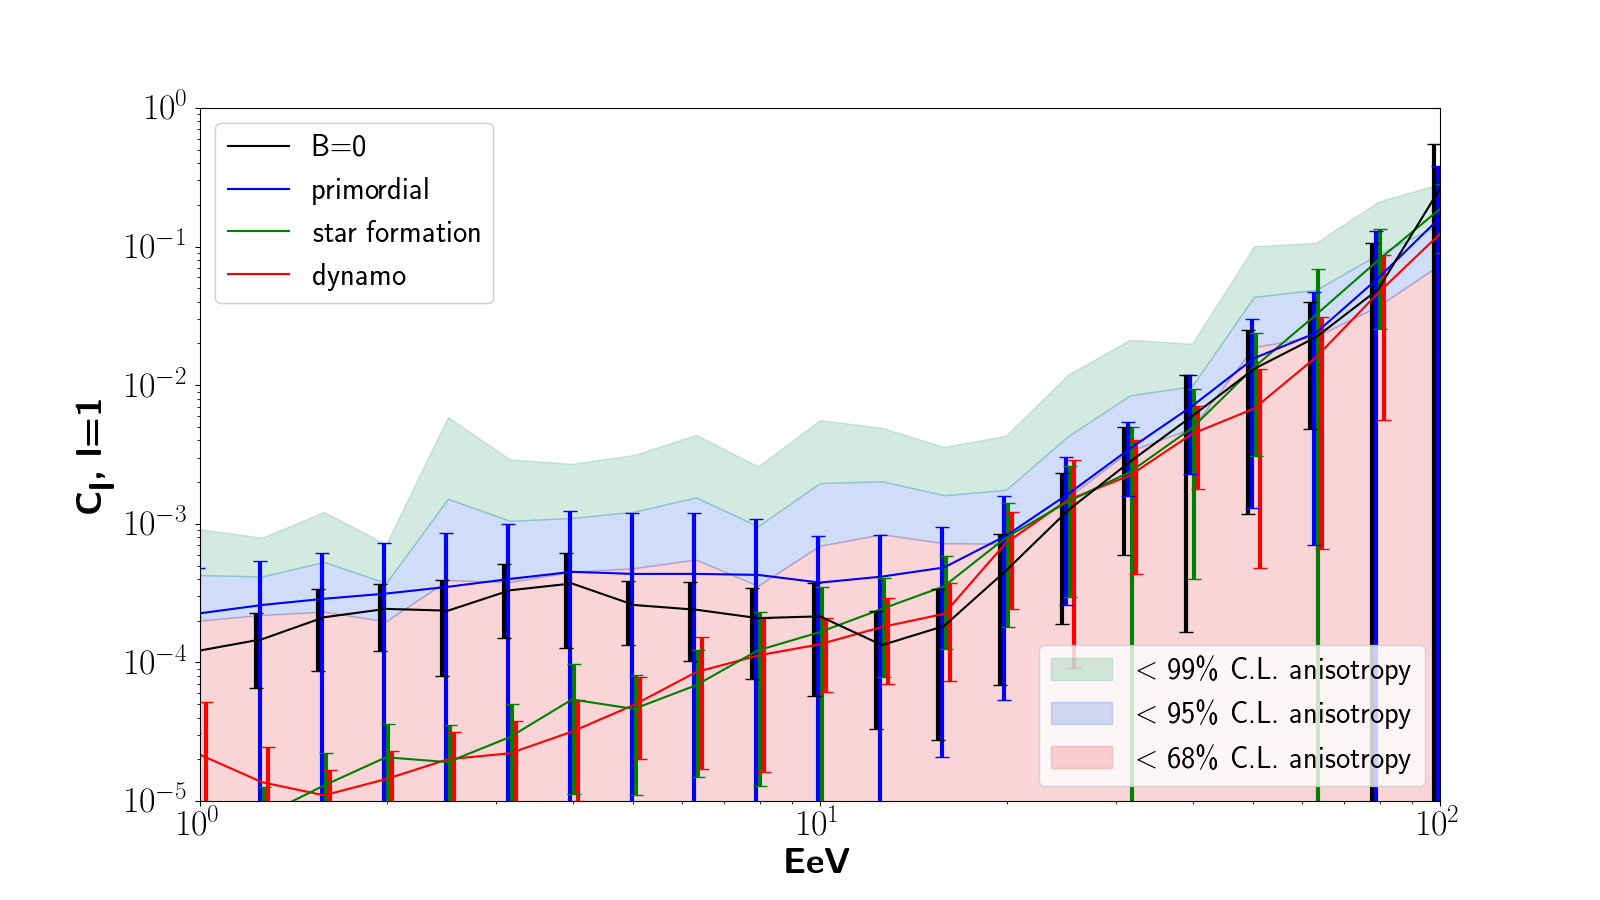
For each model and observer we also generated full-sky maps of events and computed the spherical harmonics (we refer the reader to Hackstein et al. 2016 for the details on the procedure) to look for signatures of anisotropies at different energies. The angular spectra have been averaged over observers, and compared to the case with an isotropic distribution of sources. The right panel of Fig. 13 shows the amplitude of the dipole ( harmonic) moment as a function of the arrival energy of UHECRs. Again, the largest departure from isotropy is observed for the primordial run, whose signal is everywhere higher (at ) than the amplitude observed in the dynamo or astrophysical models. The effect is maximal at the lowest energies, events, highlighting the possibility of a higher deflection of UHECRs around structures closer to the observer. These results are explained by the typically larger magnetic fields found close to the observers () in the astrophysical scenario (and partly in the dynamo one) that lead to a more isotropic distribution. Moreover, the larger fields typically found on Mpc scales in the primordial scenarios may impose significant anisotropies on scales. However, the amplitude of this effect is still compatible at with random Poisson variance of an isotropic distribution of events of the baseline model, and is also within the present low bounds on the anisotropy observed with the Auger Telescope (Abbasi et al., 2016) 888At a later submission stage of this work, The Pierre Auger Collaboration et al. (2017) reported the detection of a significant anisotropy in the dipole distribution of UHECRs observed by Auger at . Such a large anisotropy is hard to reconcile with any of our models, and it might be explained by a significantly dipolar distribution of sources, as we discuss in detail in Hackstein et al. (2017).. In summary, although we observe some minimal differences in the arrival spectra and angular distribution of UHECRs for different magnetization models, these differences are smaller than the effects caused by the distribution of sources of UHECRs, and by the scatter among different observers. The latter can be mitigated by resorting to constrained simulations of the Local Universe (Hackstein et al., 2017).
3.4.2 Fast radio bursts
Fast Radio Bursts (FRBs) can be used to probe extragalactic magnetic fields across cosmological distances. So far, only a few dozen FRBs have been detected (Petroff et al., 2016), and the dispersion measure of their emission, defined as:
| (3) |
(where is the redshift where the source is located) can give precious information on the intervening electron density along the line of sight, . In principle, the simultaneous detection of RM and for the same FRBs would allow deriving the properties of the intergalactic matter and of magnetic fields along the line of sight, over cosmological distances (e.g. Akahori et al., 2014; Dolag et al., 2015). However, so far it has been possible to detect RM only for a very few FRBs, also with unexpectedly low measurements (Petroff et al., 2017). However, the situation is expected to improve thanks to ongoing (Keane et al., 2017) or future (e.g. Trott et al., 2013, see also ALERT survey with Aperitif) radio surveys dedicated to detecting FRBs, with a few expected detections per day. Compared to the standard analysis of RM from polarized radio galaxies, FRB may allow to probe lower values of RM, given their larger brightness flux at , which should allow to probe the rotation of their polarization angle with a typically higher accuracy.
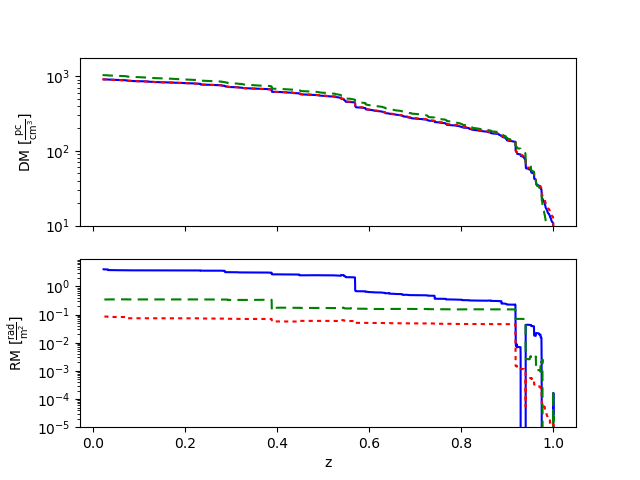
The largest boxes in the Chronos++ suite can test how different models for magnetogenesis can affect the signal from FRBs at cosmological distances. In Fig. 14, we show the progression of dispersion measure and RM for a FRBs assumed to shine at and to be observed at , in our three resimulations of the volume. Here we considered a random line of sight, obtained by pasting together 17 beams of one cell thickness crossing our volume at random positions and at different simulated redshifts; the combination of lines is exactly the same in the three resimulations, hence the observed differences in dispersion measure and RM are solely due to the different prescriptions for gas physics and magnetic fields. While the dispersion measure is only affected by gas physics in a minor way (due to the presence of denser clumps in the low-power AGN model), the observed trend of RM are hugely dependent on the assumed magnetic field model, with a difference up to a factor in the final RM signal, when the primordial model (blue) or the high-power AGN model are compared. A large fraction of the RM signal from such a large integration volume comes from filaments and medium overdensity structures, in which cases the discrepancy among models is in RM (see Fig. 12). In general, the integration up to large redshift may even increase the differences seen at low-z, due to the fact that the seeding from AGN could only magnetize a smaller fraction of the cosmic volume at earlier redshift. Different magnetogenesis models may produce differences in the RM but not in dispersion measure, and therefore the use of the dispersion measure-RM relation from observations (e.g. Akahori et al., 2016) must be calibrated for different magnetic models before making claims about extragalactic magnetic fields. More work on the use of FRBs to study extragalactic magnetic fields is in preparation (Hinz et al., in preparation).
3.4.3 Blazar emission and Axionlike particles
The magnetic fields in voids are key to understand the unexpected emission properties of blazars at high redshifts. The high-energy, emission from AGN is attenuated due to the interaction of -rays with photons of the extragalactic background light. The produced pairs can inverse-Compton (IC) scatter photons of the CMB and of the extragalactic background light and induce an electromagnetic cascade (Aharonian et al., 1994), where the pairs are deflected in external magnetic fields (e.g. Dai et al., 2002; Neronov and Vovk, 2010; Taylor et al., 2011). The lack of detected IC cascade component at GeV energies is probing the magnetic fields in the intervening cosmic volume (mostly dominated by voids) and/or the filling factor of magnetic fields along the line of sight. From this effect, lower limits of on scales have been derived (Dolag et al., 2009; Neronov and Vovk, 2010; Dolag et al., 2011; Arlen et al., 2014; Caprini and Gabici, 2015; Chen et al., 2015) The Cherenkov Telescope Array (CTA) will have the potential to further limit large-scale magnetic fields through this effect (Sol et al., 2013; Meyer et al., 2016).
Finally, the presence of significant large-scale magnetic fields has been suggested as a possible explanation for the puzzling lack of infrared absorption in the observed spectra of distant blazars (e.g. Tavecchio et al., 2012; Horns et al., 2012). Axion-like particles (ALPs) are promising candidate for DM (Raffelt and Stodolsky, 1988; Csáki et al., 2003) and they can oscillate into high-energy photons (and back) in the presence of background magnetic fields. According to standard theory, -ray photons emitted by blazars must be attenuated due to the production of pairs while interacting with the cosmic infrared background. However, this opacity may be reduced if -ray photons propagate in external magnetic fields and therewhile oscillate into ALPs. Only a fraction of them is finally transformed back into photons near the observers. The first study of ALP oscillations used analytical prescriptions for the magnetic field distributions in galaxy clusters and voids (Horns et al., 2012). In recent work based on the primordial run of the Chronos++ suite, we simulated the propagation of photons from redshift and computed the expected conversion into ALPs (Montanino et al., 2017). This analysis showed that photons-ALPs oscillations are possible for lines of sight crossing structures with on scales of a few . Compared to a more idealized Gaussian distribution of extragalactic magnetic fields, the photons-ALPs conversions is found to cause a significant spectral hardening for emitted photons in the energy range, and this effect can be measured with the upcoming CTA (Montanino et al., 2017). If confirmed, this could be a powerful tool to perform a tomography of the magnetized cosmic web with ALPs, and to constrain the still larger range of parameters describing the mass and the coupling strength of these particles (Meyer and Conrad, 2014). With future work, we plan to extend the analysis to competing mechanism for the seeding of large-scale fields, with the goal of assessing whether this effect vanishes for astrophysical scenarios of magnetic fields (Montanino et al., in preparation).
4 Conclusions
In this work we introduced a dedicated suite of cosmological magneto-hydrodynamical simulations with the ENZO code, that can be used to predict the evolution and present-day distribution of extragalactic magnetic fields, and also to assess the observable signatures associated to each of them.
In general, we find that if the present day magnetic fields observed in galaxies and clusters/groups of galaxies have a primordial origin from magnetic fields, the magnetization in voids and in most filaments will always be larger than in any other scenario. Magnetic fields as large as may be found on large scales within filaments and in cluster outskirts only if the dynamo from injected solenoidal turbulence (which is still a small fraction of random kinetic energy in simulated large-scale structures) is efficient enough, with conversion efficiencies between random kinetic and magnetic energy of a few percent. Conversely, if the origin of magnetic fields is only ascribed to magnetized outflows powered by star formation winds and/or AGN, we expect a sharp drop in magnetization outside the virial radius of halos, and orders of magnitude lower magnetic fields in voids and in most of the volume of filaments.
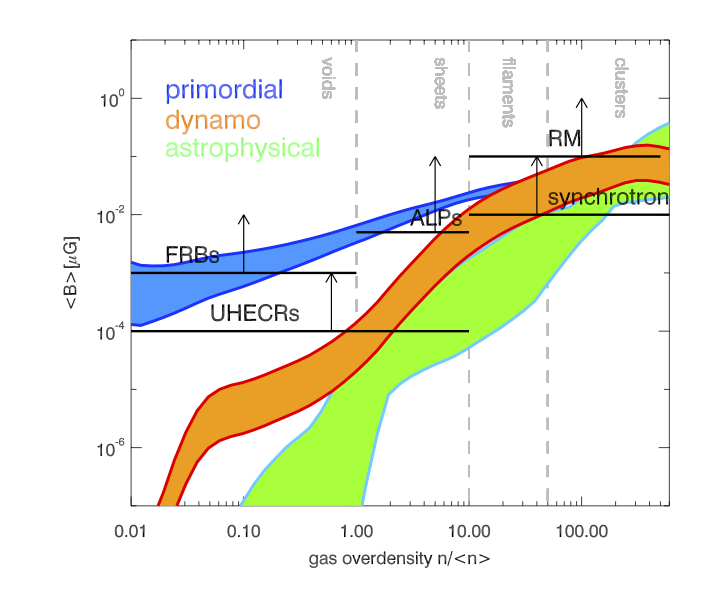
Fig. 15 gives a schematic overview of the range of uncertainties in the different seeding modes (the width of every group of models bracket the range of median in the () relation of Sec. 3.1), as well as of the approximate overdensity and magnetic fields to which the observational probes is sensitive to.
Hence, we predict for the observational signatures of different models:
-
•
synchrotron emission from shock-accelerated electrons: little to no emission should be detectable if fields were only injected by galaxy formation processes, except in the close proximity ( of active galaxies). The largest chances of detection (feasible in the ongoing low-frequency radio surveys with LOFAR, MWA, SKA-LOW) are for primordial scenarios starting from . Present uncertainties in the details of shock-acceleration and in the role of shock obliquity in accelerating particles may make the above picture more uncertain.
-
•
Faraday Rotation: the differences between extreme models (e.g. high primordial scenarios vs astrophysical ones) can be detectable already at the periphery of clusters () where we expect differences of order in the average RM of sources. A few tens of polarized background sources need to be observed for a few clusters before allowing a clear distinction of models; this should be feasible by the polarization survey planned for the SKA-MID.
-
•
Propagation of UHECRs: the largest signatures are expected for primordial models starting from fields, and should result in a larger UHECR anisotropy and in a flatter spectrum of particles . However, in reality the uncertainties in the UHECRs’ sources, as well as their composition will swamp all information about cosmic magnetogenesis.
-
•
Fast radio bursts: we observe very significant (factor ) differences in the Rotation Measure of FRBs at when primordial and astrophysical models are compared. Most of the difference is produced by the integrated effect of voids, sheets and filaments. In combination with the dispersion measure of the burst, one can probe cosmological magnetic fields. While the number of FRBs with a known redshift as well as RM and dispersion measure is still too small, future surveys (e.g. ”Alert” with Aperitif) will change this.
-
•
Other high-energy probes: the conversion of -ray photons into ALPs as well as the production of an Inverse Compton Cascade around high-z blazars is expected to be maximal for primordial fields, owing to their enhanced efficiency in magnetizing voids.
-
•
The synergy between different observational techniques will be fundamental to remove the degeneracy between models: for example, while we expect a similar level of radio emission in primordial models starting from and in models where the magnetization of filaments comes from an efficient dynamo, the Faraday Rotation signal is expected to be larger and more structured in the second case. Likewise, the systematic non-detection of Inverse Compton Cascade halos around blazars and of IR absorption hinting at ALPs oscillations may be used to constrain magnetic fields on scales.
In summary, we have presented an analysis of the impact of different models for the origin of extragalactic magnetic fields. By coupling the evolution of galaxies and large-scale structures to the evolution of cosmic magnetism, we can enable different observational techniques to put competing scenarios of magnetogenesis to the test. In most scenarios, the periphery of clusters and cosmic filaments are the most interesting places where competing models can be tested.
Given the planned capabilities of future radio surveys (most notably the ones that the Square Kilometer Array should deliver), the most promising observational window into cosmic magnetogenesis is radio astronomy, in particular through the combination of observed synchrotron emission on large scales () and deep polarization observations, able to measure the Faraday Rotation from sources probing the dilute gas in filaments and clusters outskirts. In voids, the high-energy sources at cosmological distances may constrain the residual magnetization from primordial seed fields. In all plausible scenarios, observations will need to be flanked by simulations in order to make statements about the origin of cosmic magnetism.
Acknowledgments
The cosmological simulations described in this work were performed using the ENZO code (http://enzo-project.org), which is the product of a collaborative effort of scientists at many universities and national laboratories. We gratefully acknowledge the ENZO development group for providing extremely helpful and well-maintained on-line documentation and tutorials.
The computations presented in this work were mostly produced on Piz Daint (ETHZ-CSCS, Lugano) under allocations s585 and s701, and in small part at Juelich Supercomputing Centre (JSC), under projects no. 11823, 10755 and 9016. F.V. acknowledges financial support from the grant VA 876-3/1 by DFG, from the European Union’s Horizon 2020 research and innovation programme under the Marie-Sklodowska-Curie grant agreement no.664931, and from the ERC Starting Grant ”MAGCOW”, no.714196. SH acknowledges support by the Deutsche Forschungsgemeinschaft (DFG) through grant BR 2026/25. DW acknowledges support by the DFG through grants SFB 676 and BR 2026/17. We gratefully acknowledge A. Bonafede, G. Brunetti, D. Montanino, A. Mirizzi , M. Viel, C. Ferrari at T. Jones for ongoing collaborations and useful feedback on the several lines of research relevant for this work.
References
- (1)
- Abbasi et al. (2016) Abbasi R U, Abe M, Abu-Zayyad T, Allen M, Azuma R, Barcikowski E, Belz J W, Bergman D R, Blake S A, Cady R, Cheon B G, Chiba J, Chikawa M, Cho W R, Fujii T, Fukushima M, Goto T, Hanlon W, Hayashi Y, Hayashida N, Hibino K, Honda K, Ikeda D, Inoue N, Ishii T, Ishimori R, Ito H, Ivanov D, Jui C C H, Kadota K, Kakimoto F, Kalashev O, Kasahara K, Kawai H, Kawakami S, Kawana S, Kawata K, Kido E, Kim H B, Kim J H, Kim J H, Kitamura S, Kitamura Y, Kuzmin V, Kwon Y J, Lan J, Lundquist J P, Machida K, Martens K, Matsuda T, Matsuyama T, Matthews J N, Minamino M, Mukai Y, Myers I, Nagasawa K, Nagataki S, Nakamura T, Nonaka T, Nozato A, Ogio S, Ogura J, Ohnishi M, Ohoka H, Oki K, Okuda T, Ono M, Oshima A, Ozawa S, Park I H, Pshirkov M S, Rodriguez D C, Rubtsov G, Ryu D, Sagawa H, Sakurai N, Scott L M, Shah P D, Shibata F, Shibata T, Shimodaira H, Shin B K, Shin H S, Smith J D, Sokolsky P, Springer R W, Stokes B T, Stratton S R, Stroman T A, Suzawa T, Takamura M, Takeda M, Takeishi R, Taketa A, Takita M, Tameda Y, Tanaka H, Tanaka K, Tanaka M, Thomas S B, Thomson G B, Tinyakov P, Tkachev I, Tokuno H, Tomida T, Troitsky S, Tsunesada Y, Tsutsumi K, Uchihori Y, Udo S, Urban F, Vasiloff G, Wong T, Yamane R, Yamaoka H, Yamazaki K, Yang J, Yashiro K, Yoneda Y, Yoshida S, Yoshii H, Zollinger R and Zundel Z 2016 Astroparticle Physics 80, 131–140.
- Aharonian et al. (1994) Aharonian F A, Coppi P S and Voelk H J 1994 ApJL 423, L5–L8.
- Akahori et al. (2014) Akahori T, Gaensler B M and Ryu D 2014 ApJ 790, 123.
- Akahori et al. (2016) Akahori T, Ryu D and Gaensler B M 2016 ApJ 824, 105.
- Akamatsu et al. (2017) Akamatsu H, Fujita Y, Akahori T, Ishisaki Y, Hayashida K, Hoshino A, Mernier F, Yoshikawa K, Sato K and Kaastra J S 2017 ArXiv e-prints .
- Alpaslan et al. (2014) Alpaslan M, Robotham A S G, Driver S, Norberg P, Baldry I, Bauer A E, Bland-Hawthorn J, Brown M, Cluver M, Colless M, Foster C, Hopkins A, Van Kampen E, Kelvin L, Lara-Lopez M A, Liske J, Lopez-Sanchez A R, Loveday J, McNaught-Roberts T, Merson A and Pimbblet K 2014 MNRAS 438, 177–194.
- Alves Batista et al. (2016) Alves Batista R, Dundovic A, Erdmann M, Kampert K H, Kuempel D, Müller G, Sigl G, van Vliet A, Walz D and Winchen T 2016 Journal of Cosmology and Astroparticle Physics 5, 038.
- Alves Batista and Sigl (2014) Alves Batista R and Sigl G 2014 Journal of Cosmology and Astroparticle Physics 11, 031.
- Arlen et al. (2014) Arlen T C, Vassilev V V, Weisgarber T, Wakely S P and Yusef Shafi S 2014 ApJ 796, 18.
- Beck et al. (2013) Beck A M, Hanasz M, Lesch H, Remus R S and Stasyszyn F A 2013 MNRAS 429, L60–L64.
- Beck et al. (2012) Beck A M, Lesch H, Dolag K, Kotarba H, Geng A and Stasyszyn F A 2012 MNRAS 422, 2152–2163.
- Beresnyak and Miniati (2016) Beresnyak A and Miniati F 2016 ApJ 817, 127.
- Berezinsky (2014) Berezinsky V 2014 Astroparticle Physics 53, 120–129.
- Bertone et al. (2006) Bertone S, Vogt C and Enßlin T 2006 MNRAS 370, 319–330.
- Biermann et al. (2016) Biermann P L, Caramete L I, Fraschetti F, Gergely L A, Harms B C, Kun E, Lundquist J P, Meli A, Nath B B, Seo E S, Stanev T and Becker Tjus J 2016 ArXiv e-prints .
- Biernacki et al. (2017) Biernacki P, Teyssier R and Bleuler A 2017 MNRAS 469, 295–313.
- Blasi et al. (1999) Blasi P, Burles S and Olinto A V 1999 ApJL 514, L79–L82.
- Böhringer et al. (2016) Böhringer H, Chon G and Kronberg P P 2016 A & A 596, A22.
- Bonafede et al. (2012) Bonafede A, Brüggen M, van Weeren R, Vazza F, Giovannini G, Ebeling H, Edge A C, Hoeft M and Klein U 2012 MNRAS 426, 40–56.
- Bonafede et al. (2011) Bonafede A, Dolag K, Stasyszyn F, Murante G and Borgani S 2011 ArXiv e-prints .
- Bonafede et al. (2010) Bonafede A, Feretti L, Murgia M, Govoni F, Giovannini G, Dallacasa D, Dolag K and Taylor G B 2010 A & A 513, A30+.
- Bonafede et al. (2015a) Bonafede A, Vazza F, Brüggen M, Akahori T, Carretti E, Colafrancesco S, Feretti L, Ferrari C, Giovannini G, Govoni F, Johnston-Hollitt M, Murgia M, Scaife A, Vacca V, Govoni F, Rudnick L and Scaife A 2015a Advancing Astrophysics with the Square Kilometre Array (AASKA14) p. 95.
- Bonafede et al. (2015b) Bonafede A, Vazza F, Brüggen M, Akahori T, Carretti E, Colafrancesco S, Feretti L, Ferrari C, Giovannini G, Govoni F, Johnston-Hollitt M, Murgia M, Scaife A, Vacca V, Govoni F, Rudnick L and Scaife A 2015b Advancing Astrophysics with the Square Kilometre Array (AASKA14) p. 95.
- Bonafede et al. (2013) Bonafede A, Vazza F, Brüggen M, Murgia M, Govoni F, Feretti L, Giovannini G and Ogrean G 2013 MNRAS 433, 3208–3226.
- Bourne and Sijacki (2017) Bourne M A and Sijacki D 2017 ArXiv e-prints .
- Broderick et al. (2012) Broderick A E, Chang P and Pfrommer C 2012 ApJ 752, 22.
- Brown (2011) Brown S D 2011 Journal of Astrophysics and Astronomy 32, 577–584.
- Brown et al. (2017) Brown S, Vernstrom T, Carretti E, Dolag K, Gaensler B M, Staveley-Smith L, Bernardi G, Haverkorn M, Kesteven M and Poppi S 2017 MNRAS 468, 4246–4253.
- Brüggen et al. (2011) Brüggen M, Bykov A, Ryu D and Röttgering H 2011 Science & Space Review pp. 71–+.
- Brüggen et al. (2005) Brüggen M, Ruszkowski M, Simionescu A, Hoeft M and Dalla Vecchia C 2005 ApJL 631, L21–L24.
- Brunetti et al. (2001) Brunetti G, Setti G, Feretti L and Giovannini G 2001 MNRAS 320, 365–378.
- Bryan et al. (2014) Bryan G L, Norman M L, O’Shea B W, Abel T, Wise J H, Turk M J, Reynolds D R, Collins D C, Wang P, Skillman S W, Smith B, Harkness R P, Bordner J, Kim J h, Kuhlen M, Xu H, Goldbaum N, Hummels C, Kritsuk A G, Tasker E, Skory S, Simpson C M, Hahn O, Oishi J S, So G C, Zhao F, Cen R, Li Y and Enzo Collaboration 2014 ApJS 211, 19.
- Campanelli (2009) Campanelli L 2009 International Journal of Modern Physics D 18, 1395–1411.
- Caprini and Gabici (2015) Caprini C and Gabici S 2015 Physical Review Letters 91(12), 123514.
- Carilli and Taylor (2002) Carilli C L and Taylor G B 2002 ARAA 40, 319–348.
- Cassano and Brunetti (2005) Cassano R and Brunetti G 2005 MNRAS 357, 1313–1329.
- Cautun et al. (2014) Cautun M, van de Weygaert R, Jones B J T and Frenk C S 2014 MNRAS 441, 2923–2973.
- Chen et al. (2015) Chen W, Buckley J H and Ferrer F 2015 Physical Review Letters 115(21), 211103.
- Chernin (1967) Chernin A D 1967 Sov. Astronom. 10, 634.
- Cho (2014) Cho J 2014 ApJ 797, 133.
- Condon et al. (1998) Condon J J, Cotton W D, Greisen E W, Yin Q F, Perley R A, Taylor G B and Broderick J J 1998 ApJ 115, 1693–1716.
- Csáki et al. (2003) Csáki C, Kaloper N, Peloso M and Terning J 2003 Journal of Cosmology and Astroparticle Physics 5, 005.
- Dai et al. (2002) Dai Z G, Zhang B, Gou L J, Mészáros P and Waxman E 2002 ApJL 580, L7–L10.
- de Gasperin et al. (2014) de Gasperin F, van Weeren R J, Brüggen M, Vazza F, Bonafede A and Intema H T 2014 MNRAS 444, 3130–3138.
- Dedner et al. (2002) Dedner A, Kemm F, Kröner D, Munz C D, Schnitzer T and Wesenberg M 2002 Journal of Computational Physics 175, 645–673.
- Dolag et al. (1999) Dolag K, Bartelmann M and Lesch H 1999 A & A 348, 351–363.
- Dolag et al. (2015) Dolag K, Gaensler B M, Beck A M and Beck M C 2015 MNRAS 451, 4277–4289.
- Dolag et al. (2005) Dolag K, Grasso D, Springel V and Tkachev I 2005 Journal of Cosmology and Astroparticle Physics 1, 9.
- Dolag et al. (2009) Dolag K, Kachelrieß M, Ostapchenko S and Tomàs R 2009 ApJ 703, 1078–1085.
- Dolag et al. (2011) Dolag K, Kachelriess M, Ostapchenko S and Tomàs R 2011 ApJL 727, L4.
- Dolag et al. (2017) Dolag K, Mevius E and Remus R S 2017 Galaxies 5, 35.
- Dolag et al. (2001) Dolag K, Schindler S, Govoni F and Feretti L 2001 A & A 378, 777–786.
- Donnert et al. (2009) Donnert J, Dolag K, Lesch H and Müller E 2009 MNRAS 392, 1008–1021.
- Dorfi and Breitschwerdt (2012) Dorfi E A and Breitschwerdt D 2012 A & A 540, A77.
- Dubois et al. (2016) Dubois Y, Peirani S, Pichon C, Devriendt J, Gavazzi R, Welker C and Volonteri M 2016 MNRAS 463, 3948–3964.
- Dubois and Teyssier (2008) Dubois Y and Teyssier R 2008 A & A 482, L13–L16.
- Durrer and Neronov (2013) Durrer R and Neronov A 2013 The Astronomy and Astrophysics Review 21, 62.
- Eckert et al. (2015) Eckert D, Jauzac M, Shan H, Kneib J P, Erben T, Israel H, Jullo E, Klein M, Massey R, Richard J and Tchernin C 2015 Nature 528, 105–107.
- Eckmiller et al. (2011) Eckmiller H J, Hudson D S and Reiprich T H 2011 A & A 535, A105.
- Farnsworth et al. (2013) Farnsworth D, Rudnick L, Brown S and Brunetti G 2013 ApJ 779, 189.
- Federrath et al. (2014) Federrath C, Schober J, Bovino S and Schleicher D R G 2014 ApJL 797, L19.
- Federrath et al. (2011) Federrath C, Sur S, Schleicher D R G, Banerjee R and Klessen R S 2011 ApJ 731, 62.
- Feretti et al. (2012) Feretti L, Giovannini G, Govoni F and Murgia M 2012 The Astronomy and Astrophysics Review 20, 54.
- Ferrari et al. (2008) Ferrari C, Govoni F, Schindler S, Bykov A M and Rephaeli Y 2008 Science & Space Review 134, 93–118.
- Furlanetto and Loeb (2001) Furlanetto S R and Loeb A 2001 ApJ 556, 619–634.
- Genel et al. (2014) Genel S, Vogelsberger M, Springel V, Sijacki D, Nelson D, Snyder G, Rodriguez-Gomez V, Torrey P and Hernquist L 2014 MNRAS 445, 175–200.
- Gheller et al. (2016) Gheller C, Vazza F, Brüggen M, Alpaslan M, Holwerda B W, Hopkins A M and Liske J 2016 MNRAS 462, 448–463.
- Gheller et al. (2015) Gheller C, Vazza F, Favre J and Brüggen M 2015 MNRAS 453, 1164–1185.
- Giovannini et al. (2010) Giovannini G, Bonafede A, Feretti L, Govoni F and Murgia M 2010 A & A 511, L5.
- Govoni et al. (2015) Govoni F, Murgia M, Xu H, Li H, Norman M, Feretti L, Giovannini G, Vacca V, Bernardi G, Bonafede A, Brunetti G, Carretti E, Colafrancesco S, Donnert J, Ferrari C, Gitti M, Iapichino L, Johnston-Hollitt M, Pizzo R and Rudnick L 2015 Advancing Astrophysics with the Square Kilometre Array (AASKA14) p. 105.
- Govoni et al. (2013) Govoni F, Murgia M, Xu H, Li H, Norman M L, Feretti L, Giovannini G and Vacca V 2013 A & A 554, A102.
- Grete et al. (2016) Grete P, Vlaykov D G, Schmidt W and Schleicher D R G 2016 Physics of Plasmas 23(6), 062317.
- Guidetti et al. (2008) Guidetti D, Murgia M, Govoni F, Parma P, Gregorini L, de Ruiter H R, Cameron R A and Fanti R 2008 A & A 483, 699–713.
- Guo et al. (2014a) Guo X, Sironi L and Narayan R 2014a ApJ 794, 153.
- Guo et al. (2014b) Guo X, Sironi L and Narayan R 2014b ApJ 797, 47.
- Hackstein et al. (2016) Hackstein S, Vazza F, Brüggen M, Sigl G and Dundovic A 2016 MNRAS 462, 3660–3671.
- Hackstein et al. (2017) Hackstein S, Vazza F, Brüggen M, Sorce J G and Gottlöber S 2017 ArXiv e-prints .
- Harrison (1973) Harrison E R 1973 MNRAS 165, 185.
- Hoeft and Brüggen (2007) Hoeft M and Brüggen M 2007 MNRAS 375, 77–91.
- Hopkins and Raives (2016) Hopkins P F and Raives M J 2016 MNRAS 455, 51–88.
- Hopkins et al. (2017) Hopkins P F, Wetzel A, Keres D, Faucher-Giguere C A, Quataert E, Boylan-Kolchin M, Murray N, Hayward C C and El-Badry K 2017 ArXiv e-prints .
- Horns et al. (2012) Horns D, Maccione L, Meyer M, Mirizzi A, Montanino D and Roncadelli M 2012 Physical Review Letters 86(7), 075024.
- Johnston-Hollitt et al. (2015) Johnston-Hollitt M, Govoni F, Beck R, Dehghan S, Pratley L, Akahori T, Heald G, Agudo I, Bonafede A, Carretti E, Clarke T, Colafrancesco S, Ensslin T A, Feretti L, Gaensler B, Haverkorn M, Mao S A, Oppermann N, Rudnick L, Scaife A, Schnitzeler D, Stil J, Taylor A R and Vacca V 2015 Advancing Astrophysics with the Square Kilometre Array (AASKA14) p. 92.
- Jones et al. (2011) Jones T W, Porter D H, Ryu D and Cho J 2011 Memorie della Societá Astronomica Italiana 82, 588.
- Kahniashvili et al. (2016) Kahniashvili T, Brandenburg A and Tevzadze A G 2016 Physica Scripta 91(10), 104008.
- Kahniashvili et al. (2011) Kahniashvili T, Tevzadze A G and Ratra B 2011 ApJ 726, 78.
- Kahniashvili et al. (2010) Kahniashvili T, Tevzadze A G, Sethi S K, Pandey K and Ratra B 2010 Physical Review Letters 82(8), 083005.
- Kang et al. (2012) Kang H, Ryu D and Jones T W 2012 ApJ 756, 97.
- Keane et al. (2017) Keane E F, Barr E D, Jameson A, Morello V, Caleb M, Bhandari S, Petroff E, Possenti A, Burgay M, Tiburzi C, Bailes M, Bhat N D R, Burke-Spolaor S, Eatough R P, Flynn C, Jankowski F, Johnston S, Kramer M, Levin L, Ng C, van Straten W and Venkatraman Krishnan V 2017 ArXiv e-prints .
- Kennicutt (1998) Kennicutt, Jr. R C 1998 ApJ 498, 541–552.
- Kim et al. (2014) Kim J h, Abel T, Agertz O, Bryan G L, Ceverino D, Christensen C, Conroy C, Dekel A, Gnedin N Y, Goldbaum N J, Guedes J, Hahn O, Hobbs A, Hopkins P F, Hummels C B, Iannuzzi F, Keres D, Klypin A, Kravtsov A V, Krumholz M R, Kuhlen M, Leitner S N, Madau P, Mayer L, Moody C E, Nagamine K, Norman M L, Onorbe J, O’Shea B W, Pillepich A, Primack J R, Quinn T, Read J I, Robertson B E, Rocha M, Rudd D H, Shen S, Smith B D, Szalay A S, Teyssier R, Thompson R, Todoroki K, Turk M J, Wadsley J W, Wise J H, Zolotov A and AGORA Collaboration29 t 2014 ApJS 210, 14.
- Kim et al. (2011) Kim J h, Wise J H, Alvarez M A and Abel T 2011 ApJ 738, 54.
- Kravtsov (2003) Kravtsov A V 2003 ApJL 590, L1–L4.
- Kritsuk et al. (2011) Kritsuk A G, Nordlund Å, Collins D, Padoan P, Norman M L, Abel T, Banerjee R, Federrath C, Flock M, Lee D, Li P S, Müller W C, Teyssier R, Ustyugov S D, Vogel C and Xu H 2011 ApJ 737, 13.
- Kronberg et al. (1999) Kronberg P P, Lesch H and Hopp U 1999 ApJ 511, 56–64.
- Kulsrud et al. (1997) Kulsrud R M, Cen R, Ostriker J P and Ryu D 1997 ApJ 480, 481–491.
- Langer et al. (2005) Langer M, Aghanim N and Puget J L 2005 A & A 443, 367–372.
- Li et al. (2015) Li Y, Bryan G L, Ruszkowski M, Voit G M, O’Shea B W and Donahue M 2015 ApJ 811, 73.
- Madau and Dickinson (2014) Madau P and Dickinson M 2014 ARAA 52, 415–486.
- Marinacci et al. (2015) Marinacci F, Vogelsberger M, Mocz P and Pakmor R 2015 MNRAS 453, 3999–4019.
- Marinacci et al. (2017) Marinacci F, Vogelsberger M, Pakmor R, Torrey P, Springel V, Hernquist L, Nelson D, Weinberger R, Pillepich A, Naiman J and Genel S 2017 ArXiv e-prints .
- Masters et al. (2017) Masters A, Sulaiman A H, Stawarz Ł, Reville B, Sergis N, Fujimoto M, Burgess D, Coates A J and Dougherty M K 2017 ApJ 843, 147.
- Meyer and Conrad (2014) Meyer M and Conrad J 2014 Journal of Cosmology and Astroparticle Physics 12, 016.
- Meyer et al. (2016) Meyer M, Conrad J and Dickinson H 2016 ApJ 827, 147.
- Miniati and Bell (2011) Miniati F and Bell A R 2011 ApJ 729, 73.
- Miniati et al. (2001) Miniati F, Jones T W, Kang H and Ryu D 2001 ApJ 562, 233–253.
- Montanino et al. (2017) Montanino D, Vazza F, Mirizzi A and Viel M 2017 Physical Review Letters 119(10), 101101.
- Murgia et al. (2004) Murgia M, Govoni F, Feretti L, Giovannini G, Dallacasa D, Fanti R, Taylor G B and Dolag K 2004 A & A 424, 429–446.
- Neronov and Vovk (2010) Neronov A and Vovk I 2010 Science 328, 73–.
- Nicastro (2016) Nicastro F 2016 in ‘XMM-Newton: The Next Decade’ p. 27.
- Nuza et al. (2017) Nuza S E, Gelszinnis J, Hoeft M and Yepes G 2017 MNRAS 470, 240–263.
- Oka et al. (2006) Oka M, Terasawa T, Seki Y, Fujimoto M, Kasaba Y, Kojima H, Shinohara I, Matsui H, Matsumoto H, Saito Y and Mukai T 2006 Geophysical Research Letters 33, L24104.
- Pakmor et al. (2014) Pakmor R, Marinacci F and Springel V 2014 ApJL 783, L20.
- Petroff et al. (2016) Petroff E, Barr E D, Jameson A, Keane E F, Bailes M, Kramer M, Morello V, Tabbara D and van Straten W 2016 Publications of the Astronomical Society of Australia 33, e045.
- Petroff et al. (2017) Petroff E, Burke-Spolaor S, Keane E F, McLaughlin M A, Miller R, Andreoni I, Bailes M, Barr E D, Bernard S R, Bhandari S and et al. 2017 MNRAS 469, 4465–4482.
- Pinzke et al. (2013) Pinzke A, Oh S P and Pfrommer C 2013 MNRAS 435, 1061–1082.
- Planck Collaboration, Ade, Aghanim, Arnaud, Arroja, Ashdown, Aumont, Baccigalupi, Ballardini, Banday and et al. (2016) Planck Collaboration, Ade P A R, Aghanim N, Arnaud M, Arroja F, Ashdown M, Aumont J, Baccigalupi C, Ballardini M, Banday A J and et al. 2016 A & A 594, A19.
- Planck Collaboration et al. (2013) Planck Collaboration, Ade P A R, Aghanim N, Arnaud M, Ashdown M, Atrio-Barandela F, Aumont J, Baccigalupi C, Balbi A, Banday A J and et al. 2013 A & A 550, A134.
- Planck Collaboration, Ade, Aghanim, Arnaud, Ashdown, Aumont, Baccigalupi, Banday, Barreiro, Bartlett and et al. (2016) Planck Collaboration, Ade P A R, Aghanim N, Arnaud M, Ashdown M, Aumont J, Baccigalupi C, Banday A J, Barreiro R B, Bartlett J G and et al. 2016 A & A 594, A13.
- Planelles et al. (2016) Planelles S, Schleicher D R G and Bykov A M 2016 pp. 93–139.
- Porter et al. (2015) Porter D H, Jones T W and Ryu D 2015 ApJ 810, 93.
- Pshirkov et al. (2016) Pshirkov M S, Tinyakov P G and Urban F R 2016 Physical Review Letters 116(19), 191302.
- Raffelt and Stodolsky (1988) Raffelt G and Stodolsky L 1988 Physical Review Letters 37, 1237–1249.
- Reichert et al. (2011) Reichert A, Böhringer H, Fassbender R and Mühlegger M 2011 A & A 535, A4.
- Rieder and Teyssier (2016) Rieder M and Teyssier R 2016 MNRAS 457, 1722–1738.
- Rieder and Teyssier (2017) Rieder M and Teyssier R 2017 ArXiv e-prints .
- Riquelme and Spitkovsky (2011) Riquelme M A and Spitkovsky A 2011 ApJ 733, 63.
- Ruszkowski et al. (2011) Ruszkowski M, Lee D, Brüggen M, Parrish I and Oh S P 2011 ApJ 740, 81.
- Ryu et al. (2008) Ryu D, Kang H, Cho J and Das S 2008 Science 320, 909–.
- Ryu et al. (2003) Ryu D, Kang H, Hallman E and Jones T W 2003 ApJ 593, 599–610.
- Ryu et al. (2012) Ryu D, Schleicher D R G, Treumann R A, Tsagas C G and Widrow L M 2012 Science & Space Review 166, 1–35.
- Salem and Bryan (2014) Salem M and Bryan G L 2014 MNRAS 437, 3312–3330.
- Samui et al. (2017) Samui S, Subramanian K and Srianand R 2017 ArXiv e-prints .
- Scannapieco et al. (2012) Scannapieco C, Wadepuhl M, Parry O H, Navarro J F, Jenkins A, Springel V, Teyssier R, Carlson E, Couchman H M P, Crain R A, Dalla Vecchia C, Frenk C S, Kobayashi C, Monaco P, Murante G, Okamoto T, Quinn T, Schaye J, Stinson G S, Theuns T, Wadsley J, White S D M and Woods R 2012 MNRAS 423, 1726–1749.
- Schaye et al. (2015) Schaye J, Crain R A, Bower R G, Furlong M, Schaller M, Theuns T, Dalla Vecchia C, Frenk C S, McCarthy I G, Helly J C, Jenkins A, Rosas-Guevara Y M, White S D M, Baes M, Booth C M, Camps P, Navarro J F, Qu Y, Rahmati A, Sawala T, Thomas P A and Trayford J 2015 MNRAS 446, 521–554.
- Schleicher et al. (2013) Schleicher D R G, Schober J, Federrath C, Bovino S and Schmidt W 2013 New Journal of Physics 15(2), 023017.
- Schlickeiser et al. (2012) Schlickeiser R, Ibscher D and Supsar M 2012 ApJ 758, 102.
- Semikoz and Sokoloff (2005) Semikoz V B and Sokoloff D 2005 A & A 433, L53–L56.
- Shimada et al. (1999) Shimada N, Terasawa T, Hoshino M, Naito T, Matsui H, Koi T and Maezawa K 1999 APSS 264, 481–488.
- Shu and Osher (1988) Shu C W and Osher S 1988 Journal of Computational Physics 77, 439–471.
- Sigl et al. (2003) Sigl G, Miniati F and Ensslin T A 2003 Phys. Rev. D68, 043002.
- Skillman et al. (2011) Skillman S W, Hallman E J, O’Shea B W, Burns J O, Smith B D and Turk M J 2011 ApJ 735, 96–+.
- Skory et al. (2013) Skory S, Hallman E, Burns J O, Skillman S W, O’Shea B W and Smith B D 2013 ApJ 763, 38.
- Sol et al. (2013) Sol H, Zech A, Boisson C, Krawczynski H, Fallon L, de Gouveia Dal Pino E, Hinton J, Inoue S, Neronov A and White R 2013 in A. G Kosovichev, E de Gouveia Dal Pino and Y Yan, eds, ‘Solar and Astrophysical Dynamos and Magnetic Activity’ Vol. 294 of IAU Symposium pp. 459–470.
- Storm et al. (2017) Storm E, Jeltema T E, Splettstoesser M and Profumo S 2017 ApJ 839, 33.
- Subramanian (2016) Subramanian K 2016 Reports on Progress in Physics 79(7), 076901.
- Subramanian et al. (2006) Subramanian K, Shukurov A and Haugen N E L 2006 MNRAS 366, 1437–1454.
- Tavecchio et al. (2012) Tavecchio F, Roncadelli M, Galanti G and Bonnoli G 2012 Physical Review Letters 86(8), 085036.
- Taylor et al. (2011) Taylor A M, Vovk I and Neronov A 2011 A & A 529, A144.
- Taylor et al. (2015) Taylor A R, Agudo I, Akahori T, Beck R, Gaensler B, Heald G, Johnston-Hollitt M, Langer M, Rudnick L, Ryu D, Scaife A, Schleicher D and Stil J 2015 ArXiv e-prints .
- Teyssier et al. (2013) Teyssier R, Pontzen A, Dubois Y and Read J I 2013 MNRAS 429, 3068–3078.
- The Pierre Auger Collaboration et al. (2017) The Pierre Auger Collaboration, Aab A, Abreu P, Aglietta M, Samarai I A, Albuquerque I F M, Allekotte I, Almela A, Alvarez Castillo J, Alvarez-Muñiz J and et al. 2017 ArXiv e-prints .
- Trivedi et al. (2014) Trivedi P, Subramanian K and Seshadri T R 2014 Physical Review Letters 89(4), 043523.
- Trott et al. (2013) Trott C M, Tingay S J and Wayth R B 2013 ApJL 776, L16.
- Turner and Widrow (1988) Turner M S and Widrow L M 1988 Physical Review Letters 37, 2743–2754.
- Völk and Atoyan (2000) Völk H J and Atoyan A M 2000 ApJ 541, 88–94.
- Vacca et al. (2010) Vacca V, Murgia M, Govoni F, Feretti L, Giovannini G, Orrú E and Bonafede A 2010 A & A 514, A71.
- Vacca et al. (2016) Vacca V, Oppermann N, Enßlin T, Jasche J, Selig M, Greiner M, Junklewitz H, Reinecke M, Brüggen M, Carretti E, Feretti L, Ferrari C, Hales C A, Horellou C, Ideguchi S, Johnston-Hollitt M, Pizzo R F, Röttgering H, Shimwell T W and Takahashi K 2016 A & A 591, A13.
- van Weeren et al. (2010) van Weeren R J, Röttgering H J A, Brüggen M and Hoeft M 2010 Science 330, 347–.
- Vazza, Brueggen, Gheller, Ferrari and Bonafede (2016) Vazza F, Brueggen M, Gheller C, Ferrari C and Bonafede A 2016 ArXiv e-prints .
- Vazza and Brüggen (2014) Vazza F and Brüggen M 2014 MNRAS 437, 2291–2296.
- Vazza, Brüggen, Gheller, Ferrari and Bonafede (2015) Vazza F, Brüggen M, Gheller C, Ferrari C and Bonafede A 2015 in ‘The Many Facets of Extragalactic Radio Surveys: Towards New Scientific Challenges’ p. 64.
- Vazza et al. (2014) Vazza F, Brüggen M, Gheller C and Wang P 2014 MNRAS 445, 3706–3722.
- Vazza, Brüggen, Wittor, Gheller, Eckert and Stubbe (2016) Vazza F, Brüggen M, Wittor D, Gheller C, Eckert D and Stubbe M 2016 MNRAS 459, 70–83.
- Vazza, Eckert, Brüggen and Huber (2015) Vazza F, Eckert D, Brüggen M and Huber B 2015 MNRAS 451, 2198–2211.
- Vazza, Ferrari, Bonafede, Brüggen, Gheller, Braun and Brown (2015) Vazza F, Ferrari C, Bonafede A, Brüggen M, Gheller C, Braun R and Brown S 2015 ArXiv e-prints .
- Vazza, Ferrari, Brüggen, Bonafede, Gheller and Wang (2015) Vazza F, Ferrari C, Brüggen M, Bonafede A, Gheller C and Wang P 2015 A & A 580, A119.
- Vazza et al. (2017) Vazza F, Jones T W, Brüggen M, Brunetti G, Gheller C, Porter D and Ryu D 2017 MNRAS 464, 210–230.
- Vernstrom et al. (2017) Vernstrom T, Gaensler B M, Brown S, Lenc E and Norris R P 2017 MNRAS 467, 4914–4936.
- Vogt and Enßlin (2003) Vogt C and Enßlin T A 2003 A & A 412, 373–385.
- Wang et al. (2010) Wang P, Abel T and Kaehler R 2010 New Astronomy 15, 581–589.
- Widrow (2002) Widrow L M 2002 Reviews of Modern Physics 74, 775–823.
- Widrow et al. (2009) Widrow L M, Elahi P J, Thacker R J, Richardson M and Scannapieco E 2009 MNRAS 397, 1275–1285.
- Widrow et al. (2012) Widrow L M, Ryu D, Schleicher D R G, Subramanian K, Tsagas C G and Treumann R A 2012 Science & Space Review 166, 37–70.
- Wittor, Jones, Vazza and Brüggen (2017) Wittor D, Jones T, Vazza F and Brüggen M 2017 MNRAS 471, 3212–3225.
- Wittor et al. (2016) Wittor D, Vazza F and Brüggen M 2016 Galaxies 4, 71.
- Wittor, Vazza and Brüggen (2017) Wittor D, Vazza F and Brüggen M 2017 MNRAS 464, 4448–4462.
- Xu et al. (2012) Xu H, Govoni F, Murgia M, Li H, Collins D C, Norman M L, Cen R, Feretti L and Giovannini G 2012 ApJ 759, 40.
- Xu et al. (2009) Xu H, Li H, Collins D C, Li S and Norman M L 2009 ApJL 698, L14–L17.
- Zel’dovich (1970) Zel’dovich Y B 1970 Sov. Astronom. 13, 608.
Appendix A Simulated star formation and feedback
The process of star formation in ENZO is implemented through star particles that are formed on the fly, according to several possible recipes (Bryan et al., 2014). Stars return thermal energy, gas and metals back into the gas phase. At the resolution probed in our simulations (which is too coarse to properly resolve the multi-phase process of star formation) we form star particles based on a density criterion at a rate which depends on a fixed timescale (Kravtsov, 2003). Central to this star formation model are the choice of a minimum gas density threshold, and the dynamical timescale and the minimum star mass, . Whenever , the gas is contracting (), the local cooling time is smaller than the dynamical timescale () and the baryonic mass is larger than the minimum star mass ( ) we form stars with a mass By testing with smaller runs, by removing the corresponding mass from the gas mass in the cell. This recipe has been proposed to reproduce the observed Kennicutt’s law (Kennicutt, 1998) and by benchmarking against the observed cosmic star formation history we explored a few possible variations of the above parameters (see Tab. 2). The feedback from the star forming process (e.g. supernovae explosion) depends on the assumed fractions of energy/momentum/mass ejected per each formed star particles, . We assume the feedback energy to be released entirely in the thermal form (i.e. hot supernovae-driven winds), which typically turns into the formation of pressure-driven winds around our halos ( km/s). For the injection of magnetic fields by stars, we additionally introduced the generation of magnetic dipoles during each feedback episode. The dipoles are randomly oriented along one of the coordinate axis of the simulation, and their total energy scales with the thermal feedback energy, , typically with . A list of all parameters for star formation physics assumed in our runs is given in Tab. 2.
For an overview of the performances and limitations of the recipes for star formation and feedback in ENZO we refer the reader to the recent survey of models by Skory et al. (2013) and Li et al. (2015). We also notice that recent works explored the complexity of properly implementing supernova-driven feedback in simulations, in a way that can be independent on the assumed spatial resolution (Hopkins et al., 2017); however these effects can only be studied in detail on a much smaller scale that what is accessible by our runs here.
Fig. 16 gives the cosmic star formation (SFR) history for a few representative runs from the Chronos++ suite. The result from our runs is compared with the observational compilation of infrared and ultraviolet observations (taken from Madau and Dickinson 2014). The match is reasonably good for our CSF2, CSF3 (and additionally CSFBH5 and CSFBH4 which also contains supermassive black holes, see following Section), while models CSF0 and CSF1 (and CSFBH1) present a marked drop in the SFR at late times. The combined effect of the limited spatial resolution and DM mass resolution in our runs ( kpc and , respectively) is expected to quench the formation of galaxies , and therefore our simulations still lacks an important contributor to the cosmic SFR (e.g. Genel et al., 2014). However, the contribution to both the chemical, thermal and magnetic enrichment of the intergalactic medium by galactic outflow should be largely dominated by (e.g. Samui et al., 2017), which are resolved in our runs. We also notice that the last stage of the wind developments in our runs should be powered by the non-thermal pressure of magnetic fields, as in cosmic-ray driven winds(e.g. Dorfi and Breitschwerdt, 2012; Salem and Bryan, 2014; Samui et al., 2017), given the identical equation of state in the ultra-relativistic regime vs in the frozen-field approximation.
Fig. 17 shows the average magnetization output of several star formation and feedback recipes in the Chronos++ suite: the left panel show the average magnetic field injected as a function of time by star forming particles, averaged inside the cell volume (), while the right panel show the average magnetic field in the total volume (i.e. also by taking into account the number of star forming particles in each model). The largest magnetic fields at the injection () are found in the CSF3 and in the CSFBH5 abd CSFBH6 runs, owing to the largest efficiency assumed there, while lower values are found in less energetic scenarios. On average, on a random volume in the simulation we have of magnetic fields produced from star formation in the CSF3 model, which is in good agreement with the recent semi-analytical estimate by Samui et al. (2017), while we measure orders of magnitude lower fields for our lowest efficiency models. While BH particles contribute to additional magnetization inside halos, the volume averaged magnetic field output of star forming particles in runs with BH is nearly the same as without them, because most of star formation happens in regions away from BH. We remark that the above values do not strictly represent a background value for the magnetic fields in voids, because the fields injected by star forming particles do not uniformly expand onto large scales on a finite timescale, and are also further affected by adiabatic losses while expanding from dense star forming regions.
The effects of star formation (also combined with feedback from BH, see below) on the simulated clusters/groups in a few of our runs is shown in Fig. 18: the cooling of gas into stars and their feedback steepens the mass-temperature relation within towards the values observed for X-ray groups (Reichert et al., 2011; Eckmiller et al., 2011), by increasing the typical temperature of systems.
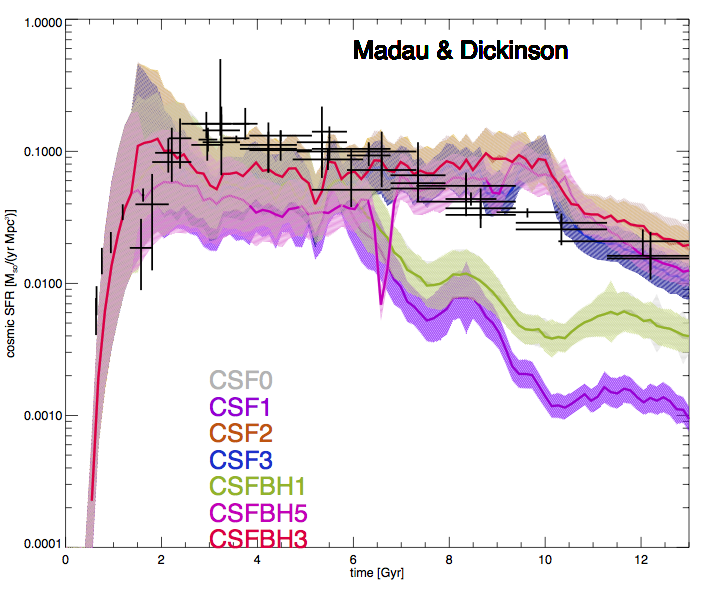
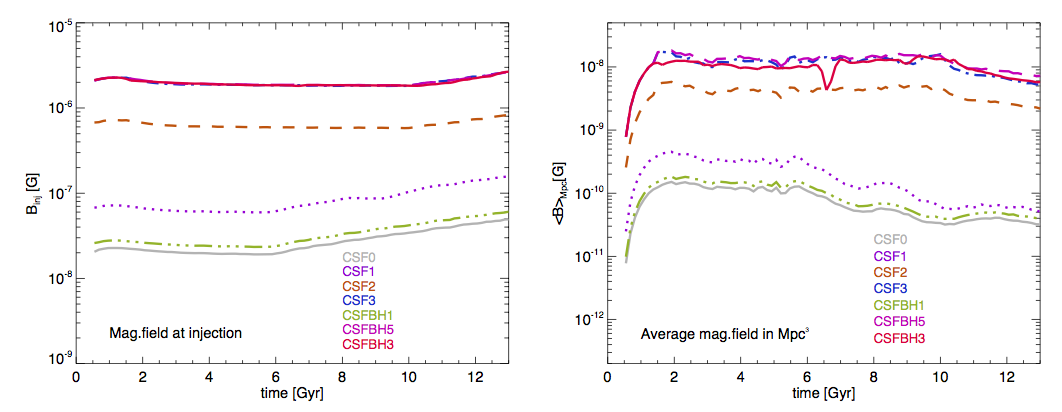
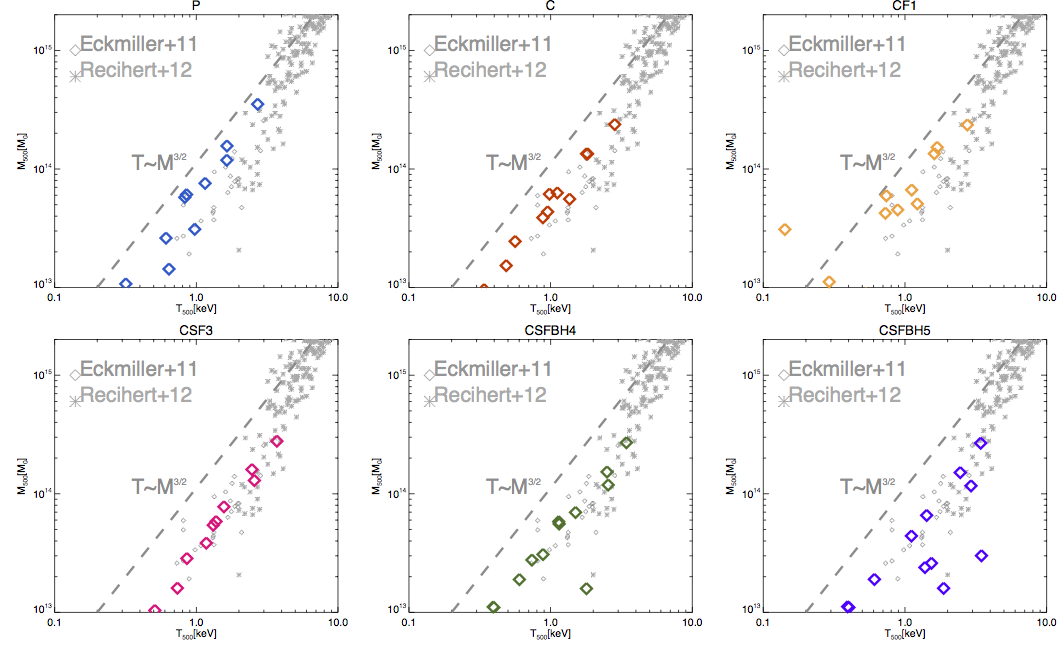
Appendix B Simulated supermassive black hole formation and feedback
In a few of our runs we included the growth of supermassive black holes and their thermal/magnetic feedback on the surrounding cosmic gas. Using existing implementations in ENZO, we inject black hole seed particles at , by locating them at the centre of all halos identified in the simulation (Kim et al., 2011). For each seed particle we assume a fixed initial mass of . Each BH particles accretes gas mass with assuming a Bondi-Hoyle rate, with the following ad-hoc numerical prescriptions to overcome the problems connected to the coarse resolution of our runs: a) we assumed the gas is accreted at the fixed temperature of , because a precise estimate of gas temperature on the accretion radius is not feasible at our resolution; b) we boost the Bondi accretion rate by a factor , to overcome the effect of the limited gas density which can be resolved around our BH particles. In a couple of runs, we instead assumed a fixed mass accretion rate onto BH particles, or . Each BH particle is allowed to release thermal feedback on the surrounding gas, as an extra thermal energy output from each black hole particle, assuming an efficiency between the accreted mass, , and the feedback energy, . As in the case of stellar feedback, with new code implementation we linked the release of feedback energy to the injection of magnetic fields from the BH region (in the form of magnetic dipoles), assuming , where we explored values in the range . ) of the energy conversion into magnetic field dipoles at the jet base. A list of all parameters for BH physics assumed in our runs is given in Tab. 2.
Fig.18 (lower panels) show the impact of feedback from BH particles in a few runs of the Chronos++ suite. The slightly larger scatter of the mass-temperature relation, compared to the case where only star formation and feedback is adopted, is a result of the intermittent feedback activity from AGNs, which can significantly heat the core regions of groups.
With an alternative procedure designed to spare computational resources in our largest runs, we also used a much simpler recipe for AGN and stellar feedback, where for we allowed for the impulsive injection of thermal and magnetic energy (also assuming a fixed efficiency, ), whenever the the physical gas number density exceeded a critical value of , with a fixed energy per event, erg . Our previous work (Vazza, Brüggen, Wittor, Gheller, Eckert and Stubbe, 2016; Hackstein et al., 2016) has shown that this approximated approach is able to reproduce the observed steepening of the Temperature-Mass relation in galaxy groups (relative to the self-similar scaling) and to reasonably reproduce the observed profiles of gas density, temperature and pressure in galaxy clusters.
For a complete overview of the implementation of BH particles and thermal/kinetic feedback in ENZO we refer the reader to the original work by Kim et al. (2011). We also notice that recent works explored the complex interplay between nuclear star formation in galaxies and the growth of BH (e.g. Biernacki et al., 2017), as well as the effect of the detailed implementation of AGN-driven jets in the intracluster medium (e.g. Bourne and Sijacki, 2017), but these effects can only be studied on a much smaller scale that what is accessible by our runs.
Appendix C Zeldovich approximation for primordial magnetic seed fields
A convenient way we explored to generate an initial distribution of magnetic fields correlated with initial density perturbations of large-scale structures is based on the Zeldovich approximation. In order to ensure that at the start, we initialise the magnetic field vectors perpendicular to the 3-D gas velocity field computed with the Zeldovich approximation: in the Zeldovich approximation the velocity field is entirely compressive by definition, hence a field perpendicular to it is a purely solenoidal. In order to match with the simpler intialisation of in the other uniform approach, the r.m.s values of each component generated with the Zeldovich approximation are renormalized within the cosmic volume, so that . This initialisation strategy is convenient as it ensures that by construction and without having to resort to cleaning schemes or higher order derivcatives in Fourier space, and moreover it by-passes the problem of generating very large initial distribution of magnetic fields via FFTs, which can be prohibitively large for the simulations we are concerned with. In this project, we tested two different random orientations of the initial magnetic field vector produced with the Zeldovich approximation.
Appendix D Subgrid dynamo model
Our run-time implementation of a sub-grid (SG) model for dynamo growth of magnetic fields tries to estimate the level of dynamo amplification which may occur given the level of kinetic energy resolved in the simulation and associated to the solenoidal velocity component (), in the course of the root-grid timestep, (typically in the range of ). The non-linear stage of dynamo growth in our runs may be hampered by the moderate Reynolds number we can achieve ( in most of the volume, e.g. Vazza et al. 2014) and therefore the dynamo amplification resolved in our runs is only a lower limit on the true amplification process. The SG model proposed here relies on measuring the gas vorticity at-run time, and in estimating the energy transfer between the cascading solenoidal kinetic energy (in a Kolmogorov model of turbulence) and the magnetic energy in the dynamo regime. The solenoidal component is well known to the be one connected to the triggering of magnetic dynamo (e.g. Ryu et al., 2008) and the vorticity squared (also known as ???enstrophy???, ) gives a convenient way of estimating the turbulent dissipation rate on the fly in our simulations as , where and is the stencil to compute the vorticity (Jones et al., 2011; Porter et al., 2015; Vazza et al., 2017; Wittor, Jones, Vazza and Brüggen, 2017). The fraction of this turbulent kinetic power which is ultimately converted into magnetic energy, , sets the amplified magnetic energy as . While direct numerical simulations of idealized intracluster medium dynamo suggest (Beresnyak and Miniati, 2016), for our cosmological simulations we need a more general approach to link the amplified magnetic energy local plasma conditions across cosmic environments. Here we rely on the survey of simulations performed by Federrath et al. (2014), who simulated small-scale dynamo in a variety of conditions with different Mach numbers, , for the forcing of turbulence. Based on this prescription, we can estimate the saturation level and the typical growth time of magnetic fields as a function of the local Mach number of the flow, using the fitting formulas given by Federrath et al. (2014). In particular, i.e. its value can be guessed from the fitting formulas once that the timestep and the local Mach numbers are known, as , where is the estimate ratio between magnetic and kinetic energy at saturation and is the typical growth rate, which we both take from Federrath et al. (2014) as a function of the flow Mach number. Once we compute the amplified magnetic energy, , we use it to generate a new magnetic field vector, , which we add to the already existing field, imposing that it is parallel to the local direction of the gas vorticity, so that the new generated field is also solenodial by construction. A corresponding amount of kinetic energy is removed from the cells, and momentum is removed assuming an isotropic dissipation of the small-scale velocity vectors. This procedure is manifestly simpler than more sophisticated SG models on the market, where the SG turbulent energy is measured via Favre filtering, and the electromotive force is added in a self-consistent way (Grete et al., 2016). However, our tests show that its application to simulated large-scale structures well matches the prediction that can be worked out in post-processing, based on the measured value of vorticity (e.g. Ryu et al., 2008).
| ID | |||||||||
| [ | |||||||||
| 1.5 | 0.01 | - | - | - | - | CSF1 | |||
| 1.5 | 0.1 | - | - | - | - | CSF2 | |||
| 1.0 | 0.1 | - | - | - | - | CSF3 | |||
| 1.0 | 0.1 | - | - | - | - | CSF4 | |||
| 1.0 | 0.1 | - | - | - | - | CSF5 | |||
| 1.5 | 0.01 | 0.05 | 0.01 | CSFBH1 | |||||
| 1.5 | 0.01 | 0.05 | 0.01 | CSFBH2 | |||||
| 1.0 | 0.1 | 0.05 | 0.1 | CSFBH3 | |||||
| 1.0 | 0.1 | ( fixed ) | 0.05 | 0.1 | CSFBH4 | ||||
| 1.0 | 0.1 | ( fixed) | 0.05 | 0.1 | CSFBH5 | ||||
| 1.0 | 0.1 | - | - | - | - | CSFDYN1 |