Palomar Optical Spectrum of Hyperbolic Near-Earth Object A/2017 U1
Abstract
We present optical spectroscopy of the recently discovered hyperbolic near-Earth object A/2017 U1, taken on 25 Oct 2017 at Palomar Observatory. Although our data are at a very low signal-to-noise, they indicate a very red surface at optical wavelengths without significant absorption features.
1 Introduction
On 25 Oct 2017, the Minor Planet Center (MPC) published a Minor Planet Electronic Circular (MPEC) announcing the discovery of object C/2017 U1(Minor Planet Center, 2017a), which was subsequently redesignated as A/2017 U1 after no cometary activity was seen in deep imaging stacks (Minor Planet Center, 2017b). A/2017 U1 has a strongly hyperbolic orbit (eccentricity), with a with respect to the Sun of km/s, indicating that it likely originated from beyond our Solar System. This is the first known minor planet energetically unbound from the Sun.
At the time of the announcement, we were observing on the Hale m telescope at Palomar mountain using the Double Spectrograph (DBSP) optical spectrograph (Oke & Gunn, 1982). We present the spectral observations of A/2017 U1 we obtained during this run below.
2 Data
All of our observations were obtained on 25 Oct 2017 UT, shortly after A/2017 U1 was announced. On this date A/2017 U1 was at a phase angle of , a geocentric distance of AU, and a heliocentric distance of AU. At the time of observation, A/2017 U1 had an apparent magnitude of mag, making it a difficult target even for Hale. Further, the atmospheric seeing at the time of observations was poor and variable () resulting in observations with no detectable flux above the background level. Of the hours of time spent integrating on the object, only one-third resulted in useful data where flux from the object was visible on the chip at all. In total, we combined ten exposures of seconds on integration each for our final spectrum. Useful observations ran from 06:13 to 09:17 (UT) on 25 Oct 2017.
The DBSP instrument has two arms, split with a dichroic beamsplitter into red and blue components. We used low resolution gratings in each arm ( lines/mm in the blue and lines/mm in the red), and the D52 dichroic that results in a split at . The resulting unbinned spectral resolution is and at the blaze wavelengths of nm and nm, respectively. No filter was used for either arm, to maximize flux. We used a slit width, and aligned the slit along the parallactic angle to reduce the effect of atmospheric differential refraction.
We performed bias and flat field calibration, as well as wavelength calibration using a He-Hg arc lamp and a He-Ne-Ar arc lamp for the blue and red sides (respectively). Reflectance spectra were obtained by observing a local standard star (in this case BD+03 27, a nearby mag G0 star) to correct for local atmospheric extinction, and then slope-corrected with observations of a Solar analog star (here HD 1368, a mag G2V star).
For the object and each standard star, we extract a spectrum from the chip based on a visual identification of the pixels that the spectrum falls on. During observing the targets are placed on the same part of the slit each time, so this region typically varies by only pixels from object to object. We used a -pixel wide extraction region for the standard stars to encompass as much light as possible, while we used a -pixel wide region for A/2017 U1 to minimize the contribution of the background. A sky region was extracted above and below the spectrum ranging from 10 to 30 pixels away from the edge of our spectral extraction window in both directions. These sky measurements were median-combined and subtracted from each measured spectrum. Each spectrum from individual exposures is then median-combined in wavelength-space to get the final measured spectrum. We divide the object spectrum by the local standard in wavelength space to correct for atmospheric conditions. To correct for the spectral type of the local standard, we divide the local standard by the solar standard, perform a linear fit, then divide the corrected object spectrum by this linear trend.
We restrict our analysis to wavelengths from nm to nm. Blueward of this range the light is primarily sent to the blue camera, which results in different systematics and requires more detailed calibration. In addition, no flux can be seen by eye at these wavelengths in the raw image frames. Redward of our range of interest, telluric lines from the atmosphere begin to significantly contaminate our spectra resulting in a large increase in noise.
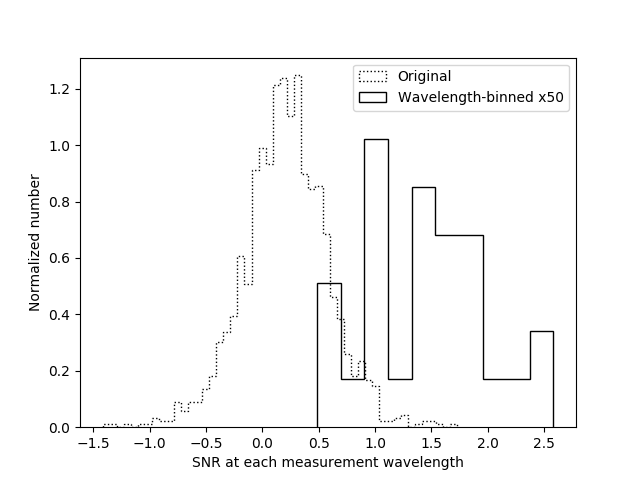
In Figure 1 we show the signal-to-noise (flux over error) of each wavelength element in our final object reflectance spectrum. There is a distinct positive trend in this distribution, showing that we did detect flux from A/2017 U1. By binning the data in wavelength-space using an error-weighted mean we can improve the signal-to-noise of each element, as shown by the solid line in Fig 1.

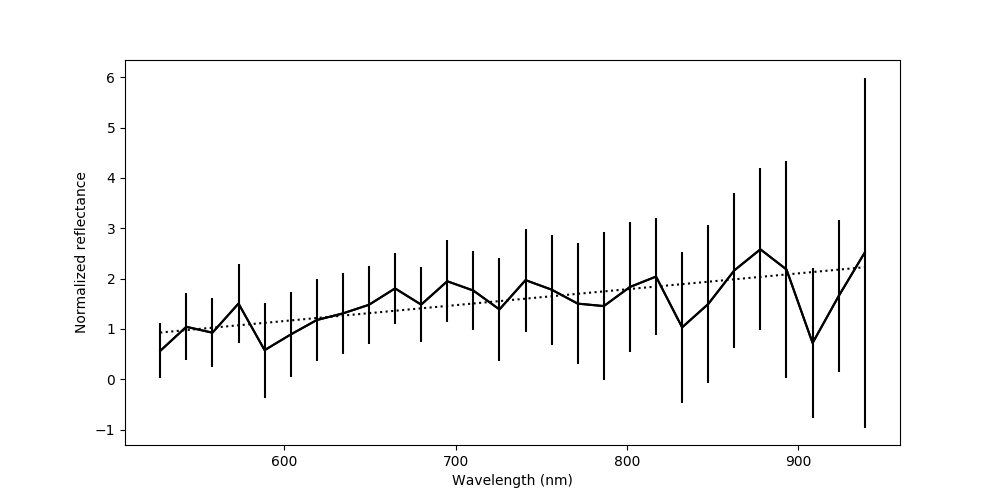
We show in Figure 2 our calibrated, binned spectrum of A/2017 U1. We have normalized the spectrum to the measured reflectance at nm, and measure a slope following Equation 1 from Bus & Binzel (2002). No significant deviation from a linear trend is observed, and the best-fit line has a slope of units/m (equivalent to ).

3 Results
Our spectrum of A/2017 U1 shows no significant features, however our data have a low enough signal-to-noise that this is not a conclusive determination. The spectral slope is only measured at from a line of zero-slope, but is significantly redder than any of the taxonomies found in the SMASS survey (Bus & Binzel, 2002), and consistent with the RR class seen in the TNOs and Centaurs (Merlin et al., 2017).
Integrating our measured reflectance spectrum over the SDSS bandpasses (Fukugita et al., 1996), we derive colors of , , and which are redder than the bulk of asteroids measured by SDSS (Ivezić et al., 2001) and are consistent with the Kuiper Belt colors measured in the Col-OSSOS survey (Pike et al., 2017).
Due to the low SNR of our observations, we can only make very limited interpretations of these data. However within that bound, A/2017 U1 appears to have a red slope at optical wavelengths and no significant absorption features in this wavelength range.
Acknowledgments
I would like to thank the contributors on the Minor Planet Mailing List and Michele Bannister for bringing this object to my attention. I also thank Davide Farnocchia for providing critical late-night, real-time ephemerids for this object which allowed it to be observed, and Kajsa Peffer and Paul Nied for support during observing. This research was carried out at the Jet Propulsion Laboratory, California Institute of Technology, under a contract with the National Aeronautics and Space Administration. This research has made use of data and services provided by the International Astronomical Union’s Minor Planet Center. This publication makes use of observations from the Hale Telescope at Palomar Observatory which is owned and operated by Caltech, and administered by Caltech Optical Observatories.
References
- Bus & Binzel (2002) Bus, S.J. & Binzel, R.P., 2002, Icarus, 158, 146.
- Fukugita et al. (1996) Fukugita, M., Ichikawa, T., Gunn, J., et al., 1996, AJ, 111, 1748.
- Ivezić et al. (2001) Ivezić, Z̆, Tabachnik, S., Rafikov, R., et al., 2001, AJ, 122, 2749.
- Merlin et al. (2017) Merlin, F., Hromakina, T., Perna, D, Hong, M.J. & Alvarez-Candal, A., 2017, A&A, 604, A86.
- Minor Planet Center (2017a) IAU Minor Planet Center, 2017, U181, http://www.minorplanetcenter.net/mpec/K17/K17UI1.html
- Minor Planet Center (2017b) IAU Minor Planet Center, 2017, U183, http://www.minorplanetcenter.net/mpec/K17/K17UI3.html
- Oke & Gunn (1982) Oke, J.B. & Gunn, J.E., 1982, PASP, 94, 586.
- Pike et al. (2017) Pike, R.E., Fraser, W.C., Schwamb, M.E., et al., 2017, AJ, 154, 101.