The first 62 AGN observed with SDSS-IV MaNGA - I: their characterization and definition of a control sample
Abstract
We report the characterization of the first 62 MaNGA Active Galactic Nuclei (AGN) hosts in the Fifth Product Launch (MPL-5) and the definition of a control sample of non-active galaxies. This control sample – comprising two galaxies for each AGN – was selected in order to match the AGN hosts in terms of stellar mass, redshift, visual morphology and inclination. The stellar masses are in the range , and most objects have redshifts . The AGN sample is mostly comprised of low-luminosity AGN, with only 17 nuclei with (that we call “strong AGN”). The stellar population of the control sample galaxies within the inner 1–3 kpc is dominated by the old ( 4 – 13 Gyr) age component, with a small contribution of intermediate age (640–940 Myr) and young stars ( Myr) to the total light at 5700Å. While the weaker AGN show a similar age distribution to that of the control galaxies, the strong AGN show an increased contribution of younger stars and a decreased contribution of older stars. Examining the relationship between the AGN stellar population properties and , we find that with increasing , the AGN exhibit a decreasing contribution from the oldest (4 Gyr) stellar population relative to control galaxies, but have an increasing contribution from the younger components with ages 40 Myr. We also find a correlation of the mean age differences (AGN - control) with , in the sense that more luminous AGN are younger than the control objects, while the low-luminosity AGN seem to be older. These results support a connection between the growth of the galaxy bulge via formation of new stars and the growth of the Supermassive Black Hole via matter accretion in the AGN phase.
keywords:
galaxies: active – galaxies: stellar content1 Introduction
The MaNGA (Mapping Nearby Galaxies at the Apache Point Observatory) survey, a core program of the fourth-generation Sloan Digital Sky Survey (SDSS-IV), operating between 2014 and 2020, will deliver optical integral field spectroscopic observations of 10,000 galaxies. It has been conceived in order to produce homogeneous spectroscopic information of these galaxies out to a radial position of at least (effective radius). An overview of the main science objectives and survey design is presented in Bundy et al. (2015). The integral field unit design and performance are described in Drory et al. (2015). Details about the observing strategy in order to ensure spectrophotometric accuracy are given in Law et al. (2015). The spectrophotometric calibration technique is described in Yan et al. (2016).
Among the 10,000 galaxies, there are expected to be 300 galaxies hosting Active Galactic Nuclei (AGN). One of the primary goals of the MaNGA survey is to explore the relation between the AGN and their host galaxies. This investigation will be accomplished via the mapping of the ionized and neutral gas kinematics, searching in particular for outflows and investigating the corresponding feedback effects on the host galaxy (Zakamska & Greene, 2014). The empirical relationship between the mass of the central Supermassive Black Hole (SMBH) in AGNs and the stellar velocity dispersion of the spheroidal component of galaxies (the relationship) suggests that the growth of a galaxy (due to star formation) and its central SMBH (due to gas accretion) may be coupled (e.g. Ferrarese & Merrit, 2000; Gebhardt et al., 2000), although some non-causal explanations have been also recently proposed (e.g. Peng, 2007; Jahnke & Macciò, 2011). The observed relationship has been explained as being originated by the AGN feeding and feedback processes that couple the growth of the SMBHs and their host galaxies (Ferrarese & Ford, 2005; Somerville et al., 2008; Kormendy & Ho, 2013). Indeed, cosmological simulations suggest that AGN plays a fundamental role in the evolution of its host galaxy (Di Matteo, Springel & Hernquist, 2005; Springel, Di Matteo & Hernquist, 2005; Bower et al., 2006), as while the SMBH evolves together with the galaxy, it is fed by surrounding material and periodically produces gas ejections that retard the growth of the galaxy by preventing the accretion of extragalactic gas in these active phases (e.g. Nemmen et al., 2007; Fabian et al., 2012; Terrazas et al., 2016).
AGN feeding and feedback effects are related to the stellar population of the host galaxy. Previous studies have suggested that the feeding, leading to the growth of the central SMBH, appears to be related to recent episodes of star formation in the circumnuclear region (e.g. Heckman et al., 1997; Storchi-Bergmann et al., 2001; Davies et al., 2007; Hickox et al., 2014; Diamond-Stainic & Rieke, 2012; Esquej et al., 2014). These studies found an excess of young to intermediate age stars in the inner few hundred parsecs of AGN hosts when compared to non-active galaxies and support the existence of an AGN-Starburst connection (Perry & Dyson, 1985; Terlevich & Melnick, 1985; Norman & Scoville, 1988). This connection can be understood, as both star formation and nuclear activity may be fed by gas inflows towards de center or, alternatively the central AGN may be triggered due to mass loss from evolving stars (e.g. Wild, Heckman & Charlot, 2010). The AGN feedback, both via radiative and kinetic power, may, in turn, also affect the stellar populations of the host galaxy in the vicinity of the AGN by quenching star formation (e.g. Fabian et al., 2012; Dubois et al., 2013; Ishibashi & Fabian, 2017; Pontzen et al., 2017; Xie, Yuan & Ho, 2017).
The present study is the first of a series of papers in which we will use the MANGA data cubes to obtain the properties of AGN and a matched sample of inactive galaxies. We have so far used the 2778 galaxy data cubes released in the 5th MaNGA Product Launch (MPL-5), obtained between 2014 and 2016. The cubes have been processed using the version 2.0.1 of the MaNGA Data Reduction Pipeline (Law et al., 2016). This set of datacubes contains 62 AGN hosts, selected using optical emission line diagnostics as described in Sect. 2.1, comprising 45 low-luminosity ( erg s-1) AGN and 17 higher luminosity ones from both the baseline MaNGA sample and the Ancillary AGN sample111As the baseline MaNGA sample contains limited dynamic range in AGN luminosity, reaching only erg s-1 ( erg s-1), it is not well suited to explore the relationship between the AGN power and both the outflows and stellar populations of the host galaxy. In order to address this issue, an auxiliary program to cover a wider range of AGN luminosities was proposed by a group led by PI Jenny Greene. This successful proposal will lead to the observation of an additional 150 AGN with luminosities up to erg s-1.
Our goal with this first paper is to broadly characterize the properties of this initial AGN sample and select a control sample of inactive galaxies matched to the AGN hosts in absolute magnitude, galaxy mass, redshift, galaxy type and inclination. The definition of a control sample is essential in order to investigate the effects of AGN feeding and feedback on the host galaxy properties, and in order to do this, it is necessary to make sure that eventual differences are not related to properties such as Hubble type or galaxy mass. We have found so far 62 AGN and 109 control sample galaxies, but the criteria introduced in the present paper will be used to increase our sample to at least 300 AGN (estimated to be observed) and corresponding control sample galaxies by the conclusion of the MaNGA survey.
Besides presenting and characterizing the AGN and control samples, we investigate the similarities and differences between the stellar populations of the two samples. This study was performed in two steps: in the present paper we compare the stellar population of the AGN hosts and control galaxies using stellar population synthesis of the nuclear spectra over the inner 3 arcsec from the SDSS-III survey (Gunn et al., 2006; Eisenstein et al., 2011; Smee et al., 2013). In a forthcoming paper (Mallmann et al., in preparation) we will use the MaNGA datacubes to compare the resolved stellar population properties up to 1.5.
This paper is organized as follows. In Section 2 we present and describe the AGN and control samples; in Section 3 we compare the properties of the two samples; in Section 4 we describe the stellar population synthesis method; in Section 5 we discuss the results and in Section 6 we present our conclusions. We have assumed a cosmology with , and .
2 Sample selection and characterization
2.1 Galaxies hosting an active nucleus
AGN produce a spectral energy distribution consistently harder than massive main sequence stars. A common tool for identifying the origin of the ionizing photons in optical emission-line galaxies (active nuclei, starbursts or transition objects) is the BPT diagram (Baldwin, Phillips & Terlevich, 1981), which is based on line ratios between high and low ionization potential species. But one weakness of the BPT diagram is its inability to discriminate between a genuine low-ionization AGN and emission-line galaxies whose ionizing photons are produced in the atmospheres of evolved low-mass stars (the so-called post-AGB stars). In order to circumvent this limitation, Cid Fernandes et al. (2010) have introduced a new diagnostic diagram which makes use of the equivalent width of H (EWH) – the so-called WHAN diagram. These authors have shown that galaxies that have EWHα smaller than 3Å are not ionized by AGN but instead are ionized by post-AGB stars, and have been dubbed “LIERS".
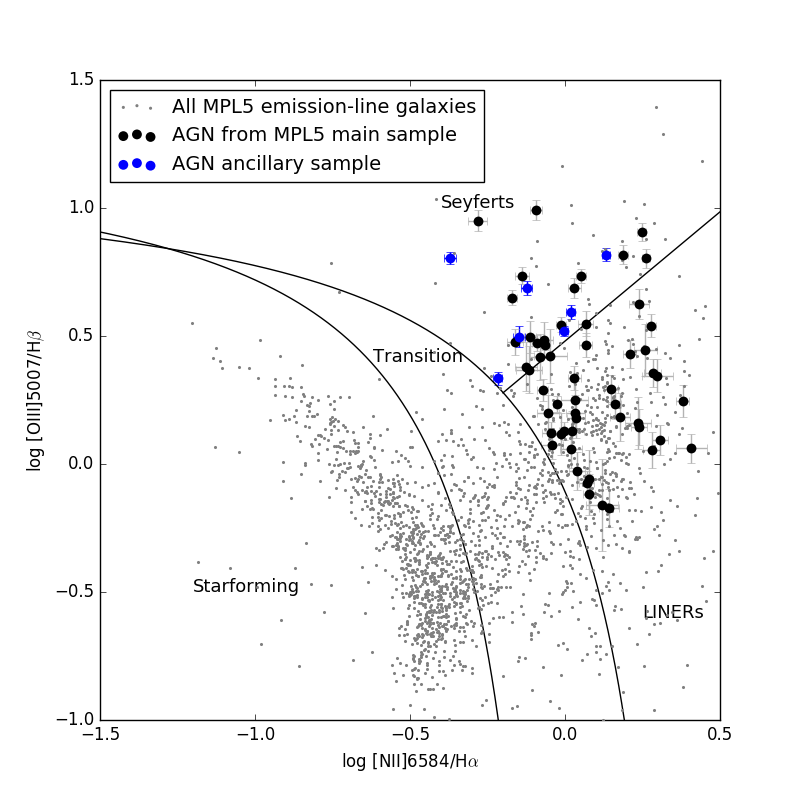
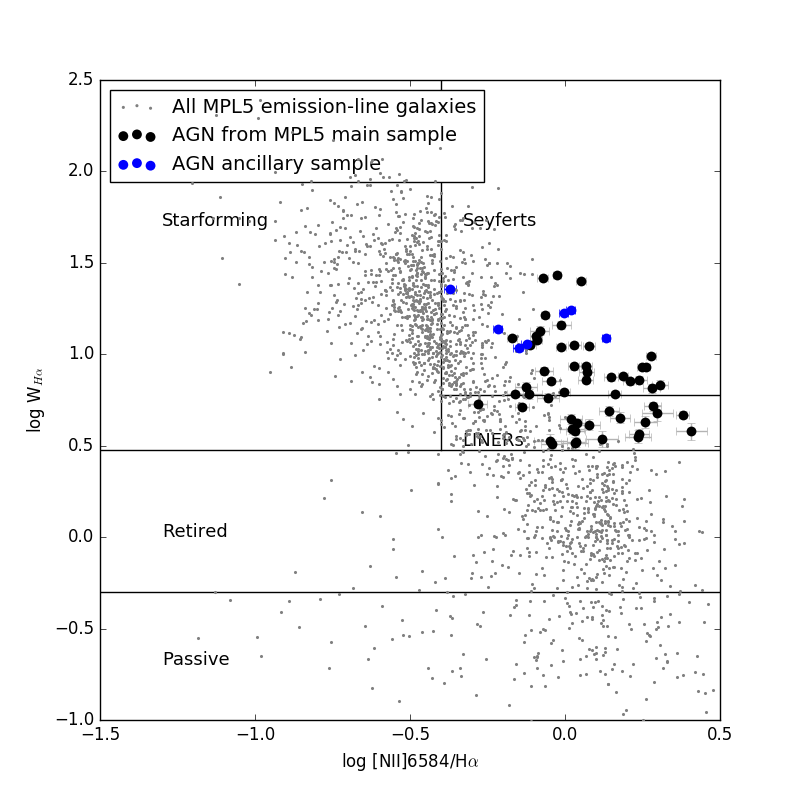
In order to identify hosts of “true" AGN in the MaNGA MPL-5 sample, we have made use of the BPT and the WHAN diagrams simultaneously. We have cross-matched all galaxy data cubes observed in MPL-5 with the SDSS-III spectroscopic data from DR12 (Alam et al., 2015). We have obtained line fluxes and equivalent widths of H, H, [OIII] and [NII], measured in the SDSS-III integrated nuclear spectrum, from Thomas et al. (2013). The criterion we have applied to identify galaxies hosting AGN was that it must be located, within the uncertainties, simultaneously in the Seyfert or LINER region of both the BPT and the WHAN diagrams. This criterion elliminates from the sample potential LIERs, and also transition objects. Only 62 galaxies have fulfilled this criterion.
Figures 2a and 2b present the BPT and WHAN diagrams for all MPL-5 emission line galaxies and indicate the location of galaxies we have considered as AGN hosts following the criteria above. Table 1 lists relevant parameters of the AGN host galaxies. Besides identifications and coordinates, redshifts, absolute magnitudes and stellar masses, we also list the galaxy classification in Galaxy Zoo (GZ1, Lintott et al., 2011), the -band concentration index and asymmetry parameter (described below) and the [OIII] luminosity derived from SDSS-III data (Thomas et al., 2013).
| AGN | Control object 1 | Control object 2 |
| 1-558912 | 1-71481 | 1-72928 |
 |
 |
 |
| 1-269632 | 1-210700 | 1-378795 |
 |
 |
 |
| 1-258599 | 1-93876 | 1-166691 |
 |
 |
 |
| 1-72322 | 1-121717 | 1-43721 |
 |
 |
 |
In order to assess quantitatively the morphological variety of the AGN and control samples, we have derived the concentration index and asymmetry index of the sample galaxies using the publicly available code PyCA (Menanteau et al., 2005). This calculation was made using the -band images in order to maximize the galaxy signal-to-noise ratio. We have also obtained for all galaxies of the sample the morphological classifications from GZ1 (Lintott et al., 2011). From the GZ1 classification probabilities, we have separated the galaxies in four large classes: ellipticals (E), spirals (S), merging (M) and intermediate elliptical/spiral (E/S); this last class corresponds to galaxies whose GZ1 elliptical and spiral probabilities are rigorously the same and exceed 50% when combined.
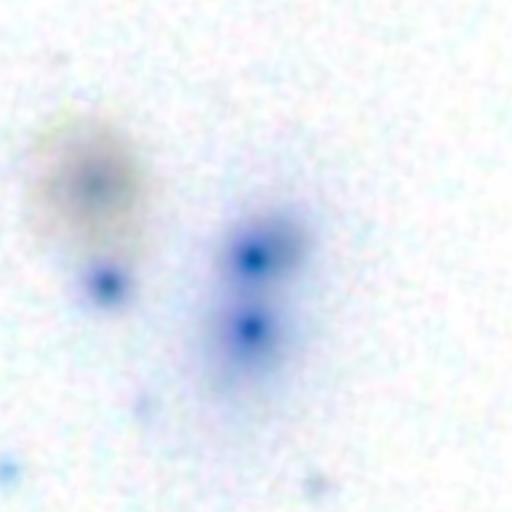
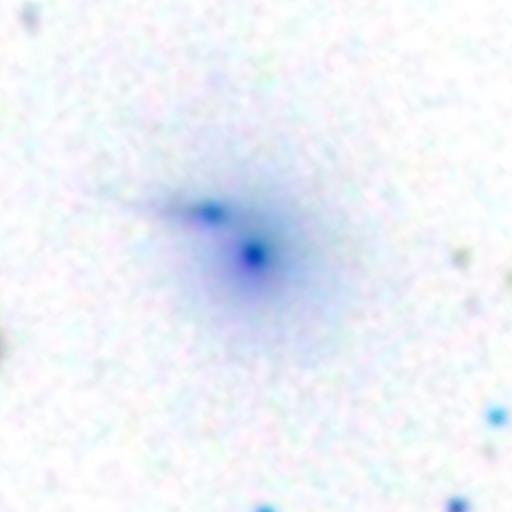
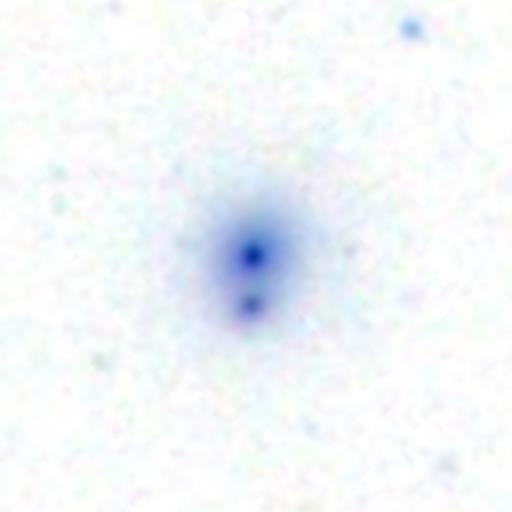
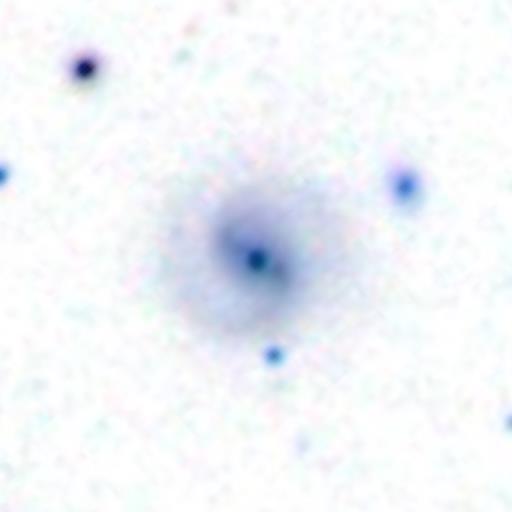
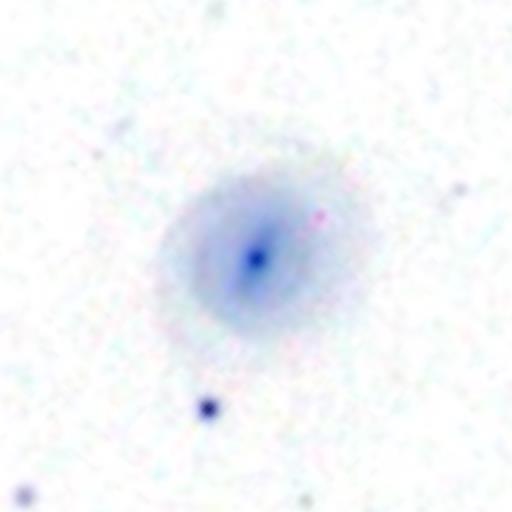
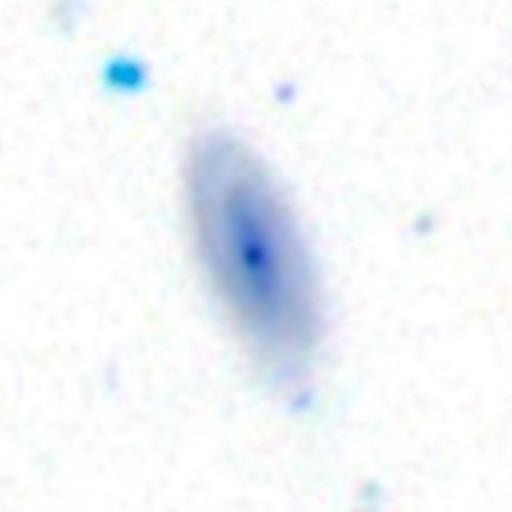
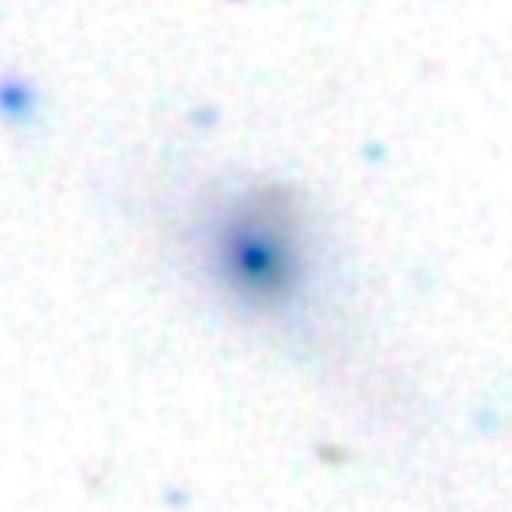
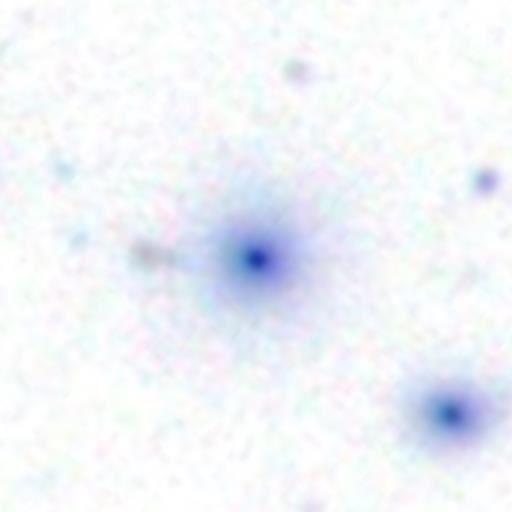
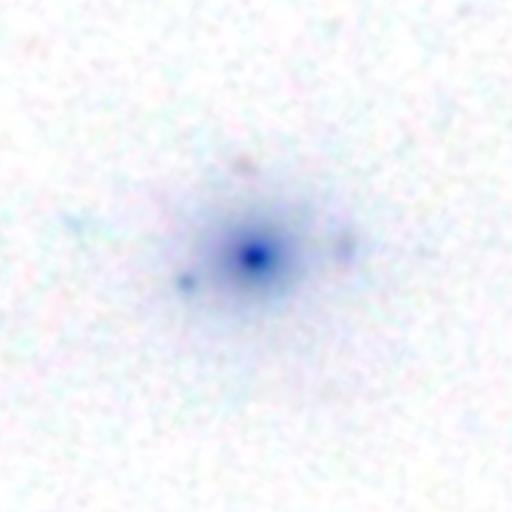
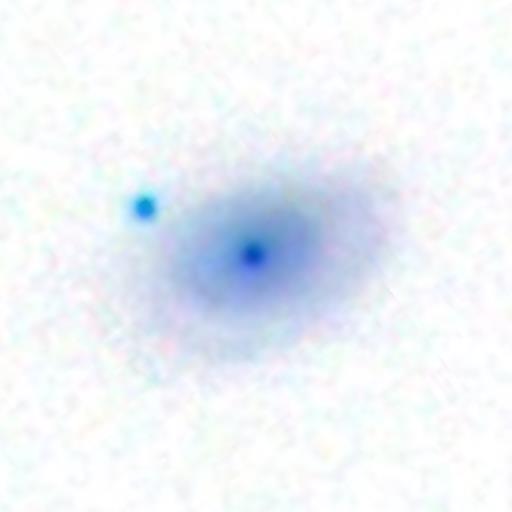
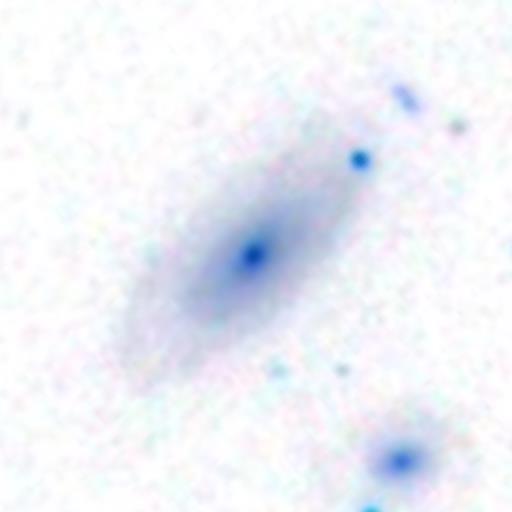
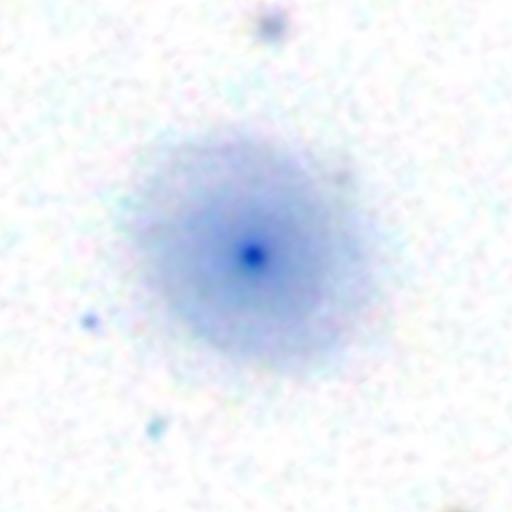
Most of the 62 AGN in our sample have luminosities erg s-1, with only 17 having larger luminosities. We use this threshold – postulated by Kauffmann et al. (2003) – to characterize these 17 AGN as “strong AGN". SDSS-III ugriz negative images (Fukugita et al., 1996) of the four most luminous of these strong AGN are shown in Figure 1; the remainder are shown in the Appendix.
Inspection of the SDSS-III spectra showed that most of the strong AGN in our sample present coronal lines: at least one of the lines [NeV]3425Å, [FeVII]3760Å or [FeX]6374Å are detectable above . A small number of objects among the most [OIII]-luminous “weak AGN” also present some of these lines. Coronal lines are thought to be produced by photoionization from the AGN (Mazzalay et al., 2010; Rodríguez-Ardila et al., 2011) and to be associated with outflows (Müller-Sánchez et al., 2011). Being insensitive to star formation as opposed to the [OIII]5007Å, the presence of coronal lines reinforces the AGN nature of the 17 most [OIII]-luminous objects in our sample, and suggests a transition between high- and low-ionization AGN at erg s-1, in concordance with Kauffmann et al. (2003).
We note that our AGN selection is based on single-fibre SDSS-III observations which limits us to sources with AGN-photoionization signatures within 3 arcsec of the galactic center. Wylezalek et al. (2017) has recently developed an AGN selection algorithm taking full advantage of the spatial dimension of AGN ionization signatures provided through the MaNGA data. Wylezalek et al. (2017) show that about a third to a half of the MaNGA-selected AGN candidates would not have been selected based on the SDSS-III single-fiber observations since AGN ionization signatures are only prevalent beyond the 3 arcsec coverage of the single-fiber spectra. Reasons for this can be manyfold (off-nuclear AGN, star formation signatures dominate in the center due to a nuclear starburst, recently turned-off AGN) and are currently under investigation by Wylezalek et al. in prep.
In this paper, we focus on the classical AGN with nuclear photo-ionization signatures. In a forthcoming paper, we will also investigate the nature of the stellar populations in the “unusual” off-nuclear MaNGA-selected AGN candidates.
| mangaID | RA | DEC | log | GZ1c | |||||
|---|---|---|---|---|---|---|---|---|---|
| (1) | (2) | (3) | (4) | (5) | (6) | (7) | (8) | (9) | (10) |
| 1-558912 | 166.129410 | 42.624554 | 0.1261 | -20.46 | 11.25 | – | 0.37 | 0.12 | 56.821.25 |
| 1-269632 | 247.560974 | 26.206474 | 0.1315 | -21.78 | 11.62 | S | 0.47 | 0.05 | 30.081.69 |
| 1-258599 | 186.181000 | 44.410770 | 0.1256 | -21.24 | 11.68 | E | 0.50 | 0.11 | 20.950.67 |
| 1-72322 | 121.014198 | 40.802612 | 0.1262 | -21.81 | 12.05 | S | 0.34 | 0.08 | 20.660.43 |
| 1-121532 | 118.091110 | 34.326569 | 0.1400 | -20.51 | 11.34 | E | 0.33 | 0.05 | 11.680.96 |
| 1-209980 | 240.470871 | 45.351940 | 0.0420 | -19.70 | 10.79 | S | 0.57 | 0.04 | 11.010.17 |
| 1-44379 | 120.700706 | 45.034554 | 0.0389 | -19.89 | 10.97 | S | 0.24 | 0.06 | 8.940.14 |
| 1-149211 | 168.947800 | 50.401634 | 0.0473 | -18.27 | 10.16 | S | 0.29 | 0.03 | 7.880.14 |
| 1-173958 | 167.306015 | 49.519432 | 0.0724 | -20.53 | 11.31 | S | 0.33 | 0.06 | 6.790.30 |
| 1-338922 | 114.775749 | 44.402767 | 0.1345 | -20.27 | 11.13 | M | 0.44 | 0.03 | 6.770.90 |
| 1-279147 | 168.957733 | 46.319565 | 0.0533 | -19.51 | 10.66 | S | 0.45 | 0.03 | 6.770.20 |
| 1-460812 | 127.170799 | 17.581400 | 0.0665 | -19.81 | 11.44 | – | 0.38 | 0.05 | 6.460.31 |
| 1-92866 | 243.581818 | 50.465611 | 0.0603 | -20.56 | 11.69 | E | 0.49 | 0.05 | 6.120.30 |
| 1-94784 | 249.318420 | 44.418228 | 0.0314 | -20.06 | 10.85 | S | 0.42 | 0.03 | 5.960.12 |
| 1-44303 | 119.182152 | 44.856709 | 0.0499 | -19.72 | 10.62 | S | 0.29 | 0.10 | 5.560.12 |
| 1-339094 | 117.472420 | 45.248482 | 0.0313 | -19.02 | 10.52 | E | 0.36 | 0.03 | 5.290.09 |
| 1-137883 | 137.874756 | 45.468319 | 0.0268 | -18.06 | 10.77 | E/S | 0.41 | 0.01 | 3.870.12 |
| 1-48116 | 132.653992 | 57.359669 | 0.0261 | -19.18 | 10.60 | S | 0.31 | 0.06 | 3.790.08 |
| 1-256446 | 166.509872 | 43.173473 | 0.0584 | -19.40 | 11.14 | E | 0.49 | 0.05 | 3.740.15 |
| 1-95585 | 255.029877 | 37.839500 | 0.0633 | -20.88 | 11.24 | S | 0.27 | 0.08 | 3.580.16 |
| 1-135641 | 249.557312 | 40.146820 | 0.0304 | -19.03 | 11.19 | S | 0.28 | 0.08 | 3.520.09 |
| 1-259142 | 193.703995 | 44.155567 | 0.0543 | -20.75 | 11.29 | S | 0.39 | 0.06 | 3.470.20 |
| 1-109056 | 39.446587 | 0.405085 | 0.0473 | -19.27 | 10.57 | – | 0.32 | 0.05 | 3.240.08 |
| 1-24148 | 258.827423 | 57.658772 | 0.0282 | -18.51 | 10.56 | S | 0.31 | 0.04 | 3.170.05 |
| 1-166919 | 146.709106 | 43.423843 | 0.0722 | -20.85 | 11.28 | S | 0.37 | 0.06 | 2.640.25 |
| 1-248389 | 240.658051 | 41.293427 | 0.0348 | -19.36 | 10.57 | S | 0.49 | 0.12 | 2.550.09 |
| 1-321739 | 226.431656 | 44.404903 | 0.0283 | -18.91 | 11.12 | S | 0.40 | 0.14 | 2.240.10 |
| 1-234618 | 202.128433 | 47.714039 | 0.0608 | -19.64 | 11.37 | S | 0.31 | 0.09 | 2.230.23 |
| 1-229010 | 57.243038 | -1.144831 | 0.0407 | -20.51 | 11.46 | – | 0.41 | 0.03 | 2.110.09 |
| 1-211311 | 248.426392 | 39.185120 | 0.0298 | -19.04 | 10.44 | E/S | 0.43 | 0.02 | 1.990.06 |
| 1-373161 | 222.810074 | 30.692245 | 0.0547 | -21.30 | 11.60 | E | 0.43 | 0.00 | 1.870.11 |
| 1-210646 | 245.157181 | 41.466873 | 0.0606 | -20.38 | 10.98 | S | 0.18 | 0.05 | 1.800.10 |
| 1-351790 | 121.147926 | 50.708557 | 0.0227 | -18.09 | 9.92 | E | 0.39 | 0.02 | 1.720.03 |
| 1-163831 | 118.627846 | 25.815987 | 0.0631 | -20.84 | 11.26 | S | 0.27 | 0.05 | 1.670.13 |
| 1-22301 | 253.405563 | 63.031269 | 0.1052 | -21.19 | 11.18 | S | 0.29 | 0.08 | 1.670.23 |
| 1-248420 | 241.823395 | 41.403603 | 0.0346 | -19.71 | 10.90 | S | 0.21 | 0.07 | 1.660.06 |
| 1-23979 | 258.158752 | 57.322422 | 0.0266 | -18.27 | 10.42 | E | 0.44 | 0.06 | 1.600.05 |
| 1-542318 | 245.248306 | 49.001778 | 0.0582 | -19.75 | 10.91 | E | 0.34 | 0.01 | 1.580.07 |
| 1-95092 | 250.846420 | 39.806461 | 0.0302 | -19.95 | 11.20 | E | 0.47 | 0.04 | 1.540.07 |
| 1-279676 | 173.981888 | 48.021458 | 0.0587 | -19.40 | 10.81 | – | 0.32 | 0.02 | 1.520.14 |
| 1-201561 | 118.053215 | 28.772579 | 0.0637 | -19.73 | 10.88 | S | 0.30 | 0.07 | 1.370.15 |
| 1-198182 | 224.749649 | 48.409855 | 0.0359 | -20.22 | 11.09 | E | 0.49 | 0.01 | 1.340.11 |
| 1-96075 | 253.946381 | 39.310535 | 0.0631 | -21.12 | 11.35 | S | 0.29 | 0.07 | 1.260.13 |
| 1-519742 | 206.612457 | 22.076742 | 0.0276 | -17.62 | 9.64 | S | 0.23 | 0.04 | 1.190.03 |
| 1-491229 | 172.607544 | 22.216530 | 0.0393 | -20.25 | 11.12 | E | 0.51 | 0.02 | 1.140.11 |
| 1-604761 | 113.472275 | 37.025906 | 0.0618 | -20.92 | 11.34 | S | 0.26 | 0.12 | 1.000.13 |
| 1-25725 | 262.996735 | 59.971638 | 0.0291 | -18.30 | 10.55 | E | 0.44 | 0.04 | 0.920.05 |
| 1-94604 | 251.335938 | 42.757790 | 0.0493 | -19.44 | 10.52 | S | 0.37 | 0.01 | 0.860.07 |
| 1-37036 | 41.699909 | 0.421577 | 0.0283 | -19.02 | 10.66 | E | 0.40 | 0.09 | 0.840.06 |
| 1-167688 | 155.885559 | 46.057755 | 0.0258 | -17.86 | 9.75 | E | 0.52 | 0.04 | 0.840.02 |
| 1-279666 | 173.911240 | 47.515518 | 0.0455 | -18.83 | 10.42 | E | 0.31 | 0.02 | 0.840.07 |
| 1-339163 | 116.280205 | 46.072422 | 0.0312 | -20.02 | 10.97 | S | 0.30 | 0.10 | 0.820.07 |
| 1-258774 | 186.400864 | 45.083858 | 0.0384 | -19.60 | 10.77 | – | 0.55 | 0.03 | 0.770.10 |
| 1-198153 | 224.289078 | 48.633968 | 0.0354 | -19.83 | 11.00 | S | 0.27 | 0.07 | 0.760.08 |
| 1-91016 | 234.810974 | 56.670856 | 0.0463 | -18.60 | 10.56 | S | 0.27 | 0.06 | 0.760.09 |
| 1-279073 | 170.588150 | 46.430504 | 0.0323 | -19.53 | 10.79 | E | 0.51 | 0.01 | 0.630.06 |
| 1-135044 | 247.907990 | 41.493645 | 0.0303 | -19.76 | 10.65 | S | 0.31 | 0.05 | 0.610.04 |
| mangaID | RA | DEC | log | GZ1c | |||||
|---|---|---|---|---|---|---|---|---|---|
| (1) | (2) | (3) | (4) | (5) | (6) | (7) | (8) | (9) | (10) |
| 1-148068 | 156.805679 | 48.244793 | 0.0610 | -20.72 | 11.41 | S | 0.22 | 0.04 | 0.450.15 |
| 1-277552 | 167.034561 | 45.984623 | 0.0362 | -19.72 | 10.83 | S | 0.21 | 0.15 | 0.440.05 |
| 1-217050 | 136.719986 | 41.408253 | 0.0274 | -19.66 | 10.93 | E | 0.47 | 0.02 | 0.430.03 |
| 1-25554 | 262.486053 | 58.397408 | 0.0268 | -19.27 | 10.52 | S | 0.36 | 0.04 | 0.240.03 |
| 1-135285 | 247.216949 | 42.812012 | 0.0316 | -19.66 | 10.78 | – | 0.32 | 0.05 | 0.200.04 |
2.2 Control sample
We have extracted from MPL-5 a control sample of galaxies with properties matched to those of the AGN hosts, except that their nuclei are quiescent. The control sample was built as follows:
-
1.
First, we selected from MPL-5 all galaxies, presenting or not detectable emission lines, whose ionizing source is not an AGN (as discussed in sec. 2.1). We therefore consider a galaxy as a potential control sample candidate if it fulfills any one of these four conditions: (a) it is located, within the uncertainties, in the starforming region of the BPT diagram; (b) it is located, within the uncertainties, in the transition or LINER region of the BPT, but the WHAN diagram discards ionization from an AGN based on the value of EWH; (c) it presents a very large uncertainty in [OIII]/H, not allowing for a secure classification in the BPT diagram, but the WHAN diagram discards ionization from an AGN based on the value of EWH; (d) the galaxy does not present emission lines. These conditions make sure that galaxies with prominent emission lines are dominated by star formation, not by an active nucleus; the remaining objects are galaxies whose emission lines can be completely accounted for by hot evolved low-mass stars. Galaxies which fulfill any one of these conditions are considered inactive.
-
2.
We have then selected two control galaxies for each AGN, matching then according to the redshift and total stellar mass . A preliminary list of control sample candidates was drawn for each galaxy in the AGN sample by exploring the full parameter space for all inactive galaxies in MPL-5. Galaxies for which both and did not differ by more than from those of the AGN sample values were visually inspected, allowing for a large number of control objects to be selected while keeping low the dispersion of values in the parameter space. The number of control sample candidates selected at this point for each galaxy was typically 50 (with a larger/smaller number of candidates for galaxies at low/high redshift).
-
3.
The images of the control candidates for each galaxy in the AGN sample were then visually inspected to select control galaxies with similar morphologies and axial ratios to those of the AGN host galaxies. For late-type galaxies, we have tried to reproduce both the structure and development of the arms and the relative bulge size, as well as the line-of-sight orientation and the presence of dust lanes. The priority in the morphological analysis was given to structures closer to the nucleus; i.e., we have assigned more weight to the presence of bars and rings than to the morphology of the arms in the outer galaxy regions. During this step the number of potentially good candidates, i.e. galaxies which are morphologically comparable to the respective AGN host, decreased in many cases to only two galaxies. In order to produce the best statistical comparison with the AGN sample properties, keeping an homogeneous representation of all AGN hosts in the control sample, only the two galaxies which best matched the morphology of the AGN host, according to the above criteria, were chosen for each AGN in the sample.
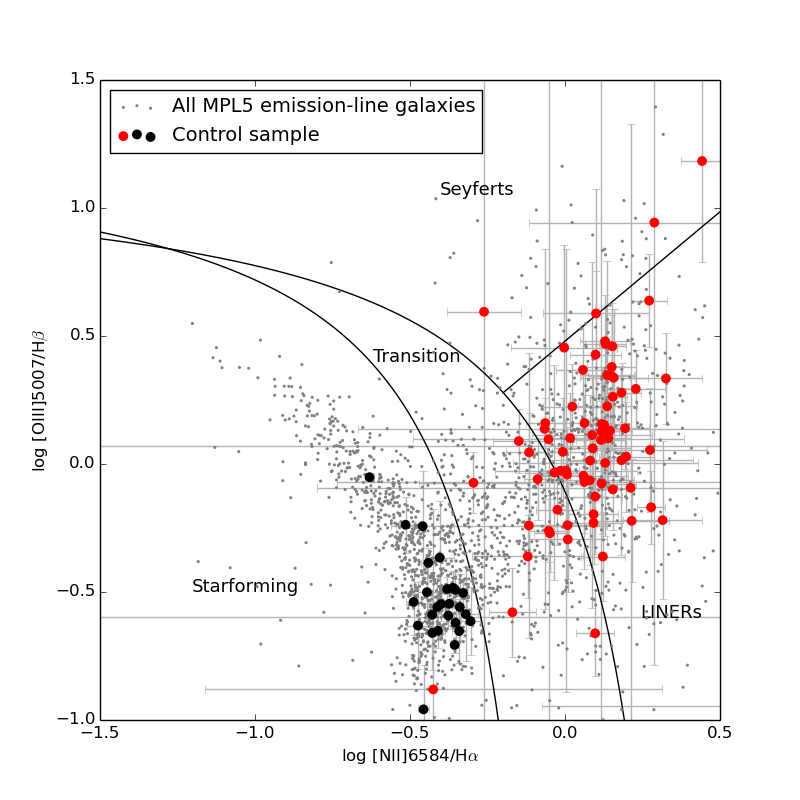
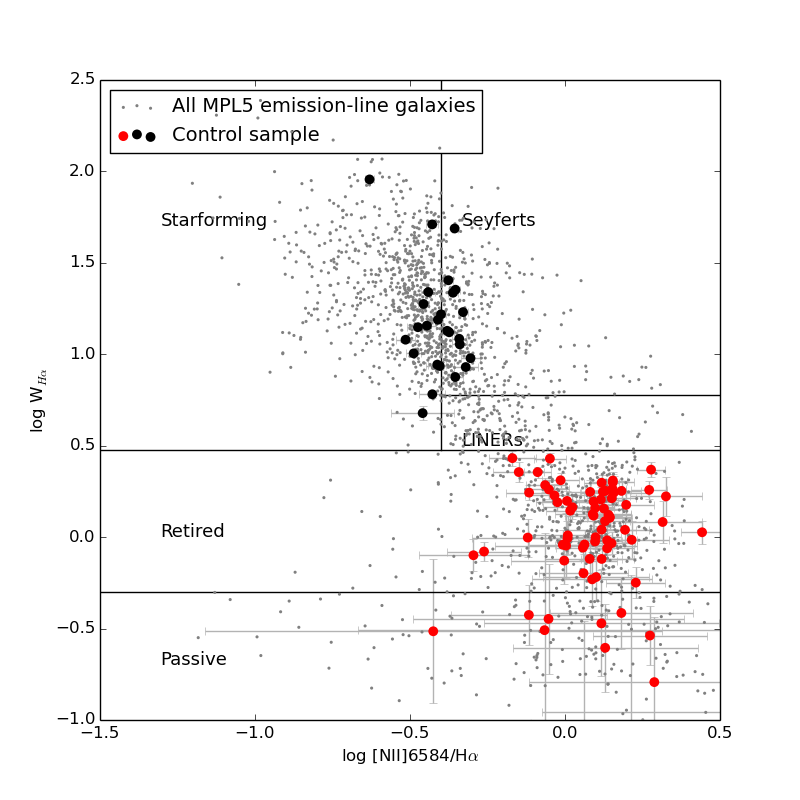
We have thus produced 124 pairs of AGN and control partners. Twelve of the control sample objects were selected as “control partners” of two or more AGN hosts simultaneously; therefore, our control sample comprises 109 non-active galaxies, reproducing the distribution of redshift and stellar mass of the AGN sample. Figures 2c and 2d present the BPT and WHAN diagrams for the control sample, superimposed on the distribution of the full MPL-5 sample. Six control sample galaxies did not present any emission lines, and thus do not apper in the figures. We can see a bimodal distribution with a clear separation between starforming galaxies and LIERs. Comparing with the diagrams shown in Figures 2a and 2b, we can see that AGN and non-AGN have markedly distinct distributions.
| AGN mangaID | mangaID | RA | DEC | log | GZ1c | |||||
|---|---|---|---|---|---|---|---|---|---|---|
| (1) | (2) | (3) | (4) | (5) | (6) | (7) | (8) | (9) | (10) | (11) |
| 1-558912 | 1-71481 | 117.456001 | 34.883911 | 0.1312 | -20.95 | 11.70 | E | 0.47 | 0.02 | 0.100.20 |
| 1-72928 | 127.256485 | 45.016773 | 0.1270 | -20.62 | 11.52 | E | 0.40 | 0.21 | 0.090.23 | |
| 1-269632 | 1-210700 | 248.140564 | 39.131020 | 0.1303 | -20.96 | 11.67 | S | 0.36 | 0.03 | 1.550.44 |
| 1-378795 | 118.925613 | 50.172771 | 0.0967 | -20.77 | 11.35 | S | 0.32 | 0.03 | 0.720.31 | |
| 1-258599 | 1-93876 | 246.942947 | 44.177521 | 0.1394 | -20.75 | 11.50 | E | 0.44 | 0.01 | 0.460.36 |
| 1-166691 | 146.047348 | 42.900040 | 0.1052 | -20.50 | 11.36 | E | 0.51 | 0.04 | 0.090.49 | |
| 1-72322 | 1-121717 | 118.803429 | 35.596798 | 0.1098 | -21.11 | 11.61 | S | 0.39 | 0.12 | 1.400.57 |
| 1-43721 | 116.967567 | 43.383499 | 0.1114 | -21.41 | 11.86 | S | 0.32 | 0.01 | 1.910.52 | |
| 1-121532 | 1-218427 | 124.342316 | 27.796206 | 0.1496 | -21.30 | 11.47 | E | 0.47 | 0.04 | 0.720.62 |
| 1-177493 | 257.085754 | 31.746916 | 0.1081 | -20.90 | 11.30 | E | 0.38 | 0.06 | 2.290.28 | |
| 1-209980 | 1-295095 | 248.348663 | 24.776577 | 0.0410 | -18.40 | 10.14 | E | 0.35 | 0.05 | 0.150.03 |
| 1-92626 | 241.799545 | 48.572563 | 0.0434 | -20.04 | 11.04 | S | 0.36 | 0.03 | 0.760.07 | |
| 1-44379 | 1-211082 | 247.620041 | 39.626045 | 0.0304 | -19.72 | 11.07 | E | 0.31 | 0.06 | 0.190.04 |
| 1-135371 | 250.156235 | 39.221634 | 0.0352 | -19.20 | 10.76 | S | 0.28 | 0.11 | 0.250.07 | |
| 1-149211 | 1-377321 | 110.556152 | 42.183643 | 0.0444 | -19.02 | 9.89 | S | 0.31 | 0.03 | 4.530.13 |
| 1-491233 | 172.563995 | 22.992010 | 0.0332 | -18.39 | 10.59 | S | 0.29 | 0.06 | 0.250.03 | |
| 1-173958 | 1-247456 | 232.823196 | 45.416538 | 0.0705 | -20.05 | 10.83 | – | 0.40 | 0.02 | 0.570.16 |
| 1-24246 | 264.840790 | 56.567070 | 0.0818 | -19.91 | 10.57 | S | 0.75 | 0.36 | 0.110.06 | |
| 1-338922 | 1-286804 | 211.904861 | 44.482269 | 0.1429 | -20.03 | 10.50 | M | 0.44 | 0.32 | 2.230.43 |
| 1-109493 | 56.425140 | -0.378460 | 0.1093 | -20.46 | 11.26 | – | 0.49 | -0.01 | 0.150.18 | |
| 1-279147 | 1-283246 | 191.078873 | 46.407131 | 0.0496 | -19.17 | 10.55 | S | 0.47 | 0.04 | 0.230.06 |
| 1-351538 | 119.145126 | 47.563850 | 0.0692 | -19.67 | 11.00 | S | 0.35 | 0.08 | 0.460.13 | |
| 1-460812 | 1-270160 | 248.274612 | 26.211815 | 0.0660 | -20.37 | 11.46 | S | 0.50 | 0.02 | 0.700.39 |
| 1-258455 | 183.612198 | 45.195454 | 0.0653 | -20.02 | 11.03 | E | 0.40 | 0.03 | 0.490.14 | |
| 1-92866 | 1-94514 | 248.241180 | 42.524670 | 0.0614 | -20.60 | 11.17 | E | 0.51 | 0.00 | – |
| 1-210614 | 244.501755 | 41.392189 | 0.0612 | -20.64 | 11.48 | E | 0.49 | 0.01 | 0.400.14 | |
| 1-94784 | 1-211063 | 247.058411 | 40.313835 | 0.0331 | -19.87 | 10.79 | S | 0.33 | 0.09 | 0.200.04 |
| 1-135502 | 247.764175 | 39.838505 | 0.0305 | -19.51 | 11.13 | S | 0.40 | 0.09 | 0.500.05 | |
| 1-44303 | 1-339028 | 116.097923 | 44.527740 | 0.0497 | -20.01 | 11.24 | S | 0.36 | 0.06 | 0.440.08 |
| 1-379087 | 119.910118 | 51.792362 | 0.0534 | -19.60 | 11.02 | S | 0.38 | 0.10 | 0.720.13 | |
| 1-339094 | 1-274646 | 158.017029 | 43.859268 | 0.0284 | -18.70 | 10.36 | E | 0.53 | 0.02 | 0.350.04 |
| 1-24099 | 258.027618 | 57.504009 | 0.0282 | -18.67 | 10.34 | E | 0.44 | 0.01 | 0.060.03 | |
| 1-137883 | 1-178838 | 312.023621 | 0.068841 | 0.0247 | -17.54 | 10.46 | – | 0.51 | 0.19 | 0.100.02 |
| 1-36878 | 42.542126 | -0.867116 | 0.0232 | -18.88 | 10.77 | E | 0.45 | 0.07 | 0.280.04 | |
| 1-48116 | 1-386452 | 136.228333 | 28.384314 | 0.0269 | -19.54 | 10.57 | S | 0.49 | 0.09 | 0.320.04 |
| 1-24416 | 263.033173 | 56.878746 | 0.0281 | -19.16 | 10.66 | S | 0.37 | 0.03 | 0.220.03 | |
| 1-256446 | 1-322671 | 235.797028 | 39.238773 | 0.0637 | -19.77 | 10.82 | E | 0.49 | 0.04 | – |
| 1-256465 | 166.752243 | 43.089901 | 0.0575 | -19.70 | 10.79 | E | 0.50 | 0.01 | 0.590.11 | |
| 1-95585 | 1-166947 | 147.335007 | 43.442989 | 0.0720 | -20.79 | 10.81 | S | 0.29 | 0.02 | 0.130.08 |
| 1-210593 | 244.419754 | 41.899155 | 0.0605 | -19.76 | 10.90 | S | 0.36 | 0.06 | 0.430.14 | |
| 1-135641 | 1-635503 | 318.990448 | 9.543076 | 0.0293 | -19.37 | 10.91 | S | 0.22 | 0.10 | 0.150.06 |
| 1-235398 | 213.149185 | 47.253059 | 0.0281 | -18.91 | 10.99 | S | 0.28 | 0.10 | 0.160.05 | |
| 1-259142 | 1-55572 | 133.121307 | 56.112690 | 0.0454 | -20.11 | 11.03 | S | 0.40 | 0.06 | 0.120.04 |
| 1-489649 | 171.954834 | 21.386103 | 0.0406 | -19.94 | 10.95 | S | 0.40 | 0.03 | 0.300.08 | |
| 1-109056 | 1-73005 | 125.402306 | 45.585476 | 0.0514 | -19.47 | 10.65 | S | 0.31 | 0.05 | 0.200.06 |
| 1-43009 | 113.553879 | 39.076836 | 0.0510 | -19.41 | 10.43 | S | 0.26 | 0.03 | 0.120.04 | |
| 1-24148 | 1-285031 | 198.701370 | 47.351547 | 0.0303 | -18.47 | 10.72 | S | 0.34 | 0.05 | 0.260.04 |
| 1-236099 | 225.236221 | 41.566265 | 0.0205 | -17.36 | 9.91 | S | 0.33 | 0.04 | 0.070.01 | |
| 1-166919 | 12-129446 | 203.943542 | 26.101791 | 0.0670 | -20.57 | 11.32 | S | 0.34 | 0.03 | 0.280.09 |
| 1-90849 | 237.582748 | 56.131981 | 0.0661 | -20.39 | 11.16 | E | 0.30 | 0.04 | 0.280.05 | |
| 1-248389 | 1-94554 | 248.914688 | 42.461296 | 0.0318 | -18.96 | 10.57 | S | 0.55 | 0.07 | 0.220.04 |
| 1-245774 | 214.863297 | 54.100300 | 0.0426 | -20.22 | 10.83 | S | 0.40 | 0.08 | 0.290.07 | |
| 1-321739 | 1-247417 | 233.319382 | 45.698528 | 0.0294 | -19.25 | 10.76 | S | 0.28 | 0.09 | 0.160.04 |
| 1-633994 | 247.419952 | 40.686954 | 0.0305 | -18.27 | 11.04 | S | 0.39 | 0.11 | 0.360.09 | |
| 1-234618 | 1-282144 | 184.592514 | 46.155350 | 0.0492 | -18.92 | 10.31 | S | 0.21 | 0.08 | 0.100.02 |
| 1-339125 | 117.739944 | 45.989529 | 0.0534 | -18.97 | 11.17 | S | 0.35 | 0.05 | 0.450.23 | |
| 1-229010 | 1-210962 | 246.358719 | 39.870697 | 0.0290 | -20.49 | 11.09 | S | 0.47 | 0.07 | 0.350.06 |
| 1-613211 | 167.861847 | 22.970764 | 0.0323 | -19.87 | 11.32 | E | 0.48 | 0.04 | 0.160.06 |
| AGN mangaID | mangaID | RA | DEC | log | GZ1c | |||||
|---|---|---|---|---|---|---|---|---|---|---|
| (1) | (2) | (3) | (4) | (5) | (6) | (7) | (8) | (9) | (10) | (11) |
| 1-211311 | 1-25688 | 261.284851 | 58.764687 | 0.0292 | -18.79 | 10.32 | S | 0.29 | 0.06 | 0.100.02 |
| 1-94422 | 250.453201 | 41.818737 | 0.0316 | -19.15 | 10.55 | S | 0.37 | 0.05 | 0.240.03 | |
| 1-373161 | 1-259650 | 196.611053 | 45.289001 | 0.0509 | -21.07 | 11.68 | E | 0.44 | 0.06 | 0.670.20 |
| 1-289865 | 322.048584 | 0.299885 | 0.0525 | -20.90 | 11.35 | – | 0.49 | 0.02 | 0.110.09 | |
| 1-210646 | 1-114306 | 323.742737 | 11.296529 | 0.0637 | -20.58 | 10.83 | S | 0.26 | 0.05 | 0.330.16 |
| 1-487130 | 164.447296 | 21.233431 | 0.0587 | -20.47 | 10.86 | S | 0.26 | 0.11 | 0.270.10 | |
| 1-351790 | 1-23731 | 260.746704 | 60.559292 | 0.0205 | -18.20 | 10.19 | E | 0.40 | 0.02 | 0.020.01 |
| 1-167334 | 151.894836 | 46.093983 | 0.0243 | -18.89 | 10.60 | E | 0.43 | 0.04 | 0.470.05 | |
| 1-163831 | 1-247456 | 232.823196 | 45.416538 | 0.0705 | -20.05 | 10.83 | – | 0.40 | 0.02 | 0.570.16 |
| 1-210593 | 244.419754 | 41.899155 | 0.0605 | -19.76 | 10.90 | S | 0.36 | 0.06 | 0.430.14 | |
| 1-22301 | 1-251871 | 214.506760 | 41.827644 | 0.1027 | -21.17 | 11.68 | S | 0.26 | 0.05 | 0.240.18 |
| 1-72914 | 127.580818 | 45.075867 | 0.0970 | -20.88 | 11.31 | S | 0.23 | 0.08 | 0.130.07 | |
| 1-248420 | 1-211063 | 247.058411 | 40.313835 | 0.0331 | -19.87 | 10.79 | S | 0.33 | 0.09 | 0.200.04 |
| 1-211074 | 247.462692 | 39.766510 | 0.0318 | -19.71 | 10.79 | S | 0.30 | 0.18 | 0.200.04 | |
| 1-23979 | 1-320681 | 213.813095 | 47.873344 | 0.0279 | -18.76 | 10.77 | E | 0.48 | 0.01 | 0.090.07 |
| 1-519738 | 206.514709 | 22.118843 | 0.0277 | -19.49 | 10.73 | E | 0.45 | 0.03 | 0.110.04 | |
| 1-542318 | 1-285052 | 199.061493 | 47.599365 | 0.0573 | -19.77 | 10.85 | S | 0.32 | 0.04 | 0.110.03 |
| 1-377125 | 112.221359 | 41.307812 | 0.0585 | -19.67 | 10.84 | S | 0.41 | 0.02 | 0.570.14 | |
| 1-95092 | 1-210962 | 246.358719 | 39.870697 | 0.0290 | -20.49 | 11.09 | S | 0.47 | 0.07 | 0.350.06 |
| 1-251279 | 209.251984 | 43.362034 | 0.0329 | -20.11 | 10.97 | E | 0.47 | 0.04 | 0.370.06 | |
| 1-279676 | 1-44789 | 120.890366 | 47.892406 | 0.0586 | -19.33 | 10.92 | – | 0.31 | 0.13 | 0.320.09 |
| 1-378401 | 117.904335 | 48.000526 | 0.0612 | -19.65 | 11.02 | E | 0.41 | 0.02 | 0.570.14 | |
| 1-201561 | 1-24246 | 264.840790 | 56.567070 | 0.0818 | -19.91 | 10.57 | S | 0.75 | 0.36 | 0.110.06 |
| 1-285052 | 199.061493 | 47.599365 | 0.0573 | -19.77 | 10.85 | S | 0.32 | 0.04 | 0.110.03 | |
| 1-198182 | 1-256185 | 165.568695 | 44.271709 | 0.0370 | -20.00 | 11.03 | E | 0.50 | 0.06 | 0.250.04 |
| 1-48053 | 132.595016 | 55.378742 | 0.0308 | -20.24 | 11.49 | E | 0.50 | 0.01 | – | |
| 1-96075 | 1-166947 | 147.335007 | 43.442989 | 0.0720 | -20.79 | 10.81 | S | 0.29 | 0.02 | 0.130.08 |
| 1-52259 | 59.411037 | -6.274680 | 0.0678 | -20.69 | 11.12 | S | 0.23 | 0.07 | 0.300.09 | |
| 1-519742 | 1-37079 | 42.092335 | 0.986465 | 0.0274 | -17.25 | 9.55 | E | 0.27 | 0.02 | 0.020.01 |
| 1-276679 | 161.272629 | 44.054291 | 0.0253 | -18.27 | 10.10 | S | 0.24 | 0.03 | 0.050.01 | |
| 1-491229 | 1-94554 | 248.914688 | 42.461296 | 0.0318 | -18.96 | 10.57 | S | 0.55 | 0.07 | 0.220.04 |
| 1-604048 | 50.536137 | -0.836265 | 0.0365 | -20.37 | 10.91 | S | 0.42 | 0.09 | 0.390.08 | |
| 1-604761 | 1-210173 | 241.341766 | 42.488312 | 0.0778 | -20.71 | 11.10 | S | 0.33 | 0.07 | 0.520.13 |
| 1-71525 | 118.344856 | 36.274380 | 0.0457 | -20.17 | 10.97 | S | 0.27 | 0.10 | 0.190.06 | |
| 1-25725 | 1-211079 | 247.438034 | 39.810539 | 0.0304 | -18.97 | 10.54 | E | 0.54 | 0.01 | 0.030.04 |
| 1-322074 | 228.700729 | 43.665970 | 0.0274 | -18.15 | 10.10 | E | 0.45 | 0.02 | – | |
| 1-94604 | 1-295095 | 248.348663 | 24.776577 | 0.0410 | -18.40 | 10.14 | E | 0.35 | 0.05 | 0.150.03 |
| 1-134239 | 241.416443 | 46.846561 | 0.0571 | -19.83 | 10.70 | S | 0.36 | 0.04 | 0.230.06 | |
| 1-37036 | 1-210785 | 246.765076 | 39.527386 | 0.0338 | -20.22 | 10.97 | E | 0.47 | 0.01 | – |
| 1-25680 | 261.968872 | 60.097275 | 0.0278 | -19.41 | 10.84 | E | 0.52 | 0.02 | 0.340.04 | |
| 1-167688 | 1-235587 | 214.854660 | 45.864250 | 0.0267 | -18.88 | 10.48 | E | 0.44 | 0.01 | 0.080.02 |
| 1-37062 | 41.846367 | 0.058757 | 0.0248 | -18.30 | 10.40 | E | 0.49 | 0.03 | 0.270.03 | |
| 1-279666 | 1-392976 | 156.428894 | 37.497524 | 0.0432 | -17.91 | 10.09 | E | 0.37 | 0.02 | 0.100.03 |
| 1-47499 | 132.037582 | 54.309921 | 0.0461 | -18.53 | 10.51 | E | 0.27 | 0.04 | 0.150.06 | |
| 1-339163 | 1-136125 | 254.044144 | 34.836521 | 0.0316 | -19.33 | 10.50 | S | 0.25 | 0.09 | 0.080.02 |
| 1-626830 | 204.683838 | 26.328539 | 0.0282 | -19.23 | 10.67 | S | 0.28 | 0.07 | 0.150.04 | |
| 1-258774 | 1-379660 | 119.973717 | 55.374817 | 0.0357 | -19.44 | 10.74 | E | 0.47 | 0.03 | 0.370.07 |
| 1-48208 | 134.008118 | 57.390965 | 0.0406 | -19.57 | 10.85 | S | 0.50 | 0.01 | 0.120.04 | |
| 1-198153 | 1-211063 | 247.058411 | 40.313835 | 0.0331 | -19.87 | 10.79 | S | 0.33 | 0.09 | 0.200.04 |
| 1-135810 | 250.123138 | 39.235115 | 0.0297 | -19.38 | 10.59 | S | 0.24 | 0.09 | 0.080.02 | |
| 1-91016 | 1-338828 | 115.641609 | 44.215858 | 0.0418 | -18.10 | 10.42 | S | 0.28 | 0.03 | 0.430.05 |
| 1-386695 | 137.983505 | 27.899269 | 0.0474 | -19.33 | 10.48 | S | 0.27 | 0.09 | 0.810.09 | |
| 1-279073 | 1-211100 | 247.830322 | 39.744129 | 0.0309 | -19.15 | 10.62 | E | 0.56 | 0.02 | – |
| 1-210784 | 247.097122 | 39.570305 | 0.0292 | -19.61 | 10.86 | E | 0.48 | 0.00 | 0.150.05 | |
| 1-135044 | 1-218280 | 124.003311 | 27.075895 | 0.0255 | -19.57 | 10.81 | S | 0.27 | 0.08 | 0.120.03 |
| 1-211063 | 247.058411 | 40.313835 | 0.0331 | -19.87 | 10.79 | S | 0.33 | 0.09 | 0.200.04 | |
| 1-148068 | 1-166947 | 147.335007 | 43.442989 | 0.0720 | -20.79 | 10.81 | S | 0.29 | 0.02 | 0.130.08 |
| 1-55572 | 133.121307 | 56.112690 | 0.0454 | -20.11 | 11.03 | S | 0.40 | 0.06 | 0.120.04 |
| AGN mangaID | mangaID | RA | DEC | log | GZ1c | |||||
|---|---|---|---|---|---|---|---|---|---|---|
| (1) | (2) | (3) | (4) | (5) | (6) | (7) | (8) | (9) | (10) | (11) |
| 1-277552 | 1-264513 | 236.941513 | 28.641697 | 0.0333 | -20.92 | 11.28 | S | 0.25 | 0.18 | 0.330.05 |
| 1-136125 | 254.044144 | 34.836521 | 0.0316 | -19.33 | 10.50 | S | 0.25 | 0.09 | 0.080.02 | |
| 1-217050 | 1-135372 | 250.116714 | 39.320118 | 0.0301 | -20.29 | 11.08 | E | 0.49 | 0.02 | 0.010.23 |
| 1-274663 | 157.660522 | 44.012722 | 0.0280 | -19.88 | 11.00 | E | 0.50 | 0.01 | 0.080.02 | |
| 1-25554 | 1-135625 | 248.507462 | 41.347946 | 0.0284 | -19.06 | 10.56 | S | 0.43 | 0.05 | 0.560.04 |
| 1-216958 | 136.200287 | 40.591721 | 0.0270 | -18.95 | 10.41 | S | 0.51 | 0.03 | 0.230.02 | |
| 1-135285 | 1-633990 | 247.304123 | 41.150871 | 0.0296 | -19.06 | 10.46 | S | 0.34 | 0.03 | 0.250.03 |
| 1-25688 | 261.284851 | 58.764687 | 0.0292 | -18.79 | 10.32 | S | 0.29 | 0.06 | 0.100.02 |
3 Stellar populations
In order to characterize the stellar population of the inner arcsec2 of the galaxies, we performed stellar population synthesis using the starlight code, developed by Cid Fernandes et al. (2005). This code combines, in different proportions, single stellar populations (SSPs) in order to reproduce a galaxy observed spectrum – excluding emission lines –, , with a model spectrum, . Each combination is found by solving the equation
| (1) |
were is the reddened spectrum of the -th SSP normalized at ; is the reddening term; is the synthetic flux at the normalisation wavelength; is the population vector. The symbol denotes the convolution operator and is the Gaussian distribution used to model the line-of-sight stellar motions; it is centred at velocity with dispersion . The reddening law we have used is that presented by Cardelli, Clayton & Mathis (1989). The adopted normalization wavelength was =5700Å. This wavelength, usually selected to avoid emission and absorption features, is similar to those adopted on other spectral synthesis studies, allowing a comparison of our results with previous ones.
The best fit model is determined by minimizing (through a simulated annealing plus Metropolis scheme) the equation
| (2) |
where emission lines and spurious features are masked by assigning =0 to these regions.
The spectral basis comprise the “standard" 45 elements set, which is a sample of the Evolutionary Population Synthesis models presented by Bruzual & Charlot (2003). It covers 15 ages: 0.001, 0.0031, 0.005, 0.01, 0.025, 0.04, 0.10, 0.28, 0.64, 0.94, 1.43, 2.5, 5.0, 11.0, 13.0 Gyr, and three different metallicities: .
Since we are fitting the spectra of AGN, the signature of the central engine cannot be ignored. This component was represented by a featureless continuum (FC) of power-law form that follows the expression (see Koski et al., 1978; Riffel et al., 2009, for example).
3.1 Results for the stellar population
Running the STARLIGHT code allows the measurement of the relative contribution of each SSP vector, characterized by age and metallicity, to the total stellar light at 5700Å () and its corresponding contribution to the total stellar mass (), that are the main quantities required to characterize the star formation history of the center of these galaxies. The individual contribution of each SSP allows the derivation of the contribution of the main age and metallicity components to the total flux at 5700Å, although there are other parameters that globally represent the age and metallicity of the stars: the mean light-weighted and mass-weighted ages ( and ) and the light-weighted and mass-weighted metallicities ( and , Cid Fernandes et al., 2005). The mean age, weighted by light and mass are, respectively, given by
| (3) |
and the mean metallicities, weighted by light and mass, are expressed by
| (4) |
respectively.
A strong contribution of one single SP age tends to be spread over different SSP components of similar ages (Cid Fernandes et al., 2001); thus, one must be must be careful interpreting a single SSP component. In order to obtain a more robust and reliable description of the SFH, the SSPs are usually grouped in age bins (e.g. Dametto et al., 2014), which we have chosen as follows: young-young: ( yr), young-old: ( yr), intermediate-young: ( yr), intermediate-intermediate: ( yr), intermediate-old: ( yr) and old: ( yr).
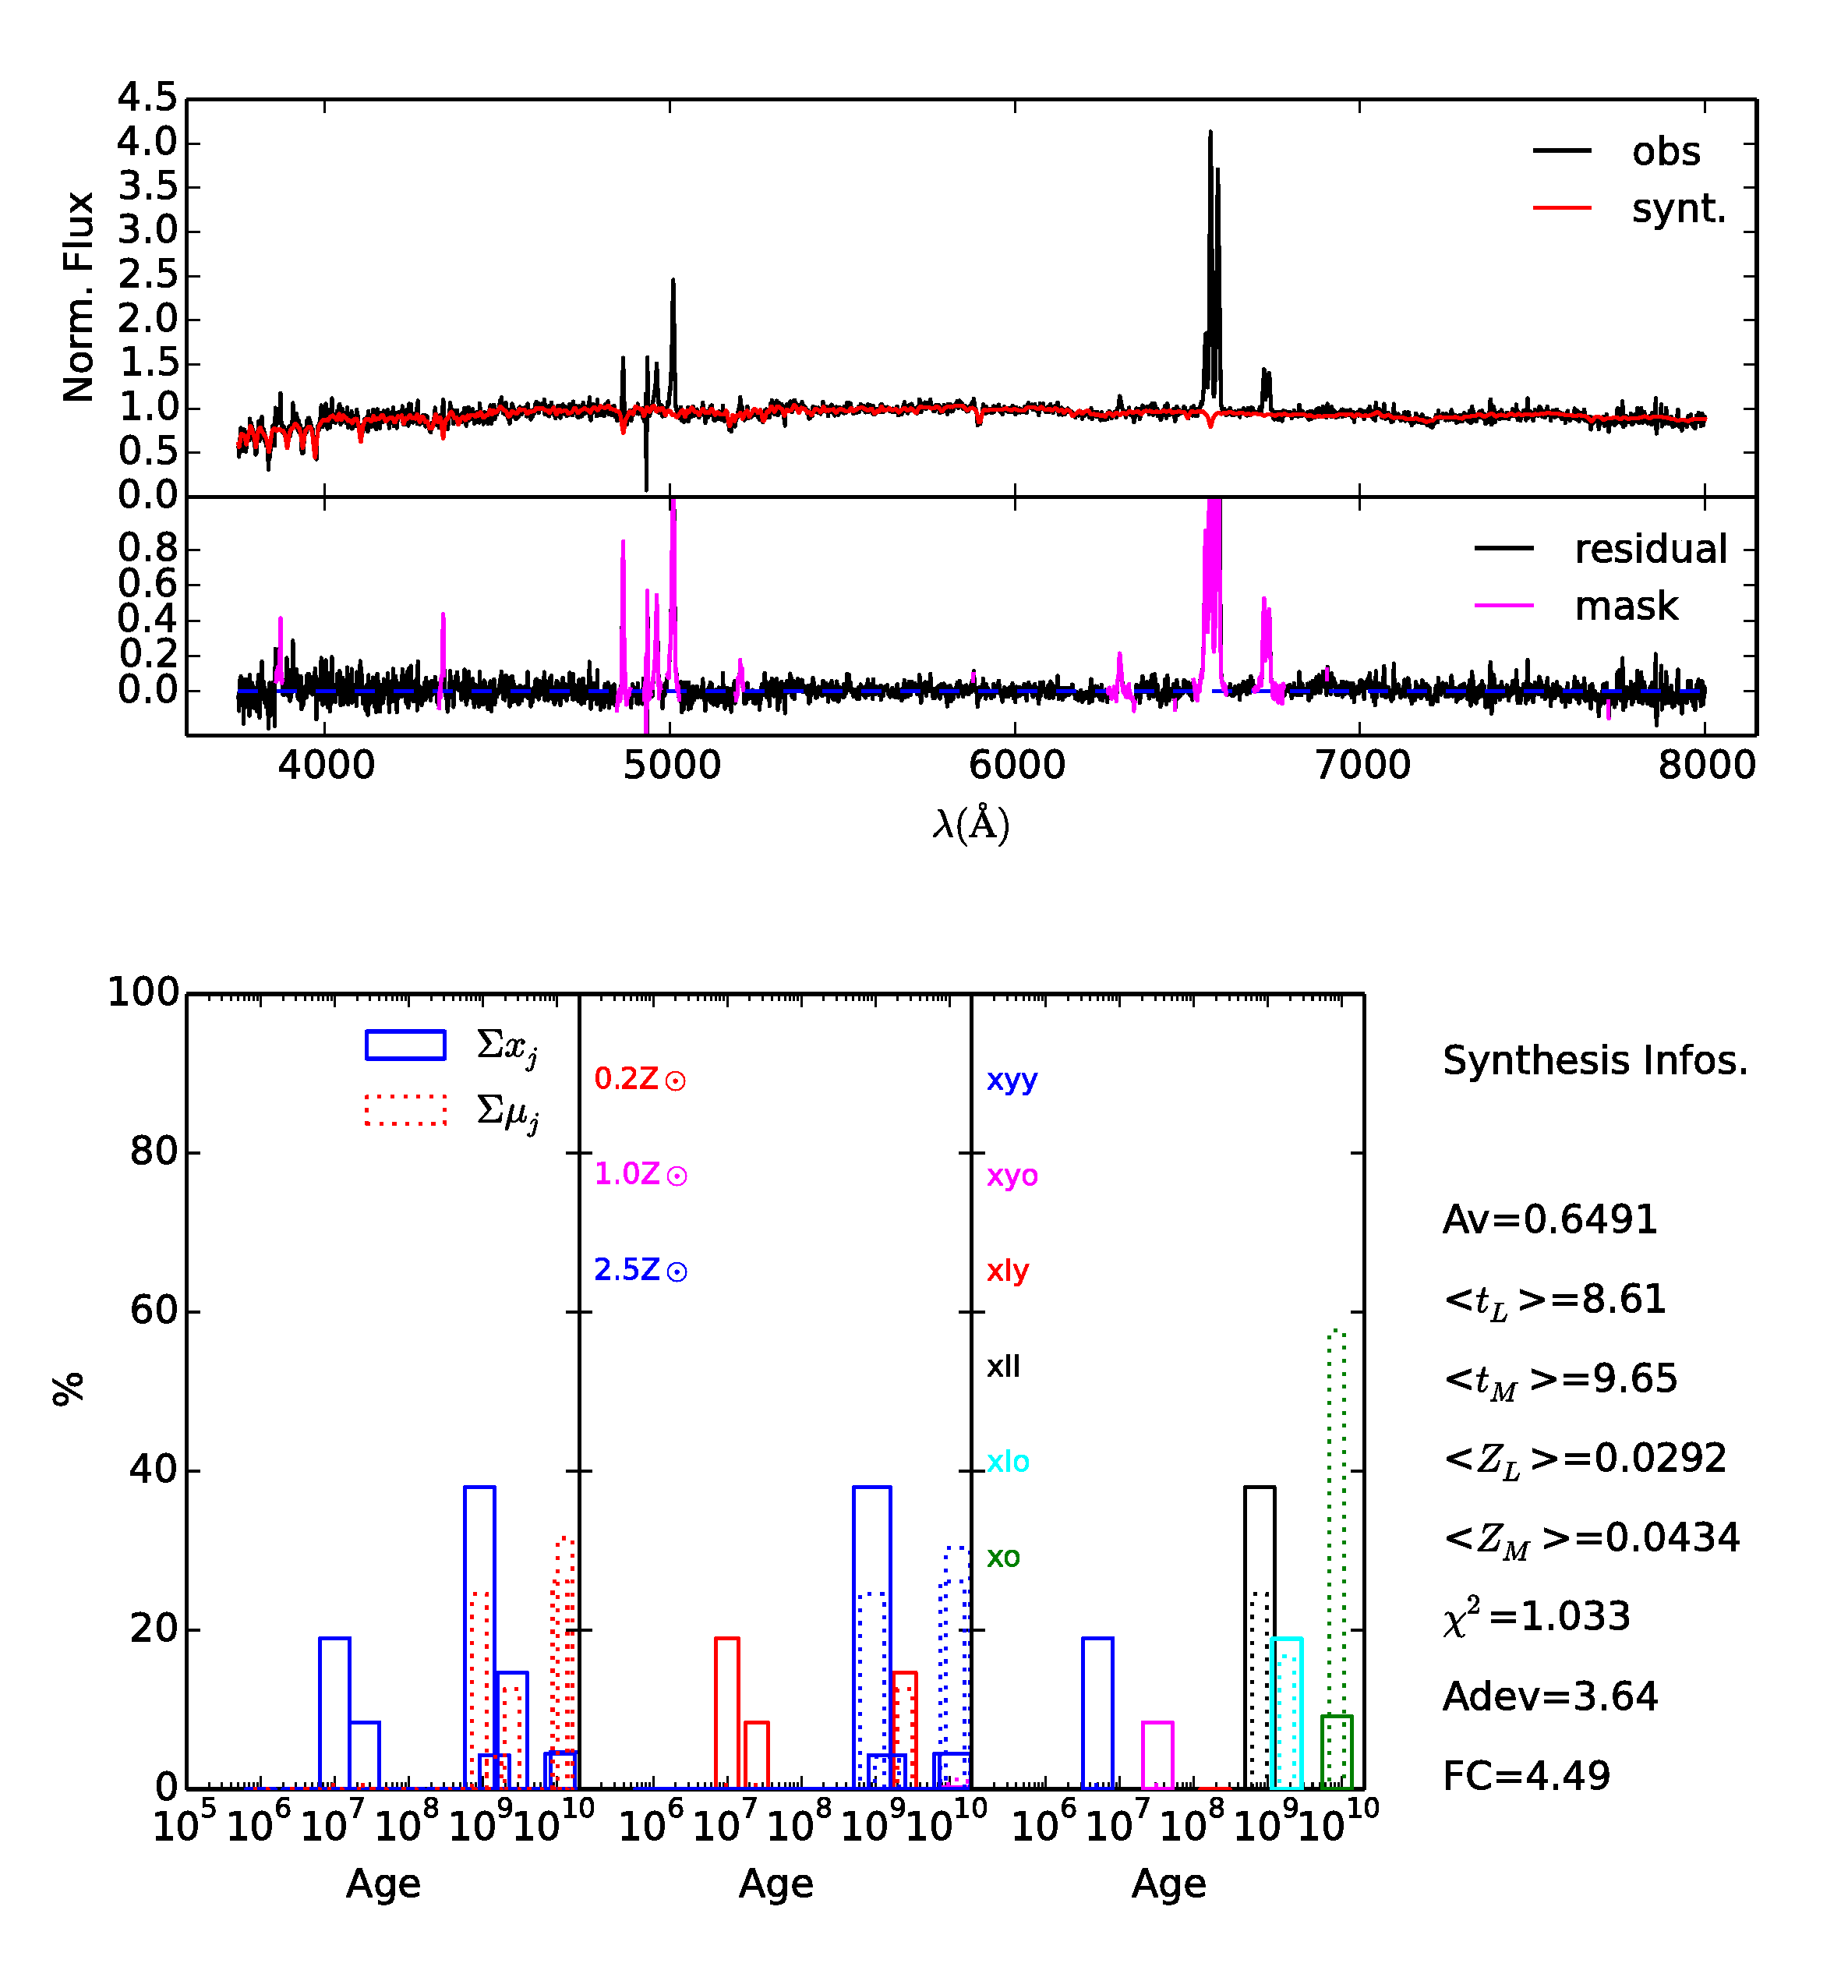
Figure 3 presents an example of the results of the stellar population synthesis for the strong AGN mangaID 1-269632. The upper panels show the observed and synthetic spectrum as well as the corresponding residuals; the bottom panels display the resulting light (percent contribution of each age bin above to the light at 5700Å) and mass contributions of single and binned SSPs vectors. Also shown are the mean ages and metallicities. The inner 3.7 kpc of this galaxy is dominated by the contribution of intermediate age stars ( and ) with old stars contributing and young stars , which implies that at least one episode of star formation has occurred in the last 10 Myr. Tables with the synthesis results for all galaxies, both for the AGN and control samples, showing the contribution of the six age bins listed above (both in percent flux at 5700Å and in mass) are presented in the Appendix.
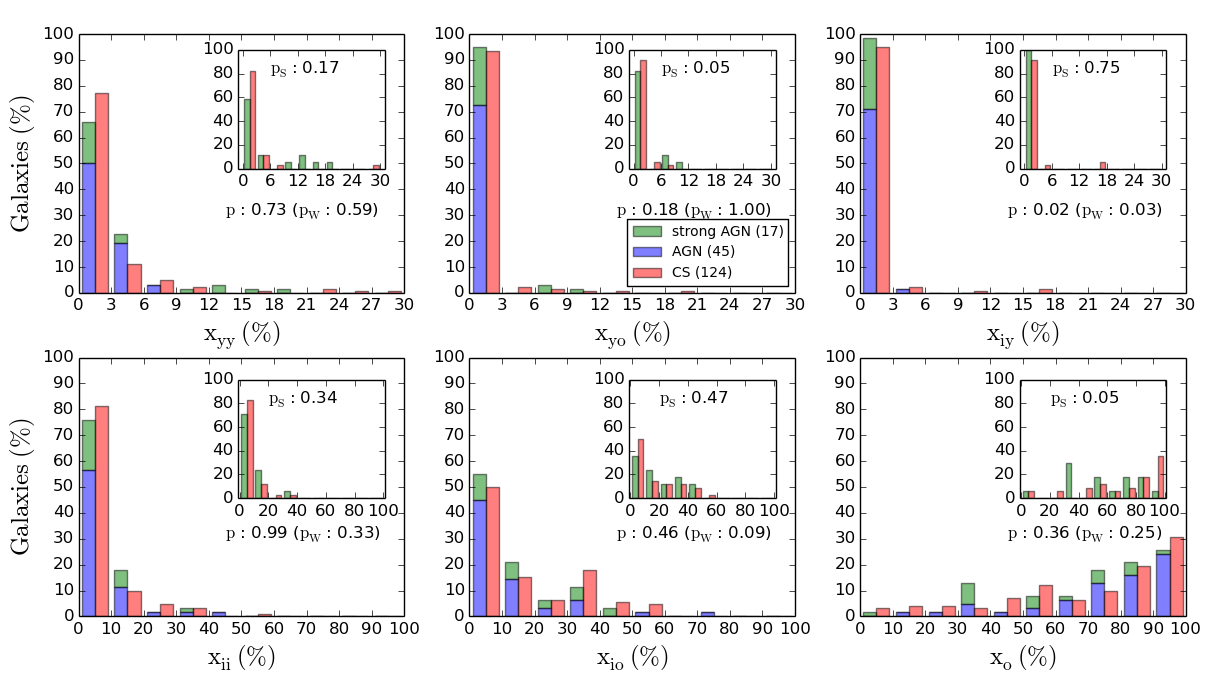
Figure 6 summarizes the results from the synthesis in histograms of the percent contribution of each age bin to the continuum at 5700Å. The results for the AGN sample are shown in blue for the “weak AGN” ( erg s-1), in green for the strong AGN and red for the control sample. In these histograms, we have chosen to present the results in bins of 10% for the 3 oldest age ranges and in bins of 3% for the three youngest ages ranges. We have adopted these smaller bins for the youngest ages to better sample the age distributions, as these ages never contribute more than 30% to the total flux at 5700Å, allowing to restrict the -axis to a maximum contribution of 30%.
4 Discussion
4.1 Comparison between the AGN hosts and control sample
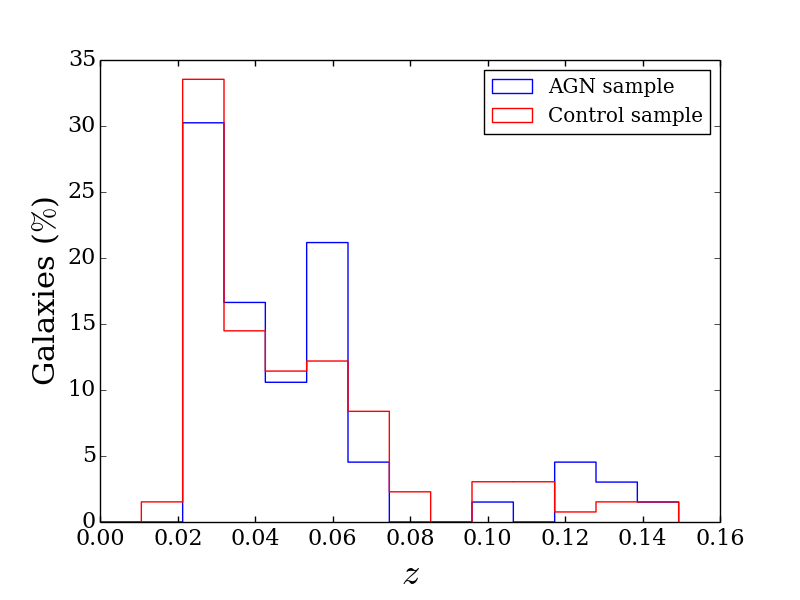
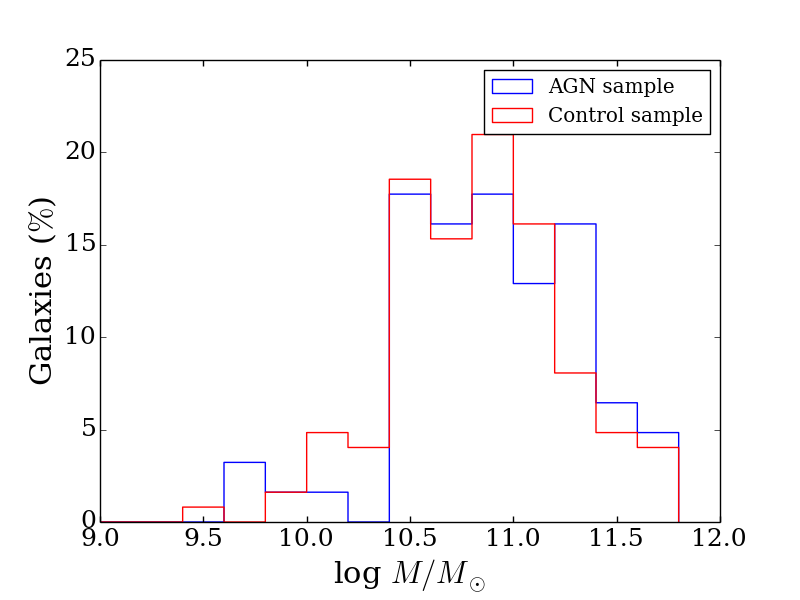
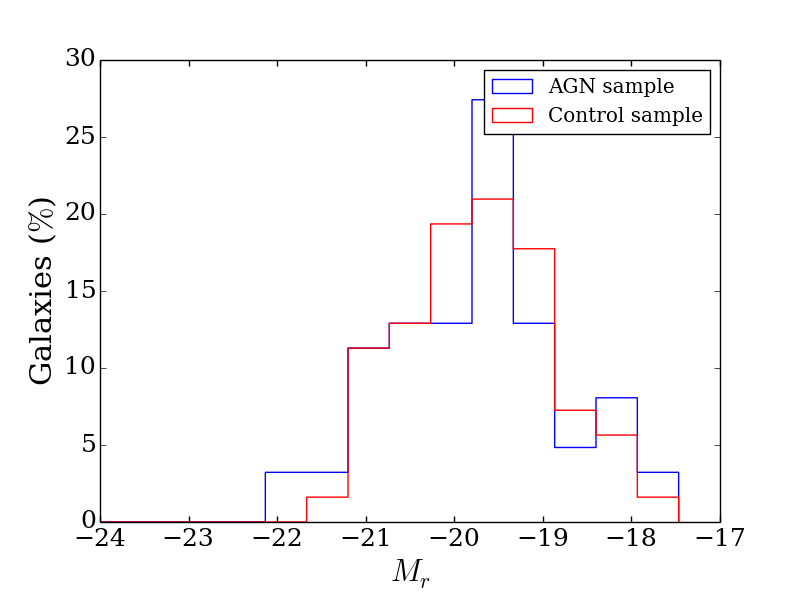
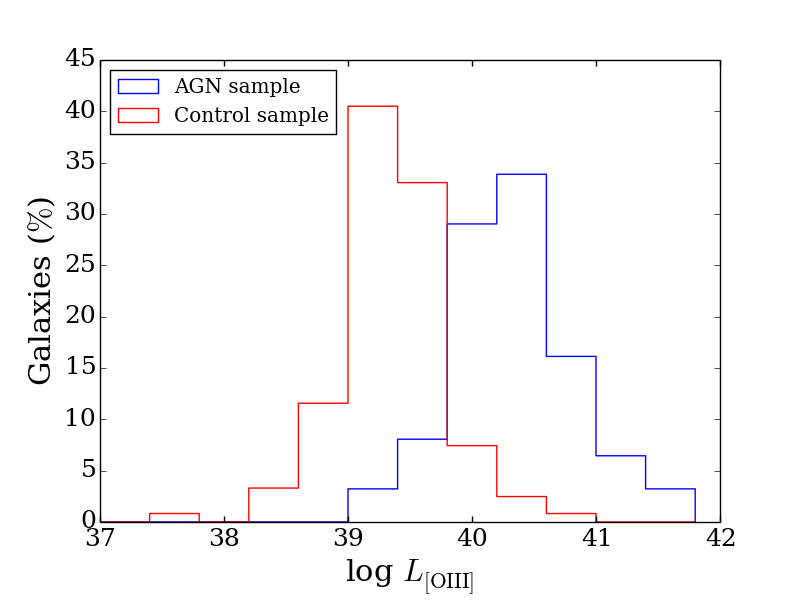
After selecting the control sample objects according to the criteria described in Sect. 2.2, we now check if the resulting distribution of stellar masses and redshifts are indeed compatible with that of the AGN hosts. In Figure 4 we show the distributions of stellar mass, -band absolute magnitude and redshifts of the AGN sample and the control sample. The distributions of stellar mass and -band absolute magnitude of the two samples are very similar. The probability that these distributions for the AGN and non-AGN galaxies are not drawn from the same distribution is less than 5 per cent as indicated by an Anderson-Darling test (hereafter A-D test). Regarding the redshift distribution, the two samples are also similar; the statistical significance of the A-D test is lower (16 per cent), but this is not critical to our analysis. The only significant difference observed in Figure 4 is for the distribution of the [OIII] luminosity , as expected: while the centroid of the distribution for the AGN sample is , for the control sample the centroid is .
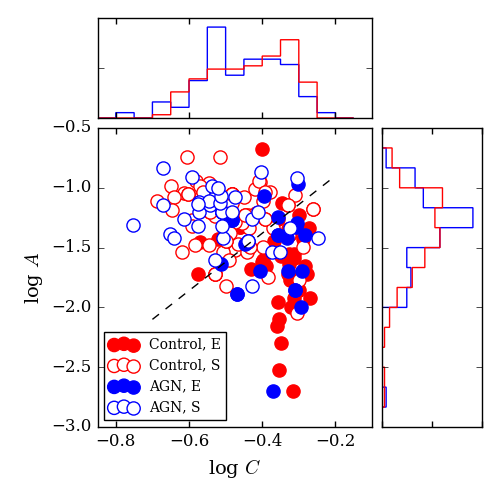
We have also made a quantitative assessment of how well the control sample morphological distribution matches that of the AGN hosts. The GZ1 classification reveals that the AGN sample contains 34 (55 per cent) spiral and 18 (29 per cent) elliptical galaxies. The remaining 10 objects (16 per cent) comprise 6 E/S galaxies, 1 merger and 3 unclassified objects. The morphological distribution of the control sample is the same within the uncertainties: 60 per cent spiral and 34 per cent elliptical galaxies. Figure 5 displays the concentration and asymmetry distributions of the AGN and the control sample galaxies. The dashed line is the optimal separation between the GZ1 major classes (ellipticals and spirals) in the diagram. The code PyCA does not calculate uncertainties in and , but the good separation between elliptical and spiral galaxies in the plane, with elliptical galaxies ocuppying the locus of low asymmetry and high concentration, suggests that the estimates of these parameters are robust. The distributions of AGN hosts and non-active galaxies in the plane are similar, although a small systematic effect is discernible in the sense of a wider distribution of the control sample galaxies in the diagram relative to the AGN. This behaviour is produced by the fact that AGN galaxies appear to be less common in the extremes of low concentration / low asymmetry indices. This result suggests that the AGN sample is morphologically less diverse than the control sample, preferring to populate the intermediate region between ellipticals and spirals. This trend is, however, secondary, as the A-D test results in a -value larger than 0.2 for the null hypothesis that the and distributions for AGN and control sample are drawn from the same distribution.
The combined SDSS-III ugriz images of the four strongest AGN from our sample and their “control partners” are shown in Figure 1. Those for the rest of the sample are shown in the Appendix. Both figures reveal an apparent very good match in the morphology and axial ratios between the AGN and control sample.
4.2 Stellar population properties
Figure 6 shows that there is no clear difference between the stellar population of all AGN – considering both the weak and strong AGN together – and the control sample. But, when comparing only strong AGN with their control sample, the distributions differ at the 2- level for and . Though the differences between the distributions are not obvious in these plots due to the histogram binning, they can be seen with smaller bin widths and are confirmed by the results of the A-D tests. The numbers in the top-right corners of each panel in Fig. 6 give the probability that the two distributions are derived from the same sample. The small values for and indicate that the contribution of these populations to the light at 5700Å differ between the strong AGN and the control sample, in the sense that the strong AGN show a smaller contribution from the old stellar population and a larger contribution from the young-old component than the control sample.
The above results suggest that, when comparing weak and strong AGN, the contribution of old stellar populations decreases, while that of the younger stellar populations increases in the latter. This trend agrees with the previous results by Kauffmann et al. (2003), who compared the stellar population properties of AGN-host galaxies and normal galaxies for a sample of 22600 galaxies with SDSS-I spectra (York et al., 2000). These authors studied the mean stellar age and stellar formation history of these AGN by measuring the indices (Balogh et al., 1999). They found that weak AGN have mostly old stellar populations that are similar to those of early-type galaxies (non-AGN), while the strong AGN have much younger stellar ages and typically strong H absorption-line equivalent width, indicating that they have experienced a burst of star formation in the past 1-2 Gyr. Our sample of strong AGN is comprised so far by 17 hosts, but our results are robust, as supported by the A-D tests, and will be increased as more of these objects are observed with MaNGA.
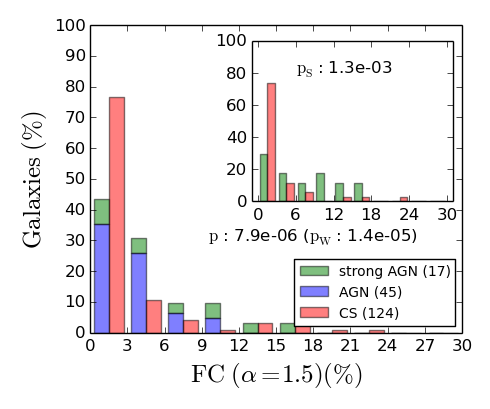
The results of the synthesis for the FC continuum, presented in Fig. 8, show a clear difference between the AGN and control sample: while the control sample tend to show very small contribution of FC in most cases, for the AGN, and in particular for the strong AGN, the FC contribution tends to be larger, as expected. In any case, this contribution is usually smaller than 10%, and in only a few cases it reaches 20%. But we also point out that a common problem of stellar population syntheses of the spectra of active galaxies is that a reddened young starburst (5M yr) is very difficult to distinguish from that of an AGN continuum as discussed in previous studies (Cid Fernandes & Terlevich, 1995; Storchi-Bergmann et al., 2000; Cid Fernandes et al., 2004; Riffel et al., 2009). This is particularly true when the FC contribution is smaller than 20%, as is the case here. We thus conclude that, although some degeneracy may be occurring, the fact that we are finding more FC contribution for the AGN than for the control sample supports that we are being able to separate this contribution in many cases. In order to estimate the impact of this degeneracy on the derived population fractions we have performed a series of simulations. We have combined a set of SSPs from our base with contributions similar to those we have found of our sample, and added a moderate FC contribution of 10%. We have then perturbed the individual flux values using the same error distribution as the sample spectra, and run Starlight with the same configuration as before, both allowing or not allowing for an FC in the fit. We have found that, when the FC is present but the synthesis does not allow for an FC in the fit, the contributions of young and intermediate stellar populations are overestimated by on average. However, when the FC is allowed, the contribution of young stellar populations is only slightly overestimated (). This agrees with the recent results of Cardoso, Gomes & Papaderos (2017) that have shown that, for a broad range in star formation histories, the effect of a FC in the derived mean stellar ages is typically lower than 0.1 dex even for FC contributions as large as 40%. Therefore, in the cases that there may be some degeneracy, the effect should be small, with no significant influence on the results of the synthesis discussed above.
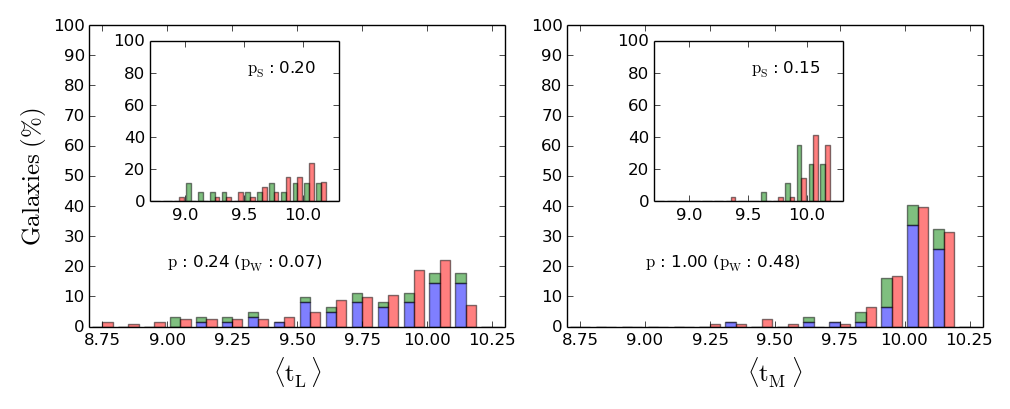
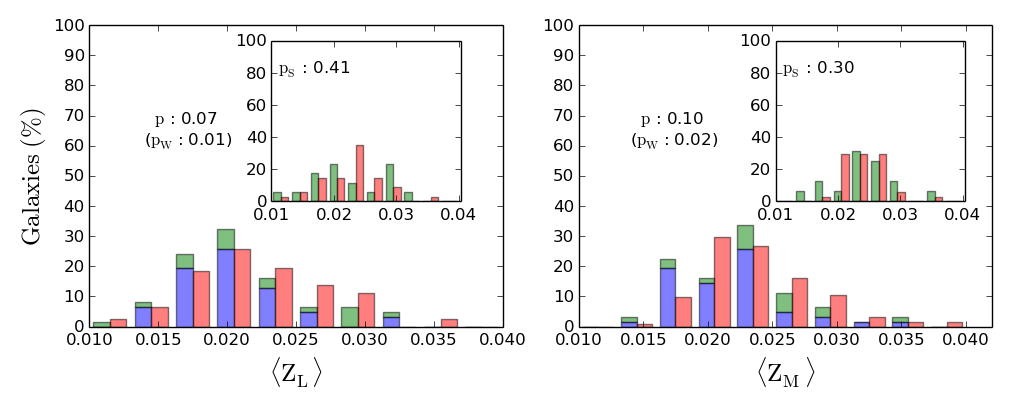
The distribution of the global parameters, mean ages and and mean metallicities and are presented in Figure 7. This figure shows that the distribution of mean ages (weighted in light) differ at the 2- level between the weak AGN and the control sample, while no such difference is observed for the strong AGN. On the other hand, if one calculates the median age for all weak and all strong AGN, one finds no difference relative to the controls for the weak AGN () but a difference of 0.2 dex (younger) for the strong AGN (, with the controls presenting the same value as observed for the weak AGN).
Regarding the metallicity, Fig. 7 reveals a small difference between the weak AGN and their control sample, with a probability of only about 1% that the distributions are similar in the case of normalization in light (), while no such difference is observed for the strong AGN. Although the difference in metallicity between the AGN hosts and control galaxies may be due to a different origin for the stars, there is also the possibility that we are observing the effect of degeneracy between age and metallicity in optical spectra (Worthey et al., 1994). This degeneracy arises because the lower metallicity leads to bluer stellar atmospheres, what is also the signature of young stars. As this effect is small, we defer its analysis to a future study, when we have a larger sample of AGN hosts.
 |
 |
4.2.1 The effect of the AGN luminosity
Although we have explored the effect of the AGN luminosity above by separating the analysis of the stellar population in only two populations – strong and weak AGN – we now investigate in more detail this effect by looking for possible correlations of the stellar population properties with L[OIII]. We also take advantage of our careful selection of the control sample to explore the differences between the properties of each AGN host and its two controls, investigating how these differences may be associated to the AGN luminosity.
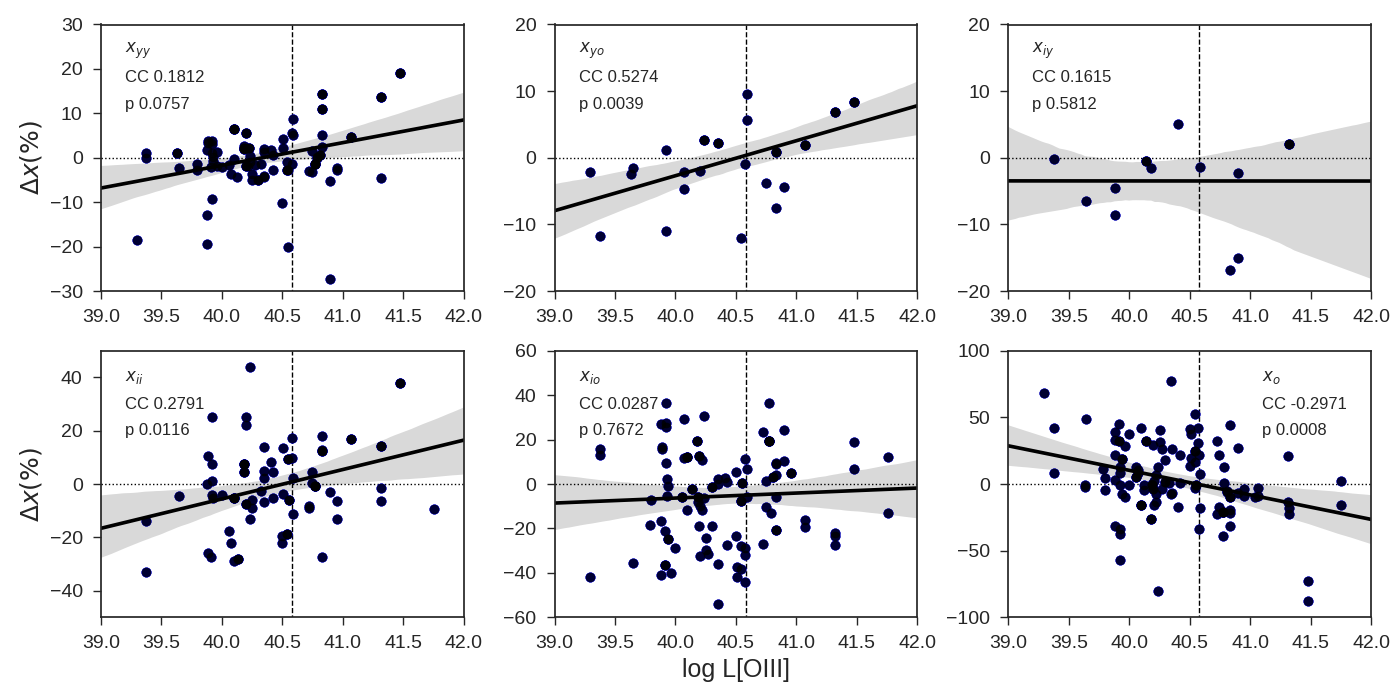
For this exercise we calculated the differential fractional contributions (AGN - control): the differences (in each age bin ) of the fractional contributions to the light at 5700Å between each AGN and its two control partners, and verified how, and if, it depends on the AGN [OIII] luminosity. The results are shown in Figure 9, where the limit between strong and weak AGN is shown as a vertical dashed line. We have performed a linear regression between and L[OIII] for each age bin and the best fit is shown as a continuous line in the different panels of the figure.
There is an obvious correlation between and L[OIII] for some age bins. This is the case for : a Spearman test gives a correlation coefficient of 0.53 with a p-value of 0.0039. For the oldest age bin, , there is an anti-correlation between and L[OIII], with a Spearman correlation coefficient of -0.30 and a statistical significance higher than 3-. Another result from this figure is that an AGN host can have a higher or lower contribution of a given age bin, depending on the AGN luminosity. In the bin , for example, the contribution is higher in lower-luminosity AGN than in their “control partners”, while the opposite is true for luminous AGN, which present a smaller contribution of this age bin than their respective control galaxies. A similar behaviour can be seen in the bin : the relative contribution of this age bin for low-luminosity AGN is smaller, but for high-luminosity AGN is higher.
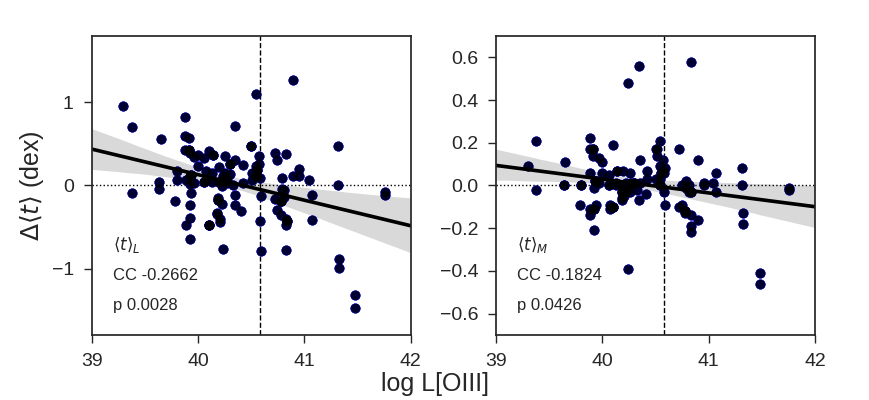
We have also explored how the differences in the (light-weighted and mass weighted) logarithmic mean stellar age between AGN and control sample (which we will refer to as “differential age”) depends on the AGN luminosity. The result is shown in Figure 10. It is evident that and L[OIII] show an inverse correlation, especially for the light-weighted mean ages. The resulting Spearman correlation coefficient is -0.27, with a statistical significance higher than 2-. The overall results agree with those obtained in Figure 9 and indicate that luminous AGN are younger, on average, than inactive galaxies with similar properties. Low-luminosity AGN, on the contrary, present older stellar populations than the control sample. Notice, also, that the separation between these two AGN categories is very close to the threshold erg s-1 (the vertical dashed line), which marks the separation between our weak and strong AGN samples. These results agree with those from Kauffmann et al. (2003), which showed that, at fixed stellar mass density, luminous AGN present younger stellar populations than inactive galaxies, while low-luminosity AGN are older, on average.
In oder to translate the above results in numbers, we show in Table 6 the mean ages of the AGN and their control galaxies separated in bins of AGN luminosity. Although some bins still have a few galaxies (that we hope to increase as the survey progresses), and the dispersion in the mean age values is large, Table 6 shows a steady decrease of the mean age of the host galaxy as the AGN luminosity increases, besides showing also the trend discussed regarding the difference in age between the AGN hosts and controls.
| N | Sample | |||||
|---|---|---|---|---|---|---|
| (erg s-1) | (AGN) | (yr) | (year) | (yr) | (year) | |
| 39.0 – 39.75 | 5 | AGN | 9.890.16 | 0.24 | 10.070.03 | 0.05 |
| Control | 9.650.42 | 10.02 | ||||
| 39.75 – 40.25 | 25 | AGN | 9.810.30 | 0.05 | 10.000.17 | 0.0 |
| Control | 9.760.36 | 10.000.19 | ||||
| 40.25 – 40.75 | 18 | AGN | 9.810.27 | 0.10 | 10.050.06 | 0.04 |
| Control | 9.710.32 | 10.010.12 | ||||
| 40.75 – 41.25 | 10 | AGN | 9.660.35 | -0.08 | 9.990.11 | -0.01 |
| Control | 9.740.43 | 10.000.18 | ||||
| 41.25 – 42.0 | 4 | AGN | 9.430.64 | -0.55 | 9.940.64 | -0.14 |
| Control | 9.980.15 | 10.080.03 |
4.3 Results from MaNGA data
As pointed out in the Introduction, we are applying the same methodology described above to study the resolved stellar population in the MANGA data (Mallmann et al., in preparation, hereafter Paper II). The SDSS-III spectra correspond to a region of radius 1.5” around the nucleus – corresponding to a range of radii from 1 to 3 kpc at the distance of the galaxies. This is similar to the area covered by the central pixel of the MaNGA array. Thus we have checked, for a subsample of representative galaxies, whether our synthesis result for the inner pixel was consistent with that obtained from the SDSS-III spectra. We concluded that the results were the same within the uncertainties, as expected.
The resolved synthesis (beyond the inner 1.5”) will be discussed in Paper II, and preliminary results are shown in Fig. LABEL:teaser for two sets of AGN and control sample galaxies: the first set corresponds to an early-type host and the second to a late-type host. The area covered by the central fiber of the MaNGA array, at the mean distance of these galaxies, is around 1.5 kpc. In these figures, we have further collapsed the ages in three bins: young (, Myr), intermediate age (, 51 Myr2 Gyr) and old (, Gyr). In the case of the early-type galaxy, it can be seen that the AGN host has: (1) a stronger reddening over the whole galaxy than the two control galaxies, suggesting the presence of more gas in the AGN host galaxy; (2) a larger contribution of the young component; (3) a larger contribution of the intermediate age component in the inner region and then it becomes similar to that of the second control galaxy (green) outwards; (4) a smaller contribution of the old component everywhere in the galaxy, being approximately the same as that of the second control galaxy in the outer part of the galaxy; (5) an average age that is smaller than those of the two controls in the inner region and similar to that of the second control in the outer parts of the galaxy.
In the case of the late-type galaxy, the AGN host has: (1) a similar reddening to that of the second control galaxy, being smaller than that of the first control galaxy; (2) a lower contribution of the young component than the first control everywhere, a lower contribution than the second control in the inner parts but similar outwards; (3) a smaller contribution of the intermediate-age component to that of the controls everywhere; (4) a larger contribution of the old component everywhere and a (5) a larger mean age everywhere.
In summary, we have find a difference in the resolved stellar population properties between the AGN and control galaxies for the early-type AGN host and found no difference in the late-type AGN host. We note that the difference between the stellar population of the early-type AGN host and those of the control galaxies is not restricted to the nucleus, but is observed out to about 0.6 effective radii. In Paper II we will present the results for the whole sample, as well as a statistical analysis to investigate the difference between the AGN and control sample in terms of their resolved stellar population properties.
5 Conclusions
We have characterized the first 62 AGN host galaxies observed in the MaNGA survey, defining and also characterizing a control sample of 2 galaxies for each AGN, matched according to global properties of the host galaxy such as stellar mass, distance, inclination and galaxy type. We compare the stellar population properties of the two samples within the inner 1.5” radius around the nucleus (1–3 kpc at their typical distances) using stellar population synthesis of their SDSS-III spectra and the central spectrum of the MaNGA array, which are identical within the uncertainties. This study will be followed by the study of the resolved stellar population (Paper II) and gas properties (Paper III) over the whole region of the galaxy covered by the MaNGA observations.
The main results of this paper are:
-
•
The stellar mass, redshift, -band absolute magnitude, concentration and asymmetry distributions of the AGN hosts are well matched by those of the control sample. The galaxy morphologies are similar, with 65 per cent spiral and 33 per cent spheroidal galaxies. The luminosity , however, is markedly lower (1.4 dex) for the control sample galaxies, as expected.
-
•
Only 17 AGN of our sample have AGN luminosities larger than erg s-1 (which we call strong AGN). Of these, three show signs of disturbed morphology, a much higher proportion than among the remaining, weak AGN.
-
•
The stellar population of the 45 weak AGN ( < erg s-1) is dominated (down to 60% contribution to the light at 5700Å) by old stars (with ages yr) with a smaller contribution (up to 40%) of intermediate age stars ( yr) and almost no contribution of younger stars; similar results are observed for the control sample;
-
•
The strong AGN, on the other hand, show, on average, a larger contribution (of up to 20%) of younger ( yr) stars and a decreased contribution of the old stars relative to both the weak AGN and control sample;
-
•
A correlation between the stellar population properties and the AGN luminosity, extending also to lower L[OIII] values, is found when pairing each AGN with its controls, via differential properties , evidencing the importance in a careful selection of a control sample;
-
•
Via this pairing, we find a correlation between the diferential contribution (AGN - control) of the stellar population age component (yr) and the AGN luminosity L[OIII], and an inverse correlation between the differential contribution of the old age component (yr) and L[OIII];
-
•
The pairing also reveals a trend in the mean differential age (AGN-control) and the AGN luminosity, in the sense that more luminous AGN are younger than the control sample. There is also a trend for weak AGN to be older than the control sample, while those with intermediate luminosity show similar ages to those of the control galaxies.
In summary, our results point to a difference between the stellar population of the AGN hosts and control sample that is correlated with the AGN luminosity: the most luminous the AGN, the younger is its stellar population in the inner kiloparsecs. This result supports the evolutionary scenario (Storchi-Bergmann et al., 2001; Davies et al., 2007) in which episodes of nuclear activity are preceded by episodes of star formation in the galaxy as both star formation and the nuclear activity feed on gas accretion towards the central regions of the galaxy.
In forthcoming papers we will expand the present investigation to include more AGN as they become observed with MaNGA, studying also the spatially resolved properties of the stellar population (Paper II), the gas excitation (Paper III) and kinematics, as well as the environment of our AGN sample as compared with those of the control sample using the spatially-resolved spectroscopic data from MaNGA.
Acknowledgements
We would like to thank the support of the Instituto Nacional de Ciência e Tecnologia (INCT) e-Universe project (CNPq grant 465376/2014-2). R.A.R. acknowledges support from FAPERGS (project no. 2366-2551/14-0) and CNPq (project no. 470090/2013-8 and 302683/2013-5). R.R. thanks to FAPERGS (16/2551-0000251-7) and CNPq for financial support.
Funding for the Sloan Digital Sky Survey IV has been provided by the Alfred P. Sloan Foundation and the Participating Institutions. SDSS-IV acknowledges support and resources from the Center for High-Performance Computing at the University of Utah. The SDSS web site is www.sdss.org. SDSS-IV is managed by the Astrophysical Research Consortium for the Participating Institutions of the SDSS Collaboration including the Brazilian Participation Group, the Carnegie Institution for Science, Carnegie Mellon University, the Chilean Participation Group, Harvard-Smithsonian Center for Astrophysics, Instituto de Astrofísica de Canarias, The Johns Hopkins University, Kavli Institute for the Physics and Mathematics of the Universe (IPMU) / University of Tokyo, Lawrence Berkeley National Laboratory, Leibniz Institut für Astro physik Potsdam (AIP), Max-Planck-Institut für Astrophysik (MPA Garching), Max-Planck-Institut für Extraterrestrische Physik (MPE), Max-Planck-Institut für Astronomie (MPIA Heidelberg), National Astronomical Observatory of China, New Mexico State University, New York University, The Ohio State University, Pennsylvania State University, Shanghai Astronomical Observatory, United Kingdom Participation Group, Universidad Nacional Autónoma de México, University of Arizona, University of Colorado Boulder, University of Portsmouth, University of Utah, University of Washington, University of Wisconsin, Vanderbilt University, and Yale University.
References
- Alam et al. (2015) Alam, S., et al., 2015, ApJS, 219, 12
- Rodríguez-Ardila et al. (2011) Rodríguez-Ardila, A., Prieto, M. A., Portilla, J. G., Tejeiro, J. M., 2011, ApJ, 743, 100
- Balogh et al. (1999) Balogh M. L., Morris S. L., Yee H. K. C., Carlberg R. G., Ellingson E., 1999, ApJ, 527, 54
- Baldwin, Phillips & Terlevich (1981) Baldwin, J. A., Phillips, M. M., Terlevich, R., 1981, PASP, 93, 5
- Bower et al. (2006) Bower, R. G. et al. 2006, MNRAS, 370, 645.
- Bruzual & Charlot (2003) Bruzual G., Charlot S., 2003, MNRAS, 344, 1000
- Bundy et al. (2015) Bundy, K., et al., 2015, ApJ 798, id. 7
- Cardelli, Clayton & Mathis (1989) Cardelli J. A., Clayton G. C., Mathis J. S., 1989, IAUS, 135, 5
- Cardoso, Gomes & Papaderos (2017) Cardoso, L. S. M., Gomes, J. M., Papaderos, P. 2017, A&A, 604, A99
- Cid Fernandes & Terlevich (1995) Cid Fernandes, R., J.. & Terlevich, R., 1995, MNRAS, 272, 423.
- Cid Fernandes et al. (2001) Cid Fernandes R., Sodré L., Schmitt H. R., Leão J. R. S., 2001, MNRAS, 325, 60
- Cid Fernandes et al. (2004) Cid Fernandes, R., Gu, Q., Melnick, J., Terlevich, E., Terlevich, R., Kunth, D., Rodrigues Lacerda, R., Joguet, B., 2004, MNRAS, 355, 273
- Cid Fernandes et al. (2005) Cid Fernandes, R., Mateus, A., Sodré, L., Stasińska, G., Gomes, J. M., 2005, MNRAS, 358, 363
- Cid Fernandes et al. (2010) Cid Fernandes, R., Stasińska, G., Schlickmann, M. S., Mateus, A., Vale Asari, N., Schoenell, W., Sodré, L., 2010, MNRAS, 403, 103
- Conroy, Gunn & White. (2009) Conroy, C., Gunn, J. E., White, M., 2009, ApJ, 699, 486
- Dametto et al. (2014) Dametto N. Z., Riffel R., Pastoriza M. G., Rodríguez-Ardila A., Hernandez-Jimenez J. A., Carvalho E. A., 2014, MNRAS, 443, 1754
- Davies et al. (2007) Davies, R., Müller Sánchez, F., Genzel, R., Tacconi, L. J., Hicks, E. K. S., Friedrich, S. & Sternberg, A. 2007, ApJ, 671, 1388
- Di Matteo, Springel & Hernquist (2005) Di Matteo, T., Springel, V. & Hernquist, L. 2005, Nature, 433, 604.
- Diamond-Stainic & Rieke (2012) Diamond-Stanic, A. M., Rieke, G. H. 2012, ApJ, 746, 168
- Drory et al. (2015) Drory, N., et al. 2015, AJ, 149, 77
- Dubois et al. (2013) Dubois, Y., Gavazzi, R., Peirani, S., Silk, J., 2013, MNRAS, 433, 3297.
- Eisenstein et al. (2011) Eisenstein, D.J., et al. 2011, AJ, 142, 72
- Esquej et al. (2014) Esquej, P., et al. 2014, ApJ, 780, 86
- Fabian et al. (2012) Fabian, A. 2012, ARA&A, 50, 455
- Ferrarese & Merrit (2000) Ferrarese, L. & Merrit, D., 2000, ApJ, 547, 140.
- Ferrarese & Ford (2005) Ferrarese, L. & Ford, H. C., 2005, Space Science Reviews, 116, 523.
- Fukugita et al. (1996) Fukugita, M., Ichikawa, T., Gunn, J. E., Doi, M., Shimasaku, K., Schneider, D. P. 1996, AJ, 111, 1748
- Gebhardt et al. (2000) Gebhardt, K. et al. 2000, ApJ, 539, 13.
- Gunn et al. (2006) Gunn, J.E., et al. 2006, AJ, 131, 2332
- Heckman et al. (1997) Heckman, T. M., González-Delgado, R., Leitherer, C., Meurer, G. R., Krolik, J., Wilson, A. S., Koratkar, A., & Kinney, A. 1997, ApJ, 482, 114.
- Hickox et al. (2014) Hickox, R. C., Mullaney, J. R., Alexander, D. M., Chen, C.-T. J., Civano, F. M., Goulding, A. D.; Hainline, K. N. 2014, ApJ, 782, 9
- Ishibashi & Fabian (2017) Ishibashi, W., Fabian, A. C., 2014, MNRAS, 441, 1474.
- Jahnke & Macciò (2011) Jahnke, K., Macciò, A. V., 2011, ApJ, 734, 92
- Kauffmann et al. (2003) Kauffmann G., Heckman T. M., Tremonti C., et al., 2003, MNRAS, 346, 1055
- Kewley et al. (2001) Kewley L. J., Dopita M. A., Sutherland R. S., Heisler C. A., Trevena J., 2001, ApJ, 556, 121
- Kormendy & Ho (2013) Kormendy, J., & Ho, L. C. 2013, ARA&A, 51, 511.
- Koski et al. (1978) Koski A. T., 1978, ApJ, 223, 56
- Law et al. (2015) Law, D. R., et al., 2015, AJ, 150, id. 19
- Law et al. (2016) Law, D. R., et al., 2016, in prep
- Lintott et al. (2011) Lintott, C., Schawinski, K., Bamford, S., Slosar, A., Land, K., Thomas, D., Edmondson, E., Masters, K., Nichol, R. C.; Raddick, M. J., Szalay, A., Andreescu, D., Murray, P., Vandenberg, J., 2011, MNRAS, 410, 166
- Mazzalay et al. (2010) Mazzalay, X., Rodríguez-Ardila, A., Komossa, S., 2010, MNRAS, 405, 1315
- Menanteau et al. (2005) Menanteau, F., Ford, H. C., Motta, V., Benítez, N., Martel, A. R., Blakeslee, J. P., Infante, L., 2005, AJ, 131, 208
- Müller-Sánchez et al. (2011) Müller-Sánchez, F., Prieto, M. A., Hicks, E. K. S., Vives-Arias, H., Davies, R. I., Malkan, M., Tacconi, L. J., Genzel, R., 2011, ApJ, 739, id. 69
- Nemmen et al. (2007) Nemmen R., Bower, R., Babul, A. & Storchi-Bergmann, T. 2007, MNRAS, 377, 1652
- Norman & Scoville (1988) Norman, C., & Scoville, N. 1988, ApJ, 332, 124.
- Peng (2007) Peng, C. Y., 2007, ApJ, 671, 1098
- Perry & Dyson (1985) Perry, J. J., & Dyson, J. E. 1985 MNRAS, 213, 665.
- Pontzen et al. (2017) Pontzen, A., Tremmel, M., Roth, N., Peiris, H. V., Saintonge, A., Volonteri, M., Quinn, T., Governato, F., 2017, MNRAS, 465, 547.
- Riffel et al. (2009) Riffel, R.; Pastoriza, M. G.; Rodríguez-Ardila, A.; Bonatto, C., 2009, MNRAS, 400, 273
- Smee et al. (2013) Smee, S.A., et al. 2013, AJ, 126, 32
- Somerville et al. (2008) Somerville et al. 2008, MNRAS, 391, 481
- Springel, Di Matteo & Hernquist (2005) Springel, V., Di Matteo, T. & Hernquist, L., 2005, ApJ, 620, 79.
- Storchi-Bergmann et al. (2000) Storchi-Bergmann, T., Raimann, D., Bica, E. L. D., Fraquelli, H. A., 2000, ApJ, 544, 747.
- Storchi-Bergmann et al. (2001) Storchi-Bergmann, T., González Delgado, R. M., Schmitt, H. R., Cid Fernandes, R. & Heckman, T. 2001, ApJ, 559, 147
- Terlevich & Melnick (1985) Terlevich, R., & Melnick, J. 1985, MNRAS, 213, 841.
- Terrazas et al. (2016) Terrazas, B. A., Bell, E. F., Henriques, B. M. B., White, S. D. M., Cattaneo, A., Woo, J., 2016, ApJL, 830, L12.
- Thomas et al. (2013) Thomas, D., et al., 2013, MNRAS, 431, 1383
- Wild, Heckman & Charlot (2010) Wild, V., Heckman, T., Charlot, S. 2010, MNRAS, 405, 933
- Worthey et al. (1994) Worthey G., 1994, ApJS, 95, 107
- Wylezalek et al. (2017) Wylezalek, D., et al., 2017, submitted to MNRAS
- Xie, Yuan & Ho (2017) Xie, F., Yuan, F., Ho, L. C., 2017, MNRAS, in press
- Yan et al. (2016) Yan, R., et al., 2016, AJ, 151, id. 8
- York et al. (2000) York, D. G., et al. 2000, AJ, 120, 1579
- Zakamska & Greene (2014) Zakamska, N. & Greene, J. 2014, MNRAS, 442, 784
Appendix A SDSS-III combined ugriz negative images of MaNGA MPL-5 AGN and control sample objects
Appendix B Detailed results from the stellar population synthesis
| mangaID | FC | xyy | xyo | xIy | xII | xIo | xo | myy | myo | mIy | mII | mIo | mo | Adev | |||||
|---|---|---|---|---|---|---|---|---|---|---|---|---|---|---|---|---|---|---|---|
| (1) | (2) | (3) | (4) | (5) | (6) | (7) | (8) | (9) | (10) | (11) | (12) | (13) | (14) | (15) | (16) | (17) | (18) | (19) | (20) |
| 1-109056 | 3.38 | 4.25 | 0.00 | 0.00 | 13.65 | 0.00 | 76.37 | 0.07 | 0.00 | 0.00 | 2.54 | 0.00 | 97.39 | 0.14 | 9.75 | 10.07 | 0.01957 | 0.01864 | 2.90 |
| 1-121532 | 4.42 | 4.63 | 1.96 | 0.00 | 17.07 | 0.00 | 71.26 | 0.08 | 0.06 | 0.00 | 2.85 | 0.00 | 97.01 | 0.50 | 9.70 | 10.08 | 0.01965 | 0.02309 | 5.40 |
| 1-135044 | 7.63 | 0.00 | 0.00 | 0.00 | 0.00 | 4.03 | 85.79 | 0.00 | 0.00 | 0.00 | 0.00 | 1.22 | 98.78 | 0.14 | 9.92 | 10.02 | 0.01727 | 0.01877 | 2.58 |
| 1-135285 | 0.04 | 0.00 | 0.00 | 0.00 | 0.00 | 0.00 | 97.15 | 0.00 | 0.00 | 0.00 | 0.00 | 0.00 | 100.00 | 0.17 | 10.00 | 10.07 | 0.01475 | 0.01761 | 2.76 |
| 1-135641 | 4.24 | 2.54 | 0.00 | 0.00 | 9.54 | 0.00 | 80.90 | 0.04 | 0.00 | 0.00 | 1.34 | 0.00 | 98.62 | 0.91 | 9.88 | 10.10 | 0.01857 | 0.02283 | 2.45 |
| 1-137883 | 0.00 | 10.51 | 9.50 | 0.00 | 2.28 | 40.64 | 34.75 | 0.16 | 0.31 | 0.00 | 0.62 | 14.82 | 84.10 | 1.58 | 9.12 | 9.98 | 0.01446 | 0.02749 | 3.28 |
| 1-148068 | 3.61 | 0.00 | 0.00 | 0.00 | 0.00 | 13.03 | 79.76 | 0.00 | 0.00 | 0.00 | 0.00 | 3.14 | 96.86 | 0.26 | 9.98 | 10.08 | 0.0246 | 0.02462 | 3.86 |
| 1-149211 | 12.13 | 0.00 | 0.00 | 0.00 | 0.00 | 49.60 | 36.05 | 0.00 | 0.00 | 0.00 | 0.00 | 27.91 | 72.09 | 0.18 | 9.55 | 9.83 | 0.03361 | 0.02262 | 3.96 |
| 1-163831 | 3.93 | 1.36 | 0.00 | 0.00 | 0.00 | 9.75 | 81.93 | 0.02 | 0.00 | 0.00 | 0.00 | 2.32 | 97.66 | 0.24 | 9.90 | 10.06 | 0.01905 | 0.02243 | 3.05 |
| 1-166919 | 4.98 | 1.72 | 0.00 | 0.00 | 4.70 | 13.33 | 72.58 | 0.03 | 0.00 | 0.00 | 0.83 | 2.28 | 96.86 | 0.23 | 9.84 | 10.08 | 0.01942 | 0.01996 | 2.39 |
| 1-167688 | 3.56 | 3.80 | 1.15 | 0.00 | 34.40 | 25.77 | 30.48 | 0.12 | 0.05 | 0.00 | 11.29 | 10.72 | 77.83 | 0.15 | 9.27 | 9.87 | 0.01905 | 0.02004 | 2.16 |
| 1-173958 | 7.42 | 16.37 | 0.85 | 0.00 | 19.93 | 20.47 | 33.50 | 0.28 | 0.02 | 0.00 | 6.16 | 8.44 | 85.11 | 0.62 | 9.05 | 9.96 | 0.02302 | 0.02879 | 3.47 |
| 1-198153 | 0.00 | 1.69 | 0.00 | 0.00 | 0.00 | 0.00 | 96.20 | 0.02 | 0.00 | 0.00 | 0.00 | 0.00 | 99.98 | 0.41 | 10.04 | 10.11 | 0.01435 | 0.01666 | 2.63 |
| 1-198182 | 4.95 | 0.00 | 0.00 | 0.00 | 0.00 | 0.00 | 92.01 | 0.00 | 0.00 | 0.00 | 0.00 | 0.00 | 100.00 | -0.06 | 10.11 | 10.11 | 0.02216 | 0.02484 | 1.87 |
| 1-201561 | 4.08 | 0.00 | 0.00 | 0.00 | 0.00 | 0.00 | 91.27 | 0.00 | 0.00 | 0.00 | 0.00 | 0.00 | 100.00 | -0.03 | 10.11 | 10.11 | 0.02364 | 0.02726 | 3.79 |
| 1-209980 | 17.08 | 0.00 | 0.00 | 0.00 | 0.00 | 0.00 | 81.52 | 0.00 | 0.00 | 0.00 | 0.00 | 0.00 | 100.00 | 0.03 | 10.11 | 10.11 | 0.01671 | 0.01897 | 2.00 |
| 1-210646 | 3.37 | 4.78 | 0.00 | 0.00 | 0.00 | 18.12 | 71.64 | 0.11 | 0.00 | 0.00 | 0.00 | 7.47 | 92.42 | 0.45 | 9.54 | 9.92 | 0.01784 | 0.01777 | 4.77 |
| 1-211311 | 4.34 | 0.00 | 0.00 | 0.00 | 0.00 | 6.11 | 85.90 | 0.00 | 0.00 | 0.00 | 0.00 | 1.67 | 98.33 | -0.02 | 9.97 | 10.05 | 0.0176 | 0.01795 | 2.45 |
| 1-217050 | 1.26 | 1.12 | 0.00 | 0.00 | 0.00 | 0.00 | 94.71 | 0.01 | 0.00 | 0.00 | 0.00 | 0.00 | 99.99 | 0.00 | 10.07 | 10.11 | 0.02053 | 0.0238 | 1.64 |
| 1-22301 | 7.65 | 2.15 | 0.00 | 0.00 | 0.00 | 11.75 | 74.97 | 0.02 | 0.00 | 0.00 | 0.00 | 2.40 | 97.58 | 0.18 | 9.89 | 10.08 | 0.01894 | 0.0237 | 2.59 |
| 1-229010 | 2.42 | 0.00 | 0.00 | 0.00 | 0.00 | 0.00 | 93.18 | 0.00 | 0.00 | 0.00 | 0.00 | 0.00 | 100.00 | -0.10 | 10.06 | 10.09 | 0.01987 | 0.02236 | 1.58 |
| 1-234618 | 0.00 | 3.91 | 0.00 | 0.00 | 2.10 | 2.29 | 88.13 | 0.06 | 0.00 | 0.00 | 0.42 | 0.61 | 98.92 | 0.78 | 9.78 | 10.04 | 0.01416 | 0.01897 | 5.22 |
| 1-23979 | 1.60 | 5.66 | 0.00 | 0.00 | 25.10 | 0.00 | 65.77 | 0.10 | 0.00 | 0.00 | 5.11 | 0.00 | 94.79 | 0.54 | 9.57 | 10.05 | 0.02522 | 0.02186 | 2.63 |
| 1-24148 | 8.51 | 0.00 | 0.00 | 0.00 | 0.00 | 5.64 | 83.67 | 0.00 | 0.00 | 0.00 | 0.00 | 1.32 | 98.68 | 0.26 | 10.05 | 10.10 | 0.02232 | 0.02433 | 2.28 |
| 1-248389 | 0.00 | 3.03 | 0.00 | 5.12 | 11.80 | 38.14 | 39.81 | 0.07 | 0.00 | 0.51 | 2.83 | 9.95 | 86.65 | 0.45 | 9.41 | 9.98 | 0.01949 | 0.03118 | 1.99 |
| 1-248420 | 9.48 | 0.00 | 0.00 | 0.00 | 0.00 | 0.00 | 87.58 | 0.00 | 0.00 | 0.00 | 0.00 | 0.00 | 100.00 | 0.18 | 10.09 | 10.09 | 0.01447 | 0.01568 | 3.07 |
| 1-25554 | 0.00 | 3.36 | 0.00 | 0.00 | 0.00 | 34.06 | 59.68 | 0.06 | 0.00 | 0.00 | 0.00 | 9.95 | 89.99 | 0.32 | 9.68 | 10.03 | 0.01957 | 0.01902 | 2.66 |
| 1-256446 | 1.36 | 0.00 | 0.00 | 0.00 | 0.00 | 0.00 | 94.32 | 0.00 | 0.00 | 0.00 | 0.00 | 0.00 | 100.00 | -0.04 | 10.11 | 10.11 | 0.01799 | 0.01905 | 2.96 |
| 1-25725 | 11.87 | 1.28 | 0.00 | 0.00 | 0.00 | 0.00 | 85.18 | 0.00 | 0.00 | 0.00 | 0.00 | 0.00 | 100.00 | 0.17 | 10.06 | 10.11 | 0.03177 | 0.03529 | 3.20 |
| 1-258599 | 9.11 | 13.62 | 6.83 | 2.11 | 14.44 | 12.09 | 39.36 | 0.20 | 0.22 | 0.29 | 5.15 | 5.75 | 88.39 | 0.62 | 9.01 | 9.92 | 0.02181 | 0.03697 | 3.19 |
| 1-258774 | 1.79 | 4.81 | 0.00 | 0.00 | 10.70 | 27.62 | 51.72 | 0.04 | 0.00 | 0.00 | 2.43 | 8.96 | 88.57 | 0.41 | 9.56 | 10.00 | 0.02701 | 0.0221 | 2.02 |
| 1-259142 | 3.62 | 0.00 | 0.00 | 0.00 | 0.00 | 0.00 | 92.92 | 0.00 | 0.00 | 0.00 | 0.00 | 0.00 | 100.00 | -0.00 | 10.11 | 10.11 | 0.02069 | 0.02218 | 2.20 |
| 1-269632 | 4.49 | 18.98 | 8.39 | 0.00 | 37.97 | 18.93 | 9.14 | 0.51 | 0.50 | 0.00 | 24.60 | 16.72 | 57.68 | 0.65 | 8.61 | 9.65 | 0.02923 | 0.04336 | 3.64 |
| 1-277552 | 0.00 | 5.96 | 0.00 | 0.00 | 10.34 | 0.00 | 79.53 | 0.10 | 0.00 | 0.00 | 1.55 | 0.00 | 98.35 | 0.64 | 9.71 | 10.04 | 0.01871 | 0.0161 | 4.72 |
| 1-279073 | 5.45 | 0.00 | 0.00 | 0.00 | 0.00 | 0.00 | 90.99 | 0.00 | 0.00 | 0.00 | 0.00 | 0.00 | 100.00 | -0.13 | 10.11 | 10.11 | 0.02647 | 0.02996 | 2.19 |
| 1-279147 | 5.08 | 5.23 | 0.00 | 0.00 | 18.03 | 37.63 | 31.30 | 0.09 | 0.00 | 0.00 | 6.78 | 20.13 | 73.00 | 0.56 | 9.25 | 9.81 | 0.03086 | 0.0274 | 2.75 |
| 1-279666 | 0.00 | 3.12 | 0.00 | 0.00 | 7.44 | 36.36 | 49.72 | 0.07 | 0.00 | 0.00 | 1.90 | 11.48 | 86.55 | 0.26 | 9.54 | 9.93 | 0.01997 | 0.02375 | 2.44 |
| 1-279676 | 0.00 | 1.99 | 0.00 | 0.00 | 7.49 | 19.39 | 69.58 | 0.03 | 0.00 | 0.00 | 1.48 | 5.64 | 92.84 | 0.32 | 9.75 | 10.04 | 0.02402 | 0.01853 | 3.36 |
| 1-321739 | 0.00 | 2.74 | 2.19 | 0.00 | 15.14 | 9.42 | 68.96 | 0.03 | 0.05 | 0.00 | 2.80 | 2.45 | 94.67 | 1.08 | 9.69 | 10.06 | 0.02029 | 0.02271 | 2.96 |
| 1-338922 | 0.00 | 14.28 | 0.00 | 0.00 | 0.00 | 32.92 | 51.74 | 0.16 | 0.00 | 0.00 | 0.00 | 17.42 | 82.41 | 0.48 | 9.33 | 9.92 | 0.01828 | 0.02573 | 6.43 |
| mangaID | FC | xyy | xyo | xIy | xII | xIo | xo | myy | myo | mIy | mII | mIo | mo | Adev | |||||
|---|---|---|---|---|---|---|---|---|---|---|---|---|---|---|---|---|---|---|---|
| (1) | (2) | (3) | (4) | (5) | (6) | (7) | (8) | (9) | (10) | (11) | (12) | (13) | (14) | (15) | (16) | (17) | (18) | (19) | (20) |
| 1-339094 | 7.03 | 0.00 | 0.00 | 0.00 | 7.66 | 23.20 | 59.24 | 0.00 | 0.00 | 0.00 | 1.90 | 8.37 | 89.73 | 0.29 | 9.72 | 9.98 | 0.02492 | 0.01955 | 1.86 |
| 1-339163 | 5.93 | 0.00 | 0.00 | 0.00 | 0.00 | 0.00 | 92.23 | 0.00 | 0.00 | 0.00 | 0.00 | 0.00 | 100.00 | 0.00 | 10.08 | 10.10 | 0.01674 | 0.02013 | 1.94 |
| 1-351790 | 5.46 | 2.08 | 2.60 | 0.00 | 43.77 | 30.59 | 13.55 | 0.10 | 0.16 | 0.00 | 22.41 | 22.30 | 55.03 | 0.41 | 9.16 | 9.68 | 0.02216 | 0.02057 | 2.20 |
| 1-37036 | 0.00 | 1.59 | 0.00 | 0.00 | 0.00 | 2.20 | 93.97 | 0.02 | 0.00 | 0.00 | 0.00 | 0.27 | 99.71 | 0.22 | 10.03 | 10.11 | 0.01886 | 0.02278 | 2.11 |
| 1-373161 | 4.82 | 0.00 | 0.00 | 0.00 | 0.00 | 0.00 | 91.52 | 0.00 | 0.00 | 0.00 | 0.00 | 0.00 | 100.00 | 0.16 | 10.11 | 10.11 | 0.02199 | 0.02394 | 2.64 |
| 1-44303 | 11.93 | 1.62 | 0.00 | 0.00 | 4.50 | 12.94 | 68.16 | 0.03 | 0.00 | 0.00 | 1.04 | 7.58 | 91.34 | 0.35 | 9.82 | 10.02 | 0.01984 | 0.0175 | 3.13 |
| 1-44379 | 12.87 | 0.00 | 0.00 | 0.00 | 0.92 | 5.16 | 78.93 | 0.00 | 0.00 | 0.00 | 0.18 | 0.87 | 98.95 | 0.17 | 10.04 | 10.10 | 0.0124 | 0.01433 | 2.08 |
| 1-460812 | 1.82 | 1.94 | 0.00 | 0.00 | 0.00 | 3.39 | 89.71 | 0.02 | 0.00 | 0.00 | 0.00 | 0.78 | 99.20 | 0.73 | 9.92 | 10.08 | 0.01719 | 0.0231 | 3.26 |
| 1-48116 | 0.00 | 6.62 | 0.00 | 0.00 | 17.37 | 11.44 | 62.82 | 0.12 | 0.00 | 0.00 | 3.80 | 3.19 | 92.89 | 0.56 | 9.54 | 10.04 | 0.0195 | 0.01876 | 1.92 |
| 1-491229 | 6.52 | 0.00 | 0.00 | 0.00 | 0.00 | 0.00 | 91.23 | 0.00 | 0.00 | 0.00 | 0.00 | 0.00 | 100.00 | 0.00 | 10.11 | 10.11 | 0.02215 | 0.02543 | 2.03 |
| 1-519742 | 2.59 | 0.00 | 0.00 | 0.00 | 0.00 | 71.52 | 23.59 | 0.00 | 0.00 | 0.00 | 0.00 | 64.99 | 35.01 | 0.26 | 9.32 | 9.37 | 0.033 | 0.02945 | 5.97 |
| 1-542318 | 2.68 | 0.00 | 0.00 | 0.00 | 0.00 | 12.83 | 82.73 | 0.00 | 0.00 | 0.00 | 0.00 | 4.09 | 95.91 | 0.30 | 9.99 | 10.08 | 0.01777 | 0.01604 | 4.66 |
| 1-558912 | 11.71 | 0.00 | 0.00 | 0.00 | 0.00 | 12.28 | 72.81 | 0.00 | 0.00 | 0.00 | 0.00 | 2.94 | 97.06 | 0.03 | 9.98 | 10.09 | 0.02779 | 0.02649 | 3.45 |
| 1-604761 | 2.77 | 0.00 | 0.00 | 0.00 | 0.00 | 0.00 | 93.55 | 0.00 | 0.00 | 0.00 | 0.00 | 0.00 | 100.00 | 0.11 | 10.11 | 10.11 | 0.01829 | 0.02073 | 2.67 |
| 1-72322 | 16.54 | 0.00 | 0.00 | 0.00 | 0.00 | 0.00 | 80.48 | 0.00 | 0.00 | 0.00 | 0.00 | 0.00 | 100.00 | 0.19 | 10.11 | 10.11 | 0.02889 | 0.03089 | 3.34 |
| 1-91016 | 0.00 | 4.63 | 0.00 | 0.00 | 0.00 | 56.04 | 37.49 | 0.11 | 0.00 | 0.00 | 0.00 | 29.37 | 70.52 | 0.70 | 9.37 | 9.75 | 0.01953 | 0.02314 | 4.36 |
| 1-92866 | 0.00 | 1.29 | 0.00 | 0.00 | 0.00 | 0.00 | 95.45 | 0.02 | 0.00 | 0.00 | 0.00 | 0.00 | 99.98 | 0.32 | 10.02 | 10.10 | 0.01964 | 0.02229 | 2.97 |
| 1-94604 | 9.35 | 0.00 | 0.00 | 0.00 | 0.00 | 13.18 | 74.83 | 0.00 | 0.00 | 0.00 | 0.00 | 7.74 | 92.26 | -0.01 | 9.82 | 9.97 | 0.02021 | 0.02463 | 3.16 |
| 1-94784 | 2.90 | 0.00 | 0.00 | 0.00 | 0.00 | 36.69 | 55.88 | 0.00 | 0.00 | 0.00 | 0.00 | 12.99 | 87.01 | 0.24 | 9.68 | 9.95 | 0.02994 | 0.02287 | 2.13 |
| 1-95092 | 0.00 | 3.74 | 0.00 | 0.00 | 11.56 | 0.00 | 82.36 | 0.03 | 0.00 | 0.00 | 2.06 | 0.00 | 97.91 | 0.39 | 9.75 | 10.06 | 0.02084 | 0.0195 | 2.03 |
| 1-95585 | 4.16 | 0.00 | 0.00 | 0.00 | 0.00 | 0.63 | 91.02 | 0.00 | 0.00 | 0.00 | 0.00 | 0.22 | 99.78 | -0.02 | 10.11 | 10.11 | 0.02265 | 0.02563 | 3.11 |
| 1-96075 | 2.81 | 6.57 | 0.00 | 0.00 | 0.00 | 16.27 | 71.05 | 0.06 | 0.00 | 0.00 | 0.00 | 5.30 | 94.63 | 0.38 | 9.63 | 10.01 | 0.01634 | 0.01836 | 4.50 |
| mangaID | FC | xyy | xyo | xIy | xII | xIo | xo | myy | myo | mIy | mII | mIo | mo | Adev | |||||
|---|---|---|---|---|---|---|---|---|---|---|---|---|---|---|---|---|---|---|---|
| (1) | (2) | (3) | (4) | (5) | (6) | (7) | (8) | (9) | (10) | (11) | (12) | (13) | (14) | (15) | (16) | (17) | (18) | (19) | (20) |
| 1-109493 | 2.97 | 0.00 | 0.00 | 0.00 | 0.00 | 0.00 | 91.99 | 0.00 | 0.00 | 0.00 | 0.00 | 0.00 | 100.00 | -0.15 | 10.11 | 10.11 | 0.0219 | 0.02306 | 3.52 |
| 1-114306 | 1.09 | 8.07 | 0.00 | 0.00 | 7.78 | 34.00 | 46.61 | 0.13 | 0.00 | 0.00 | 2.22 | 12.92 | 84.73 | 0.44 | 9.39 | 9.95 | 0.01419 | 0.0174 | 4.47 |
| 1-121717 | 0.00 | 4.42 | 0.00 | 0.00 | 4.38 | 32.26 | 56.85 | 0.07 | 0.00 | 0.00 | 0.88 | 8.77 | 90.28 | 0.53 | 9.63 | 10.03 | 0.01883 | 0.02178 | 3.11 |
| 1-134239 | 0.00 | 0.00 | 0.00 | 0.00 | 0.00 | 14.05 | 82.24 | 0.00 | 0.00 | 0.00 | 0.00 | 3.52 | 96.48 | 0.11 | 9.91 | 10.06 | 0.02297 | 0.02196 | 3.03 |
| 1-135371 | 0.00 | 2.66 | 0.00 | 0.00 | 14.05 | 0.00 | 82.30 | 0.02 | 0.00 | 0.00 | 2.41 | 0.00 | 97.57 | 0.65 | 9.84 | 10.09 | 0.02158 | 0.02076 | 2.76 |
| 1-135372 | 0.00 | 0.00 | 3.19 | 0.00 | 0.00 | 0.00 | 96.37 | 0.00 | 0.05 | 0.00 | 0.00 | 0.00 | 99.95 | 0.02 | 10.03 | 10.11 | 0.01941 | 0.0215 | 1.69 |
| 1-135502 | 0.60 | 0.00 | 0.00 | 0.00 | 0.00 | 0.00 | 94.52 | 0.00 | 0.00 | 0.00 | 0.00 | 0.00 | 100.00 | 0.13 | 10.03 | 10.08 | 0.01767 | 0.02035 | 2.18 |
| 1-135625 | 12.87 | 2.50 | 12.97 | 0.00 | 33.15 | 18.44 | 17.30 | 0.10 | 0.60 | 0.00 | 15.10 | 11.27 | 72.93 | 0.35 | 8.97 | 9.82 | 0.03015 | 0.03899 | 1.75 |
| 1-135810 | 0.00 | 0.00 | 0.00 | 0.00 | 0.00 | 41.05 | 57.21 | 0.00 | 0.00 | 0.00 | 0.00 | 16.27 | 83.73 | 0.30 | 9.61 | 9.89 | 0.02852 | 0.02237 | 2.64 |
| 1-136125 | 0.00 | 0.00 | 0.00 | 0.00 | 0.00 | 36.16 | 60.24 | 0.00 | 0.00 | 0.00 | 0.00 | 13.23 | 86.77 | 0.29 | 9.66 | 9.93 | 0.02761 | 0.0219 | 4.52 |
| 1-166691 | 0.59 | 1.18 | 0.00 | 0.00 | 0.00 | 7.98 | 86.24 | 0.01 | 0.00 | 0.00 | 0.00 | 1.53 | 98.46 | -0.14 | 10.00 | 10.10 | 0.02201 | 0.02557 | 3.00 |
| 1-166947 | 3.68 | 0.00 | 0.00 | 0.00 | 0.00 | 0.00 | 92.37 | 0.00 | 0.00 | 0.00 | 0.00 | 0.00 | 100.00 | -0.10 | 10.11 | 10.11 | 0.02198 | 0.02528 | 3.27 |
| 1-167334 | 0.00 | 3.03 | 0.00 | 0.00 | 56.89 | 36.57 | 1.18 | 0.11 | 0.00 | 0.00 | 49.04 | 42.99 | 7.86 | 0.55 | 9.04 | 9.20 | 0.03621 | 0.03418 | 1.65 |
| 1-177493 | 3.34 | 0.00 | 0.00 | 0.00 | 0.00 | 19.37 | 74.21 | 0.00 | 0.00 | 0.00 | 0.00 | 5.77 | 94.23 | 0.03 | 9.82 | 10.02 | 0.02338 | 0.02186 | 2.30 |
| 1-178838 | 12.76 | 0.00 | 0.00 | 0.00 | 3.31 | 17.56 | 62.46 | 0.00 | 0.00 | 0.00 | 0.62 | 4.47 | 94.91 | -0.12 | 9.91 | 10.07 | 0.02277 | 0.02485 | 1.94 |
| 1-210173 | 5.84 | 0.00 | 0.00 | 0.00 | 2.29 | 31.23 | 55.48 | 0.00 | 0.00 | 0.00 | 0.33 | 10.10 | 89.57 | 0.24 | 9.74 | 10.00 | 0.0307 | 0.02489 | 4.72 |
| 1-210593 | 0.00 | 0.00 | 0.00 | 0.00 | 6.32 | 0.00 | 91.27 | 0.00 | 0.00 | 0.00 | 1.07 | 0.00 | 98.93 | 0.28 | 9.91 | 10.05 | 0.0209 | 0.02503 | 3.43 |
| 1-210614 | 0.00 | 1.24 | 0.00 | 0.00 | 0.00 | 0.00 | 94.97 | 0.01 | 0.00 | 0.00 | 0.00 | 0.00 | 99.98 | 0.09 | 10.06 | 10.11 | 0.02004 | 0.02273 | 2.48 |
| 1-210700 | 0.00 | 0.00 | 0.00 | 0.00 | 0.00 | 0.00 | 96.81 | 0.00 | 0.00 | 0.00 | 0.00 | 0.00 | 100.00 | 0.16 | 10.09 | 10.11 | 0.02369 | 0.02721 | 5.73 |
| 1-210784 | 0.00 | 2.87 | 0.00 | 0.00 | 1.19 | 4.69 | 88.16 | 0.03 | 0.00 | 0.00 | 0.11 | 0.56 | 99.29 | 0.11 | 9.93 | 10.11 | 0.02379 | 0.02871 | 2.34 |
| 1-210962 | 0.00 | 1.41 | 0.00 | 0.00 | 5.66 | 8.40 | 81.53 | 0.02 | 0.00 | 0.00 | 0.89 | 1.76 | 97.33 | 0.15 | 9.92 | 10.09 | 0.02033 | 0.02174 | 1.64 |
| 1-211063 | 0.00 | 1.39 | 0.00 | 0.00 | 0.00 | 18.78 | 75.78 | 0.02 | 0.00 | 0.00 | 0.00 | 4.88 | 95.10 | 0.28 | 9.87 | 10.07 | 0.02286 | 0.0192 | 2.32 |
| 1-211074 | 0.00 | 1.86 | 0.00 | 0.00 | 0.00 | 0.00 | 94.99 | 0.02 | 0.00 | 0.00 | 0.00 | 0.00 | 99.97 | 0.13 | 10.03 | 10.11 | 0.01627 | 0.01925 | 2.31 |
| 1-211079 | 0.00 | 0.00 | 0.00 | 0.00 | 5.97 | 0.00 | 92.39 | 0.00 | 0.00 | 0.00 | 0.59 | 0.00 | 99.41 | 0.03 | 10.03 | 10.10 | 0.02051 | 0.02551 | 1.93 |
| 1-211082 | 0.00 | 2.26 | 0.00 | 0.00 | 7.17 | 0.00 | 88.14 | 0.02 | 0.00 | 0.00 | 0.99 | 0.00 | 98.98 | 0.23 | 9.93 | 10.10 | 0.02593 | 0.02656 | 2.23 |
| 1-211100 | 0.00 | 1.46 | 0.00 | 0.00 | 0.00 | 0.00 | 95.79 | 0.02 | 0.00 | 0.00 | 0.00 | 0.00 | 99.98 | 0.04 | 10.05 | 10.11 | 0.01701 | 0.02087 | 1.85 |
| 12-129446 | 1.31 | 4.33 | 0.00 | 0.00 | 0.01 | 40.22 | 51.60 | 0.08 | 0.00 | 0.00 | 0.00 | 12.01 | 87.91 | 0.33 | 9.59 | 10.01 | 0.02053 | 0.02209 | 2.84 |
| 1-216958 | 15.73 | 0.00 | 0.00 | 0.00 | 13.14 | 11.64 | 56.77 | 0.00 | 0.00 | 0.00 | 2.41 | 2.68 | 94.91 | -0.08 | 9.77 | 10.05 | 0.02646 | 0.02707 | 1.60 |
| 1-218280 | 2.44 | 0.00 | 0.00 | 0.00 | 0.00 | 0.00 | 94.10 | 0.00 | 0.00 | 0.00 | 0.00 | 0.00 | 100.00 | -0.14 | 10.11 | 10.11 | 0.0209 | 0.02264 | 3.90 |
| 1-218427 | 2.55 | 0.00 | 0.00 | 0.00 | 0.00 | 0.00 | 94.12 | 0.00 | 0.00 | 0.00 | 0.00 | 0.00 | 100.00 | -0.11 | 10.11 | 10.11 | 0.02109 | 0.02295 | 3.88 |
| 1-235398 | 0.00 | 5.31 | 0.00 | 0.00 | 0.00 | 17.60 | 74.64 | 0.08 | 0.00 | 0.00 | 0.00 | 5.14 | 94.78 | 0.81 | 9.64 | 10.01 | 0.0122 | 0.01717 | 2.83 |
| 1-235587 | 0.00 | 1.71 | 0.00 | 0.00 | 6.86 | 0.00 | 87.88 | 0.02 | 0.00 | 0.00 | 1.13 | 0.00 | 98.85 | -0.07 | 9.92 | 10.08 | 0.01878 | 0.01863 | 2.09 |
| 1-236099 | 3.82 | 0.00 | 0.00 | 0.00 | 22.14 | 28.78 | 42.23 | 0.00 | 0.00 | 0.00 | 6.66 | 12.26 | 81.08 | 0.23 | 9.57 | 9.93 | 0.02743 | 0.01906 | 2.65 |
| 1-94514 | 0.00 | 1.21 | 0.00 | 0.00 | 0.00 | 13.14 | 82.88 | 0.02 | 0.00 | 0.00 | 0.00 | 3.02 | 96.96 | 0.00 | 9.93 | 10.08 | 0.02384 | 0.02302 | 2.23 |
| 1-23731 | 0.00 | 1.71 | 0.00 | 0.00 | 0.00 | 2.08 | 91.90 | 0.02 | 0.00 | 0.00 | 0.00 | 0.45 | 99.52 | 0.02 | 9.93 | 10.07 | 0.01792 | 0.02215 | 2.01 |
| smallskip | |||||||||||||||||||
| 1-24099 | 0.00 | 0.91 | 0.00 | 0.00 | 16.33 | 0.00 | 80.68 | 0.01 | 0.00 | 0.00 | 2.69 | 0.00 | 97.30 | 0.02 | 9.88 | 10.08 | 0.0235 | 0.02102 | 1.85 |
| 1-24246 | 6.94 | 0.00 | 0.00 | 0.00 | 30.11 | 0.95 | 58.39 | 0.00 | 0.00 | 0.00 | 6.37 | 0.17 | 93.46 | 0.18 | 9.71 | 10.03 | 0.0303 | 0.02221 | 6.43 |
| 1-24416 | 0.00 | 1.01 | 0.00 | 0.00 | 0.00 | 0.00 | 96.33 | 0.01 | 0.00 | 0.00 | 0.00 | 0.00 | 99.99 | 0.25 | 9.97 | 10.07 | 0.01625 | 0.01925 | 1.94 |
| mangaID | FC | xyy | xyo | xIy | xII | xIo | xo | myy | myo | mIy | mII | mIo | mo | Adev | |||||
|---|---|---|---|---|---|---|---|---|---|---|---|---|---|---|---|---|---|---|---|
| (1) | (2) | (3) | (4) | (5) | (6) | (7) | (8) | (9) | (10) | (11) | (12) | (13) | (14) | (15) | (16) | (17) | (18) | (19) | (20) |
| 1-245774 | 0.00 | 1.23 | 0.00 | 0.00 | 5.15 | 33.24 | 57.82 | 0.02 | 0.00 | 0.00 | 1.06 | 9.54 | 89.38 | 0.07 | 9.72 | 10.02 | 0.02176 | 0.02083 | 2.58 |
| 1-247417 | 0.00 | 6.75 | 0.00 | 0.00 | 1.71 | 53.99 | 33.94 | 0.16 | 0.00 | 0.00 | 0.49 | 21.04 | 78.30 | 0.73 | 9.38 | 9.94 | 0.01549 | 0.02187 | 2.97 |
| 1-247456 | 0.00 | 5.43 | 0.00 | 0.00 | 9.06 | 38.44 | 44.44 | 0.11 | 0.00 | 0.00 | 2.22 | 12.55 | 85.12 | 0.43 | 9.49 | 9.99 | 0.01634 | 0.02028 | 3.45 |
| 1-251279 | 0.00 | 1.13 | 0.00 | 0.00 | 2.77 | 11.06 | 80.72 | 0.02 | 0.00 | 0.00 | 0.47 | 2.54 | 96.97 | 0.20 | 9.90 | 10.07 | 0.01819 | 0.02016 | 1.97 |
| 1-251871 | 6.57 | 0.00 | 0.00 | 0.00 | 0.00 | 0.00 | 89.51 | 0.00 | 0.00 | 0.00 | 0.00 | 0.00 | 100.00 | 0.06 | 10.11 | 10.11 | 0.02168 | 0.02298 | 5.18 |
| 1-256185 | 2.28 | 0.00 | 0.00 | 0.00 | 0.00 | 0.00 | 93.72 | 0.00 | 0.00 | 0.00 | 0.00 | 0.00 | 100.00 | -0.05 | 10.07 | 10.10 | 0.02002 | 0.02211 | 1.72 |
| 1-256465 | 0.00 | 0.00 | 0.00 | 0.00 | 0.00 | 26.71 | 69.99 | 0.00 | 0.00 | 0.00 | 0.00 | 7.31 | 92.69 | -0.10 | 9.85 | 10.04 | 0.02669 | 0.02267 | 2.58 |
| 1-25680 | 0.00 | 1.79 | 0.00 | 0.00 | 0.00 | 0.00 | 94.25 | 0.02 | 0.00 | 0.00 | 0.00 | 0.00 | 99.98 | -0.13 | 10.01 | 10.09 | 0.02893 | 0.03344 | 2.76 |
| 1-25688 | 0.00 | 6.03 | 0.00 | 0.00 | 0.00 | 10.33 | 80.42 | 0.08 | 0.00 | 0.00 | 0.00 | 4.89 | 95.03 | 0.33 | 9.66 | 10.01 | 0.01729 | 0.01877 | 4.50 |
| 1-258455 | 0.00 | 1.27 | 0.00 | 0.00 | 0.00 | 0.00 | 95.81 | 0.02 | 0.00 | 0.00 | 0.00 | 0.00 | 99.98 | 0.26 | 9.98 | 10.08 | 0.0147 | 0.01823 | 2.76 |
| 1-259650 | 0.00 | 1.69 | 0.00 | 0.00 | 0.00 | 0.00 | 94.87 | 0.02 | 0.00 | 0.00 | 0.00 | 0.00 | 99.98 | 0.23 | 10.04 | 10.11 | 0.02089 | 0.02388 | 1.96 |
| 1-264513 | 0.00 | 9.38 | 0.00 | 4.55 | 15.78 | 36.93 | 30.91 | 0.15 | 0.00 | 0.57 | 5.19 | 13.71 | 80.37 | 0.35 | 9.15 | 9.93 | 0.01918 | 0.0212 | 1.82 |
| 1-270160 | 0.00 | 1.21 | 0.00 | 0.00 | 0.00 | 0.00 | 94.65 | 0.01 | 0.00 | 0.00 | 0.00 | 0.00 | 99.99 | 0.39 | 10.06 | 10.11 | 0.02402 | 0.02761 | 3.05 |
| 1-274646 | 0.43 | 2.52 | 0.67 | 0.00 | 15.02 | 52.28 | 25.36 | 0.04 | 0.02 | 0.00 | 5.27 | 25.68 | 68.98 | 0.41 | 9.33 | 9.81 | 0.03476 | 0.02703 | 1.93 |
| 1-274663 | 1.97 | 0.00 | 0.00 | 0.00 | 0.00 | 0.00 | 95.14 | 0.00 | 0.00 | 0.00 | 0.00 | 0.00 | 100.00 | 0.07 | 10.11 | 10.11 | 0.01707 | 0.01898 | 1.61 |
| 1-276679 | 15.39 | 4.90 | 0.00 | 0.00 | 22.42 | 42.50 | 13.72 | 0.08 | 0.00 | 0.00 | 14.85 | 38.57 | 46.50 | 0.32 | 9.14 | 9.48 | 0.02879 | 0.03368 | 5.12 |
| 1-282144 | 13.94 | 8.05 | 0.00 | 0.00 | 8.22 | 57.94 | 10.42 | 0.36 | 0.00 | 0.00 | 4.98 | 53.94 | 40.72 | 0.69 | 9.06 | 9.48 | 0.01918 | 0.0306 | 6.20 |
| 1-283246 | 0.00 | 0.00 | 0.00 | 0.00 | 0.00 | 31.06 | 64.84 | 0.00 | 0.00 | 0.00 | 0.00 | 10.34 | 89.66 | -0.01 | 9.72 | 9.95 | 0.0276 | 0.02202 | 2.83 |
| 1-285031 | 0.00 | 9.10 | 0.00 | 0.00 | 18.70 | 0.00 | 72.37 | 0.12 | 0.00 | 0.00 | 3.13 | 0.00 | 96.75 | 0.88 | 9.57 | 10.07 | 0.01309 | 0.01318 | 2.50 |
| 1-285052 | 0.00 | 1.84 | 0.00 | 0.00 | 6.78 | 0.00 | 87.30 | 0.01 | 0.00 | 0.00 | 1.06 | 0.00 | 98.92 | 0.12 | 9.95 | 10.10 | 0.0202 | 0.01998 | 3.31 |
| 1-210785 | 0.00 | 2.36 | 0.00 | 0.00 | 5.12 | 7.49 | 81.03 | 0.01 | 0.00 | 0.00 | 0.83 | 1.62 | 97.54 | 0.00 | 9.91 | 10.09 | 0.01956 | 0.02166 | 1.97 |
| 1-286804 | 0.00 | 0.00 | 8.24 | 16.66 | 24.32 | 42.92 | 5.58 | 0.00 | 0.79 | 5.34 | 20.46 | 48.78 | 24.63 | 0.33 | 8.95 | 9.34 | 0.02839 | 0.02756 | 3.96 |
| 1-289865 | 2.24 | 0.00 | 0.00 | 0.00 | 0.00 | 0.00 | 94.47 | 0.00 | 0.00 | 0.00 | 0.00 | 0.00 | 100.00 | -0.21 | 10.08 | 10.10 | 0.02269 | 0.02628 | 1.70 |
| 1-295095 | 2.49 | 0.00 | 0.00 | 0.00 | 0.00 | 37.87 | 56.60 | 0.00 | 0.00 | 0.00 | 0.00 | 14.38 | 85.62 | 0.07 | 9.69 | 9.95 | 0.0273 | 0.0198 | 3.53 |
| 1-320681 | 0.00 | 0.00 | 0.00 | 0.00 | 0.00 | 10.53 | 85.98 | 0.00 | 0.00 | 0.00 | 0.00 | 1.25 | 98.75 | -0.07 | 10.01 | 10.10 | 0.02525 | 0.02942 | 1.70 |
| 1-338828 | 0.00 | 16.73 | 7.73 | 0.00 | 8.65 | 58.85 | 7.16 | 0.43 | 0.44 | 0.00 | 5.37 | 51.09 | 42.67 | 1.00 | 8.78 | 9.58 | 0.02418 | 0.03773 | 4.30 |
| 1-339028 | 2.72 | 0.00 | 0.00 | 0.00 | 0.00 | 0.00 | 94.05 | 0.00 | 0.00 | 0.00 | 0.00 | 0.00 | 100.00 | -0.08 | 10.11 | 10.11 | 0.02326 | 0.02611 | 2.33 |
| 1-339125 | 0.00 | 1.99 | 0.00 | 0.00 | 0.00 | 0.57 | 94.78 | 0.01 | 0.00 | 0.00 | 0.00 | 0.07 | 99.92 | 0.41 | 10.02 | 10.11 | 0.01708 | 0.02065 | 3.18 |
| 1-351538 | 7.68 | 2.73 | 0.00 | 0.00 | 6.55 | 26.05 | 53.68 | 0.05 | 0.00 | 0.00 | 1.18 | 7.80 | 90.97 | 0.32 | 9.65 | 10.03 | 0.02409 | 0.0241 | 3.94 |
| 1-36878 | 0.00 | 8.72 | 0.00 | 2.05 | 13.83 | 45.19 | 27.80 | 0.17 | 0.00 | 0.26 | 4.55 | 19.97 | 75.05 | 0.84 | 9.25 | 9.90 | 0.01882 | 0.02383 | 2.21 |
| 1-37062 | 1.96 | 5.04 | 18.39 | 0.00 | 32.06 | 16.55 | 23.61 | 0.08 | 0.70 | 0.00 | 12.73 | 8.76 | 77.73 | 0.77 | 8.88 | 9.88 | 0.02567 | 0.02812 | 2.35 |
| 1-37079 | 15.94 | 4.62 | 0.00 | 0.00 | 0.00 | 59.29 | 17.37 | 0.13 | 0.00 | 0.00 | 0.00 | 57.50 | 42.37 | 0.06 | 9.25 | 9.46 | 0.02414 | 0.02946 | 7.75 |
| 1-377125 | 12.64 | 0.00 | 0.00 | 0.00 | 0.00 | 31.51 | 53.78 | 0.00 | 0.00 | 0.00 | 0.00 | 10.73 | 89.27 | 0.16 | 9.77 | 10.01 | 0.03576 | 0.03091 | 4.22 |
| 1-377321 | 21.35 | 27.63 | 0.00 | 15.90 | 0.00 | 25.58 | 7.92 | 1.34 | 0.00 | 5.66 | 0.00 | 25.86 | 67.14 | 0.20 | 8.28 | 9.71 | 0.01203 | 0.03579 | 2.33 |
| 1-378401 | 0.00 | 0.00 | 0.00 | 1.58 | 0.00 | 0.00 | 95.58 | 0.00 | 0.00 | 0.08 | 0.00 | 0.00 | 99.92 | -0.05 | 10.09 | 10.11 | 0.02769 | 0.03087 | 2.46 |
| 1-378795 | 1.69 | 0.00 | 0.00 | 0.00 | 0.00 | 12.23 | 81.65 | 0.00 | 0.00 | 0.00 | 0.00 | 3.13 | 96.87 | 0.24 | 9.93 | 10.06 | 0.02149 | 0.02 | 3.81 |
| 1-379087 | 15.45 | 5.06 | 3.25 | 0.00 | 4.42 | 21.55 | 47.54 | 0.06 | 0.08 | 0.00 | 1.19 | 7.48 | 91.19 | 0.37 | 9.51 | 10.02 | 0.01631 | 0.02329 | 2.87 |
| 1-379660 | 0.00 | 1.11 | 0.00 | 0.00 | 36.10 | 12.52 | 47.77 | 0.02 | 0.00 | 0.00 | 9.50 | 4.45 | 86.03 | 0.45 | 9.50 | 9.94 | 0.02892 | 0.02331 | 1.66 |
| 1-386452 | 0.00 | 5.48 | 0.00 | 2.46 | 7.83 | 40.57 | 41.26 | 0.11 | 0.00 | 0.23 | 1.97 | 13.57 | 84.12 | 0.30 | 9.45 | 9.98 | 0.0168 | 0.02326 | 1.60 |
| mangaID | FC | xyy | xyo | xIy | xII | xIo | xo | myy | myo | mIy | mII | mIo | mo | Adev | |||||
|---|---|---|---|---|---|---|---|---|---|---|---|---|---|---|---|---|---|---|---|
| (1) | (2) | (3) | (4) | (5) | (6) | (7) | (8) | (9) | (10) | (11) | (12) | (13) | (14) | (15) | (16) | (17) | (18) | (19) | (20) |
| 1-386695 | 19.61 | 24.78 | 0.00 | 9.17 | 0.00 | 30.32 | 15.10 | 0.78 | 0.00 | 2.01 | 0.00 | 17.65 | 79.55 | 0.14 | 8.55 | 9.89 | 0.01586 | 0.03372 | 3.29 |
| 1-392976 | 1.90 | 0.00 | 0.00 | 0.00 | 0.00 | 8.78 | 87.13 | 0.00 | 0.00 | 0.00 | 0.00 | 2.95 | 97.05 | 0.08 | 9.93 | 10.04 | 0.01636 | 0.01699 | 3.38 |
| 1-322671 | 0.00 | 0.00 | 0.00 | 0.00 | 0.00 | 32.03 | 63.35 | 0.00 | 0.00 | 0.00 | 0.00 | 9.53 | 90.47 | 0.00 | 9.76 | 9.99 | 0.02973 | 0.0227 | 2.53 |
| 1-43009 | 9.00 | 0.00 | 0.00 | 0.00 | 0.00 | 37.60 | 52.89 | 0.00 | 0.00 | 0.00 | 0.00 | 14.31 | 85.69 | 0.31 | 9.68 | 9.90 | 0.02034 | 0.02292 | 4.45 |
| 1-43721 | 4.01 | 0.00 | 0.00 | 0.00 | 0.00 | 0.00 | 94.49 | 0.00 | 0.00 | 0.00 | 0.00 | 0.00 | 100.00 | 0.14 | 10.11 | 10.11 | 0.02641 | 0.03012 | 3.26 |
| 1-44789 | 0.00 | 0.00 | 0.00 | 0.00 | 0.00 | 0.00 | 96.11 | 0.00 | 0.00 | 0.00 | 0.00 | 0.00 | 100.00 | 0.17 | 10.08 | 10.10 | 0.01943 | 0.02304 | 3.57 |
| 1-47499 | 0.00 | 1.90 | 0.00 | 0.00 | 11.79 | 0.00 | 83.53 | 0.03 | 0.00 | 0.00 | 2.29 | 0.00 | 97.68 | 0.39 | 9.78 | 10.04 | 0.01892 | 0.01871 | 2.97 |
| 1-48208 | 0.00 | 1.62 | 0.00 | 0.00 | 0.00 | 0.00 | 94.83 | 0.02 | 0.00 | 0.00 | 0.00 | 0.00 | 99.98 | -0.11 | 10.04 | 10.11 | 0.02153 | 0.0236 | 2.06 |
| 1-487130 | 0.00 | 10.02 | 0.00 | 0.00 | 8.67 | 51.80 | 27.75 | 0.17 | 0.00 | 0.00 | 2.48 | 25.46 | 71.89 | 0.42 | 9.19 | 9.86 | 0.01724 | 0.02632 | 3.97 |
| 1-489649 | 0.00 | 0.84 | 0.00 | 0.00 | 0.00 | 0.00 | 95.53 | 0.01 | 0.00 | 0.00 | 0.00 | 0.00 | 99.99 | 0.21 | 9.99 | 10.08 | 0.01646 | 0.01877 | 2.75 |
| 1-491233 | 0.00 | 4.43 | 3.77 | 3.32 | 1.99 | 39.65 | 43.89 | 0.07 | 0.09 | 0.32 | 0.51 | 13.43 | 85.59 | 0.60 | 9.44 | 9.99 | 0.01447 | 0.02146 | 2.67 |
| 1-519738 | 0.00 | 0.00 | 0.00 | 0.00 | 0.00 | 15.67 | 79.93 | 0.00 | 0.00 | 0.00 | 0.00 | 3.51 | 96.49 | -0.09 | 9.97 | 10.08 | 0.02318 | 0.02071 | 1.74 |
| 1-52259 | 3.49 | 5.53 | 0.00 | 0.00 | 29.55 | 32.81 | 26.06 | 0.17 | 0.00 | 0.00 | 10.76 | 16.19 | 72.88 | 0.43 | 9.22 | 9.82 | 0.02862 | 0.03064 | 3.23 |
| 1-55572 | 0.00 | 1.96 | 0.00 | 1.96 | 0.00 | 0.00 | 93.04 | 0.02 | 0.00 | 0.10 | 0.00 | 0.00 | 99.88 | -0.22 | 10.00 | 10.11 | 0.02372 | 0.0266 | 1.87 |
| 1-604048 | 0.00 | 2.13 | 0.00 | 0.00 | 18.87 | 1.09 | 77.52 | 0.03 | 0.00 | 0.00 | 3.19 | 0.30 | 96.48 | 0.15 | 9.78 | 10.06 | 0.01837 | 0.01727 | 1.70 |
| 1-613211 | 0.00 | 1.37 | 0.00 | 0.33 | 0.00 | 0.00 | 94.87 | 0.01 | 0.00 | 0.02 | 0.00 | 0.00 | 99.97 | -0.04 | 10.05 | 10.11 | 0.02866 | 0.03107 | 2.14 |
| 1-626830 | 0.00 | 1.90 | 0.00 | 3.56 | 26.07 | 10.95 | 55.32 | 0.02 | 0.00 | 0.34 | 6.63 | 3.71 | 89.28 | 0.55 | 9.51 | 9.96 | 0.02513 | 0.02435 | 2.59 |
| 1-322074 | 0.00 | 0.00 | 0.00 | 0.00 | 0.00 | 39.98 | 56.43 | 0.00 | 0.00 | 0.00 | 0.00 | 13.89 | 86.11 | 0.08 | 9.72 | 9.98 | 0.02835 | 0.01969 | 2.49 |
| 1-633990 | 7.36 | 22.54 | 0.00 | 0.00 | 0.00 | 37.91 | 30.08 | 0.29 | 0.00 | 0.00 | 0.00 | 17.12 | 82.58 | 0.56 | 9.04 | 9.98 | 0.01428 | 0.02867 | 2.98 |
| 1-633994 | 0.00 | 1.49 | 0.00 | 0.00 | 10.82 | 9.43 | 75.39 | 0.01 | 0.00 | 0.00 | 2.01 | 2.57 | 95.41 | 1.19 | 9.80 | 10.05 | 0.0248 | 0.02387 | 3.11 |
| 1-48053 | 0.00 | 4.42 | 0.00 | 0.00 | 0.00 | 0.00 | 92.42 | 0.03 | 0.00 | 0.00 | 0.00 | 0.00 | 99.97 | 0.00 | 9.96 | 10.11 | 0.02649 | 0.02932 | 1.76 |
| 1-635503 | 0.00 | 22.47 | 10.86 | 0.00 | 0.00 | 35.45 | 32.37 | 0.39 | 0.41 | 0.00 | 0.00 | 19.28 | 79.93 | 1.15 | 8.78 | 9.89 | 0.01045 | 0.02839 | 3.25 |
| 1-71481 | 3.01 | 0.00 | 0.00 | 0.00 | 0.00 | 2.51 | 91.76 | 0.00 | 0.00 | 0.00 | 0.00 | 0.28 | 99.72 | -0.07 | 10.09 | 10.11 | 0.0274 | 0.02989 | 2.22 |
| 1-71525 | 0.00 | 2.20 | 0.00 | 0.00 | 0.00 | 0.00 | 94.16 | 0.02 | 0.00 | 0.00 | 0.00 | 0.00 | 99.98 | 0.33 | 9.87 | 10.05 | 0.01612 | 0.02106 | 2.99 |
| 1-72914 | 5.38 | 0.00 | 0.00 | 0.00 | 0.00 | 23.39 | 68.11 | 0.00 | 0.00 | 0.00 | 0.00 | 5.85 | 94.15 | 0.19 | 9.90 | 10.07 | 0.02155 | 0.02217 | 3.35 |
| 1-72928 | 0.00 | 0.00 | 0.00 | 0.00 | 0.00 | 0.00 | 96.34 | 0.00 | 0.00 | 0.00 | 0.00 | 0.00 | 100.00 | -0.14 | 10.06 | 10.10 | 0.02221 | 0.02526 | 2.31 |
| 1-73005 | 0.00 | 0.00 | 0.00 | 0.00 | 17.26 | 39.48 | 41.22 | 0.00 | 0.00 | 0.00 | 4.85 | 14.80 | 80.35 | 0.32 | 9.60 | 9.93 | 0.01782 | 0.01843 | 2.85 |
| 1-90849 | 4.99 | 0.00 | 0.00 | 0.00 | 18.92 | 1.51 | 70.51 | 0.00 | 0.00 | 0.00 | 3.84 | 0.45 | 95.70 | 0.24 | 9.81 | 10.05 | 0.02369 | 0.01937 | 3.30 |
| 1-92626 | 1.70 | 0.65 | 0.00 | 0.00 | 0.00 | 0.00 | 92.91 | 0.01 | 0.00 | 0.00 | 0.00 | 0.00 | 99.99 | 0.03 | 10.04 | 10.10 | 0.02273 | 0.02675 | 2.69 |
| 1-93876 | 4.73 | 0.00 | 0.00 | 0.00 | 0.00 | 20.53 | 71.66 | 0.00 | 0.00 | 0.00 | 0.00 | 5.07 | 94.93 | -0.08 | 9.89 | 10.05 | 0.02999 | 0.02718 | 3.64 |
| 1-94422 | 3.24 | 0.00 | 0.00 | 0.00 | 0.00 | 25.12 | 67.74 | 0.00 | 0.00 | 0.00 | 0.00 | 6.84 | 93.16 | 0.17 | 9.83 | 10.04 | 0.02905 | 0.0258 | 2.86 |
| 1-94554 | 4.48 | 0.00 | 0.00 | 0.00 | 0.00 | 5.49 | 86.38 | 0.00 | 0.00 | 0.00 | 0.00 | 1.08 | 98.92 | 0.01 | 10.07 | 10.11 | 0.02174 | 0.02448 | 2.25 |