Close entrainment of massive molecular gas flows by radio bubbles in the central galaxy of Abell 1795
Abstract
We present new ALMA observations tracing the morphology and velocity structure of the molecular gas in the central galaxy of the cluster Abell 1795. The molecular gas lies in two filaments that extend to the N and S from the nucleus and project exclusively around the outer edges of two inner radio bubbles. Radio jets launched by the central AGN have inflated bubbles filled with relativistic plasma into the hot atmosphere surrounding the central galaxy. The N filament has a smoothly increasing velocity gradient along its length from the central galaxy’s systemic velocity at the nucleus to , the average velocity of the surrounding galaxies, at the furthest extent. The S filament has a similarly smooth but shallower velocity gradient and appears to have partially collapsed in a burst of star formation. The close spatial association with the radio lobes, together with the ordered velocity gradients and narrow velocity dispersions, show that the molecular filaments are gas flows entrained by the expanding radio bubbles. Assuming a Galactic factor, the total molecular gas mass is . More than half lies above the N radio bubble. Lifting the molecular clouds appears to require an infeasibly efficient coupling between the molecular gas and the radio bubble. The energy required also exceeds the mechanical power of the N radio bubble by a factor of two. Stimulated feedback, where the radio bubbles lift low entropy X-ray gas that becomes thermally unstable and rapidly cools in situ, provides a plausible model. Multiple generations of radio bubbles are required to lift this substantial gas mass. The close morphological association then indicates that the cold gas either moulds the newly expanding bubbles or is itself pushed aside and shaped as they inflate.
keywords:
galaxies:active — galaxies: clusters: Abell 1795 — galaxies:evolution — cooling flows1 Introduction
Recent discoveries of massive gas outflows driven by intense radiation or radio-jets have demonstrated how effectively the energy released by an AGN can interact with its host environment (eg. Morganti et al. 2005; Nesvadba et al. 2006; Feruglio et al. 2010; Rupke & Veilleux 2011; Sturm et al. 2011; Alatalo et al. 2011; Dasyra & Combes 2011; Cicone et al. 2014; Tadhunter et al. 2014; Morganti et al. 2015). Cold molecular gas is observed to be the dominant mass component of these outflows. By heating and expelling this dense, cold gas from the galaxy centre, the AGN activity can limit the fuel available for star formation and accretion onto the SMBH and thereby regulate galaxy growth. Known as AGN feedback, this mechanism is now routinely included in simulations of galaxy formation to quench star formation in early-type galaxies, suppress massive galaxy growth at late times and drive the observed coevolution of galaxy bulges and SMBHs (eg. Magorrian et al. 1998; Di Matteo et al. 2005; Croton et al. 2006; Bower et al. 2006; Hopkins et al. 2006).
Jet-driven outflows are likely to be particularly important in massive galaxies, where 30% are radio loud. The radio loud fraction increases to 70-90% in the most massive galaxies located at the centres of hot atmospheres with short radiative cooling times (eg. Burns 1990; Dunn & Fabian 2006; Best et al. 2007). In these systems, Chandra X-ray observations reveal the highly effective coupling between the X-ray gas and the radio jets. Jets launched by the central AGN inflate large radio bubbles that displace the hot atmosphere to create cavities in the X-ray surface brightness (eg. Boehringer et al. 1993; McNamara et al. 2000; Fabian et al. 2000). Although the central AGN are relatively weak radio sources, the mechanical power of the jets exceeds the synchrotron luminosity by orders of magnitude (eg. Bîrzan et al. 2008). This energy input is sufficient to keep the intracluster medium (ICM) hot, prevent the formation of a cooling flow (for reviews see Peterson & Fabian 2006; McNamara & Nulsen 2007) and drive massive hot and cold gas flows to tens of kpc (eg. Simionescu et al. 2008; Kirkpatrick et al. 2009; Salomé et al. 2006; Salomé et al. 2011). ALMA observations of several central cluster galaxies have revealed molecular gas filaments extending for a few up to around or beneath radio bubbles inflated by the jet (McNamara et al. 2014, Russell et al. 2016, 2017). Detailed studies of nearby systems, that spatially resolve the structure and kinematics of an outflow, are now needed to investigate the acceleration mechanism and constrain key parameters, such as the energy injected into the molecular gas and the coupling efficiency (eg. Morganti et al. 2013; Tadhunter et al. 2014; Morganti et al. 2015; Dasyra et al. 2016).
The central galaxy of the nearby cluster Abell 1795 hosts a powerful FR I radio source, 4C 26.42, which has inflated two large ( diameter) radio bubbles to the N and S of the nucleus (van Breugel et al. 1984; Fabian et al. 2001). The rims of these radio bubbles are clearly traced by extended cool gas filaments, visible in soft X-ray, H and CO emission, and bright knots of star formation (McNamara et al. 1996; Pinkney et al. 1996; Fabian et al. 2001; Salomé & Combes 2004; Crawford et al. 2005). This close spatial association suggests direct interactions between the radio plasma and the cool gas, which may be condensing from the displaced X-ray gas. Strong deflections of the radio lobes, at close to a right angle, also suggest interactions between the radio jets and the ISM (eg. Liuzzo et al. 2009). Crawford et al. (2005) studied the line ratios and widths of key optical emission lines at these locations and found an increase in ionization state, turbulence and density of the gas here implying a direct interaction with the radio lobe.
On larger scales, Abell 1795 hosts a spectacular -long filament detected in soft X-ray and H emission with several clumps of molecular gas and star formation along its length (Cowie et al. 1983; Fabian et al. 2001; Salomé & Combes 2004; McDonald & Veilleux 2009; McDonald et al. 2012b). The formation of this filament may be linked to a possible outer radio bubble, tentatively detected as an X-ray cavity in deep Chandra observations. Alternatively, the filament may have formed as gas cooled in the wake of the central galaxy that is moving through the cluster atmosphere (Fabian et al. 2001; Bîrzan et al. 2004; Crawford et al. 2005). The central galaxy is travelling with a peculiar velocity of relative to the average of all the other cluster galaxies, and faster than the galaxies just within the cluster core (Hill et al. 1988; Zabludoff et al. 1990; Oegerle & Hill 1994). This motion, and the sloshing cold fronts observed in the X-ray atmosphere, may have been triggered by a minor merger (Markevitch et al. 2001). X-ray gas with a short radiative cooling time in the cluster core will rapidly cool to low temperatures in the gravitational field of the central galaxy as it passes (David et al. 1994; Fabian et al. 2001). This would focus cool gas into a line along the direction of the central galaxy’s motion. From the cluster’s NFW potential (Hogan et al. 2017) and the central galaxy’s line of sight velocity, the galaxy’s sloshing motion in the potential will span a few tens of kpc. This is consistent with the filament’s length and suggests that the galaxy is close to apocenter. The ionized gas velocities at large radius in the -long filament are also consistent with the average of the cluster galaxies rather than the central galaxy (Hu et al. 1985). Therefore, whilst the hot and cool gas structure in the galaxy centre traces the radio bubble activity, on larger scales it may be influenced by the galaxy motion through the cluster atmosphere.
Here we present new ALMA observations of the CO(2-1) emission from the molecular gas in the central galaxy of Abell 1795. By resolving the spatial and velocity structure of the molecular filaments, we investigate the interactions between the cold gas and the expanding radio bubbles.
2 Data reduction
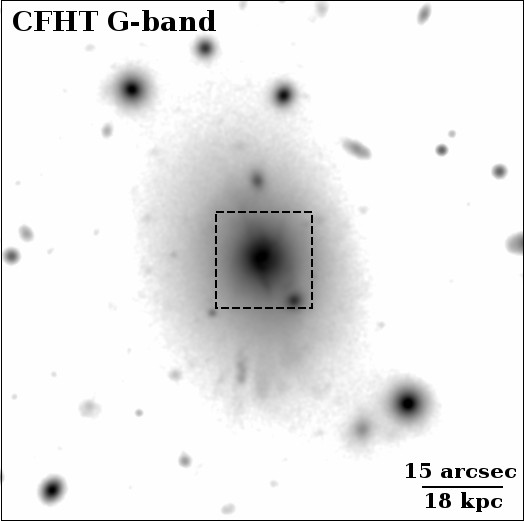
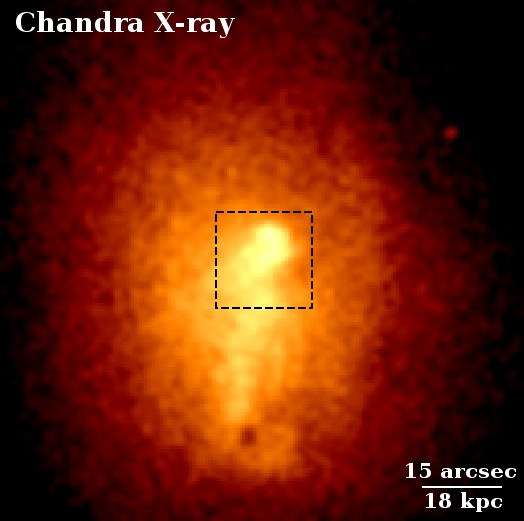
The central galaxy in Abell 1795 was observed with the ALMA array using the Band 6 receiver for a total time on source of divided equally between 11 and 14 June 2016. The single pointing was centred on the H and FUV emission peaks close to the galaxy nucleus with a field of view of . One spectral window covered the CO(2-1) emission line at and three additional windows were used to image the sub-mm continuum emission at , and . The baselines ranged from and thirty-eight antennas were available for each observation. J1229+0203 and Titan were observed for bandpass and flux calibration. Observations of the bright quasar J1333+2725 were interspersed with the target observations for phase calibration. The frequency division correlator mode was used for the spectral line observation with a bandwidth and frequency resolution of . The velocity channels were later binned to a resolution of for the analysis.
The datasets were calibrated in casa version 4.5.3 (McMullin et al. 2007) with the ALMA pipeline reduction scripts. The continuum emission was determined from line-free channels and subtracted from visibilities using the task uvcontsub. The calibrated continuum-subtracted visibilities were then imaged and deconvolved with the clean algorithm. Self-calibration was not found to produce a significant reduction in the image rms noise. Stellar absorption measurements for the central galaxy give a redshift , which is consistent with the ionized gas velocities around the nucleus (Hill et al. 1988; Hu et al. 1985; Hill & Oegerle 1993; Anton 1993). We therefore use this redshift to denote the velocity centre and show in section 3.2 that this corresponds to the velocity centre of the molecular gas peak around the nucleus. For a standard CDM cosmology with , and , one arcsecond is .
The final cube had a synthesized beam of with a position angle P.A. for natural weighting. Different weightings were investigated to determine the optimum for imaging and natural weighting was selected to give the highest signal-to-noise in the extended filaments. The rms noise in channels was . An image of the continuum emission with rms of was produced by averaging line-free channels from all four basebands. The continuum image was generated using Briggs weighting with robust. The synthesized beam in this image was with P.A..
3 Results
3.1 Molecular gas morphology: entrainment
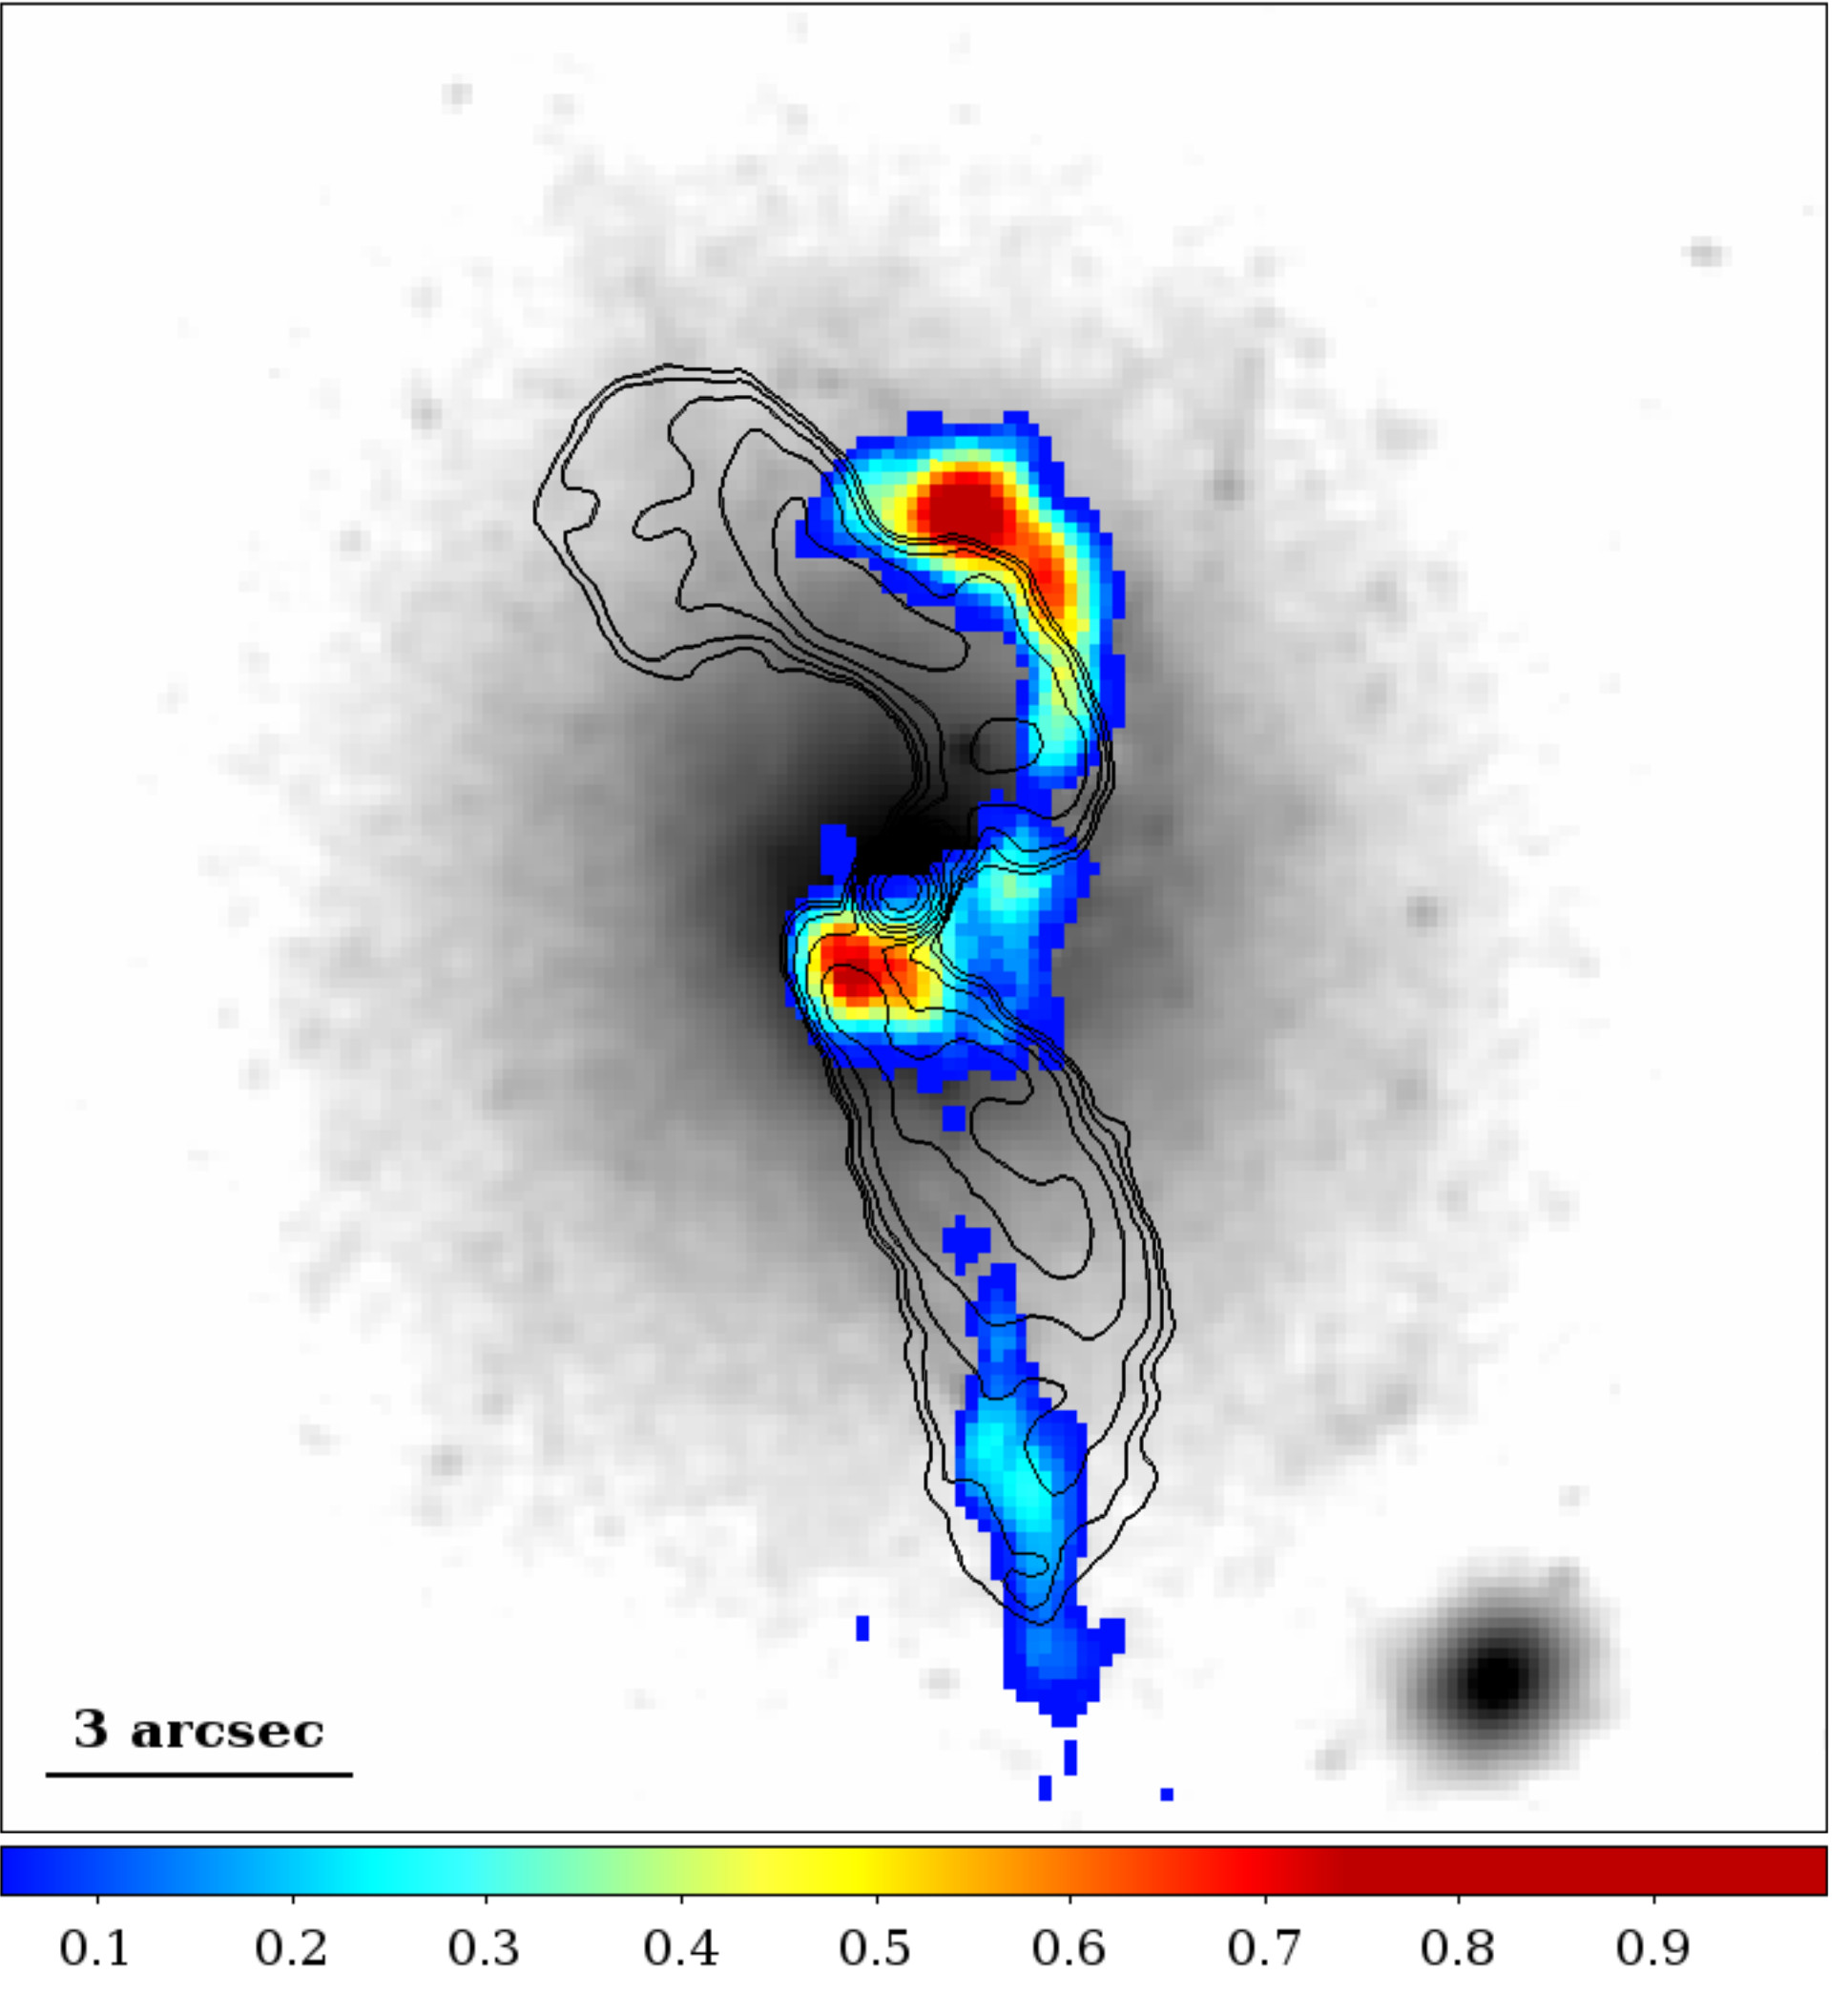
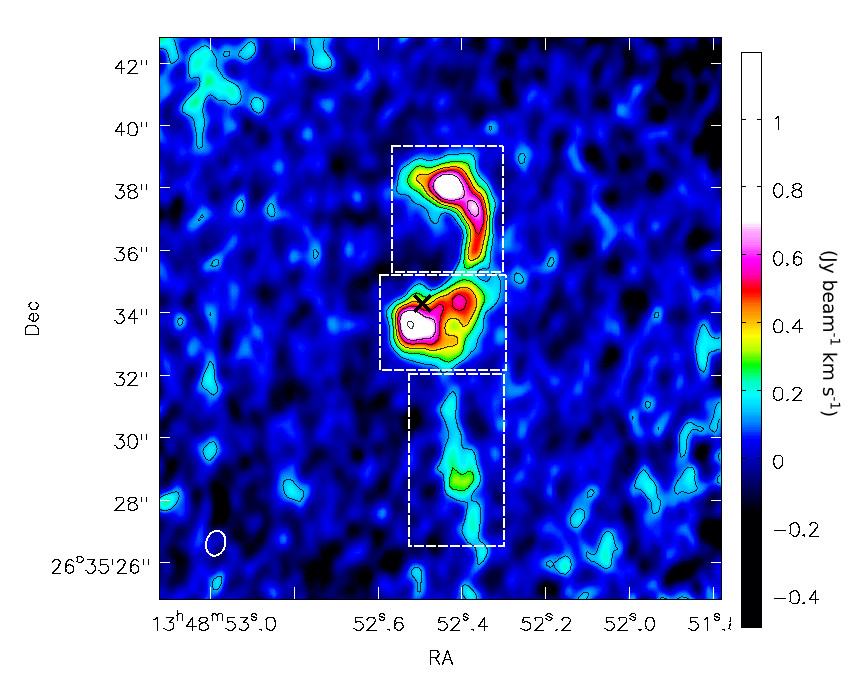
The CO(2-1) integrated emission map (Fig. 1 right) shows a bright peak () to the S of the nucleus and a curved filament extending N to a second emission peak at a radius of (). A second, fainter filament, () in length, extends to the SW of the nucleus. The N filament appears clumpy along its length and may separate into two sections. The S filament appears detached from the central emission peak and spans a much narrower velocity range than the N filament. It is detected at much higher significance () in an integrated emission map covering a more limited velocity range from to . Both filaments coincide with structures detected at CO(1-0) and CO(2-1) in IRAM Plateau de Bure interferometer observations with and spatial resolution, respectively (Salomé & Combes 2004).
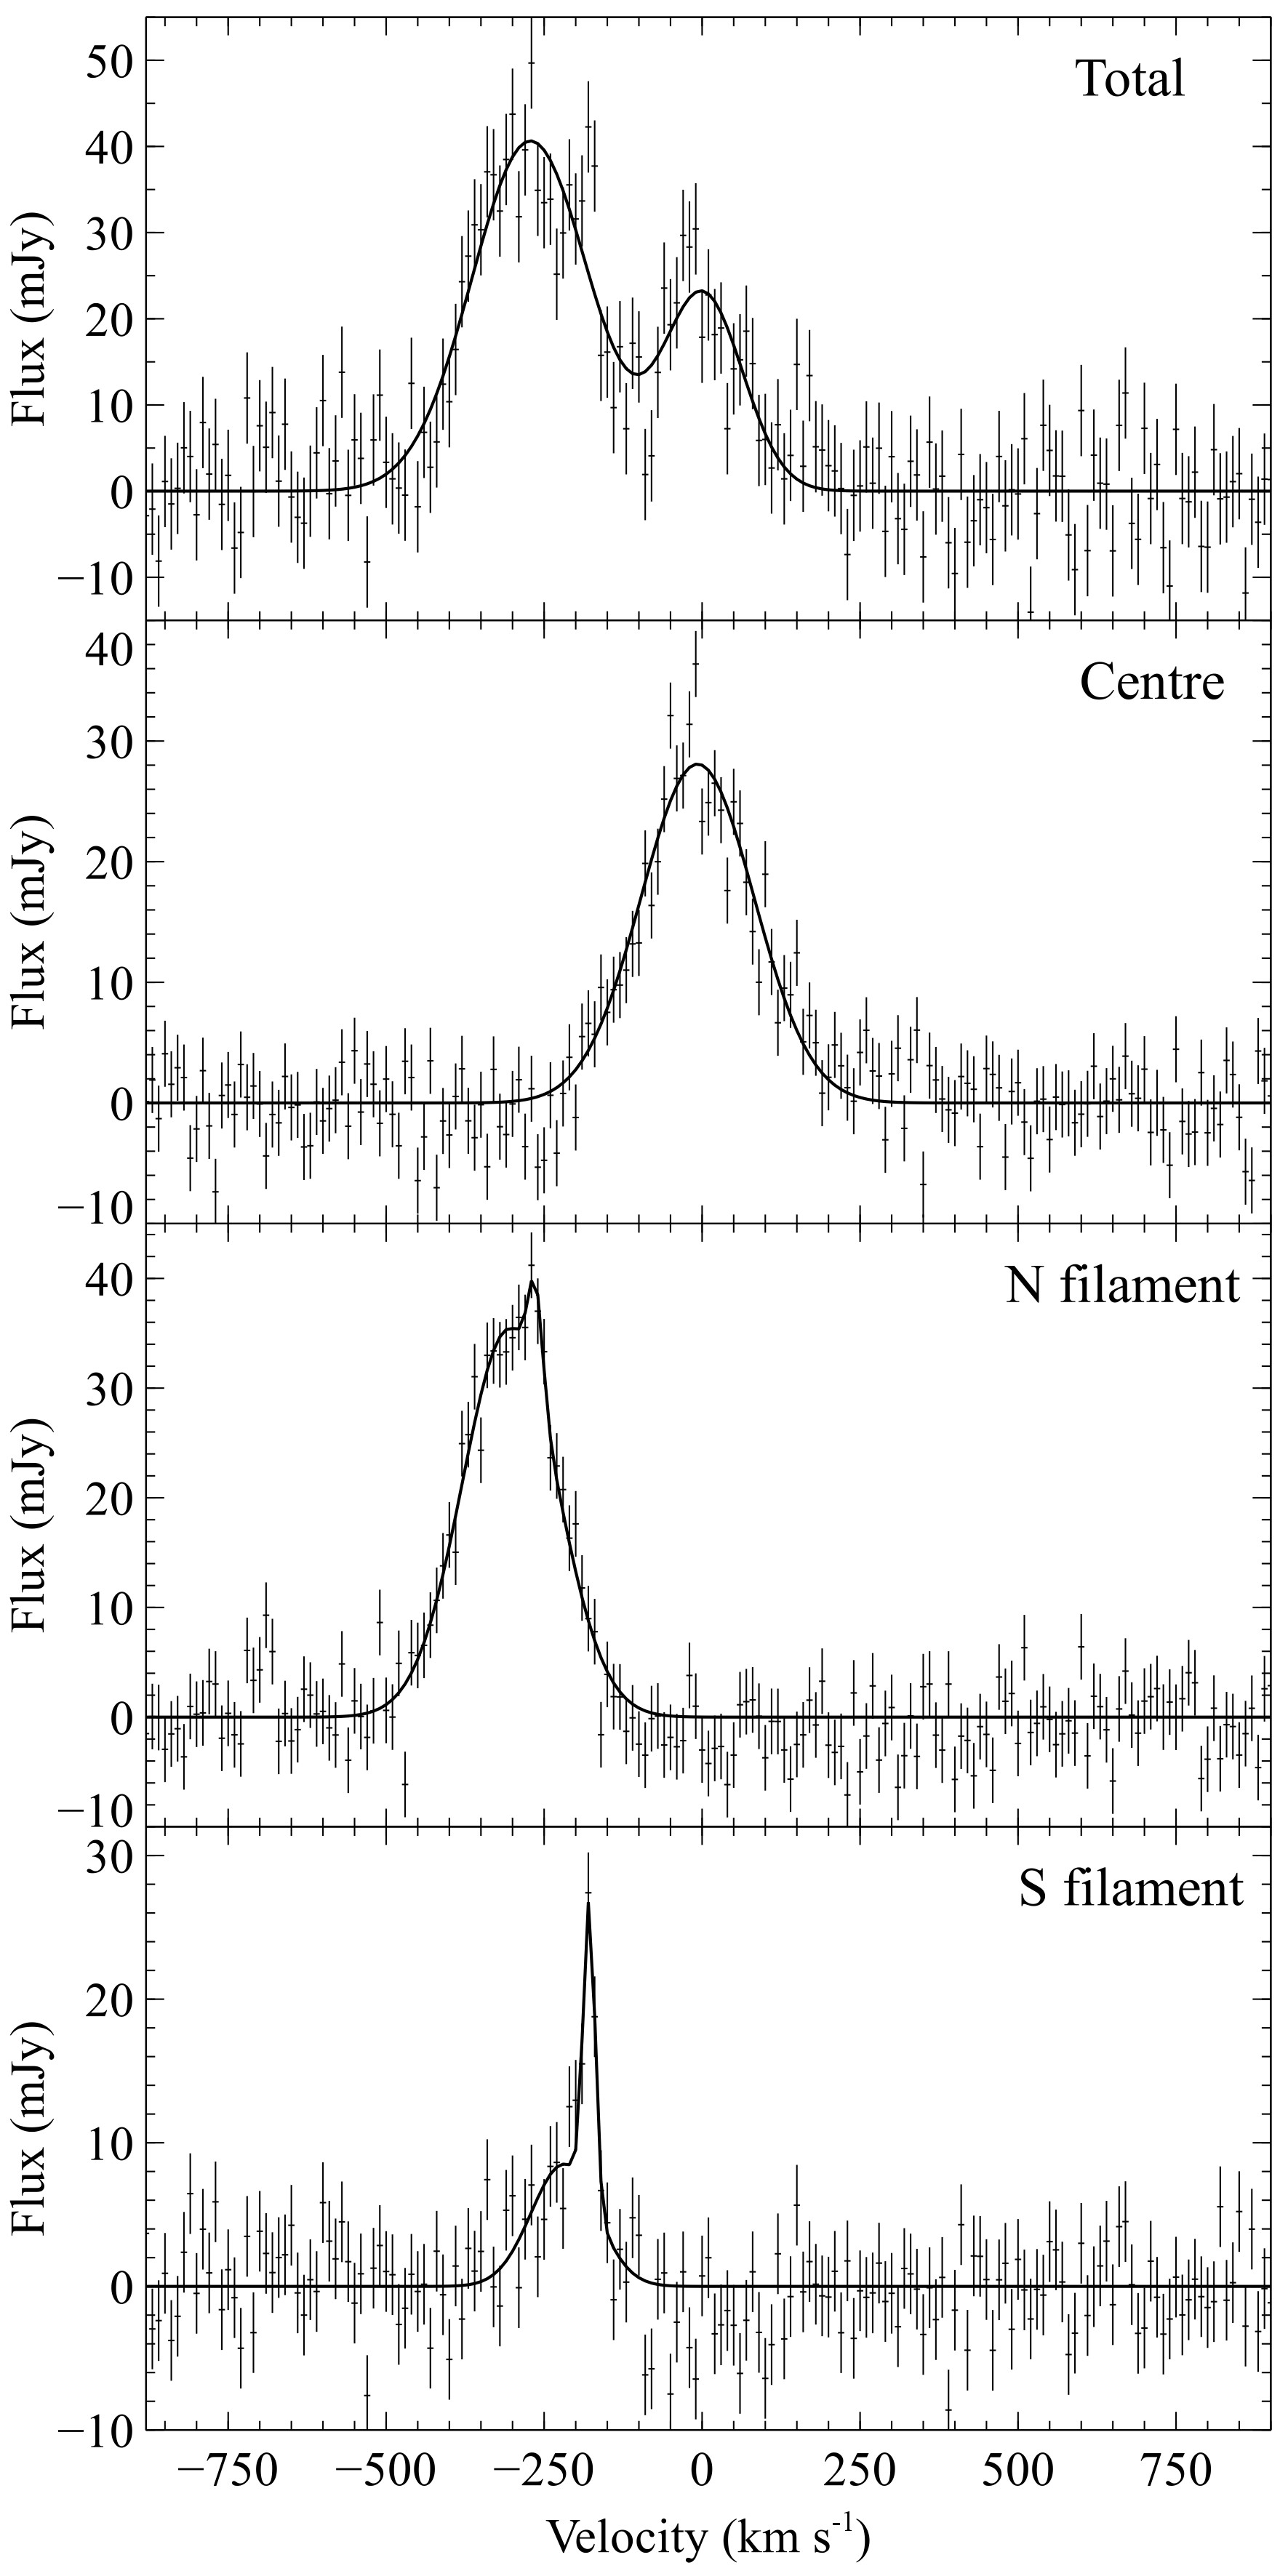
Fig. 2 (top) shows the continuum-subtracted total CO(2-1) spectrum extracted from a region that covers the central peak and the full extent of both filaments. The emission line has two separate velocity components spanning roughly . The total spectrum was fitted with two Gaussian components using the spectral fitting package mpfit (Markwardt 2009). The brightest velocity component is blueshifted to and has a broader FWHM of . The fainter component is narrower with a FWHM of and a velocity centre at , which is consistent with the central galaxy’s systemic velocity. The best-fit results are corrected for instrumental broadening and the primary beam attenuation and are detailed in Table 1. The total integrated intensity is , which is approximately 70% of the total emission detected in IRAM within a beam of (Salomé & Combes 2003; see also Salomé & Combes 2004). Given the extent of the ionized gas nebula, it is likely that some extended structure has been resolved out. However, the similar line shape suggests that no extended emission with particularly different dynamics has been missed.
| Region | /dof | Component | Integrated intensity | Peak | FWHM | Velocity shift |
|---|---|---|---|---|---|---|
| () | (mJy) | () | () | |||
| Total | 208/171 | 1 | ||||
| 2 | ||||||
| Centre | 212/177 | |||||
| N filament | 177/174 | 1 | ||||
| 2 | ||||||
| S filament | 197/174 | 1 | ||||
| 2 |
Fig. 2 also shows the spectra for separate regions covering the the central peak and each filament. The central region covers the emission around the nucleus to the possible break in the N filament at a radius of (). Over 50% of the molecular line emission lies in the extended N filament, 10% is in the S filament and the rest is within a radius of () from the nucleus. The velocity centre for the central peak is consistent with the central galaxy’s systemic stellar velocity. The line emission in the N and S filaments is blueshifted by with respect to the systemic velocity. These broad velocity trends are consistent with that observed at CO(1-0) and CO(2-1) by the IRAM Plateau de Bure interferometer (Salomé & Combes 2004). Fig. 2 (lower panels) also show that the N and S filaments have additional, very narrow velocity components with FWHM of . This narrow component accounts for roughly a third of the line emission from the S filament.
A moments map of the integrated CO(2-1) emission detected at in the velocity range to is shown in Fig. 3. The molecular gas filaments are clearly aligned with the N and S radio lobes detected at with the VLA (van Breugel et al. 1984). The N filament curls up around the outside edge of the N radio lobe. The apparent break in the N filament at a radius of () occurs where the radio lobe bends through and may have broken through a section of the dense filament. The N lobe bends around the bright clump of molecular gas at the furthest extent of the filament and then appears to expand beyond it. The S filament also lies along the outer edge of the S radio lobe. The extended filaments are projected exclusively around the outer peripheries of the radio lobes and comprise over 60% of the CO(2-1) emission. The molecular gas likely forms patchy shells around the radio lobes and therefore appears brightest along the edges where the line of sight through the gas is greatest. However, this does not explain why the molecular gas lies predominantly around only the outer edge of each lobe. In channels between velocities of to , a gas blob is detected at at a radius of underneath the N radio lobe (see also section 3.2.1) but this is considerably fainter than the emission over the top of the lobe.
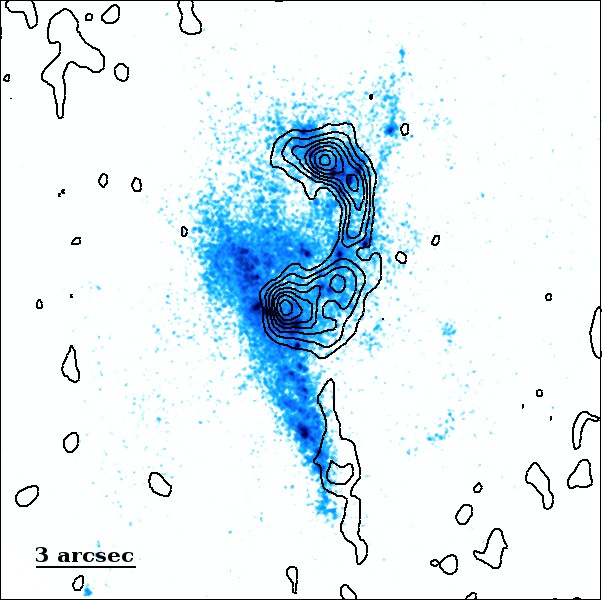
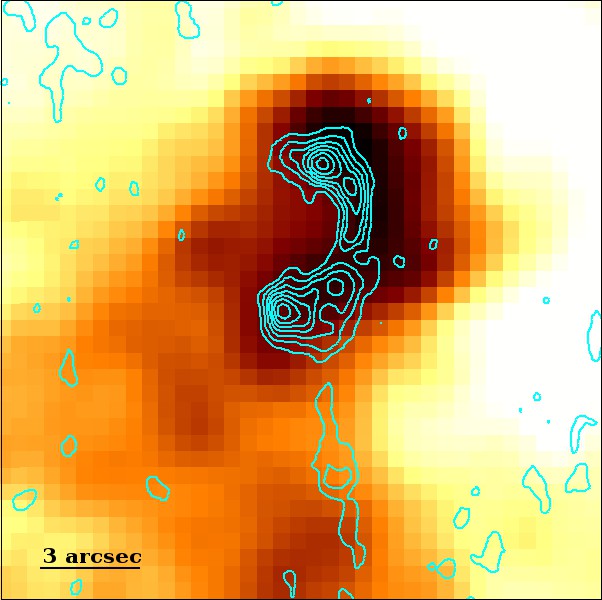
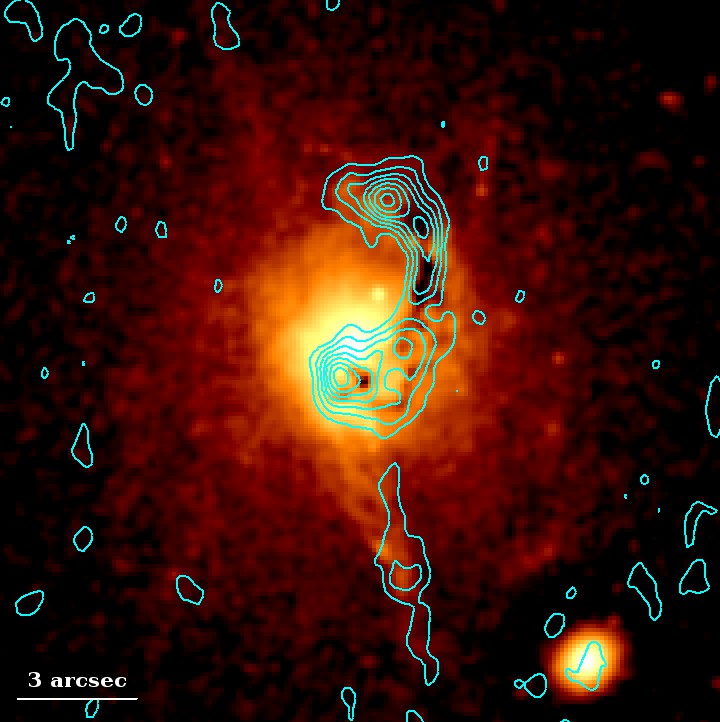
Molecular gas along the inner edge of the S radio lobe may have collapsed to form stars. Fig. 4 shows the CO(2-1) contours overlaid on the HST FUV image of the recent star formation (O’Dea et al. 2004; Tremblay et al. 2015) and the Chandra X-ray image of the hot atmosphere, which shows bright cool gas blobs and depressions coincident with the radio lobes. The N molecular filament appears roughly coincident with many bright knots of star formation and a filament of soft X-ray emission, which denotes rapidly cooling cluster gas. The S molecular filament is anti-correlated with the FUV emission and appears to form a continuation of a young, star-forming filament. The separation of the S filament from the central molecular peak therefore could be due to the collapse of the inner part of the molecular filament into young stars. Stellar population synthesis modelling from FUV spectroscopy found that the youngest stars in the central galaxy have ages of (McDonald et al. 2014a). This is comparable to the sound speed rise time of the inner radio bubbles () and therefore consistent with star formation on the timescale of the radio lobe interaction with the molecular gas in the S filament.
The two molecular emission peaks are clearly offset from the nucleus and appear to be coincident with or located around the outer edges of bends in the radio lobes. VLBA observations of 4C 26.42 show that within a radius of () the radio jet is oriented along a NE-SW axis (P.A.; Liuzzo et al. 2009). At () from the core, the jet turns through to P.A. (NW-SE). The remarkable symmetry of the sharp bends in the jet axis on these scales are likely due to precession in the jet ejection axis (eg. van Breugel et al. 1984) although Liuzzo et al. (2009) suggested that asymmetry in the spectral index of the N and S lobes could be due to collisions with the ISM. Unfortunately, due to the complexity of the structure in the VLBI observations, it was not possible to constrain the jet orientation with respect to the line of sight (Liuzzo et al. 2009). On the kpc-scales traced by the VLA observations (Fig. 3; van Breugel et al. 1984), the radio lobes bend back through and therefore revert to the approximate alignment of the jet on pc-scales. Whilst this could also be due to precession, the ALMA observations suggest that the subsequent radio lobe expansion may be affected by collisions with dense gas clouds at the two emission peaks (see also McNamara et al. 1996; Crawford et al. 2005).
3.2 Velocity structure: gas flows
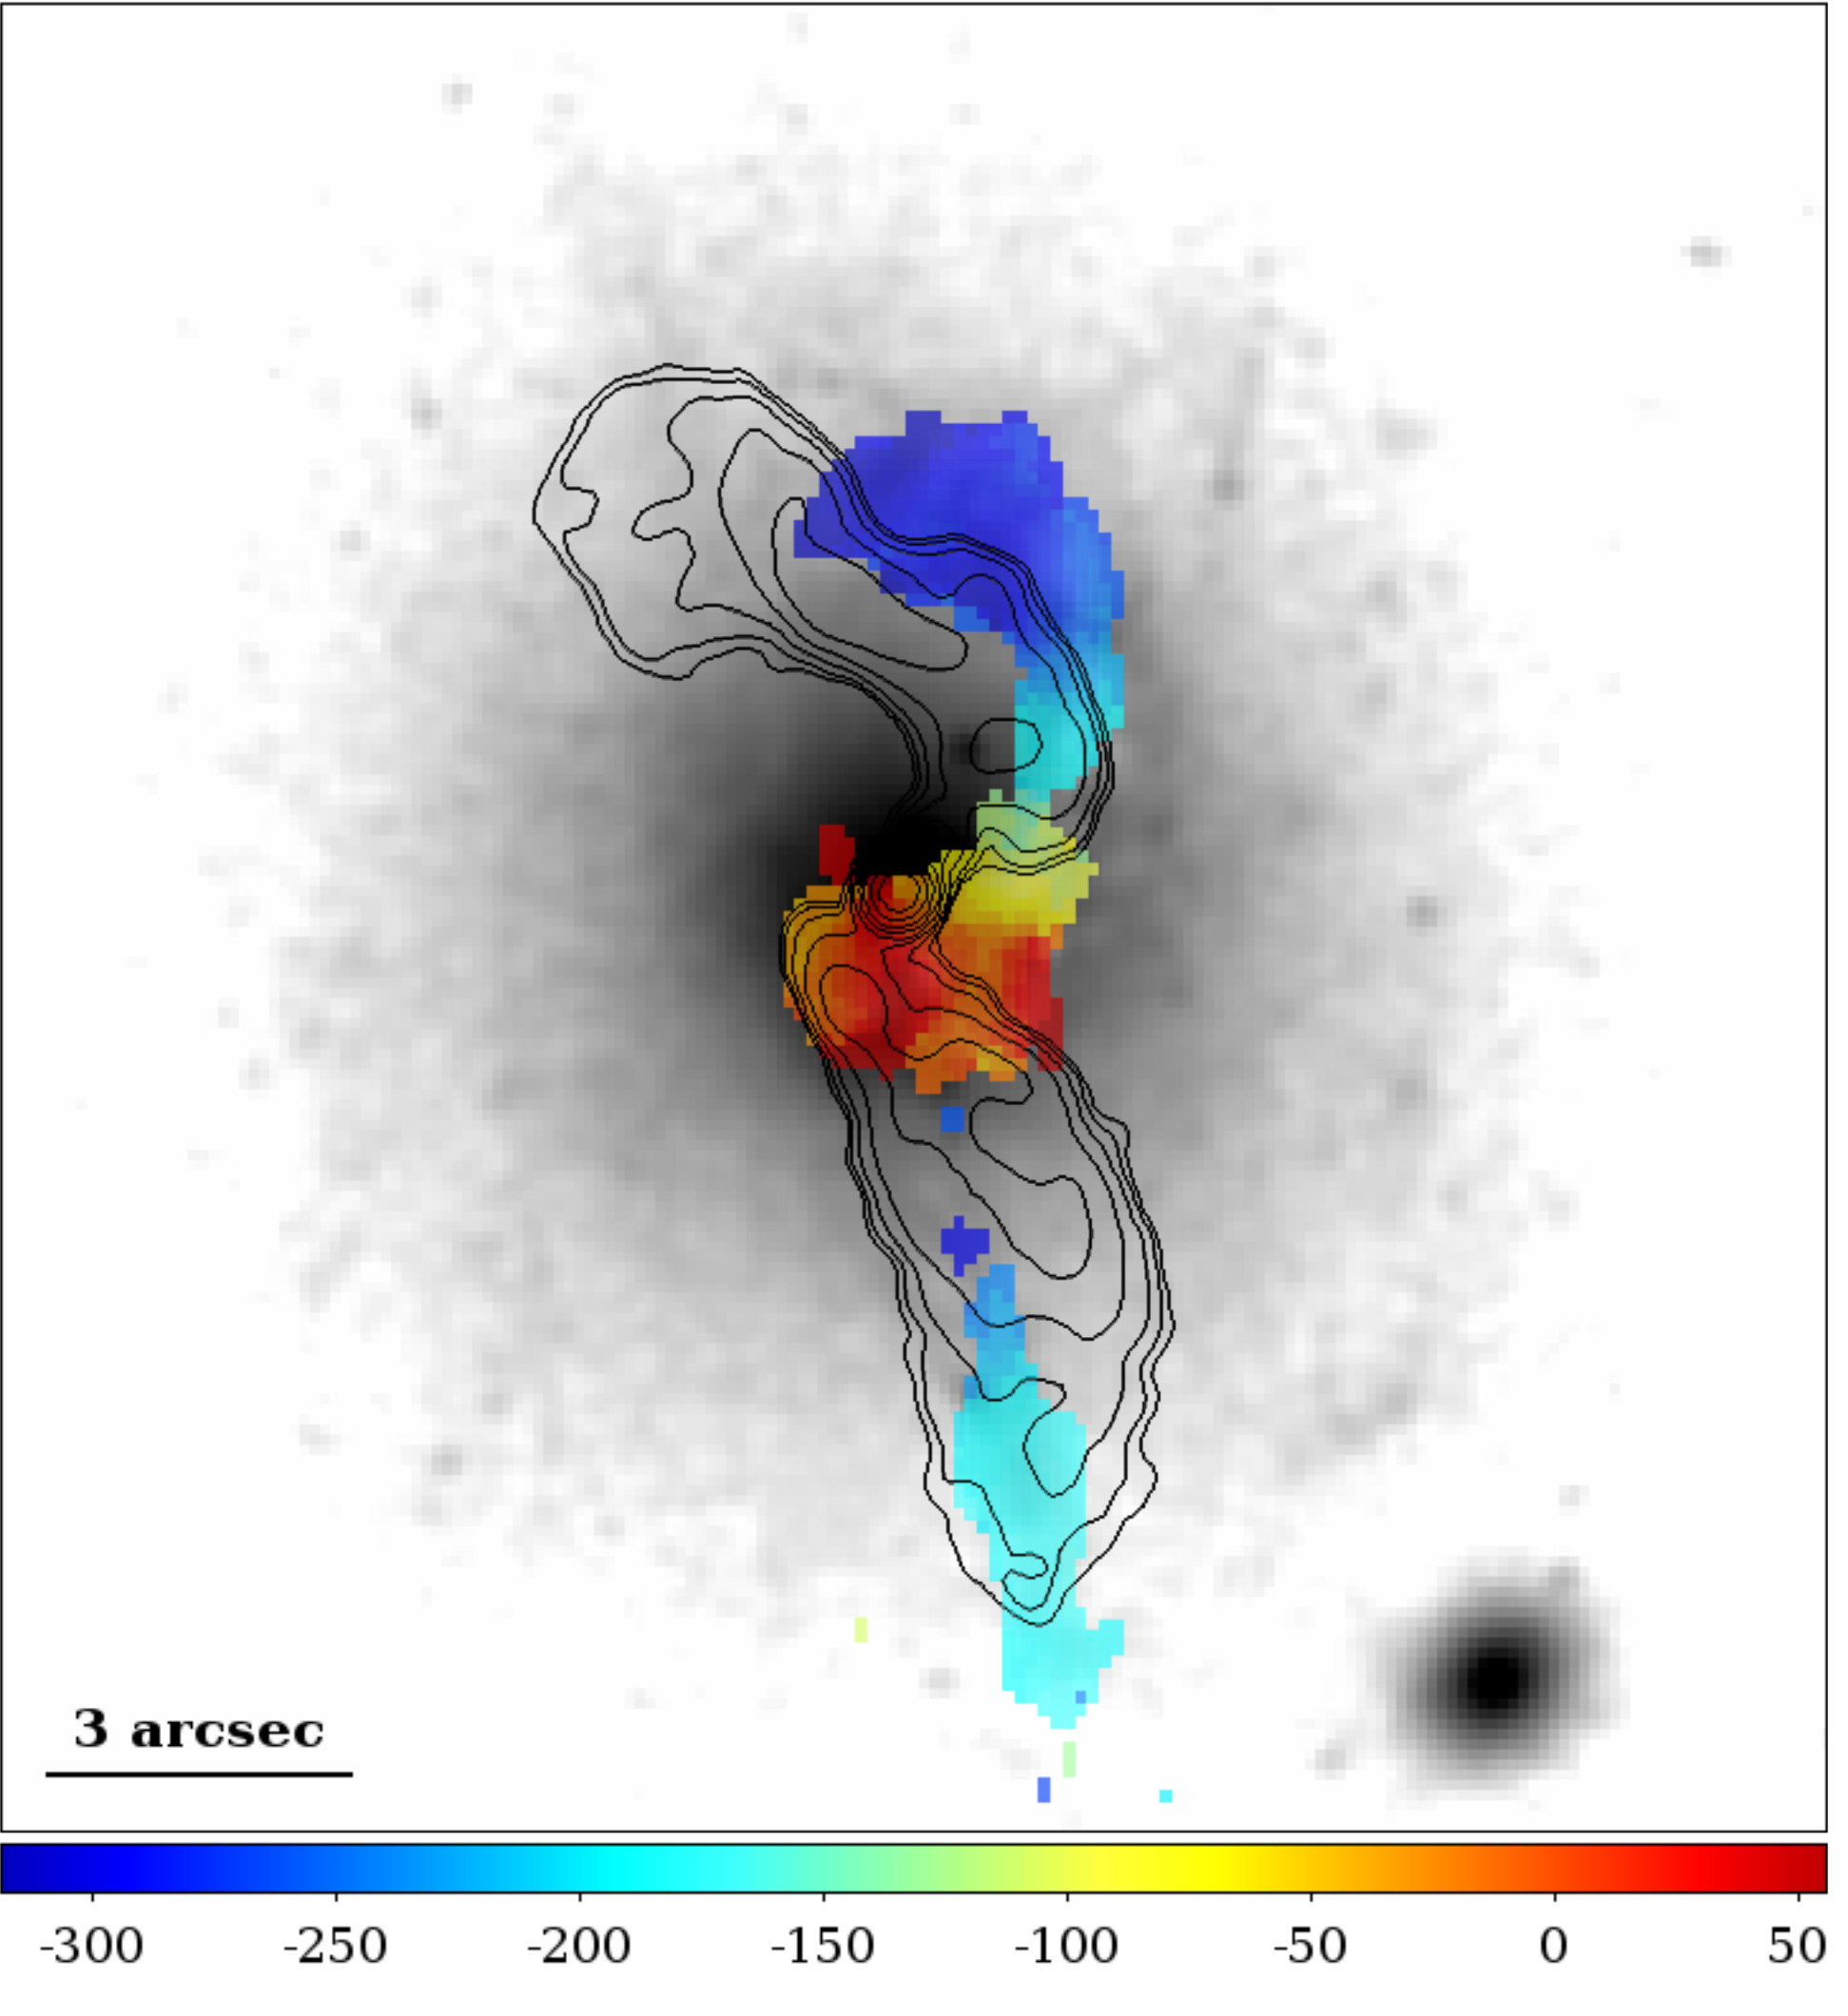
The flux-weighted velocity map (first moment) of the molecular gas reveals a smooth velocity gradient through the N filament from the central gas peak to the furthest extent over the N radio lobe (Fig. 5). The velocity of the molecular gas at the galaxy centre is consistent with the radial velocity from stellar absorption measurements (Hu et al. 1985; Anton 1993). The molecular gas velocity increases smoothly with radius, accelerating toward the observer, from at the nucleus to at the furthest extent of the N filament. The gas velocity at large radius of is consistent with the average for the galaxies in the cluster core (Oegerle & Hill 1994), excluding the central galaxy, and therefore could trace the bulk motion of the intracluster gas. The narrow filament width, and close association with the radio lobe morphology, disfavors ram pressure stripping of this cold gas from the galaxy and instead supports an origin linked to the radio lobe inflation. We discuss the possible interpretations of the gas flows in detail in section 4.
Although the S filament is similarly projected around the outer edge of a radio lobe, the velocity gradient is much shallower. The gas velocity increases towards the nucleus shifting from at the furthest extent to at the base of the S filament. The velocity structure of the S filament is clearly distinct from the central molecular peak at the central galaxy’s systemic velocity. Similar to the N filament, the close spatial association with the radio lobe suggests an origin linked to the bubble inflation and indicates that the filament is not an unrelated structure seen in projection. The contrasting velocity gradient along the S filament could be linked to the disruption of the inner section, potentially due to star formation (section 3.1).
3.2.1 Multiple velocity components
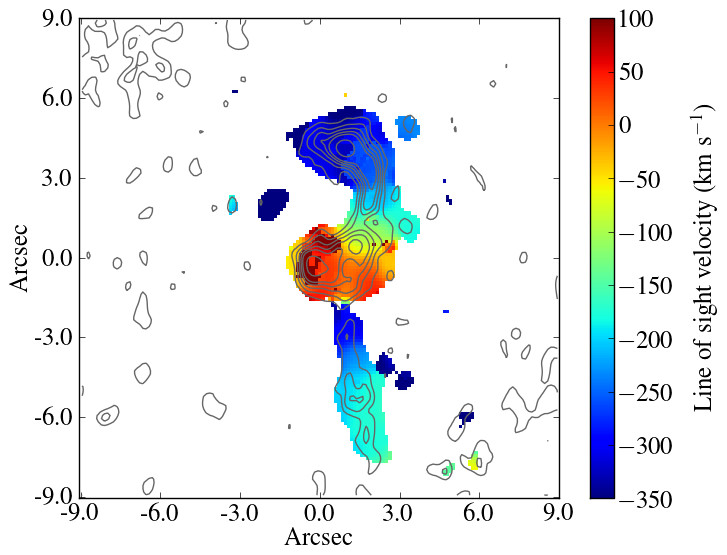
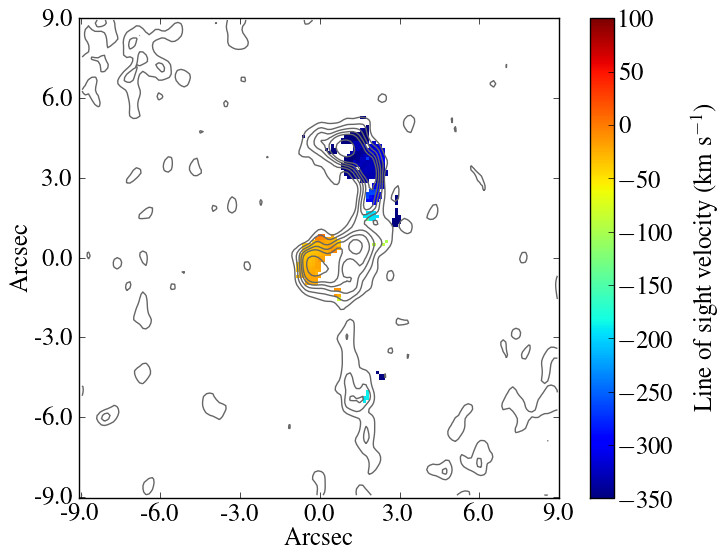
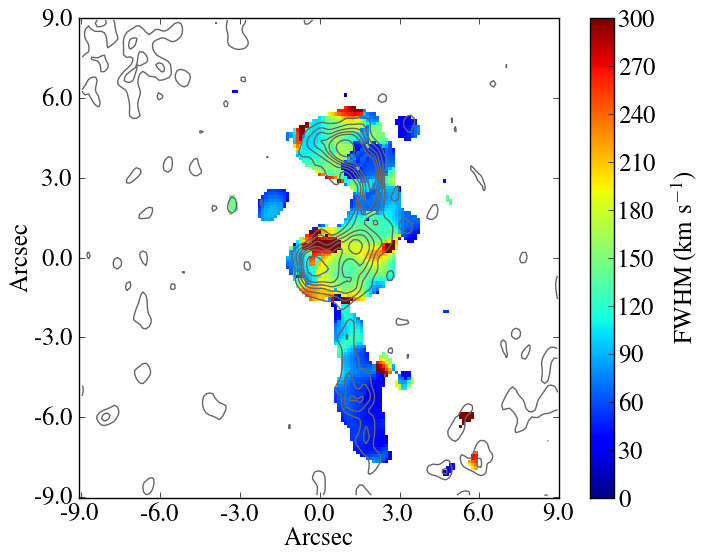
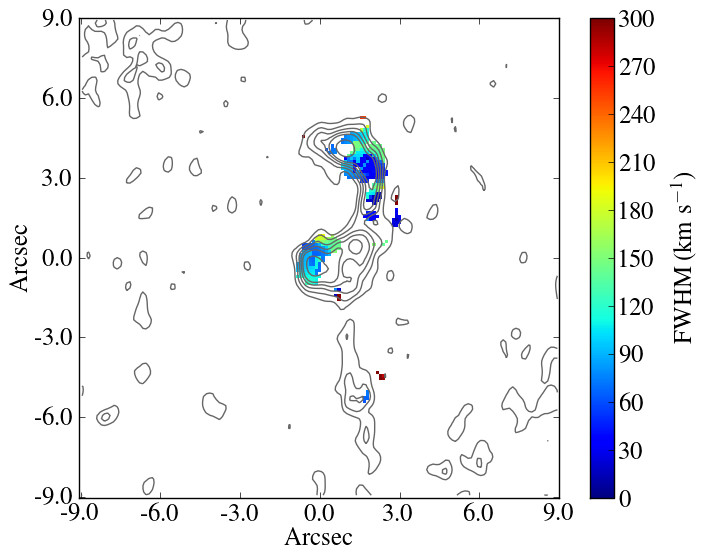
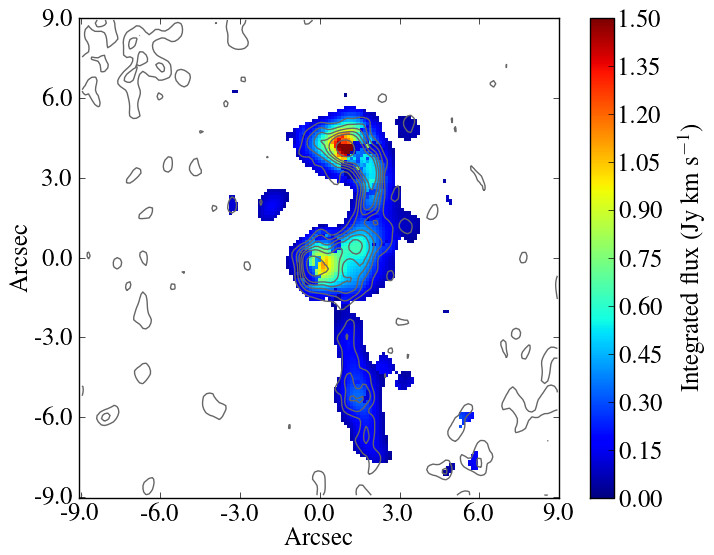
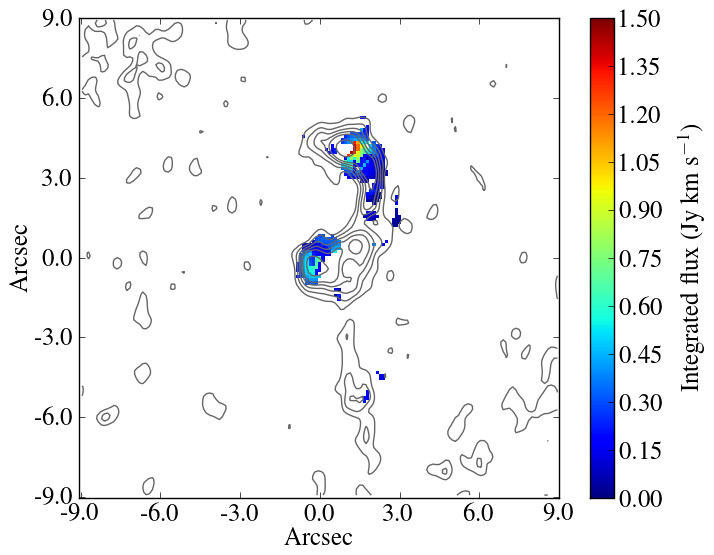
Additional narrow velocity components (Fig. 2) were located by fitting multi-component models to spectra extracted in synthesized beam-sized regions centred on each spatial pixel in the ALMA cube. Each extracted spectrum was fitted with one, two or three Gaussian components using the spectral fitting code mpfit. At least significance, based on 5000 Monte Carlo simulations of the spectrum, was required for the detection of a velocity component in each region.
Fig. 6 shows the resulting maps of the best-fit velocity centre, FWHM and integrated intensity for each component. As discussed in section 3.2, the molecular filaments have smooth velocity gradients along their lengths. The velocity dispersion is less than for the bulk of the molecular gas, which is considerably below the stellar velocity dispersion of (Oegerle & Hoessel 1991; Blakeslee & Tonry 1992). The S filament in particular has a very narrow velocity dispersion that drops below at its furthest extent. The dispersion in this filament increases at smaller radii, which is consistent with possible disruption due to star formation.
A second velocity component is detected in regions to the SE and NW of the nucleus. These regions are positioned along the outer edges of sharp bends in the radio lobes and appear to have comparable velocity structures. The additional velocity components have narrow FWHM (), similar to the bulk of the molecular gas, and the gas velocity is blueshifted by relative to the primary velocity component. The molecular gas does not appear strongly disrupted in these regions. The velocity distribution of the molecular gas clouds may therefore reflect the geometry of the expanding radio lobe as clouds are pushed in different directions along a particular line of sight. This could produce additional discrete velocity components if the cold gas is asymmetrically distributed or the radio lobe divides into multiple streams (Ge & Owen 1993). Alternatively, coupling between the radio lobes and the molecular gas clouds may vary with gas properties, such as density, to produce a broader velocity distribution. However, the increase in velocity dispersion is modest so the acceleration of the molecular clouds must be gentle.
The faint, narrow emission lines of the S filament are detected more significantly by this spectral fitting method than the moment map that sums over a broad velocity range and incorporates more noise. The velocity maps now show clearly that the gas velocities in the S filament are increasing towards the nucleus, in contrast to the N filament. The velocity gradient is shallow through the S filament, with velocities ranging from -170 to over a projected distance of . The inner section of the filament may have collapsed to form stars, which suggests that the S filament could be older than the N filament or that the star formation has disrupted the filament’s support, which is likely due to the indirect effect of magnetic fields. Fabian et al. (2008) have previously shown that the thread-like ionized and molecular gas filaments in NGC 1275, which have a similar structure to the filaments in Abell 1795, must be supported against tidal disruption and evaporation in the hot intracluster medium by magnetic fields. Similarly, extended molecular gas filaments detected with ALMA in PKS 0745-191 show low gas velocities and velocity dispersions significantly below the stellar velocity dispersion and would disperse on timescales without support, which Russell et al. (2016) suggest is due to magnetic fields.
3.2.2 Position-velocity diagrams
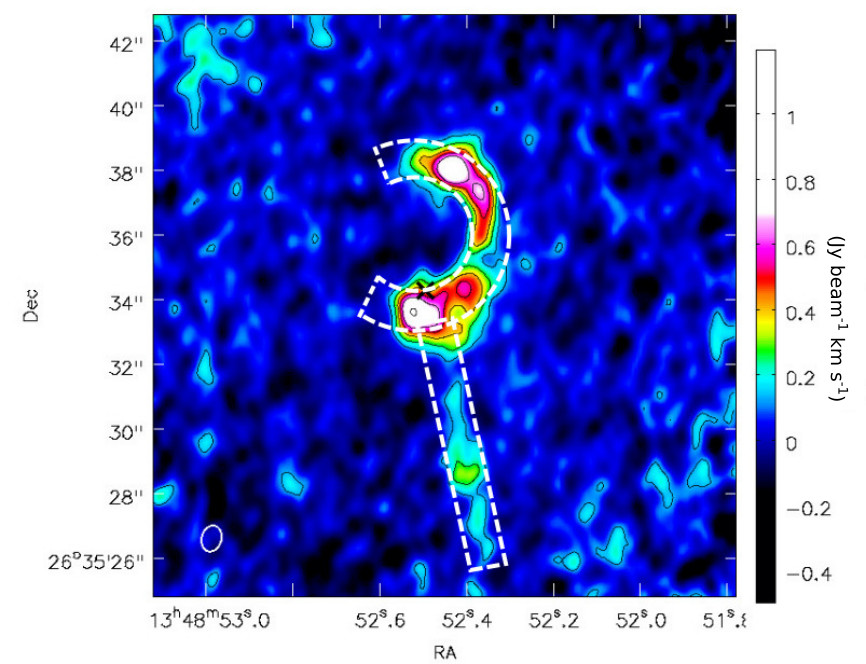
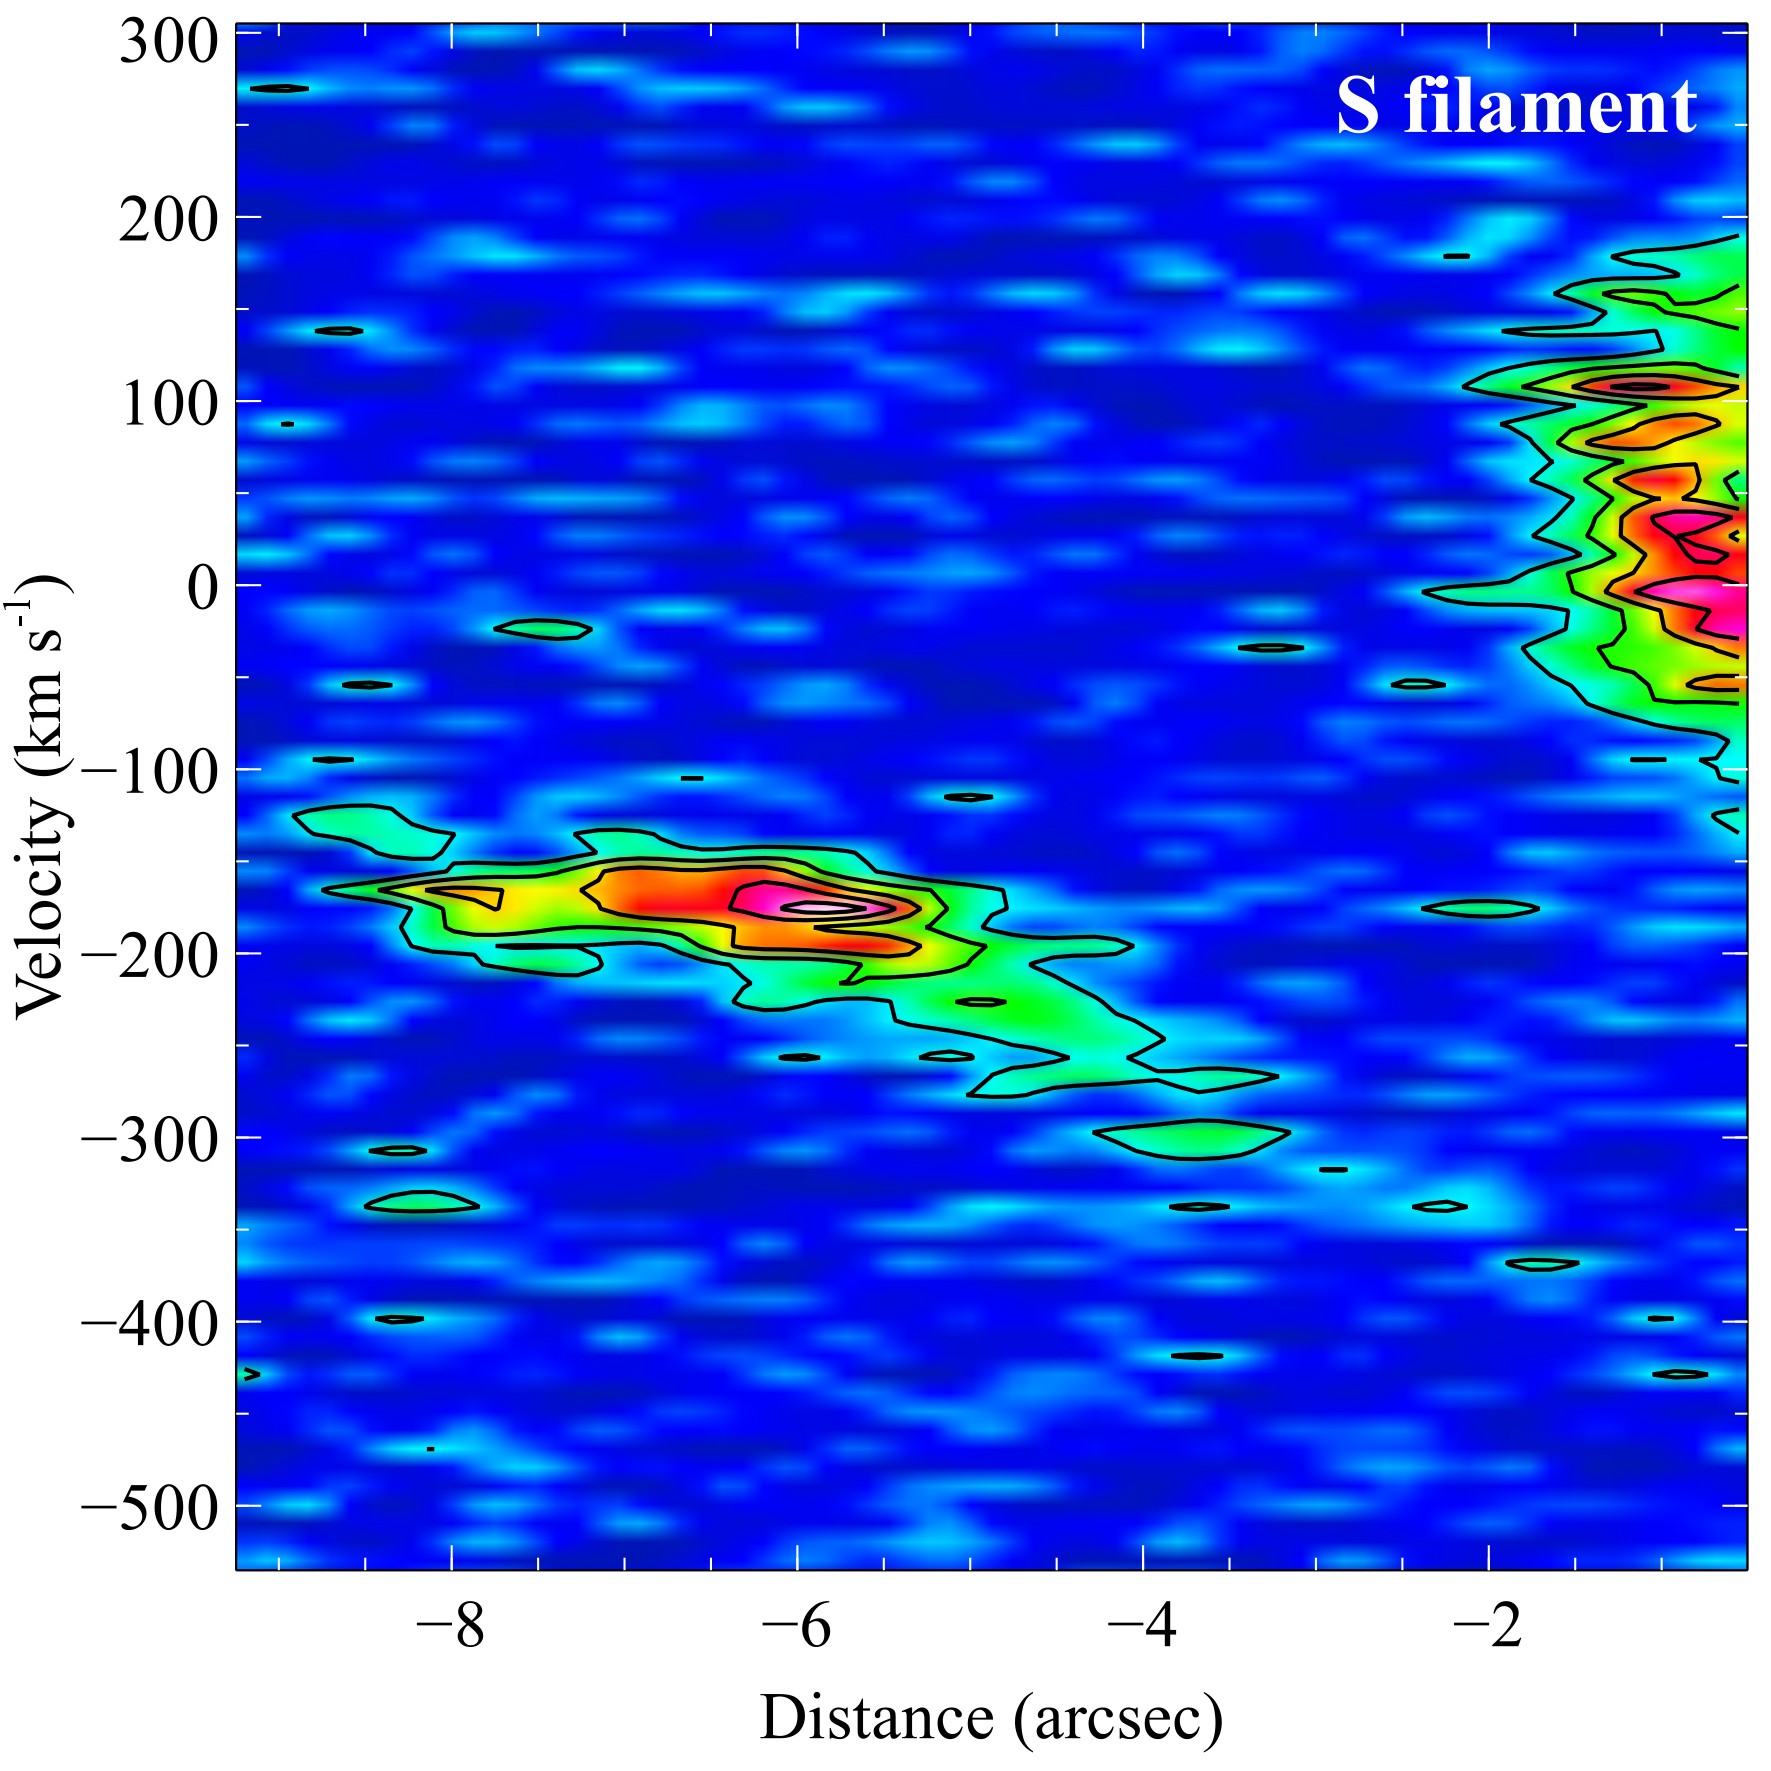
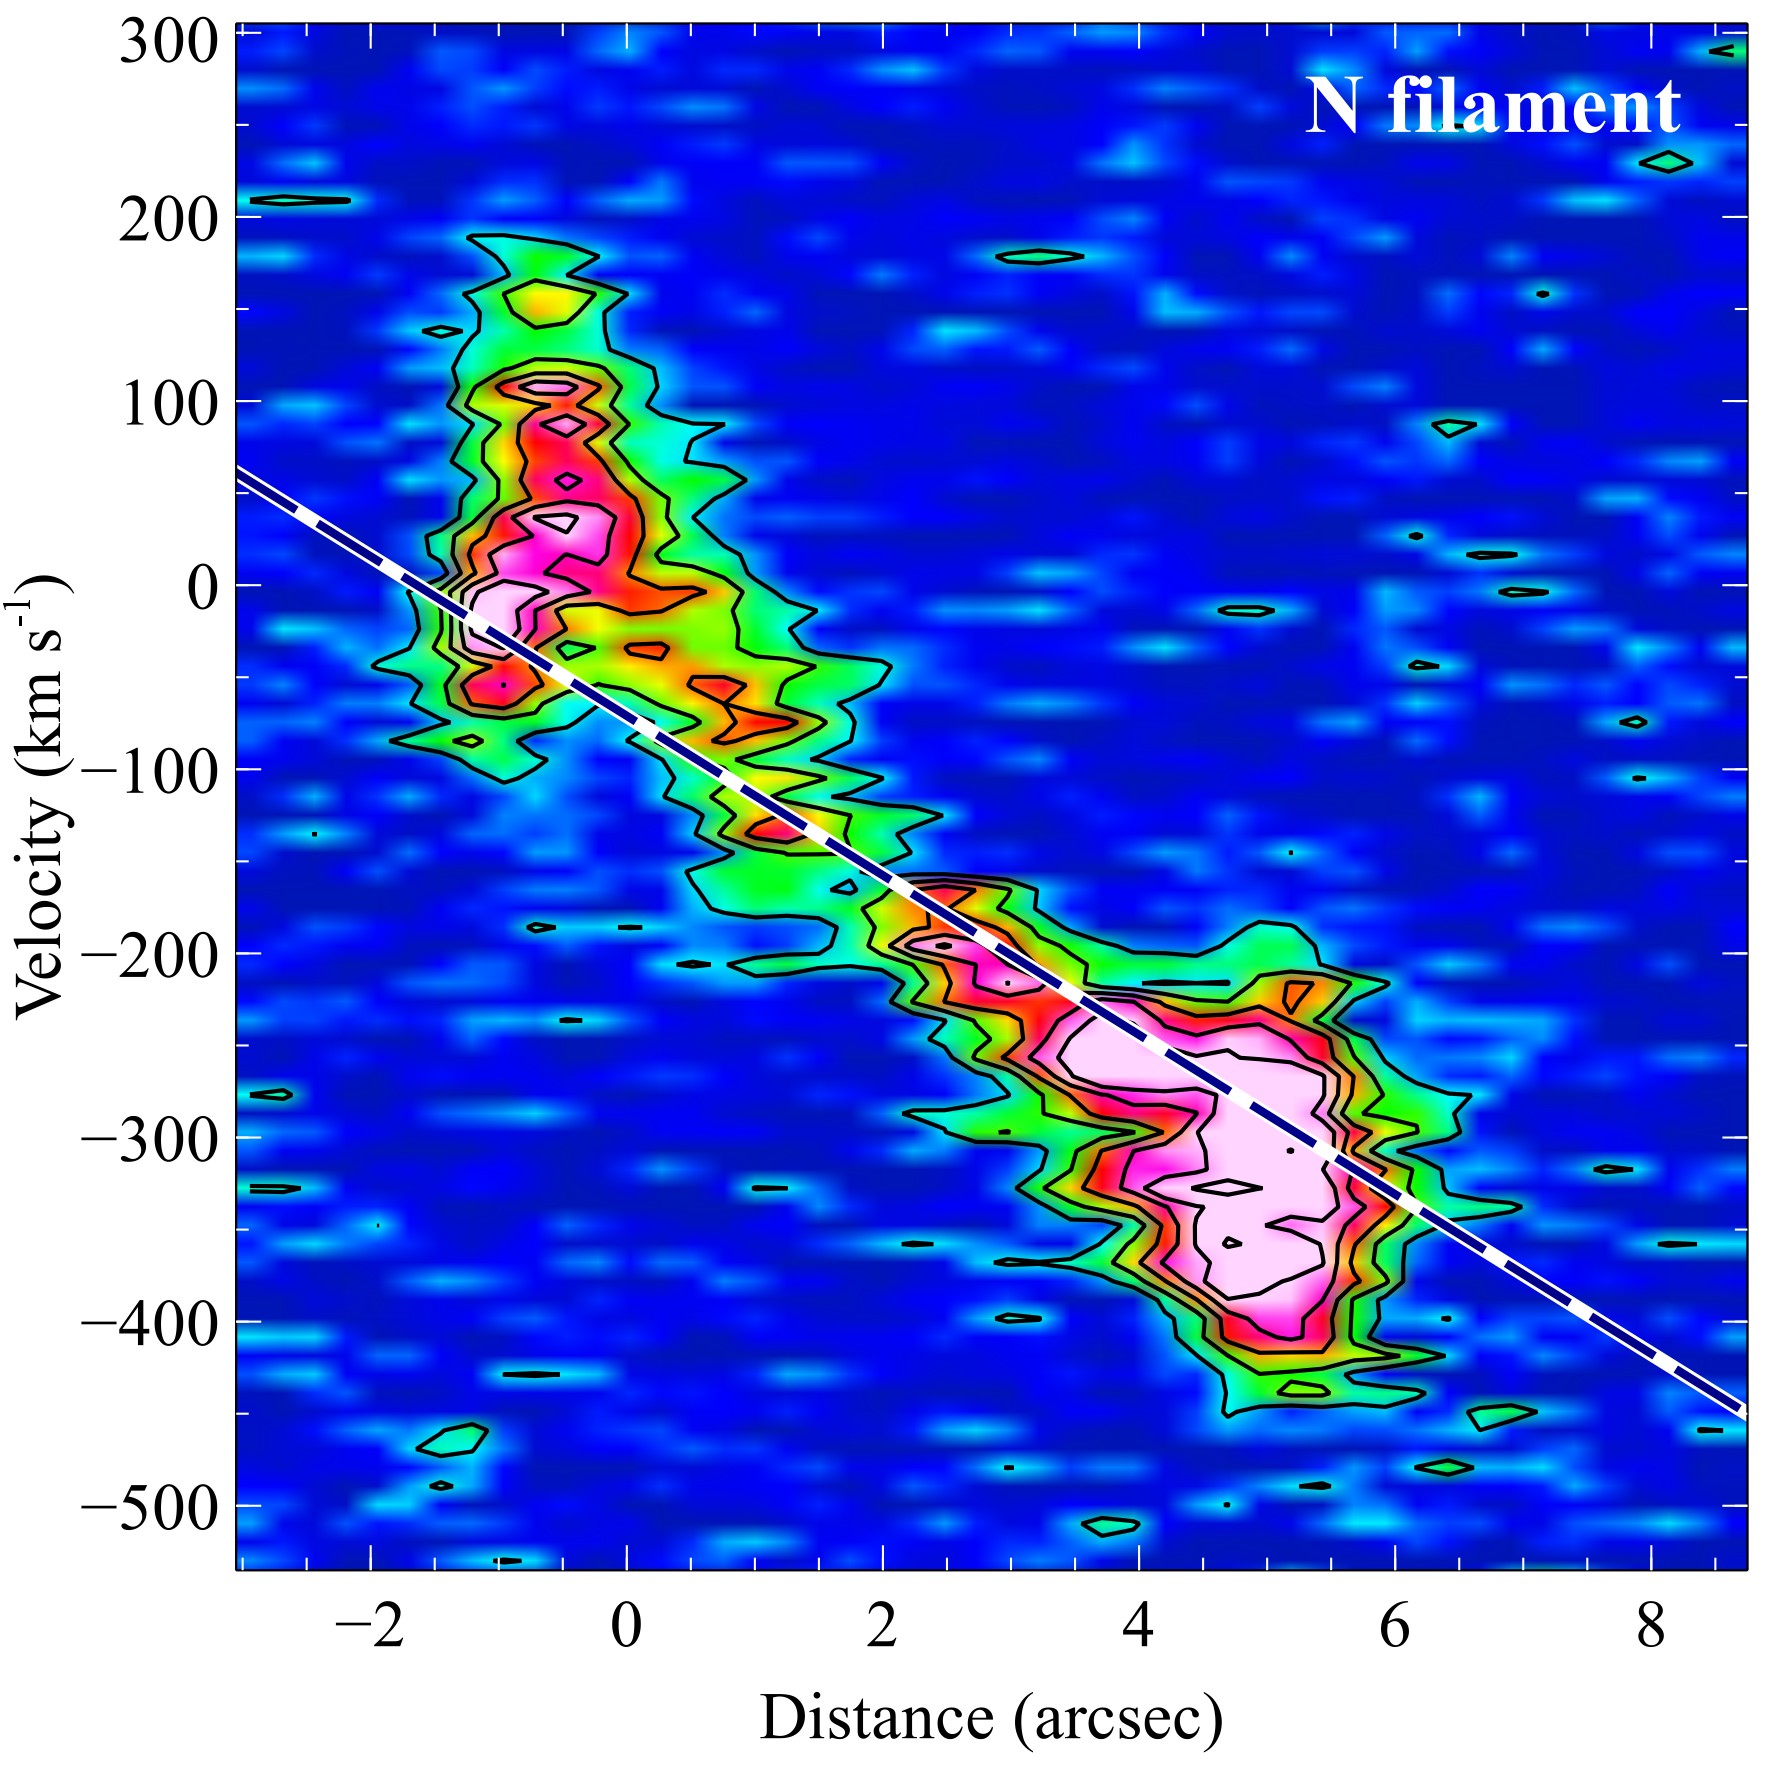
Position-velocity diagrams along the long axis of each filament were produced by averaging the emission in each velocity channel over the width of the aperture shown in Fig. 7 (left). The full extent of the curved N filament could not be captured with a regular linear aperture. Instead, the emission was averaged in sectors extracted around the half annulus shown. The line of sight velocity gradient, measured in projection along the N filament, is roughly linear from the molecular gas at the systemic velocity around the nucleus to its furthest projected extent at (measured around the long-axis of the aperture). The additional velocity components are also clearly detected to the SE and NW of the nucleus at and , respectively.
The S filament is separated from the molecular emission around the nucleus and the velocity structure appears distinct. The velocity gradient is shallow, increasing by over , and the gas velocities increase towards the nucleus in contrast with the N filament.
To examine the velocity structure in more detail, we also fit two-dimensional Gaussian distributions to all individual velocity channel maps to find the peak positions along the N filament. The peak positions were projected onto the circular axis that follows the N filament using the aperture in Fig. 7 (left). We fit the resulting velocity profile with a linear model , where is the velocity () and is the distance along the filament (kpc). A two-dimensional Gaussian provides a reasonable fit to the velocity channels from to which cover the smooth velocity gradient and have only single emission peaks. For the potential jet collision regions at and , the velocity structure in each channel is more complex and the two-dimensional Gaussian provides only a rough guide. These regions were therefore excluded from the model fit. Fig. 7 (right) shows this best-fit model overlaid on the full position-velocity diagram, where the best fit parameters and . The velocity gradient appears steady over a distance of around the N radio lobe. Whilst the measured gradient does not account for the inclination of the gas flow, it is unlikely that strong variations in inclination along the filament could conspire to produce such a smooth velocity gradient over such a large distance.
3.3 Nuclear continuum
The unresolved continuum emission is consistent with a nuclear point source of at located at RA 13:48:52.495 and Dec +26:35:34.32, which is spatially coincident with the VLA nuclear continuum (Liuzzo et al. 2009). Together with the nuclear flux measurement at of (component C, Liuzzo et al. 2009), we determine a flat spectral index for the core of . No central hard X-ray point source is detected from this radiatively inefficient nucleus (eg. Russell et al. 2013). We also do not detect any narrow CO absorption features (eg. David et al. 2014; Tremblay et al. 2016) against the weak nuclear continuum in this system.
3.4 Dust and optical line emission
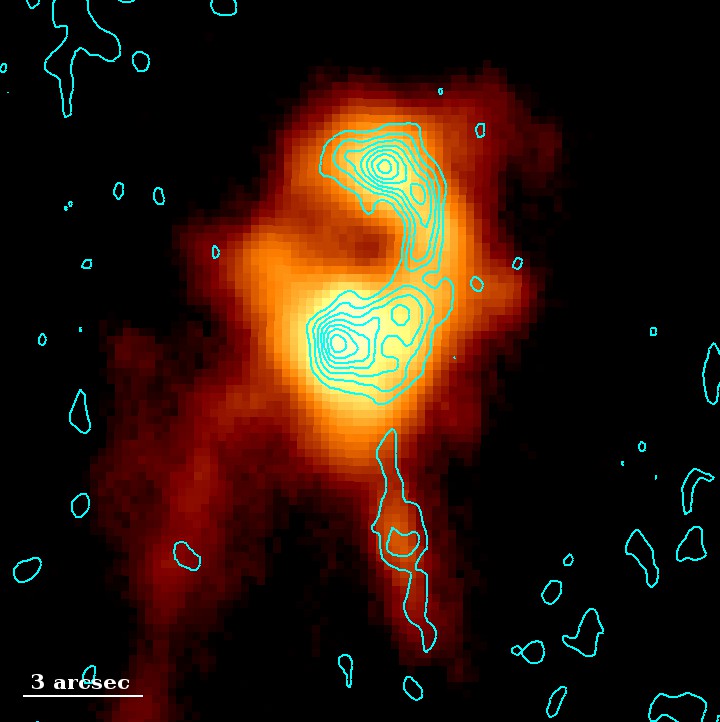
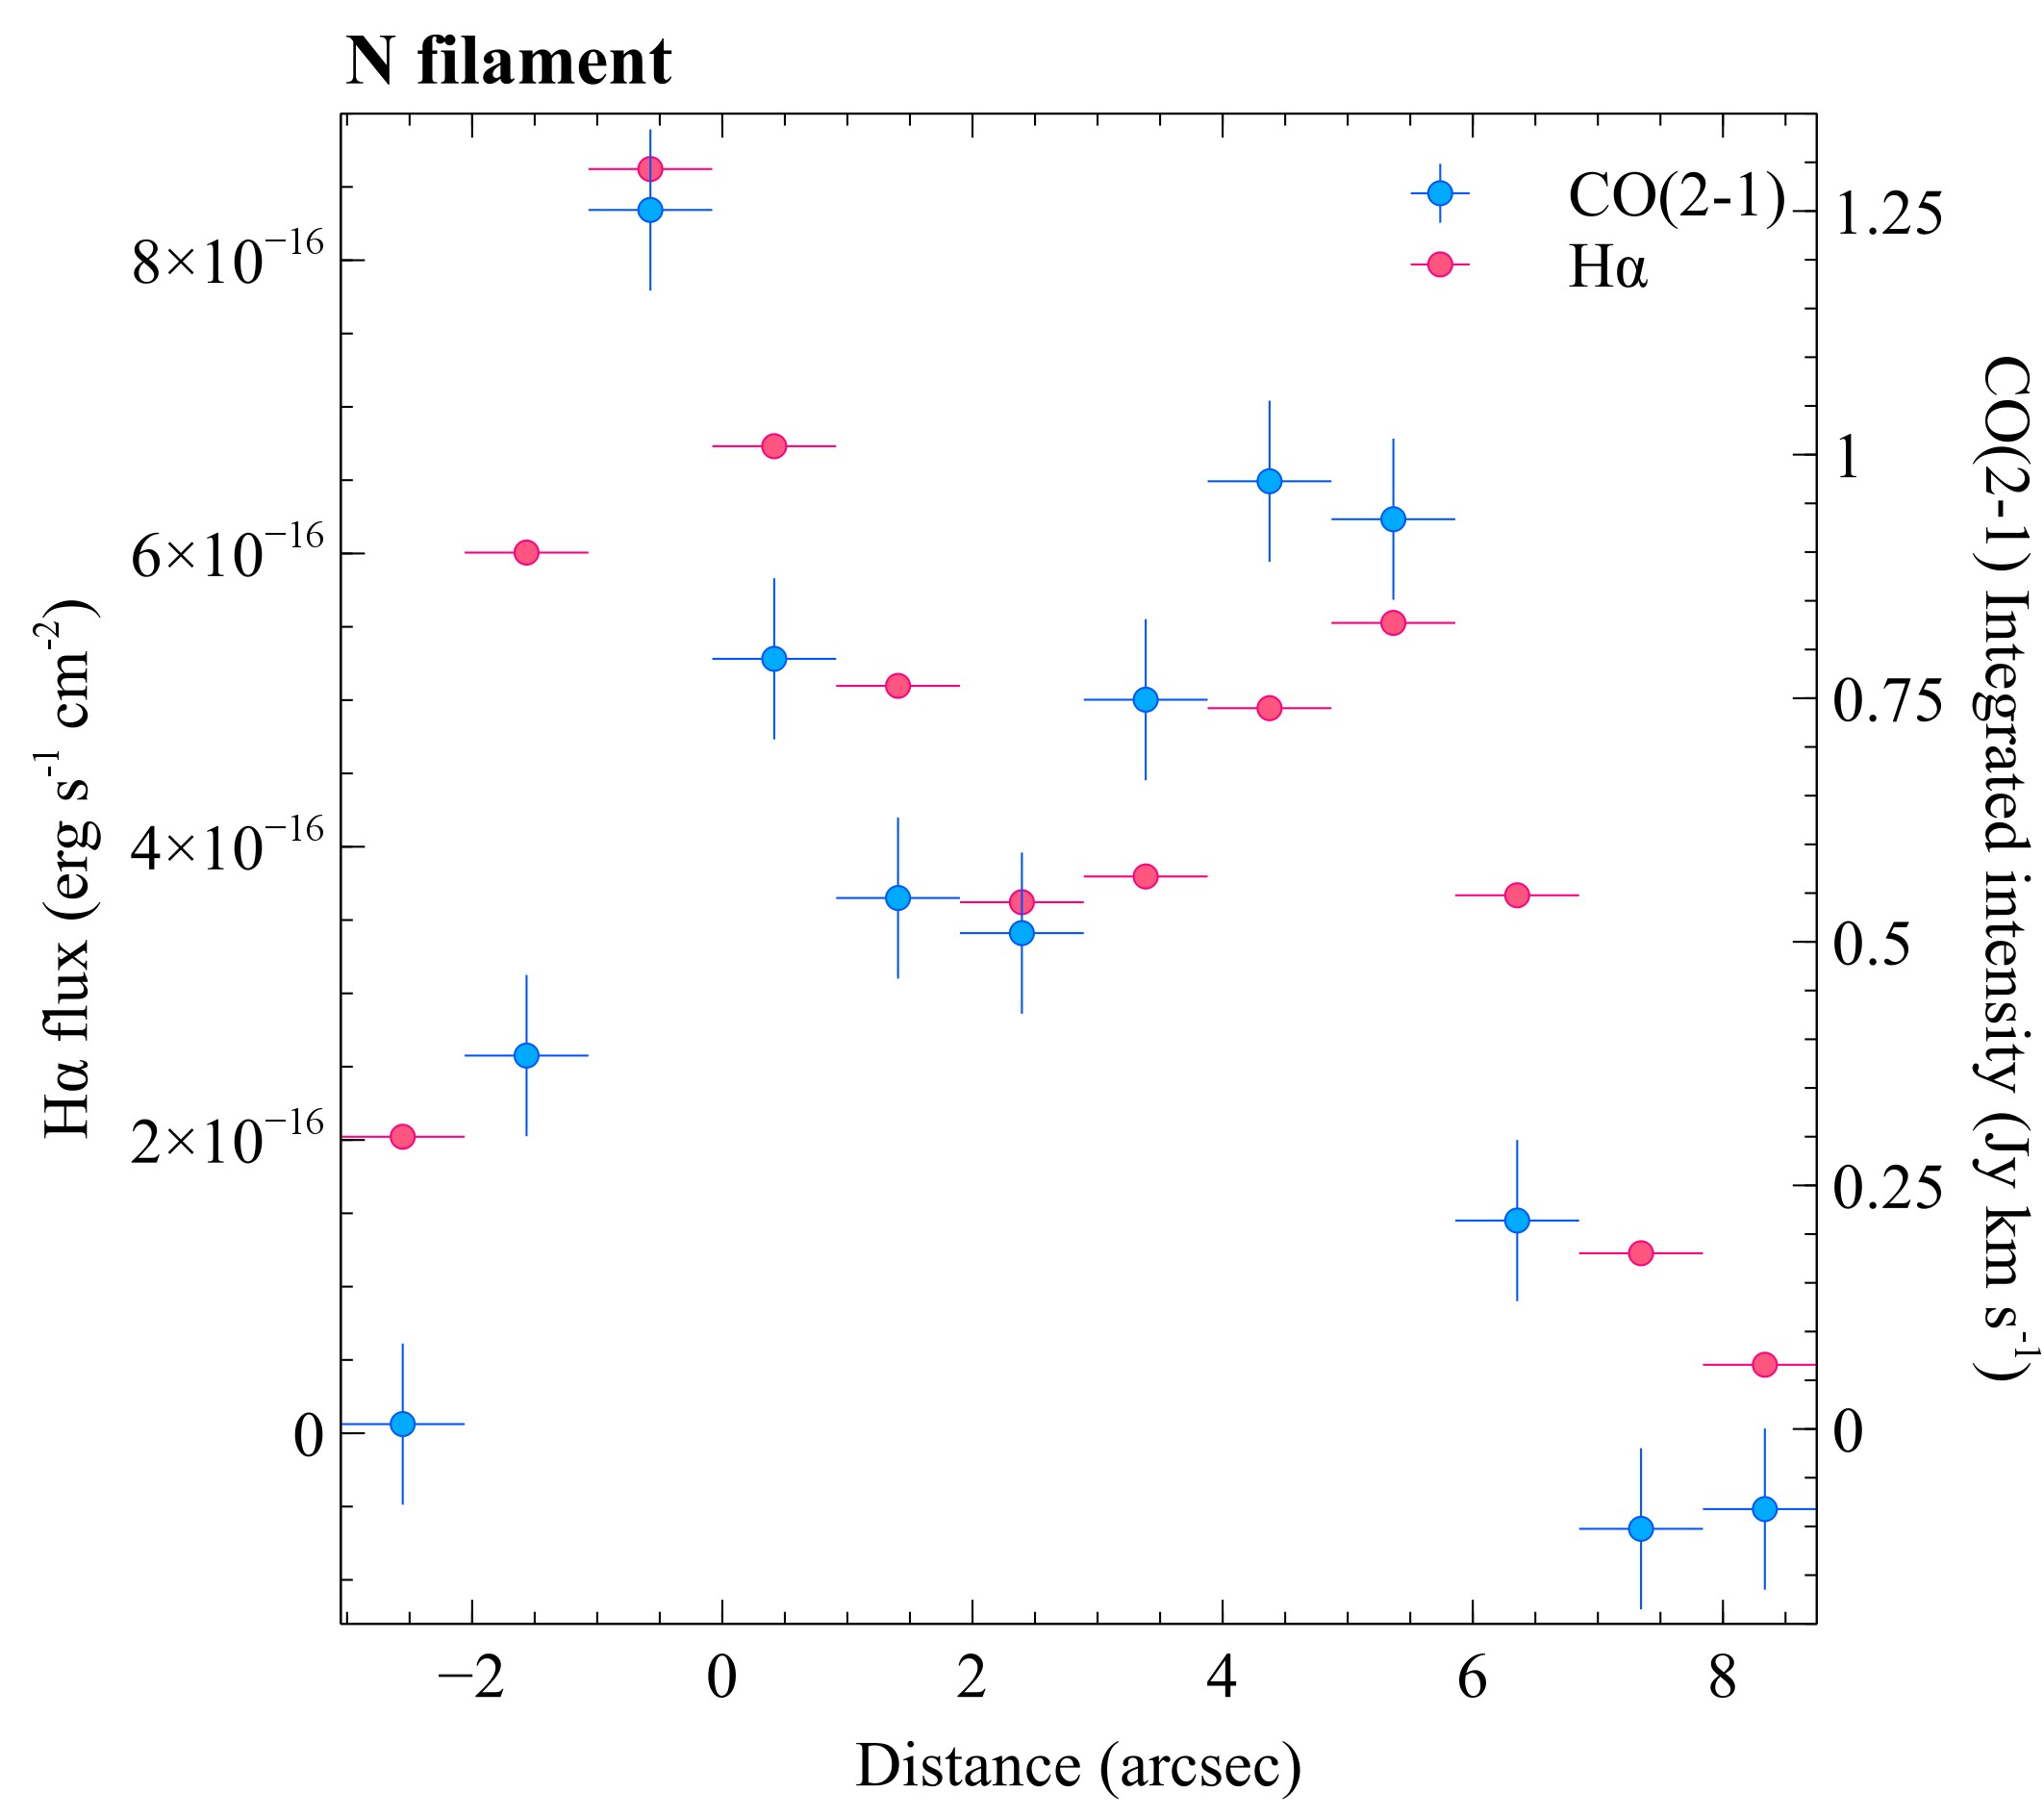
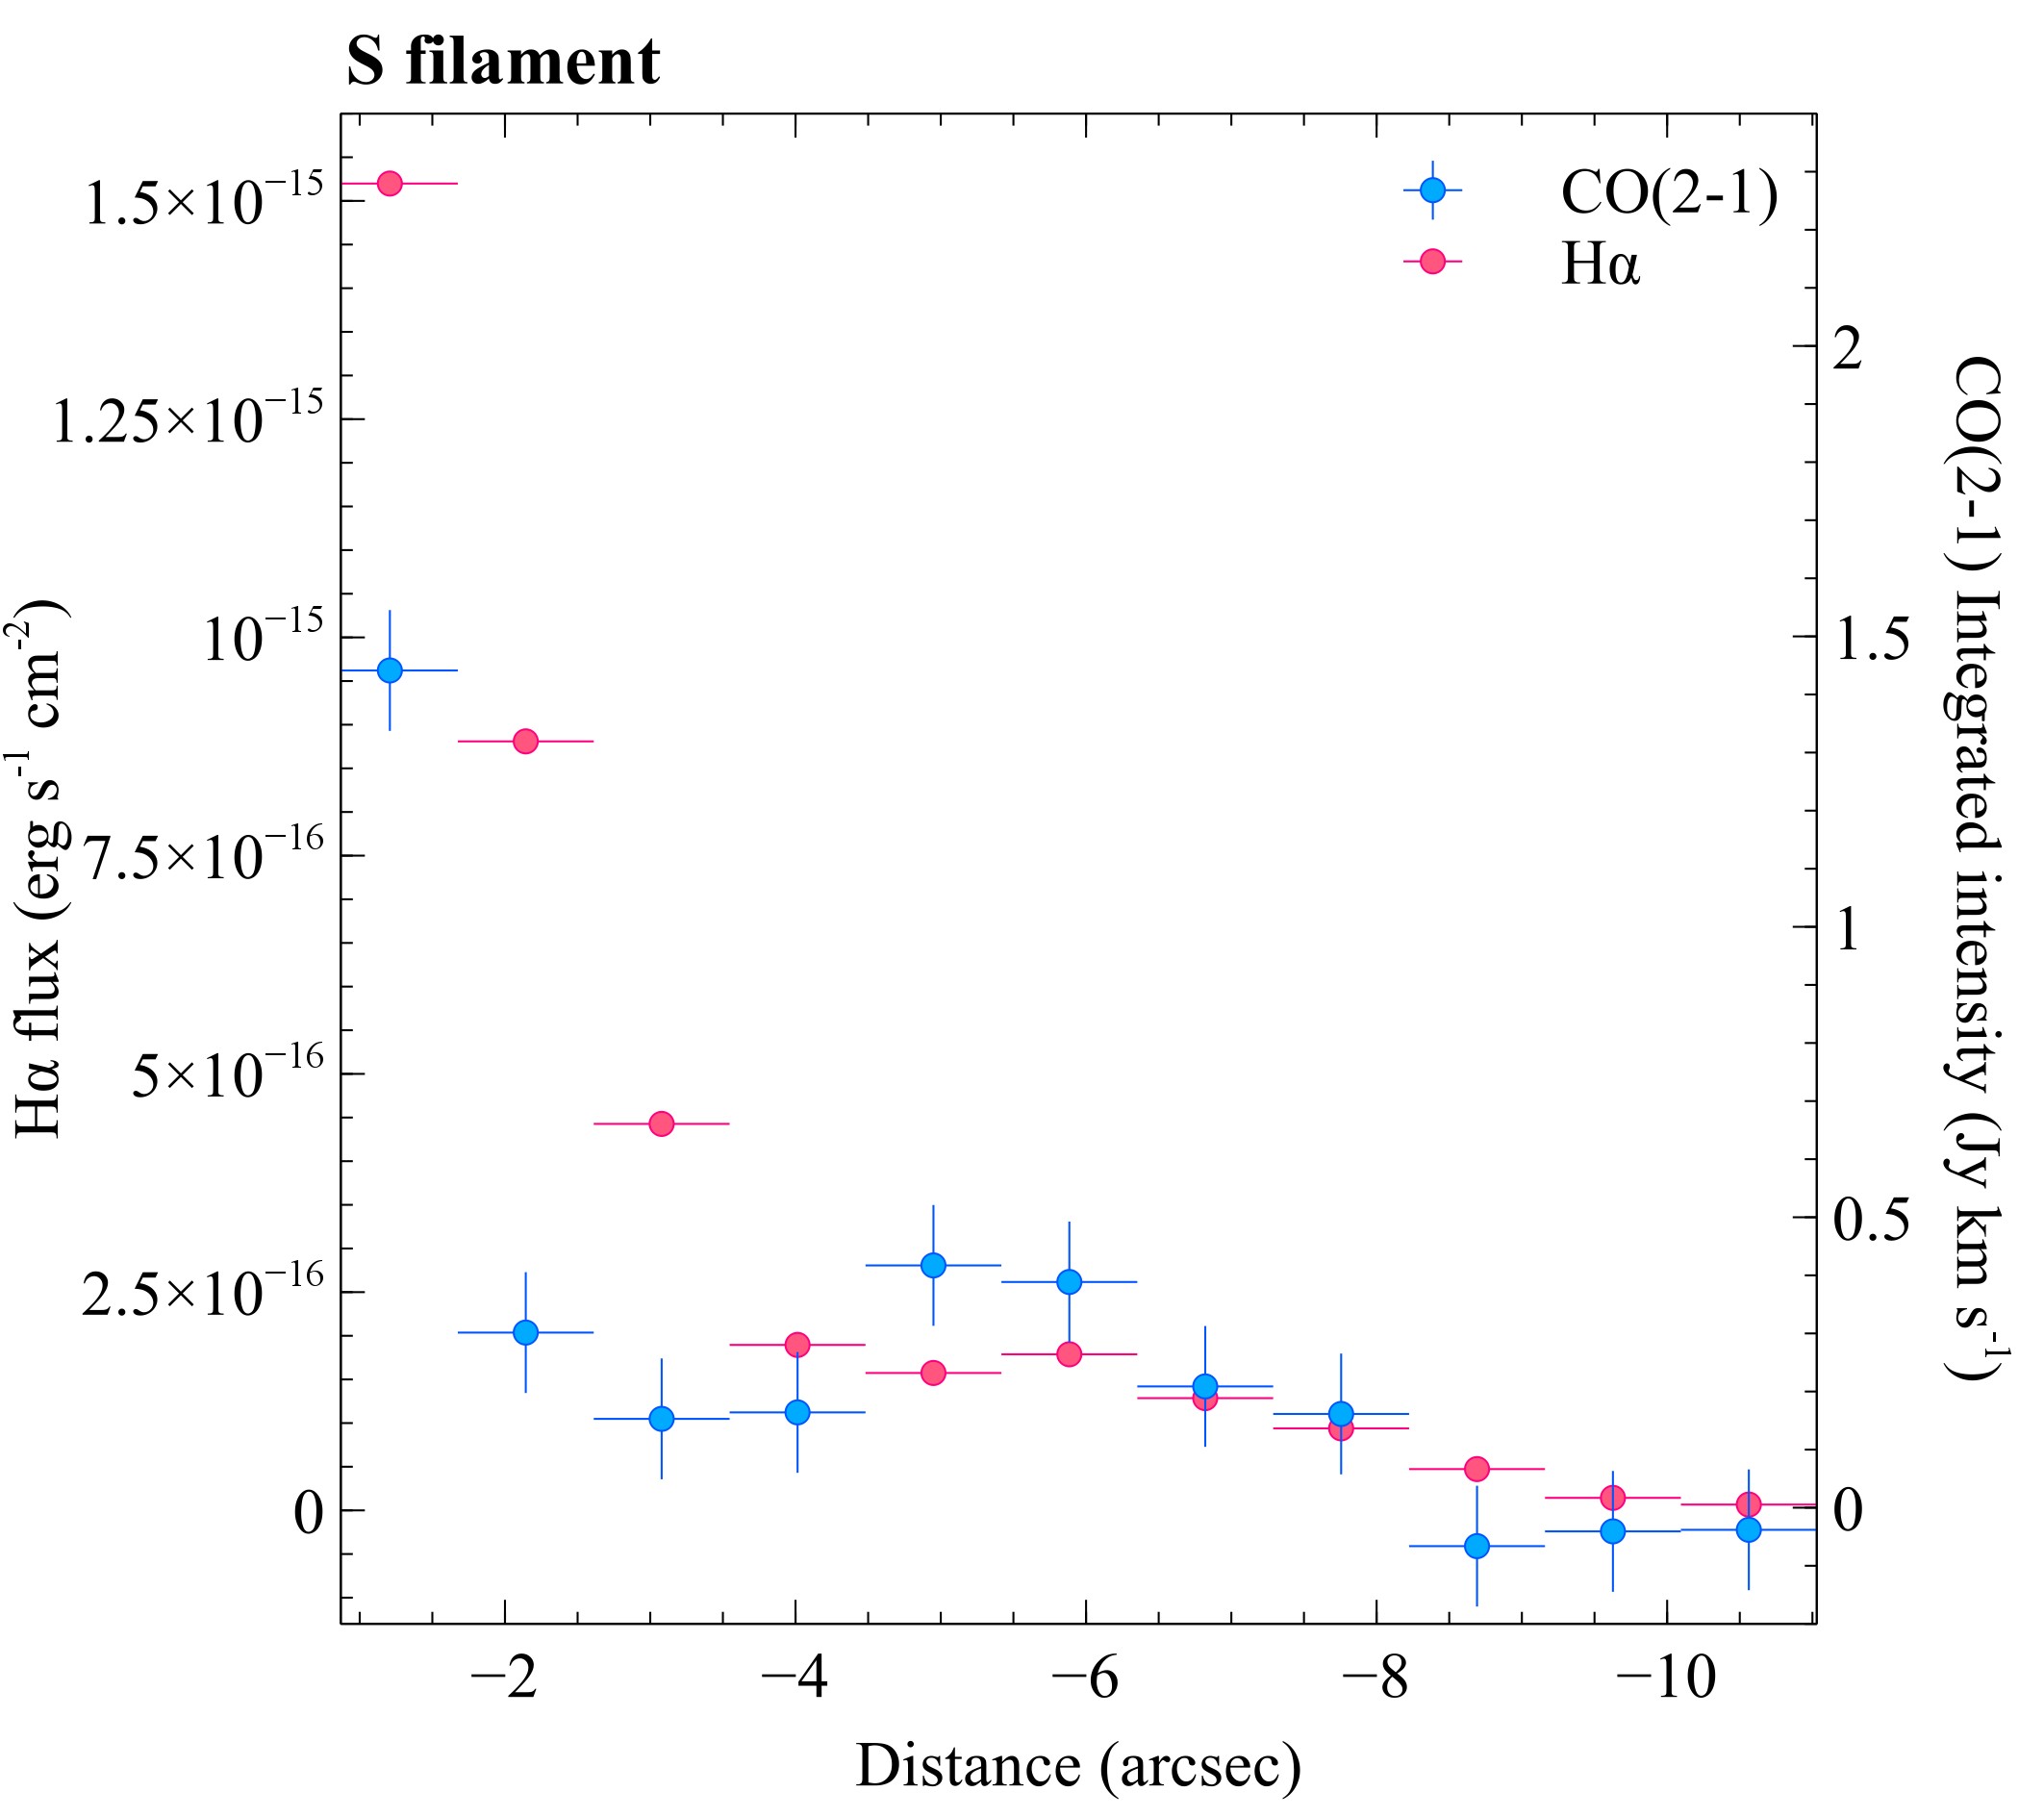
Fig. 8 shows that the N filament is also coincident with a strong dust lane revealed most clearly in the HST broad band imaging (McNamara et al. 1996; Pinkney et al. 1996). Similar to the molecular gas, the dust appears along the radio lobes and may have been entrained. Dust should sputter rapidly in the hot cluster atmosphere and therefore must be shielded from this harsh environment. The molecular gas emission is also strongly correlated with the H line emission observed by the MMTF (McDonald & Veilleux 2009, see also Cowie et al. 1983; Hu et al. 1985; Crawford et al. 2005) as shown in Fig. 9. For a quantitative comparison, the molecular and H fluxes were extracted in identical regions along each filament within the apertures shown in Fig. 7 (left). The seeing for the MMTF H observation was , which is similar to the ALMA synthesized beam (). Although there is roughly a factor of a few scatter between the CO(2-1) integrated intensity and the H flux, the ionized and molecular gas clearly have similar structures with peaks around the nucleus, at the top of the N filament and along the S filament. The close association and lack of a strong radial dependence supports a local excitation mechanism for the nebula (eg. Jaffe et al. 2005; Ferland et al. 2009; Lim et al. 2012). The most significant discrepancy occurs at the inner section of the S filament where a break in the molecular filament is coincident with increased H emission presumably due to bright star-forming knots (see also Fig. 4, left).
Using an average and approximate conversion factor between the H flux and the CO(2-1) integrated intensity, we estimated the CO(2-1) integrated intensity of the -long () extended H filament to the S, which is beyond the ALMA field of view (Crawford et al. 2005; McDonald & Veilleux 2009). The estimate of has an uncertainty of at least a factor of a few based on the observed scatter in Fig. 9. Interestingly, this is similar to the integrated CO(2-1) intensity of the much more compact N filament (Table 1) and raises the possibility that the N filament would be similarly extended if the central galaxy were stationary in the cluster potential.
The ionized gas nebula also has a similar velocity structure to the molecular gas (Crawford et al. 2005; McDonald et al. 2012a). Long-slit spectroscopy of the H emission shows low gas velocities around the radio nucleus and then predominantly blueshifted gas at to to a radius of (Crawford et al. 2005; McDonald et al. 2012a). Whilst the inner section of the N filament is not covered by the long-slit positions, the ionized gas is detected to larger radii and appears to show a continuation of the velocity gradient around the N radio lobe to a radius of . However, the FWHM of the ionized gas is significantly higher at around the radio lobes. Therefore, the ionized gas structures could instead have systematically higher velocities than the molecular gas clouds rather than tracing a continuation of the velocity gradient. Crawford et al. (2005) identified increases in ionized gas velocity and line widths and higher ionization that are coincident with the bend and indent in the S and N radio lobes, respectively. The disruptions to the molecular gas structure in these regions are likely due to collisions with the expanding radio lobes.
3.5 Molecular gas mass
The molecular gas mass can be determined from the integrated CO intensity by assuming a CO-to-H2 () conversion factor and the brightness line ratio of CO(2-1)/CO(1-0) measured for Abell 1795 in single dish observations (Salomé & Combes 2003). The total molecular gas mass is given by:
| (1) |
where is the luminosity distance, is the redshift of the central galaxy and is the integrated CO(1-0) intensity. For the Milky Way disk, with uncertainty (eg. Solomon et al. 1987; Solomon & Vanden Bout 2005). Although comparable values are obtained for other similar galaxies, there is significant scatter and observed variations with environmental factors, such as metallicity (for a review see Bolatto et al. 2013). In starburst galaxies and ULIRGs, the molecular gas can form an extended warm gas phase with a much higher column density, which results in more luminous CO emission and requires a lower factor by up to a factor of 10 (Downes et al. 1993; Downes & Solomon 1998; Iono et al. 2007; Aravena et al. 2016).
The metallicity of the intracluster medium in Abell 1795 is close to solar at within the central few kpc. The total IR luminosity of the central galaxy is (Donahue et al. 2011), which is an order of magnitude below that of a luminous infrared galaxy (LIRG), and star formation models imply either continuous star formation or a recent burst at a rate of (Smith et al. 1997; Mittaz et al. 2001). CO absorption line detections of molecular clouds against the nuclear continuum in other central cluster galaxies have also found that their velocity dispersions are typical of individual clouds in the Milky Way (David et al. 2014; Tremblay et al. 2016). The velocity dispersion is low throughout the bulk of the molecular gas and the outflowing gas has an ordered velocity structure, which does not appear strongly turbulent. The gas velocity peaks at a few hundred and the FWHM is across much of the filamentary structure. The observed brightness line ratio CO(2-1)/CO(1-0) for Abell 1795 suggests that the bulk of the molecular gas is optically thick. This measurement will be dominated by the molecular peaks at either end of the N filament so it appears unlikely that the factor varies strongly with position, particularly given the lack of strong variations in the gas dynamics. Therefore, although the impact of a high pressure cluster environment on is not yet known, none of these factors strongly indicate an factor that dramatically differs from the Milky Way value in the central galaxy of Abell 1795. We therefore assume a Milky Way factor of and estimate a factor of a few uncertainty.
From the total integrated CO(2-1) intensity of , the molecular gas mass is . More than lies in the N filament, beyond a radius of , and the S filament has a mass of .
4 Discussion
The molecular gas in the central galaxy lies in two filaments, each in length, that are projected around the outer edges of the radio lobes. The molecular gas is likely distributed in thick shells around the radio lobe. This morphology will appear brightest to the observer around the outer edges of the lobes where the line of sight through the gas is maximum. The gas velocity through the N filament smoothly increases from the central galaxy’s systemic velocity around the radio core to , the average for the surrounding galaxies, at a radius of (). The gas does not appear settled in the gravitational potential with no evidence for rotation about the galaxy centre and the gas velocity dispersion is well-below the stellar velocity dispersion. The S filament has a shallower velocity gradient with increasing velocities towards the nucleus but similarly low velocity dispersion. Additional velocity components to the SE and NW of the nucleus are located at bends in the radio lobes and suggest that clouds are being pushed in different directions along the line of sight. The close spatial association with the radio lobes, ordered velocity gradients and narrow velocity dispersions show that the filaments are gas flows entrained by the expanding radio bubbles. The velocity structure of the molecular gas appears very different from outflows driven by direct collisions with a relativistic jet, where gas clumps are accelerated to high velocities in an expanding cocoon (eg. Wagner & Bicknell 2011; Morganti et al. 2015). Instead, the modest velocities and dispersions suggest that interactions between the radio lobes and molecular gas in Abell 1795 are gentle. This is also consistent with X-ray observations that find bright, cool gas rims around radio bubbles, including those in Abell 1795, which are roughly in pressure equilibrium with the surrounding medium rather than injecting strong shocks (eg. McNamara et al. 2000; Fabian et al. 2000; Crawford et al. 2005).
Whilst the central galaxy is likely moving through the ICM in Abell 1795, the molecular morphology and kinematics are remarkably similar to that observed in many other central cluster galaxies, where molecular filaments also encase or extend towards radio bubbles (Salomé et al. 2011; McNamara et al. 2014; Russell et al. 2016; Vantyghem et al. 2016; Russell et al. 2017). This morphological association appears particularly close in Abell 1795 where the molecular gas is tightly wrapped around the outer edges of the N and S radio lobes and the N gas peak lies at a clear indent in the N radio lobe. In the Phoenix cluster, the molecular filaments are drawn up around the lower halves of two radio bubble but, as this object lies at , it is not possible to distinguish more detailed structural associations. In the Perseus cluster, Abell 1835, PKS 0745-191 and 2A 0335+096, molecular filaments clearly extend towards or align with X-ray cavities or radio lobes, which suggest this mechanism is common at the centres of cool core clusters. However, Abell 1795 presents the best evidence so far for a causal link between the extended molecular filaments and radio bubbles.
4.1 Direct uplift of molecular gas clouds
If the dense molecular clouds have been directly pushed out by the diffuse radio lobes, this must be a remarkably efficient process that can somehow lift more than 50% of the molecular gas from the galaxy centre. The total energy generated by the expansion of the N radio lobe also appears insufficient to drive such a substantial mass of gas in an outflow. Assuming a prolate spheroid, the semi-major and minor axes of the X-ray cavity carved out by the N radio lobe are and , respectively. The thermal pressure of the surrounding hot gas atmosphere is to a radius of (). Therefore, the energy required to displace the hot gas in this volume is . Based on the gravitational potential for the central galaxy in Abell 1795 determined by Hogan et al. (2017), the potential energy acquired by of molecular gas lifted from a radius of to is . The kinetic energy of the gas, assuming a velocity of and FWHM of , is . Therefore, the total energy in the outflow is , which is more than twice the mechanical energy of the bubble. Whilst the bubble would have expended energy in lifting the molecular gas, and the mechanical energy is therefore underestimated from the X-ray cavity properties, this would still require a remarkably effective coupling mechanism utilising more than half of the mechanical energy to lift the molecular gas.
Both the gas flow mass and mechanical energy have significant uncertainties. The uncertainty in the mechanical energy is primarily due to uncertainties in the X-ray cavity dimensions, particularly the line of sight extent. However, the close spatial correlation between the radio emission and the X-ray surface brightness depressions suggests that an underestimation of the mechanical energy by more than a factor of a few is unlikely. Alternatively, as discussed in section 3.5, it is possible that the factor, and therefore the molecular gas mass and the outflow energy, has been overestimated. However, even if the factor was lower by a factor of , this would still need to be a very efficient process with . We also note that the ALMA observations detect of the total emission measured by single dish observations and therefore more extended molecular gas structure has been resolved out. The extended CO emission, and therefore the molecular gas mass, has therefore been underestimated and this will partially offset potential reductions due to the factor.
If the molecular gas has instead been lifted by a series of radio bubbles inflated by the jet, this could provide a much more substantial energy supply. Bîrzan et al. (2004) found a large, outer X-ray cavity located at a radius of () to the S that could have dragged out the -long soft X-ray and H filament. The corresponding radio emission of this older bubble would have spectrally aged and dimmed at a frequency of , whilst the X-ray cavity produced by the displacement of the hot X-ray atmosphere is still visible. This is known as a ghost cavity (eg. Churazov et al. 2000). There could be a corresponding large cavity to the N but its structure may have been disguised or disrupted by the merger structure detected in the X-ray observation (Markevitch et al. 2001; Ehlert et al. 2015). The mechanical energy of the outer, large S cavity is (Bîrzan et al. 2004). A similarly sized cavity to the N would easily have enough energy to drive the observed molecular gas flow. Crawford et al. (2005) identified a large semi-circular X-ray surface brightness depression () to the NW of the nucleus that could be the inner edge of an outer cavity.
Whilst entrainment by multiple radio bubbles could explain the apparent mismatch between the cavity and outflow energy, the bubbles would still need to lift an unfeasibly large fraction, at least half, of the molecular gas into extended filaments. ALMA observations of the central galaxies in PKS 0745-191, 2A 0335+096 and Phoenix have also revealed similarly large fractions of the molecular gas lying in extended filaments linked to radio bubble activity (Russell et al. 2016; Vantyghem et al. 2016; Russell et al. 2017). It is difficult to understand how radio bubbles could be so effectively coupled to dense molecular gas clouds. If the factor is lower by a factor of ten for the extended filaments compared to the central molecular gas peak then the uplifted gas fraction would be . However, as previously discussed, it appears unlikely that the factor differs so dramatically in the filaments (section 3.5). We therefore consider an alternative scenario of stimulated cooling.
4.2 Uplift of thermally unstable low entropy gas
Plumes of metal-rich, hot X-ray gas aligned with the jet axis are observed in many galaxy clusters. They show that the radio bubbles can lift hot, diffuse gas from the galaxy centre that has been enriched with metals by stellar activity (Simionescu et al. 2008; Kirkpatrick et al. 2009). Low entropy X-ray gas should become thermally unstable when it is lifted to a radius where its radiative cooling time approaches the infall time (Nulsen 1986; Pizzolato & Soker 2005; Gaspari et al. 2013; McNamara et al. 2014; McNamara et al. 2016). Simple compression of low entropy X-ray gas by an expanding radio bubble is unlikely to produce the substantial level of local gas cooling required. The energy equation of the gas may be expressed as
| (2) |
where is the entropy index, is the gas temperature, is the electron number density, is the radiative cooling time, is the gas pressure, is the proton number density and is the cooling function. Therefore the cooling rate is determined by the gas cooling time. The cooling time is only weakly affected by adiabatic compression of the gas (eg. McNamara & Nulsen 2012); weak shocks produce a similar response whilst stronger shocks will increase the cooling time. Transient compression of the gas by the subsonic passage of a radio bubble can therefore only affect the cooling rate significantly if its duration, , exceeds the radiative cooling time in the compressed gas. The duration of such an event will typically be comparable to the sound crossing time to the radius of interest, which is comparable to the free-fall time . Observed values of exceed 10 in the vast majority of cool core clusters, including Abell 1795 (Hogan et al. 2017). Therefore, for these weak perturbations we expect , which will not generate the required level of rapid cooling. Whilst a pre-existing mass of cold gas could seed further cooling, this mechanism can only induce cooling at a level similar to the initial mass (eg. Werner et al. 2010) and therefore this cannot wholly supply the substantial molecular gas mass observed in Abell 1795.
Simulations and theoretical models show that stronger perturbations that lift low entropy X-ray gas in the updraft of radio bubbles can stimulate rapid gas cooling to form molecular clouds (Revaz et al. 2008; Li & Bryan 2014; Brighenti et al. 2015; Voit et al. 2016). The peculiar motion of the central galaxy in Abell 1795 and sloshing of the cluster gas would also help to promote this thermal instability by increasing the infall time. McNamara et al. (2016) refer to this mechanism as stimulated feedback. If the molecular gas has rapidly cooled from a hot gas outflow, then it could retain the outflow velocity structure, particularly if it is pinned to the hot flow by magnetic fields (eg. Fabian et al. 2008). Alternatively, the molecular clouds may decouple from the hot gas flow and subsequently fall slowly back towards the galaxy centre.
McNamara et al. (2016) suggest that stimulated feedback could explain ALMA observations of molecular gas filaments observed preferentially in the wakes of radio bubbles with velocities well below their free-fall speeds (McNamara et al. 2014; Russell et al. 2016, 2017). In Abell 1795, the bright filaments around the radio lobes are detected in low entropy X-ray gas (Crawford et al. 2005), Ovi emission from intermediate temperature () gas (McDonald et al. 2014b), warm ionized gas (Cowie et al. 1983) and cold molecular gas (this paper, see also Salomé & Combes 2004). McDonald et al. (2014b) measure the metallicity of the young () stars in the -long filament and find good agreement with the metallicity of the low entropy X-ray gas at this location (Ehlert et al. 2015), which is consistent with a stimulated feedback scenario.
The filaments are also coincident with strong dust lanes (Fig. 8). Dust grains are required to facilitate the formation of molecular hydrogen on these timescales (eg. Ferland et al. 1994; Ferland et al. 2009) but should be sputtered rapidly in the galaxy’s hot atmosphere and therefore cooling X-ray gas is likely dust-free. Although it is possible that the dust may form in situ within cooling gas clouds (Fabian et al. 1994), dust could also have been uplifted from the galaxy centre and shielded within dense cold gas clumps or distributed locally by the central galaxy’s older stellar population (Voit & Donahue 2011). It would be useful to examine the dust-to-gas fraction through the filament, however, bright optical line emission coincident with the dust lane prevents a robust estimate of the dust mass (McNamara et al. 1996; Pinkney et al. 1996). This also prevents any conclusive constraint on the line of sight location of the filaments with respect to the galaxy centre.
4.3 Rapid cooling of the intracluster medium
Observations of the centre of Abell 1795 with XMM-Newton RGS and Chandra place strong limits on the X-ray gas cooling rate of (Peterson et al. 2003; Voigt & Fabian 2004). Over the sound speed rise time of the inner radio bubbles (), a maximum of of hot gas could cool down to low temperatures. This is at least an order of magnitude below the molecular gas mass. Non-radiative cooling through mixing of the hot and cold gas (Fabian et al. 2002; Soker et al. 2004; Fabian et al. 2011) appears unlikely on these timescales due to observations in other wavebands. The mean power dissipated by of gas cooling to low temperatures from in is . Although this is within a factor of two of the total IR luminosity of the central galaxy, Donahue et al. (2011) show that the Spitzer IRS spectrum is well-represented by starburst models with a comparable star formation rate to UV and H observations. As previously discussed in section 4.1, the inner pair of radio lobes would also not provide sufficient energy input to lift the required mass of X-ray gas.
A pair of putative outer radio bubbles could provide a much longer timescale for gas cooling and a much more substantial energy supply to lift the low entropy X-ray gas and stimulate cooling. The outer S radio bubble identified by Bîrzan et al. (2004) has a mechanical energy of and a buoyant rise time of . A corresponding partner bubble to the N, which may be obscured by the cold front structure, would have enough energy to lift the required mass of low entropy X-ray gas. The outer S bubble displaces of the hot atmosphere and therefore, according to Archimedes’ principle, this bubble could lift the required of low entropy X-ray gas to supply the observed mass of molecular gas. From the metal-rich hot gas flow, Kirkpatrick & McNamara (2015) estimated a total uplifted hot gas mass of , which suggests that the outer bubbles have lifted a sufficient mass of hot gas.
However, even over the longer buoyant rise time of the outer bubble, a maximum of hot gas could cool down to low temperatures. This is roughly a factor of two below the molecular gas mass of the N filament. The X-ray gas is also very diffuse with a density at a few kpc radius of . The observed mass of molecular gas is equivalent to the total mass of X-ray gas within a radius of . Therefore, if such a substantial fraction of the central hot X-ray atmosphere is lifted by the radio bubbles, there should be a corresponding inflow to maintain hydrostatic equilibrium that would oppose such an outflow. These issues could potentially be explained by a modest reduction in the factor, uplift of some cold gas clouds within the low entropy X-ray gas flow, a modest increase in the X-ray cooling rate, which is obscured by cold clouds absorbing the soft X-ray emission, or an increased in situ cooling rate due to non-radiative cooling as hot ionizing plasma penetrates the cold gas filaments (Fabian et al. 2002; Soker et al. 2004; Fabian et al. 2011). Scaling from the H luminosity and the mass accretion rate in the cold gas filaments of NGC 1275 (Fabian et al. 2011), we estimate that the N filament in Abell 1795 could be growing at a rate of . Therefore, over the buoyant rise time of an outer bubble, the mass of this filament could increase by roughly 50% due to interpenetration of the cold gas by the hot gas.
Therefore, we conclude that for stimulated feedback the molecular gas must have formed from gas cooling over the timescale of multiple radio bubble outbursts. The observed close association of the molecular gas morphology and velocity structure with the inner radio lobes requires that the cold gas structure either moulds the newly expanding bubbles or is itself pushed aside and shaped as they inflate. As discussed in section 4, this mechanism must be gentle compared to direct collisions between dense gas clumps and relativistic jets, which produce much higher velocities. Magnetic support for the filaments is implied by HST observations of ionized gas filaments, which are coincident with molecular gas, at the centre of the Perseus cluster and ALMA observations of low gas velocities in objects such as PKS 0745 (section 3.2.1). Hitomi observations of the Perseus cluster core found that the bulk shear in the hot atmosphere is consistent with the ionized and molecular gas velocities in the extended filaments, which suggests that the cold and hot gas move together (Hitomi Collaboration 2016). The molecular gas therefore likely remains pinned to the hot gas by magnetic fields unless disrupted, which may explain the contrasting velocity structure in the S filament.
The average surface density of the N filament is at least . This is a lower limit as the filament is unresolved and likely consists of narrow strands (eg. Fabian et al. 2008; David et al. 2014; Tremblay et al. 2016) but we note that this surface density is already comparable to typical values for giant molecular clouds (eg. Solomon et al. 1987). From the NFW gravitational potential determined for Abell 1795 by Hogan et al. (2017), the minimum stress that is required to support the molecular gas is at a radius of . This is at least an order of magnitude greater than the thermal pressure of the ICM at this radius of . Although the central galaxy’s motion and sloshing of the ICM may result in a significant overestimation of the gravitational acceleration, which relies on the assumption of hydrostatic equilibrium, this implies that the magnetic field dominates the structure of the hot gas in the galaxy centre. Chandra observations of the hot gas in Abell 1795 reveal complex structures and surface brightness depressions in the galaxy centre that may be due to squeezing of the hot gas by magnetic pressure. However, we cannot reliably distinguish these features from cavities due to radio-jet activity and substructures related to merger activity.
4.4 Fate of the molecular gas flows
Rapid cooling of the hot gas flow may produce molecular gas clouds that decouple from the flow and fall back towards the galaxy centre or that retain the outflow velocity structure and are presumably supported by magnetic fields. We consider these two possibilities for the interpretation of the smooth velocity gradients along each filament, in sections 4.4.1 and 4.4.2 respectively, but note that the ambiguity in the location of the filaments along the line of sight prevents an unequivocal conclusion. Although the strong dust lane suggests that the N filament may be located on the nearside of the galaxy (with respect to the observer), ionized gas emission coincident with the dust lane obscures the depth of this feature and prevents a conclusive measurement (section 3.4). Regardless, the close spatial association between the molecular gas and the radio lobe morphology suggests that the gas flows, whether inflowing or outflowing, are entrained by the bubbles and co-located along the line of sight rather than physically located at larger radii and merely projected across the galaxy centre.
4.4.1 N filament: molecular inflow
If the molecular gas has decoupled from the hot gas flow and is now falling back towards the galaxy centre, this could explain the consistency between the molecular gas velocity and the ICM bulk motion at large radii. The gas velocity in the N filament smoothly shifts from the average for the surrounding galaxies at large radius to the central galaxy’s systemic velocity around the nucleus. The central galaxy is moving through the cluster at relative to the surrounding cluster member galaxies (Oegerle & Hill 1994), which likely trace the bulk motion of the cluster gas on scales of a hundred kpc. If we define as rest with respect to the ICM, and assume that the N filament is located on the nearside of the galaxy, then the molecular gas in the N filament is predominantly redshifted and infalling toward the galaxy centre. The gas is accelerating from at large radius to close to the nucleus.
However, in an inflow scenario, the molecular gas can have only recently reached the galaxy centre. There are no clear velocity signatures of inflowing gas overshooting and subsequently settling into the galaxy potential (eg. Hamer et al. 2014). Although an additional velocity component is detected to the SE of the nucleus, this velocity structure is mirrored at the NW end of the filament and therefore appears more likely related to the sharp bends in the radio lobes at these locations (section 3.2.1). The remarkably smooth velocity gradient and narrow velocity dispersion around the N radio lobe suggest that there are no strong variations in inclination that could obscure a disk-like structure (section 3.2.2). The molecular gas in the N filament must then have very recently arrived at the galaxy centre at the central galaxy’s systemic velocity, which appears unlikely. Whilst this scenario cannot be ruled out, ALMA observations of the central cluster galaxy in PKS 0745-191 found similarly extended, radial molecular filaments with no evidence for a central molecular gas peak or disk, which suggests that this is not a special circumstance in Abell 1795 (Russell et al. 2016).
4.4.2 N filament: molecular outflow
The molecular gas in the N filament may instead have retained the velocity structure of the hot gas outflow. The velocity gradient would then correspond to smooth acceleration of the gas from the central galaxy’s systemic velocity, at the nucleus, to at large radius. If the N filament is located on the nearside of the galaxy, the molecular gas is blueshifted and outflowing. Additional velocity components to the SE and NW of the nucleus are likely due to bends in the radio lobes at these locations and the modest increases in FWHM are consistent with this scenario of gentle acceleration by the radio bubbles. However, in an outflow scenario, it is then not clear why the gas velocity at the outermost extent of the molecular flow should match the velocity of the cluster gas at . This may be due to coupling of the molecular gas to the hot gas by magnetic fields (section 4.3). Alternatively, the apparent continuation of the velocity gradient in the ionized gas to at larger radii suggests the matching velocities could be a coincidence. The velocity of the cooling gas, and therefore the molecular gas, should be dominated by the local motions of the radio bubbles rather than the bulk motion of the ICM on larger scales. Bîrzan et al. (2004) estimate the buoyancy velocity of the outer S bubble to be comparable to the ionized gas velocity at . However, the bubble will likely move faster than the gas in its wake and the ionized gas has a significantly higher velocity dispersion than the molecular gas, which may indicate that it is not tracing the same structure (section 3.4).
4.4.3 S filament
The S filament has a much shallower velocity gradient, which may indicate a different orientation compared to the N filament. This could be due to ram pressure bending the radio lobes as the galaxy moves through the ICM. The inner section of the S filament appears to have been disrupted by star formation. A stream of young stars stretches N towards the nucleus from the inner edge of the S filament, which suggests that the cold gas and stars are associated but dynamically decoupled. If the molecular gas in the filament is not outflowing, it is slowed relative to the stellar velocities in the galaxy. By comparison, stars that form in the molecular filament will decouple from this flow and move ballistically in the central galaxy’s gravitational potential. Infalling stars from the S filament should subsequently overshoot the galaxy centre, which could explain the extention of the stellar stream to the NE of the nucleus (Fig. 4). The stars to the NW of the N radio lobe would then have to be younger than those in the S filament and have formed ago or they would have already dispersed.
5 Conclusions
The molecular gas in the central galaxy of Abell 1795 forms two massive, extended filaments that lie around the outer peripheries of two radio bubbles inflated by the jet. For thick, clumpy shells of molecular gas around the radio bubbles, the column depth is greatest around the peripheries and therefore this morphology will be detected as bright rims, as observed. Assuming a Galactic factor, the total mass of molecular gas is and over half is located along the outer edge of the N radio bubble. The S filament is less massive but the spatial anti-correlation with a bright FUV filament suggests that the inner section of molecular gas may have fuelled a recent burst of star formation. The molecular gas velocities along the N filament increase smoothly with radius from the central galaxy’s systemic velocity around the nucleus to , which is the average of the surrounding cluster galaxies, at a radius of (). The close spatial association between the molecular structures and the radio lobes, together with the ordered velocity gradients and narrow velocity dispersions, show that the molecular filaments are gas flows entrained by the expanding radio bubbles.
Direct uplift of the molecular gas clouds by the radio bubbles appears to require an infeasibly high coupling efficiency and more energy than could be supplied by the inner bubbles. Whilst entrainment over multiple generations of radio bubbles could explain the mismatch between the mechanical power and the outflow energy, the bubbles would still need to lift more than half of the molecular gas into extended filaments. We therefore considered the stimulated feedback mechanism where low entropy X-ray gas lifted by the radio bubbles becomes thermally unstable and cools rapidly to form molecular clouds in situ. X-ray observations of Abell 1795 reveal plumes of low entropy X-ray gas, enriched with metals by stellar activity in the central galaxy, that align with the radio bubble axis. The total uplifted X-ray gas mass of is sufficient to supply the observed mass of molecular gas. Multiple generations of radio bubbles are still required to lift this substantial gas mass and the close association of the molecular gas with the inner radio bubbles indicates that the cold gas either moulds the newly expanding bubbles or is itself pushed aside and shaped as they inflate.
Acknowledgements
HRR and ACF acknowledge support from ERC Advanced Grant Feedback 340442. BRM acknowledges support from the Natural Sciences and Engineering Council of Canada and the Canadian Space Agency Space Science Enhancement Program. ACE acknowledges support from STFC grant ST/P000541/1. PS acknowledges support from the ANR grant LYRICS (ANR-16-CE31-0011). We thank the reviewer for their helpful and constructive comments. This paper makes use of the following ALMA data: ADS/JAO.ALMA 2015.1.00623.S. ALMA is a partnership of ESO (representing its member states), NSF (USA) and NINS (Japan), together with NRC (Canada), NSC and ASIAA (Taiwan), and KASI (Republic of Korea), in cooperation with the Republic of Chile. The Joint ALMA Observatory is operated by ESO, AUI/NRAO and NAOJ. The scientific results reported in this article are based on data obtained from the Chandra Data Archive.
References
- Alatalo et al. (2011) Alatalo K., et al., 2011, \hrefhttp://dx.doi.org/10.1088/0004-637X/735/2/88 ApJ, \hrefhttp://adsabs.harvard.edu/abs/2011ApJ…735…88A 735, 88
- Anton (1993) Anton K., 1993, A&A, \hrefhttp://adsabs.harvard.edu/abs/1993A%26A…270…60A 270, 60
- Aravena et al. (2016) Aravena M., et al., 2016, \hrefhttp://dx.doi.org/10.1093/mnras/stw275 MNRAS, \hrefhttp://adsabs.harvard.edu/abs/2016MNRAS.457.4406A 457, 4406
- Best et al. (2007) Best P. N., von der Linden A., Kauffmann G., Heckman T. M., Kaiser C. R., 2007, \hrefhttp://dx.doi.org/10.1111/j.1365-2966.2007.11937.x MNRAS, \hrefhttp://adsabs.harvard.edu/abs/2007MNRAS.379..894B 379, 894
- Bîrzan et al. (2004) Bîrzan L., Rafferty D. A., McNamara B. R., Wise M. W., Nulsen P. E. J., 2004, \hrefhttp://dx.doi.org/10.1086/383519 ApJ, \hrefhttp://adsabs.harvard.edu/abs/2004ApJ…607..800B 607, 800
- Bîrzan et al. (2008) Bîrzan L., McNamara B. R., Nulsen P. E. J., Carilli C. L., Wise M. W., 2008, \hrefhttp://dx.doi.org/10.1086/591416 ApJ, \hrefhttp://adsabs.harvard.edu/abs/2008ApJ…686..859B 686, 859
- Blakeslee & Tonry (1992) Blakeslee J. P., Tonry J. L., 1992, \hrefhttp://dx.doi.org/10.1086/116160 AJ, \hrefhttp://cdsads.u-strasbg.fr/abs/1992AJ….103.1457B 103, 1457
- Boehringer et al. (1993) Boehringer H., Voges W., Fabian A. C., Edge A. C., Neumann D. M., 1993, MNRAS, \hrefhttp://adsabs.harvard.edu/abs/1993MNRAS.264L..25B 264, L25
- Bolatto et al. (2013) Bolatto A. D., Wolfire M., Leroy A. K., 2013, \hrefhttp://dx.doi.org/10.1146/annurev-astro-082812-140944 ARA&A, \hrefhttp://adsabs.harvard.edu/abs/2013ARA%26A..51..207B 51, 207
- Bower et al. (2006) Bower R. G., Benson A. J., Malbon R., Helly J. C., Frenk C. S., Baugh C. M., Cole S., Lacey C. G., 2006, \hrefhttp://dx.doi.org/10.1111/j.1365-2966.2006.10519.x MNRAS, \hrefhttp://adsabs.harvard.edu/abs/2006MNRAS.370..645B 370, 645
- Brighenti et al. (2015) Brighenti F., Mathews W. G., Temi P., 2015, \hrefhttp://dx.doi.org/10.1088/0004-637X/802/2/118 ApJ, \hrefhttp://adsabs.harvard.edu/abs/2015ApJ…802..118B 802, 118
- Burns (1990) Burns J. O., 1990, \hrefhttp://dx.doi.org/10.1086/115307 AJ, \hrefhttp://adsabs.harvard.edu/abs/1990AJ…..99…14B 99, 14
- Churazov et al. (2000) Churazov E., Forman W., Jones C., Böhringer H., 2000, A&A, \hrefhttp://adsabs.harvard.edu/abs/2000A%26A…356..788C 356, 788
- Cicone et al. (2014) Cicone C., et al., 2014, \hrefhttp://dx.doi.org/10.1051/0004-6361/201322464 A&A, \hrefhttp://adsabs.harvard.edu/abs/2014A%26A…562A..21C 562, A21
- Cowie et al. (1983) Cowie L. L., Hu E. M., Jenkins E. B., York D. G., 1983, \hrefhttp://dx.doi.org/10.1086/161259 ApJ, \hrefhttp://adsabs.harvard.edu/abs/1983ApJ…272…29C 272, 29
- Crawford et al. (2005) Crawford C. S., Sanders J. S., Fabian A. C., 2005, \hrefhttp://dx.doi.org/10.1111/j.1365-2966.2005.09149.x MNRAS, \hrefhttp://adsabs.harvard.edu/abs/2005MNRAS.361…17C 361, 17
- Croton et al. (2006) Croton D. J., et al., 2006, \hrefhttp://dx.doi.org/10.1111/j.1365-2966.2005.09675.x MNRAS, \hrefhttp://adsabs.harvard.edu/abs/2006MNRAS.365…11C 365, 11
- Dasyra & Combes (2011) Dasyra K. M., Combes F., 2011, \hrefhttp://dx.doi.org/10.1051/0004-6361/201117730 A&A, \hrefhttp://adsabs.harvard.edu/abs/2011A%26A…533L..10D 533, L10
- Dasyra et al. (2016) Dasyra K. M., Combes F., Oosterloo T., Oonk J. B. R., Morganti R., Salomé P., Vlahakis N., 2016, \hrefhttp://dx.doi.org/10.1051/0004-6361/201629689 A&A, \hrefhttp://adsabs.harvard.edu/abs/2016A%26A…595L…7D 595, L7
- David et al. (1994) David L. P., Jones C., Forman W., Daines S., 1994, \hrefhttp://dx.doi.org/10.1086/174264 ApJ, \hrefhttp://adsabs.harvard.edu/abs/1994ApJ…428..544D 428, 544
- David et al. (2014) David L. P., et al., 2014, \hrefhttp://dx.doi.org/10.1088/0004-637X/792/2/94 ApJ, \hrefhttp://adsabs.harvard.edu/abs/2014ApJ…792…94D 792, 94
- Di Matteo et al. (2005) Di Matteo T., Springel V., Hernquist L., 2005, \hrefhttp://dx.doi.org/10.1038/nature03335 Nat, \hrefhttp://adsabs.harvard.edu/abs/2005Natur.433..604D 433, 604
- Donahue et al. (2011) Donahue M., de Messières G. E., O’Connell R. W., Voit G. M., Hoffer A., McNamara B. R., Nulsen P. E. J., 2011, \hrefhttp://dx.doi.org/10.1088/0004-637X/732/1/40 ApJ, \hrefhttp://adsabs.harvard.edu/abs/2011ApJ…732…40D 732, 40
- Downes & Solomon (1998) Downes D., Solomon P. M., 1998, \hrefhttp://dx.doi.org/10.1086/306339 ApJ, \hrefhttp://adsabs.harvard.edu/abs/1998ApJ…507..615D 507, 615
- Downes et al. (1993) Downes D., Solomon P. M., Radford S. J. E., 1993, \hrefhttp://dx.doi.org/10.1086/186984 ApJ, \hrefhttp://adsabs.harvard.edu/abs/1993ApJ…414L..13D 414, L13
- Dunn & Fabian (2006) Dunn R. J. H., Fabian A. C., 2006, \hrefhttp://dx.doi.org/10.1111/j.1365-2966.2006.11080.x MNRAS, \hrefhttp://adsabs.harvard.edu/abs/2006MNRAS.373..959D 373, 959
- Ehlert et al. (2015) Ehlert S., McDonald M., David L. P., Miller E. D., Bautz M. W., 2015, \hrefhttp://dx.doi.org/10.1088/0004-637X/799/2/174 ApJ, \hrefhttp://adsabs.harvard.edu/abs/2015ApJ…799..174E 799, 174
- Fabian et al. (1994) Fabian A. C., Johnstone R. M., Daines S. J., 1994, MNRAS, \hrefhttp://adsabs.harvard.edu/abs/1994MNRAS.271..737F 271, 737
- Fabian et al. (2000) Fabian A. C., et al., 2000, MNRAS, \hrefhttp://adsabs.harvard.edu/abs/2000MNRAS.318L..65F 318, L65
- Fabian et al. (2001) Fabian A. C., Sanders J. S., Ettori S., Taylor G. B., Allen S. W., Crawford C. S., Iwasawa K., Johnstone R. M., 2001, \hrefhttp://dx.doi.org/10.1046/j.1365-8711.2001.04243.x MNRAS, \hrefhttp://adsabs.harvard.edu/abs/2001MNRAS.321L..33F 321, L33
- Fabian et al. (2002) Fabian A. C., Allen S. W., Crawford C. S., Johnstone R. M., Morris R. G., Sanders J. S., Schmidt R. W., 2002, \hrefhttp://dx.doi.org/10.1046/j.1365-8711.2002.05510.x MNRAS, \hrefhttp://adsabs.harvard.edu/abs/2002MNRAS.332L..50F 332, L50
- Fabian et al. (2008) Fabian A. C., Johnstone R. M., Sanders J. S., Conselice C. J., Crawford C. S., Gallagher III J. S., Zweibel E., 2008, \hrefhttp://dx.doi.org/10.1038/nature07169 Nat, \hrefhttp://adsabs.harvard.edu/abs/2008Natur.454..968F 454, 968
- Fabian et al. (2011) Fabian A. C., et al., 2011, \hrefhttp://dx.doi.org/10.1111/j.1365-2966.2011.19402.x MNRAS, \hrefhttp://adsabs.harvard.edu/abs/2011MNRAS.418.2154F 418, 2154
- Ferland et al. (1994) Ferland G. J., Fabian A. C., Johnstone R. M., 1994, MNRAS, \hrefhttp://adsabs.harvard.edu/abs/1994MNRAS.266..399F 266, 399
- Ferland et al. (2009) Ferland G. J., Fabian A. C., Hatch N. A., Johnstone R. M., Porter R. L., van Hoof P. A. M., Williams R. J. R., 2009, \hrefhttp://dx.doi.org/10.1111/j.1365-2966.2008.14153.x MNRAS, \hrefhttp://adsabs.harvard.edu/abs/2009MNRAS.392.1475F 392, 1475
- Feruglio et al. (2010) Feruglio C., Maiolino R., Piconcelli E., Menci N., Aussel H., Lamastra A., Fiore F., 2010, \hrefhttp://dx.doi.org/10.1051/0004-6361/201015164 A&A, \hrefhttp://adsabs.harvard.edu/abs/2010A%26A…518L.155F 518, L155
- Gaspari et al. (2013) Gaspari M., Ruszkowski M., Oh S. P., 2013, \hrefhttp://dx.doi.org/10.1093/mnras/stt692 MNRAS, \hrefhttp://adsabs.harvard.edu/abs/2013MNRAS.432.3401G 432, 3401
- Ge & Owen (1993) Ge J. P., Owen F. N., 1993, \hrefhttp://dx.doi.org/10.1086/116471 AJ, \hrefhttp://adsabs.harvard.edu/abs/1993AJ….105..778G 105, 778
- Hamer et al. (2014) Hamer S. L., et al., 2014, \hrefhttp://dx.doi.org/10.1093/mnras/stt1949 MNRAS, \hrefhttp://adsabs.harvard.edu/abs/2014MNRAS.437..862H 437, 862
- Hill & Oegerle (1993) Hill J. M., Oegerle W. R., 1993, \hrefhttp://dx.doi.org/10.1086/116688 AJ, \hrefhttp://adsabs.harvard.edu/abs/1993AJ….106..831H 106, 831
- Hill et al. (1988) Hill J. M., Hintzen P., Oegerle W. R., Romanishin W., Lesser M. P., Eisenhamer J. D., Batuski D. J., 1988, \hrefhttp://dx.doi.org/10.1086/185258 ApJ, \hrefhttp://adsabs.harvard.edu/abs/1988ApJ…332L..23H 332, L23
- Hitomi Collaboration (2016) Hitomi Collaboration 2016, \hrefhttp://dx.doi.org/10.1038/nature18627 Nat, \hrefhttp://adsabs.harvard.edu/abs/2016Natur.535..117H 535, 117
- Hogan et al. (2017) Hogan M. T., et al., 2017, preprint, \hrefhttp://adsabs.harvard.edu/abs/2017arXiv170400011H (\hrefhttp://arxiv.org/abs/1704.00011 arXiv:1704.00011)
- Hopkins et al. (2006) Hopkins P. F., Hernquist L., Cox T. J., Di Matteo T., Robertson B., Springel V., 2006, \hrefhttp://dx.doi.org/10.1086/499298 ApJS, \hrefhttp://adsabs.harvard.edu/abs/2006ApJS..163….1H 163, 1
- Hu et al. (1985) Hu E. M., Cowie L. L., Wang Z., 1985, \hrefhttp://dx.doi.org/10.1086/191081 ApJS, \hrefhttp://adsabs.harvard.edu/abs/1985ApJS…59..447H 59, 447
- Iono et al. (2007) Iono D., et al., 2007, \hrefhttp://dx.doi.org/10.1086/512362 ApJ, \hrefhttp://adsabs.harvard.edu/abs/2007ApJ…659..283I 659, 283
- Jaffe et al. (2005) Jaffe W., Bremer M. N., Baker K., 2005, \hrefhttp://dx.doi.org/10.1111/j.1365-2966.2005.09073.x MNRAS, \hrefhttp://adsabs.harvard.edu/abs/2005MNRAS.360..748J 360, 748
- Kirkpatrick & McNamara (2015) Kirkpatrick C. C., McNamara B. R., 2015, \hrefhttp://dx.doi.org/10.1093/mnras/stv1574 MNRAS, \hrefhttp://adsabs.harvard.edu/abs/2015MNRAS.452.4361K 452, 4361
- Kirkpatrick et al. (2009) Kirkpatrick C. C., et al., 2009, \hrefhttp://dx.doi.org/10.1088/0004-637X/697/1/867 ApJ, \hrefhttp://adsabs.harvard.edu/abs/2009ApJ…697..867K 697, 867
- Li & Bryan (2014) Li Y., Bryan G. L., 2014, \hrefhttp://dx.doi.org/10.1088/0004-637X/789/2/153 ApJ, \hrefhttp://adsabs.harvard.edu/abs/2014ApJ…789..153L 789, 153
- Lim et al. (2012) Lim J., Ohyama Y., Chi-Hung Y., Dinh-V-Trung Shiang-Yu W., 2012, \hrefhttp://dx.doi.org/10.1088/0004-637X/744/2/112 ApJ, \hrefhttp://adsabs.harvard.edu/abs/2012ApJ…744..112L 744, 112
- Liuzzo et al. (2009) Liuzzo E., Taylor G. B., Giovannini G., Giroletti M., 2009, \hrefhttp://dx.doi.org/10.1051/0004-6361/200911964 A&A, \hrefhttp://adsabs.harvard.edu/abs/2009A%26A…501..933L 501, 933
- Magorrian et al. (1998) Magorrian J., et al., 1998, \hrefhttp://dx.doi.org/10.1086/300353 AJ, \hrefhttp://adsabs.harvard.edu/abs/1998AJ….115.2285M 115, 2285
- Markevitch et al. (2001) Markevitch M., Vikhlinin A., Mazzotta P., 2001, \hrefhttp://dx.doi.org/10.1086/337973 ApJ, \hrefhttp://adsabs.harvard.edu/abs/2001ApJ…562L.153M 562, L153
- Markwardt (2009) Markwardt C. B., 2009, in Bohlender D. A., Durand D., Dowler P., eds, Astronomical Society of the Pacific Conference Series Vol. 411, Astronomical Data Analysis Software and Systems XVIII. p. 251 (\hrefhttp://arxiv.org/abs/0902.2850 arXiv:0902.2850)
- McDonald & Veilleux (2009) McDonald M., Veilleux S., 2009, \hrefhttp://dx.doi.org/10.1088/0004-637X/703/2/L172 ApJ, \hrefhttp://adsabs.harvard.edu/abs/2009ApJ…703L.172M 703, L172
- McDonald et al. (2012a) McDonald M., Veilleux S., Rupke D. S. N., 2012a, \hrefhttp://dx.doi.org/10.1088/0004-637X/746/2/153 ApJ, \hrefhttp://adsabs.harvard.edu/abs/2012ApJ…746..153M 746, 153
- McDonald et al. (2012b) McDonald M., Wei L. H., Veilleux S., 2012b, \hrefhttp://dx.doi.org/10.1088/2041-8205/755/2/L24 ApJ, \hrefhttp://adsabs.harvard.edu/abs/2012ApJ…755L..24M 755, L24
- McDonald et al. (2014a) McDonald M., et al., 2014a, \hrefhttp://dx.doi.org/10.1088/0004-637X/784/1/18 ApJ, \hrefhttp://adsabs.harvard.edu/abs/2014ApJ…784…18M 784, 18
- McDonald et al. (2014b) McDonald M., Roediger J., Veilleux S., Ehlert S., 2014b, \hrefhttp://dx.doi.org/10.1088/2041-8205/791/2/L30 ApJ, \hrefhttp://adsabs.harvard.edu/abs/2014ApJ…791L..30M 791, L30
- McMullin et al. (2007) McMullin J. P., Waters B., Schiebel D., Young W., Golap K., 2007, in Shaw R. A., Hill F., Bell D. J., eds, Astronomical Society of the Pacific Conference Series Vol. 376, Astronomical Data Analysis Software and Systems XVI. p. 127
- McNamara & Nulsen (2007) McNamara B. R., Nulsen P. E. J., 2007, \hrefhttp://dx.doi.org/10.1146/annurev.astro.45.051806.110625 ARA&A, \hrefhttp://adsabs.harvard.edu/abs/2007ARA%26A..45..117M 45, 117
- McNamara & Nulsen (2012) McNamara B. R., Nulsen P. E. J., 2012, \hrefhttp://dx.doi.org/10.1088/1367-2630/14/5/055023 New Journal of Physics, \hrefhttp://adsabs.harvard.edu/abs/2012NJPh…14e5023M 14, 055023
- McNamara et al. (1996) McNamara B. R., Wise M., Sarazin C. L., Jannuzi B. T., Elston R., 1996, \hrefhttp://dx.doi.org/10.1086/310162 ApJ, \hrefhttp://adsabs.harvard.edu/abs/1996ApJ…466L…9M 466, L9
- McNamara et al. (2000) McNamara B. R., et al., 2000, \hrefhttp://dx.doi.org/10.1086/312662 ApJ, \hrefhttp://adsabs.harvard.edu/abs/2000ApJ…534L.135M 534, L135
- McNamara et al. (2014) McNamara B. R., et al., 2014, \hrefhttp://dx.doi.org/10.1088/0004-637X/785/1/44 ApJ, \hrefhttp://adsabs.harvard.edu/abs/2014ApJ…785…44M 785, 44
- McNamara et al. (2016) McNamara B. R., Russell H. R., Nulsen P. E. J., Hogan M. T., Fabian A. C., Pulido F., Edge A. C., 2016, \hrefhttp://dx.doi.org/10.3847/0004-637X/830/2/79 ApJ, \hrefhttp://adsabs.harvard.edu/abs/2016ApJ…830…79M 830, 79
- Mittaz et al. (2001) Mittaz J. P. D., et al., 2001, \hrefhttp://dx.doi.org/10.1051/0004-6361:20000019 A&A, \hrefhttp://adsabs.harvard.edu/abs/2001A%26A…365L..93M 365, L93
- Morganti et al. (2005) Morganti R., Tadhunter C. N., Oosterloo T. A., 2005, \hrefhttp://dx.doi.org/10.1051/0004-6361:200500197 A&A, \hrefhttp://adsabs.harvard.edu/abs/2005A%26A…444L…9M 444, L9
- Morganti et al. (2013) Morganti R., Fogasy J., Paragi Z., Oosterloo T., Orienti M., 2013, \hrefhttp://dx.doi.org/10.1126/science.1240436 Science, \hrefhttp://adsabs.harvard.edu/abs/2013Sci…341.1082M 341, 1082
- Morganti et al. (2015) Morganti R., Oosterloo T., Oonk J. B. R., Frieswijk W., Tadhunter C., 2015, \hrefhttp://dx.doi.org/10.1051/0004-6361/201525860 A&A, \hrefhttp://adsabs.harvard.edu/abs/2015A%26A…580A…1M 580, A1
- Nesvadba et al. (2006) Nesvadba N. P. H., Lehnert M. D., Eisenhauer F., Gilbert A., Tecza M., Abuter R., 2006, \hrefhttp://dx.doi.org/10.1086/507266 ApJ, \hrefhttp://adsabs.harvard.edu/abs/2006ApJ…650..693N 650, 693
- Nulsen (1986) Nulsen P. E. J., 1986, \hrefhttp://dx.doi.org/10.1093/mnras/221.2.377 MNRAS, \hrefhttp://adsabs.harvard.edu/abs/1986MNRAS.221..377N 221, 377
- O’Dea et al. (2004) O’Dea C. P., Baum S. A., Mack J., Koekemoer A. M., Laor A., 2004, \hrefhttp://dx.doi.org/10.1086/422402 ApJ, \hrefhttp://adsabs.harvard.edu/abs/2004ApJ…612..131O 612, 131
- Oegerle & Hill (1994) Oegerle W. R., Hill J. M., 1994, \hrefhttp://dx.doi.org/10.1086/116899 AJ, \hrefhttp://adsabs.harvard.edu/abs/1994AJ….107..857O 107, 857
- Oegerle & Hoessel (1991) Oegerle W. R., Hoessel J. G., 1991, \hrefhttp://dx.doi.org/10.1086/170165 ApJ, \hrefhttp://cdsads.u-strasbg.fr/abs/1991ApJ…375…15O 375, 15
- Peterson & Fabian (2006) Peterson J. R., Fabian A. C., 2006, \hrefhttp://dx.doi.org/10.1016/j.physrep.2005.12.007 Phys. Rep., \hrefhttp://adsabs.harvard.edu/abs/2006PhR…427….1P 427, 1
- Peterson et al. (2003) Peterson J. R., Kahn S. M., Paerels F. B. S., Kaastra J. S., Tamura T., Bleeker J. A. M., Ferrigno C., Jernigan J. G., 2003, \hrefhttp://dx.doi.org/10.1086/374830 ApJ, \hrefhttp://adsabs.harvard.edu/abs/2003ApJ…590..207P 590, 207
- Pinkney et al. (1996) Pinkney J., et al., 1996, \hrefhttp://dx.doi.org/10.1086/310219 ApJ, \hrefhttp://adsabs.harvard.edu/abs/1996ApJ…468L..13P 468, L13
- Pizzolato & Soker (2005) Pizzolato F., Soker N., 2005, \hrefhttp://dx.doi.org/10.1086/444344 ApJ, \hrefhttp://adsabs.harvard.edu/abs/2005ApJ…632..821P 632, 821
- Revaz et al. (2008) Revaz Y., Combes F., Salomé P., 2008, \hrefhttp://dx.doi.org/10.1051/0004-6361:20078915 A&A, \hrefhttp://adsabs.harvard.edu/abs/2008A%26A…477L..33R 477, L33
- Rupke & Veilleux (2011) Rupke D. S. N., Veilleux S., 2011, \hrefhttp://dx.doi.org/10.1088/2041-8205/729/2/L27 ApJ, \hrefhttp://adsabs.harvard.edu/abs/2011ApJ…729L..27R 729, L27
- Russell et al. (2013) Russell H. R., McNamara B. R., Edge A. C., Hogan M. T., Main R. A., Vantyghem A. N., 2013, \hrefhttp://dx.doi.org/10.1093/mnras/stt490 MNRAS, \hrefhttp://adsabs.harvard.edu/abs/2013MNRAS.432..530R 432, 530
- Russell et al. (2016) Russell H. R., et al., 2016, \hrefhttp://dx.doi.org/10.1093/mnras/stw409 MNRAS, \hrefhttp://adsabs.harvard.edu/abs/2016MNRAS.458.3134R 458, 3134
- Russell et al. (2017) Russell H. R., et al., 2017, \hrefhttp://dx.doi.org/10.3847/1538-4357/836/1/130 ApJ, \hrefhttp://adsabs.harvard.edu/abs/2017ApJ…836..130R 836, 130
- Salomé & Combes (2003) Salomé P., Combes F., 2003, \hrefhttp://dx.doi.org/10.1051/0004-6361:20031438 A&A, \hrefhttp://adsabs.harvard.edu/abs/2003A%26A…412..657S 412, 657
- Salomé & Combes (2004) Salomé P., Combes F., 2004, \hrefhttp://dx.doi.org/10.1051/0004-6361:20031744 A&A, \hrefhttp://adsabs.harvard.edu/abs/2004A%26A…415L…1S 415, L1
- Salomé et al. (2006) Salomé P., et al., 2006, \hrefhttp://dx.doi.org/10.1051/0004-6361:20054745 A&A, \hrefhttp://adsabs.harvard.edu/abs/2006A%26A…454..437S 454, 437
- Salomé et al. (2011) Salomé P., Combes F., Revaz Y., Downes D., Edge A. C., Fabian A. C., 2011, \hrefhttp://dx.doi.org/10.1051/0004-6361/200811333 A&A, \hrefhttp://adsabs.harvard.edu/abs/2011A%26A…531A..85S 531, A85
- Simionescu et al. (2008) Simionescu A., Werner N., Finoguenov A., Böhringer H., Brüggen M., 2008, \hrefhttp://dx.doi.org/10.1051/0004-6361:20078749 A&A, \hrefhttp://adsabs.harvard.edu/abs/2008A%26A…482…97S 482, 97
- Smith et al. (1997) Smith E. P., Bohlin R. C., Bothun G. D., O’Connell R. W., Roberts M. S., Neff S. G., Smith A. M., Stecher T. P., 1997, \hrefhttp://dx.doi.org/10.1086/303819 ApJ, \hrefhttp://adsabs.harvard.edu/abs/1997ApJ…478..516S 478, 516
- Soker et al. (2004) Soker N., Blanton E. L., Sarazin C. L., 2004, \hrefhttp://dx.doi.org/10.1051/0004-6361:20034415 A&A, \hrefhttp://adsabs.harvard.edu/abs/2004A%26A…422..445S 422, 445
- Solomon & Vanden Bout (2005) Solomon P. M., Vanden Bout P. A., 2005, \hrefhttp://dx.doi.org/10.1146/annurev.astro.43.051804.102221 ARA&A, \hrefhttp://adsabs.harvard.edu/abs/2005ARA%26A..43..677S 43, 677
- Solomon et al. (1987) Solomon P. M., Rivolo A. R., Barrett J., Yahil A., 1987, \hrefhttp://dx.doi.org/10.1086/165493 ApJ, \hrefhttp://adsabs.harvard.edu/abs/1987ApJ…319..730S 319, 730
- Sturm et al. (2011) Sturm E., et al., 2011, \hrefhttp://dx.doi.org/10.1088/2041-8205/733/1/L16 ApJ, \hrefhttp://adsabs.harvard.edu/abs/2011ApJ…733L..16S 733, L16
- Tadhunter et al. (2014) Tadhunter C., Morganti R., Rose M., Oonk J. B. R., Oosterloo T., 2014, \hrefhttp://dx.doi.org/10.1038/nature13520 Nat, \hrefhttp://adsabs.harvard.edu/abs/2014Natur.511..440T 511, 440
- Tremblay et al. (2015) Tremblay G. R., et al., 2015, \hrefhttp://dx.doi.org/10.1093/mnras/stv1151 MNRAS, \hrefhttp://adsabs.harvard.edu/abs/2015MNRAS.451.3768T 451, 3768
- Tremblay et al. (2016) Tremblay G. R., et al., 2016, \hrefhttp://dx.doi.org/10.1038/nature17969 Nat, \hrefhttp://adsabs.harvard.edu/abs/2016Natur.534..218T 534, 218
- Vantyghem et al. (2016) Vantyghem A. N., et al., 2016, \hrefhttp://dx.doi.org/10.3847/0004-637X/832/2/148 ApJ, \hrefhttp://adsabs.harvard.edu/abs/2016ApJ…832..148V 832, 148
- Voigt & Fabian (2004) Voigt L. M., Fabian A. C., 2004, \hrefhttp://dx.doi.org/10.1111/j.1365-2966.2004.07285.x MNRAS, \hrefhttp://adsabs.harvard.edu/abs/2004MNRAS.347.1130V 347, 1130
- Voit & Donahue (2011) Voit G. M., Donahue M., 2011, \hrefhttp://dx.doi.org/10.1088/2041-8205/738/2/L24 ApJ, \hrefhttp://adsabs.harvard.edu/abs/2011ApJ…738L..24V 738, L24
- Voit et al. (2016) Voit G. M., Meece G., Li Y., O’Shea B. W., Bryan G. L., Donahue M., 2016, preprint, \hrefhttp://adsabs.harvard.edu/abs/2016arXiv160702212V (\hrefhttp://arxiv.org/abs/1607.02212 arXiv:1607.02212)
- Wagner & Bicknell (2011) Wagner A. Y., Bicknell G. V., 2011, \hrefhttp://dx.doi.org/10.1088/0004-637X/728/1/29 ApJ, \hrefhttp://adsabs.harvard.edu/abs/2011ApJ…728…29W 728, 29
- Werner et al. (2010) Werner N., et al., 2010, \hrefhttp://dx.doi.org/10.1111/j.1365-2966.2010.16755.x MNRAS, \hrefhttp://adsabs.harvard.edu/abs/2010MNRAS.407.2063W 407, 2063
- Zabludoff et al. (1990) Zabludoff A. I., Huchra J. P., Geller M. J., 1990, \hrefhttp://dx.doi.org/10.1086/191492 ApJS, \hrefhttp://adsabs.harvard.edu/abs/1990ApJS…74….1Z 74, 1
- van Breugel et al. (1984) van Breugel W., Heckman T., Miley G., 1984, \hrefhttp://dx.doi.org/10.1086/161594 ApJ, \hrefhttp://adsabs.harvard.edu/abs/1984ApJ…276…79V 276, 79