Absence of cyclotron resonance in the anomalous metallic phase in InOx
Abstract
It is observed that many thin superconducting films with not too high disorder level (generally R) placed in magnetic field show an anomalous metallic phase where the resistance is low but still finite as temperature goes to zero. Here we report in weakly disordered amorphous InOx thin films, that this anomalous metal phase possesses no cyclotron resonance and hence non-Drude electrodynamics. The absence of a finite frequency resonant mode can be associated with a vanishing downstream component of the vortex current parallel to the supercurrent and an emergent particle-hole symmetry of this metal, which establishes its non-Fermi liquid character.
Conventional wisdom dictates that electrons confined to two dimensions and cooled to the limit of zero temperature can only be superconducting or insulating. Yet a number of examples of zero temperature 2D metallic states exist. A particularly interesting example is the anomalous metal where thin superconducting films in magnetic field may exhibit a saturated, but non-zero resistance much smaller than the normal state at low temperature. This is a widely observed phenomenon that manifests in a diverse number of physical systems: disordered thin films, Jaeger et al. (1989); Yazdani and Kapitulnik (1995); Ephron et al. (1996); Mason and Kapitulnik (1999); Paalanen et al. (1992); Chervenak and Valles (2000); Lin et al. (2012); Liu et al. (2013), Josephson junctions arrays Van der Zant et al. (1992); Han et al. (2014), artificially patterned superconducting islands Eley et al. (2012) and interfacial superconductivity Schneider et al. (2009). It is under appreciated how anomalous this otherwise simple behavior is. The natural behavior of bosons in the limit of zero temperature is either condensed or localized. But here, due to the low resistance of the sample and the obvious manifestation of the superconducting transition one requires the presence of Cooper pairs that move diffusively even in the apparent limit of zero temperature. In our below work we assume that this anomalous metal phase has been established by these previous experiments.
Although observed ubiquitously the nature of this anomalous metal is still unclear Das and Doniach (1999); Mason and Kapitulnik (1999); Kapitulnik et al. (2001); Dalidovich and Phillips (2002); Galitski et al. (2005); Davison et al. (2016); Mulligan and Raghu (2016); Spivak et al. (2008). It was observed in previous experiments Liu et al. (2013) that its optical response is characterized by a very narrow conductance peak with a width that is orders of magnitude less than the normal state scattering rate (which is typically 100 THz). It was shown that over short time scales, the system possesses a frequency dependent phase stiffness Liu et al. (2013), indicating that superconducting correlations are retained on small time and length scales. But how this is possible in a zero temperature dissipative phase, and to what extent this state’s phenomenology is different from conventional metals is unclear.
In this work we have performed broadband microwave measurements of frequency, temperature, and field dependence of the complex microwave conductance on a low-disorder 2D superconducting InOx film. These measurements have been extended to the very low field regime when samples are still highly conductive, giving unprecedented insight into how this anomalous metallic state develops from superconductivity. We show that even at small magnetic fields, although the superconducting delta function is retained, the low frequency dissipative modes almost immediately form. With further applied field the delta function is suppressed leaving only the dissipative peak. Among other aspects we demonstrate that although on some level this anomalous metal can be characterized as a high mobility metal, the system posses cyclotron resonance, which is a ubiquitous feature of high mobility metals with conventional electrons. Our observation has much in common with recent observations that the anomalous metal state has – over a range of fields – no Hall effect Breznay and Kapitulnik (2017). Taken together, these works show that the anomalous metal state has an emergent particle-hole symmetry, that although was previously considered to be a property of the SIT SIT quantum critical point Paalanen et al. (1992); Fisher (1991), is exhibited here over an entire intervening phase.

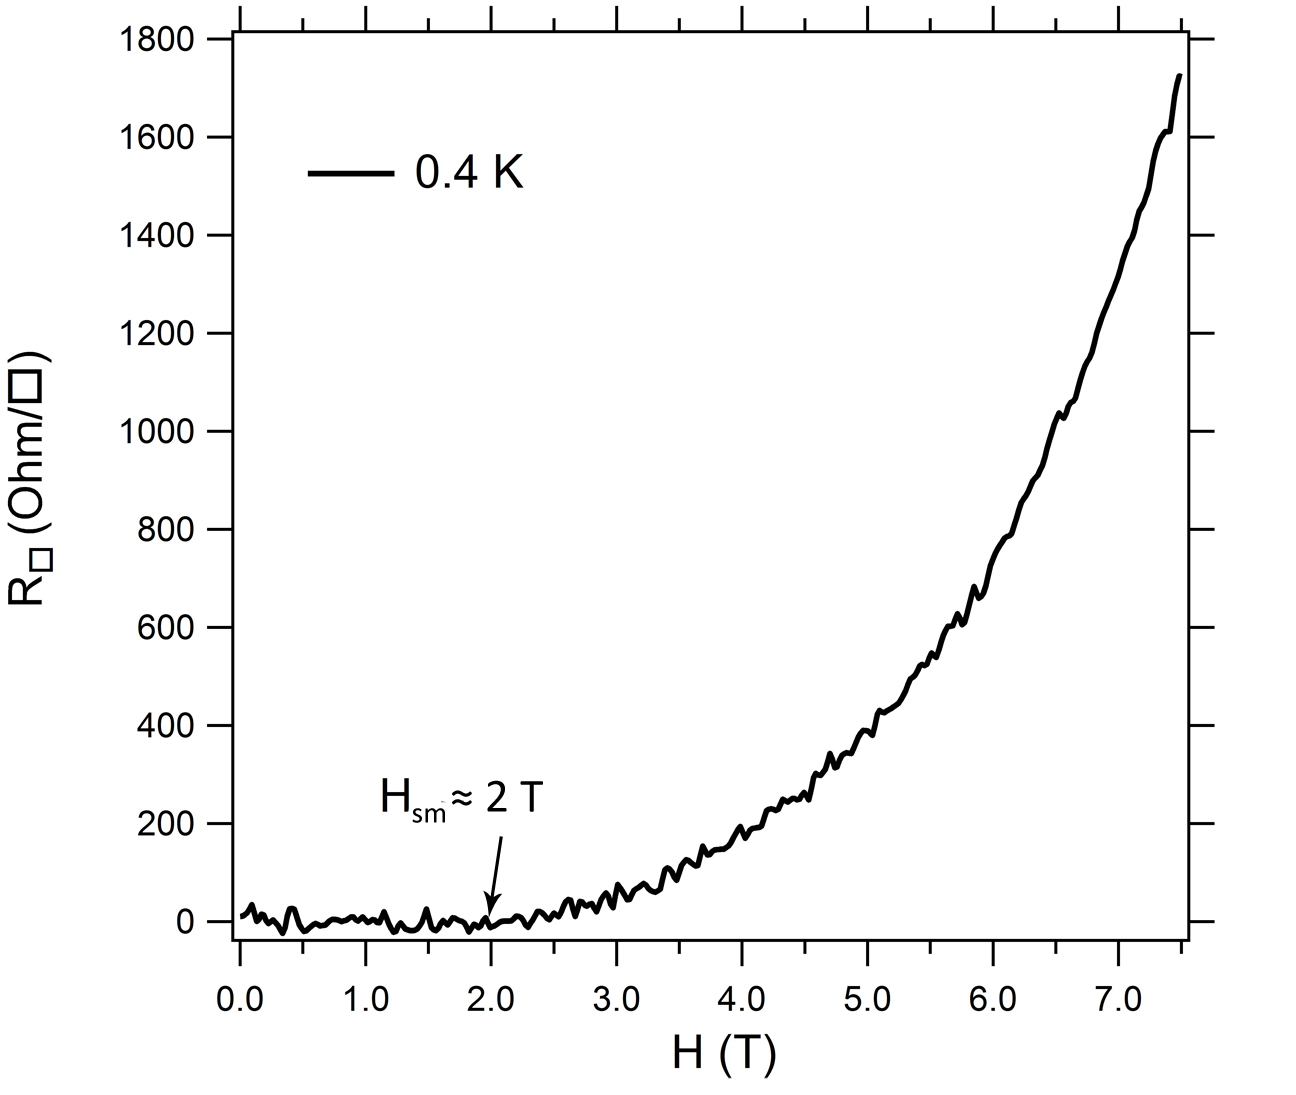
In Fig. S1(a), we show two terminal DC sheet resistance R/ measured in the Corbino geometry as function of temperature. The resistance as a function of field at the low temperature of 0.4 K is presented in Supplemental Information (SI). One can see the characteristic phenomenon of the anomalous metallic phase ree with apparently finite resistances persisting to the low temperature limit. The “mean field” superconducting transition temperature scale at zero field is estimated to be about 2.5 K. As the magnetic field increases, the low temperature () resistance departs from the zero field curve and at base temperature (0.38 K) first becomes distinguishable from zero above 2 T (see SI) which gives us an estimate for the critical field for the superconductor to metal transition . For fields above 2 T, the temperature dependence is weak as and the resistance appears to saturate at finite values much smaller than the normal state. For 4, 6 and 7.5 T, a weak insulating dependence develops around but the resistance still decreases and then levels out at low T. It is important to note that this is likely only a true phase transition in the limit of zero temperature and that any 2D superconductor in magnetic field is expected to have a small (but possibly undetectable resistance) at finite temperature.
In Figs. S1(b)-(c), we show the real () and imaginary () parts of the complex conductance at the base temperature at different fields on log-log plots. This data was measured in a novel broad band Corbino spectrometer Cor down to 0.38 K. Zero field data was used as a superconducting short calibration standard by assuming the imaginary part is ideal (for details see SI). At zero field, the real part has presumably the response of a Dirac delta function given by the spectral weight (e.g. the integrated area) of which corresponds to superfluid density . By Kramers-Kronig consistency, the imaginary part
Here one can rewrite the spectral response in terms of a phase stiffness , which is the energy scale to put a twist in the phase of the superconducting order parameter. With the presence of small external field, the real part immediately obtains a finite value at finite frequency alongside the delta function, which is retained over some range in field (the latter inferred from the vanishing dc resistance). Consistent with this, the imaginary conductance deviates from a dependence at low frequencies which can be interpreted as suppressed long-range phase coherence. The high frequency response near 8 GHz retains its dependence but with reduced magnitude. For fields just below 1 T, is flat over almost a decade of frequencies which further suggests that multiple conductance channels exist and a single Drude term or a dependence is insufficient to account for the low frequency response. Above , the imaginary part develops a broad maximum that was previously interpreted to indicate the fluctuation frequency Liu et al. (2013) on the approach to the superconductor-metal transition.

Notably, as the narrow low frequency peak in decreases in magnitude and broadens, to within experimental uncertainty, it does not shift from zero frequency. If the dissipative state above were a conventional high mobility metal, one would expect to observe classical cyclotron resonance whereby a finite frequency peak will be exhibited in . Cyclotron resonance in which charges undergo periodic orbits in magnetic field is an essential property of conventional metals. Classically this resonance frequency is expected to be . In a Galilean invariant system, via Kohn’s theorem Kohn (1961) this frequency is expected to be unchanged by interactions with an inferred mass equal to the bare electron mass () itself. In low density 2DEGs with Fermi wavelengths much larger than the lattice constant, an approximate Galilean invariance is obtained and is found to be the band mass Abstreiter et al. (1974); Kennedy et al. (1975). From a minimal fitting of the complex conductance using the expression for semi-classical transport fit we can set an upper bound on the cyclotron resonance to be less than 65 MHz at 6 T. This is an exceedingly small number and in the context of semi-classical transport implies an effective mass greater than 2,500 or internal effective field that is 1/2,500 of the applied field! Therefore we ascertain that to within our experimental uncertainty the anomalous metal state has no cyclotron resonance.
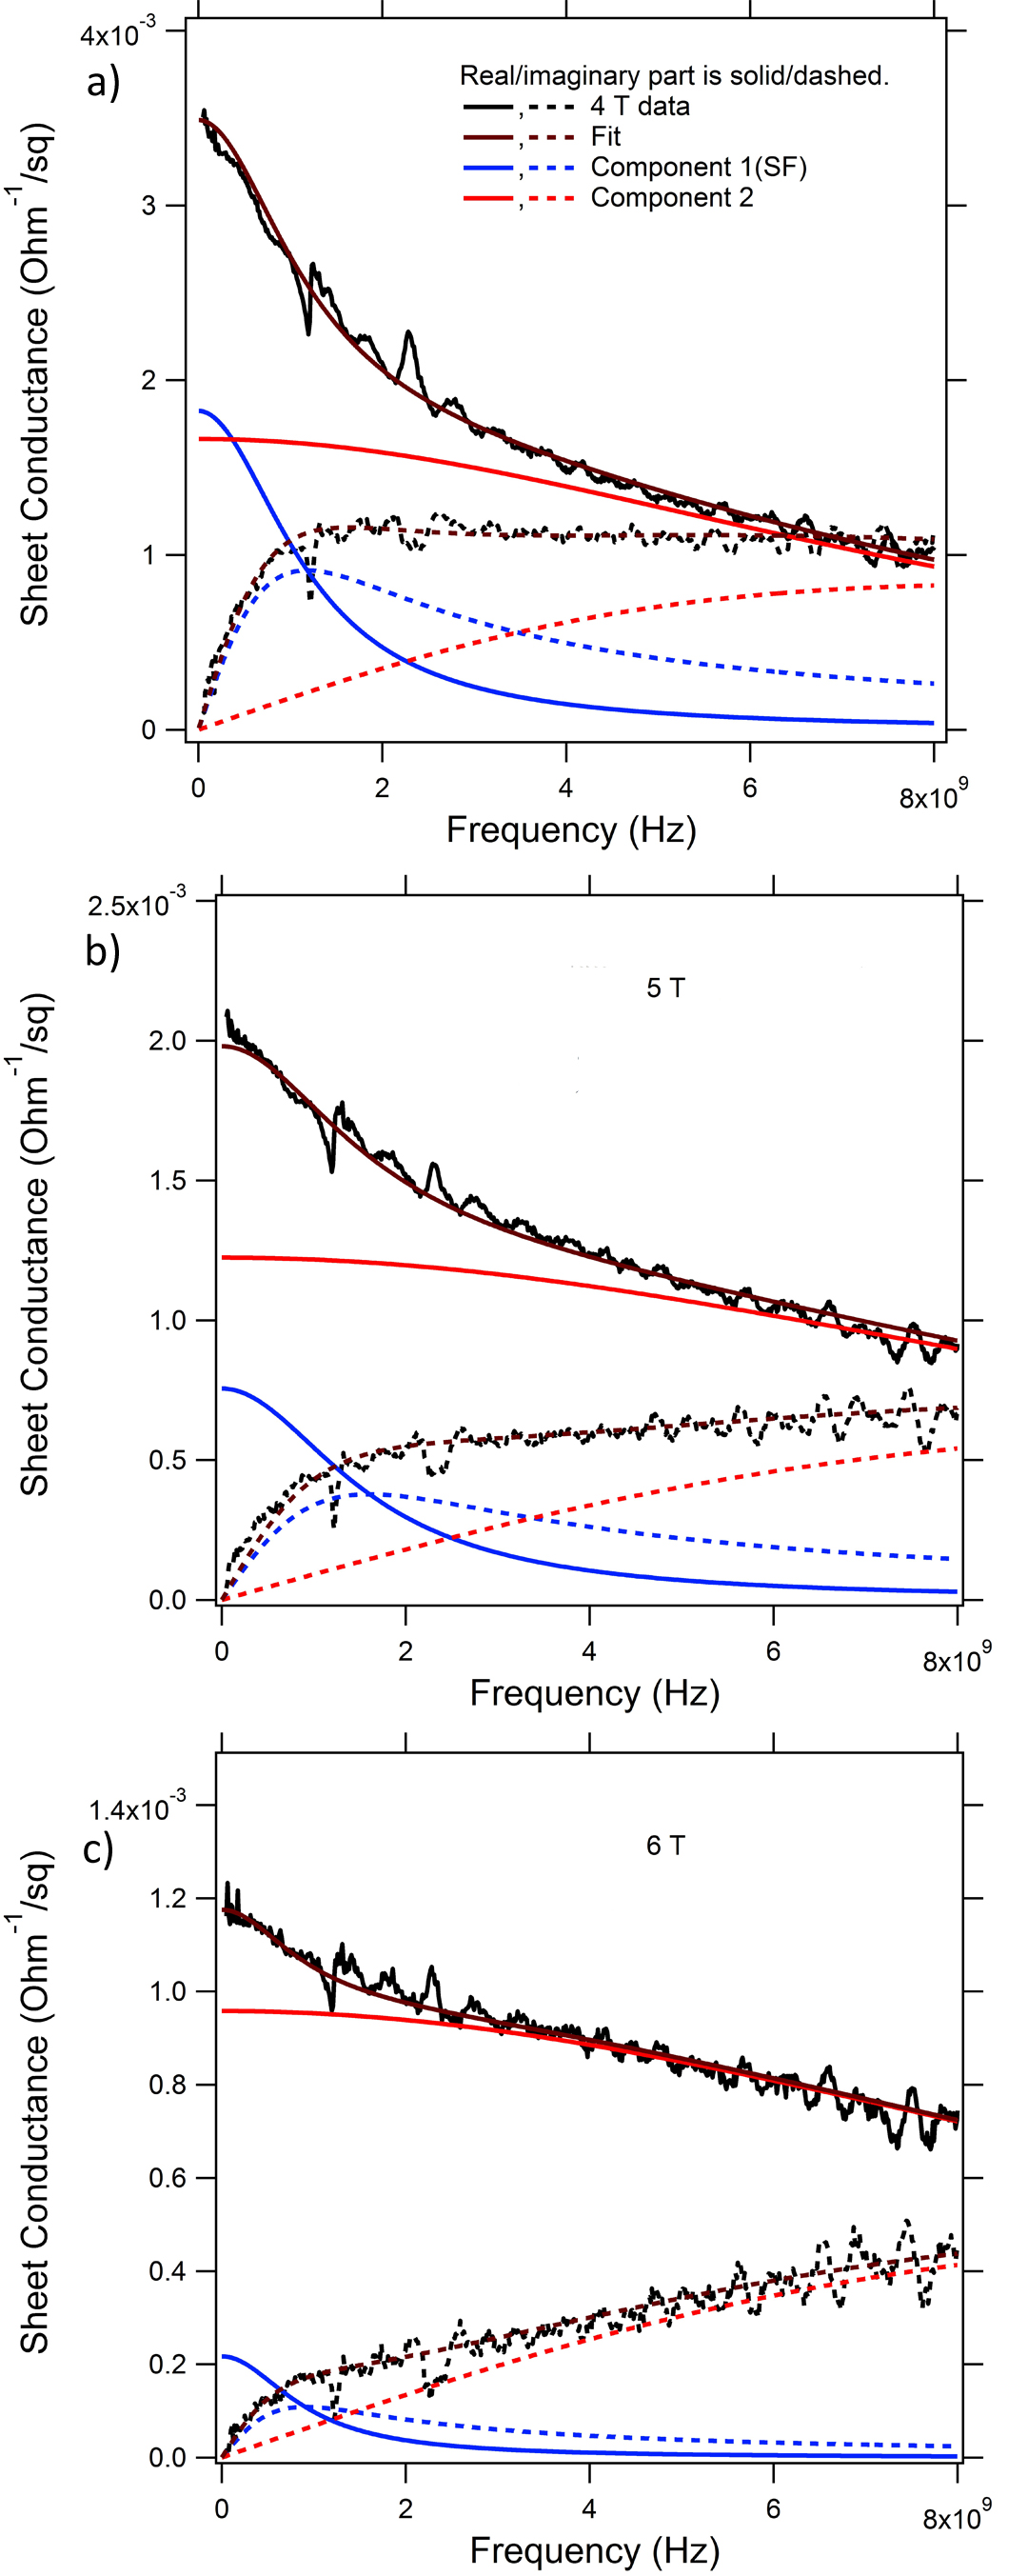
The spectra can in principle be fit to a combination of three phenomenologically assigned terms: a zero frequency delta function, a finite width peak centered at zero frequency that is characteristic of the anomalous metal, and a broader background (See SI for a decomposition). In the fits these contributions are modeled as classical Lorentzians fit . Fig. S2 shows the fitting at 6 characteristic fields. In the superconducting state (Figs. S2(a)-(c)), the imaginary conductance exhibits a diverging trend as frequency goes to zero. This observation can be related to the existence of the delta function in the real conductance. For small, but finite field (say 0.8 T) the contribution of multiple features in the spectra is apparent. In the superconducting regime, we fit the spectra to the three terms and in the anomalous metal, only two. In the superconducting state, the presence of very small, but still finite width to the “delta” function contribution (say due to finite temperature) does not effect these fits as any width is below the low frequency end of the spectrometer and indistinguishable from a delta function. In the anomalous metal, the delta function is obviously absent and the imaginary part extrapolates to zero at zero frequency. However, the conductance has non-Drude lineshape, as demonstrated in Fig. S2(e) for 4 T where the imaginary part is almost flat from 1 GHz to 8 GHz. This data fits well with a Drude term of the width of 8 GHz and a much narrower term ( 1 GHz wide) which compensates the imaginary part at higher frequencies. In the metallic regime, it is not clear if one should interpret the spectra as truly the sum of two channels, or if the transport is single channel and the fits should be considered only phenomenological.
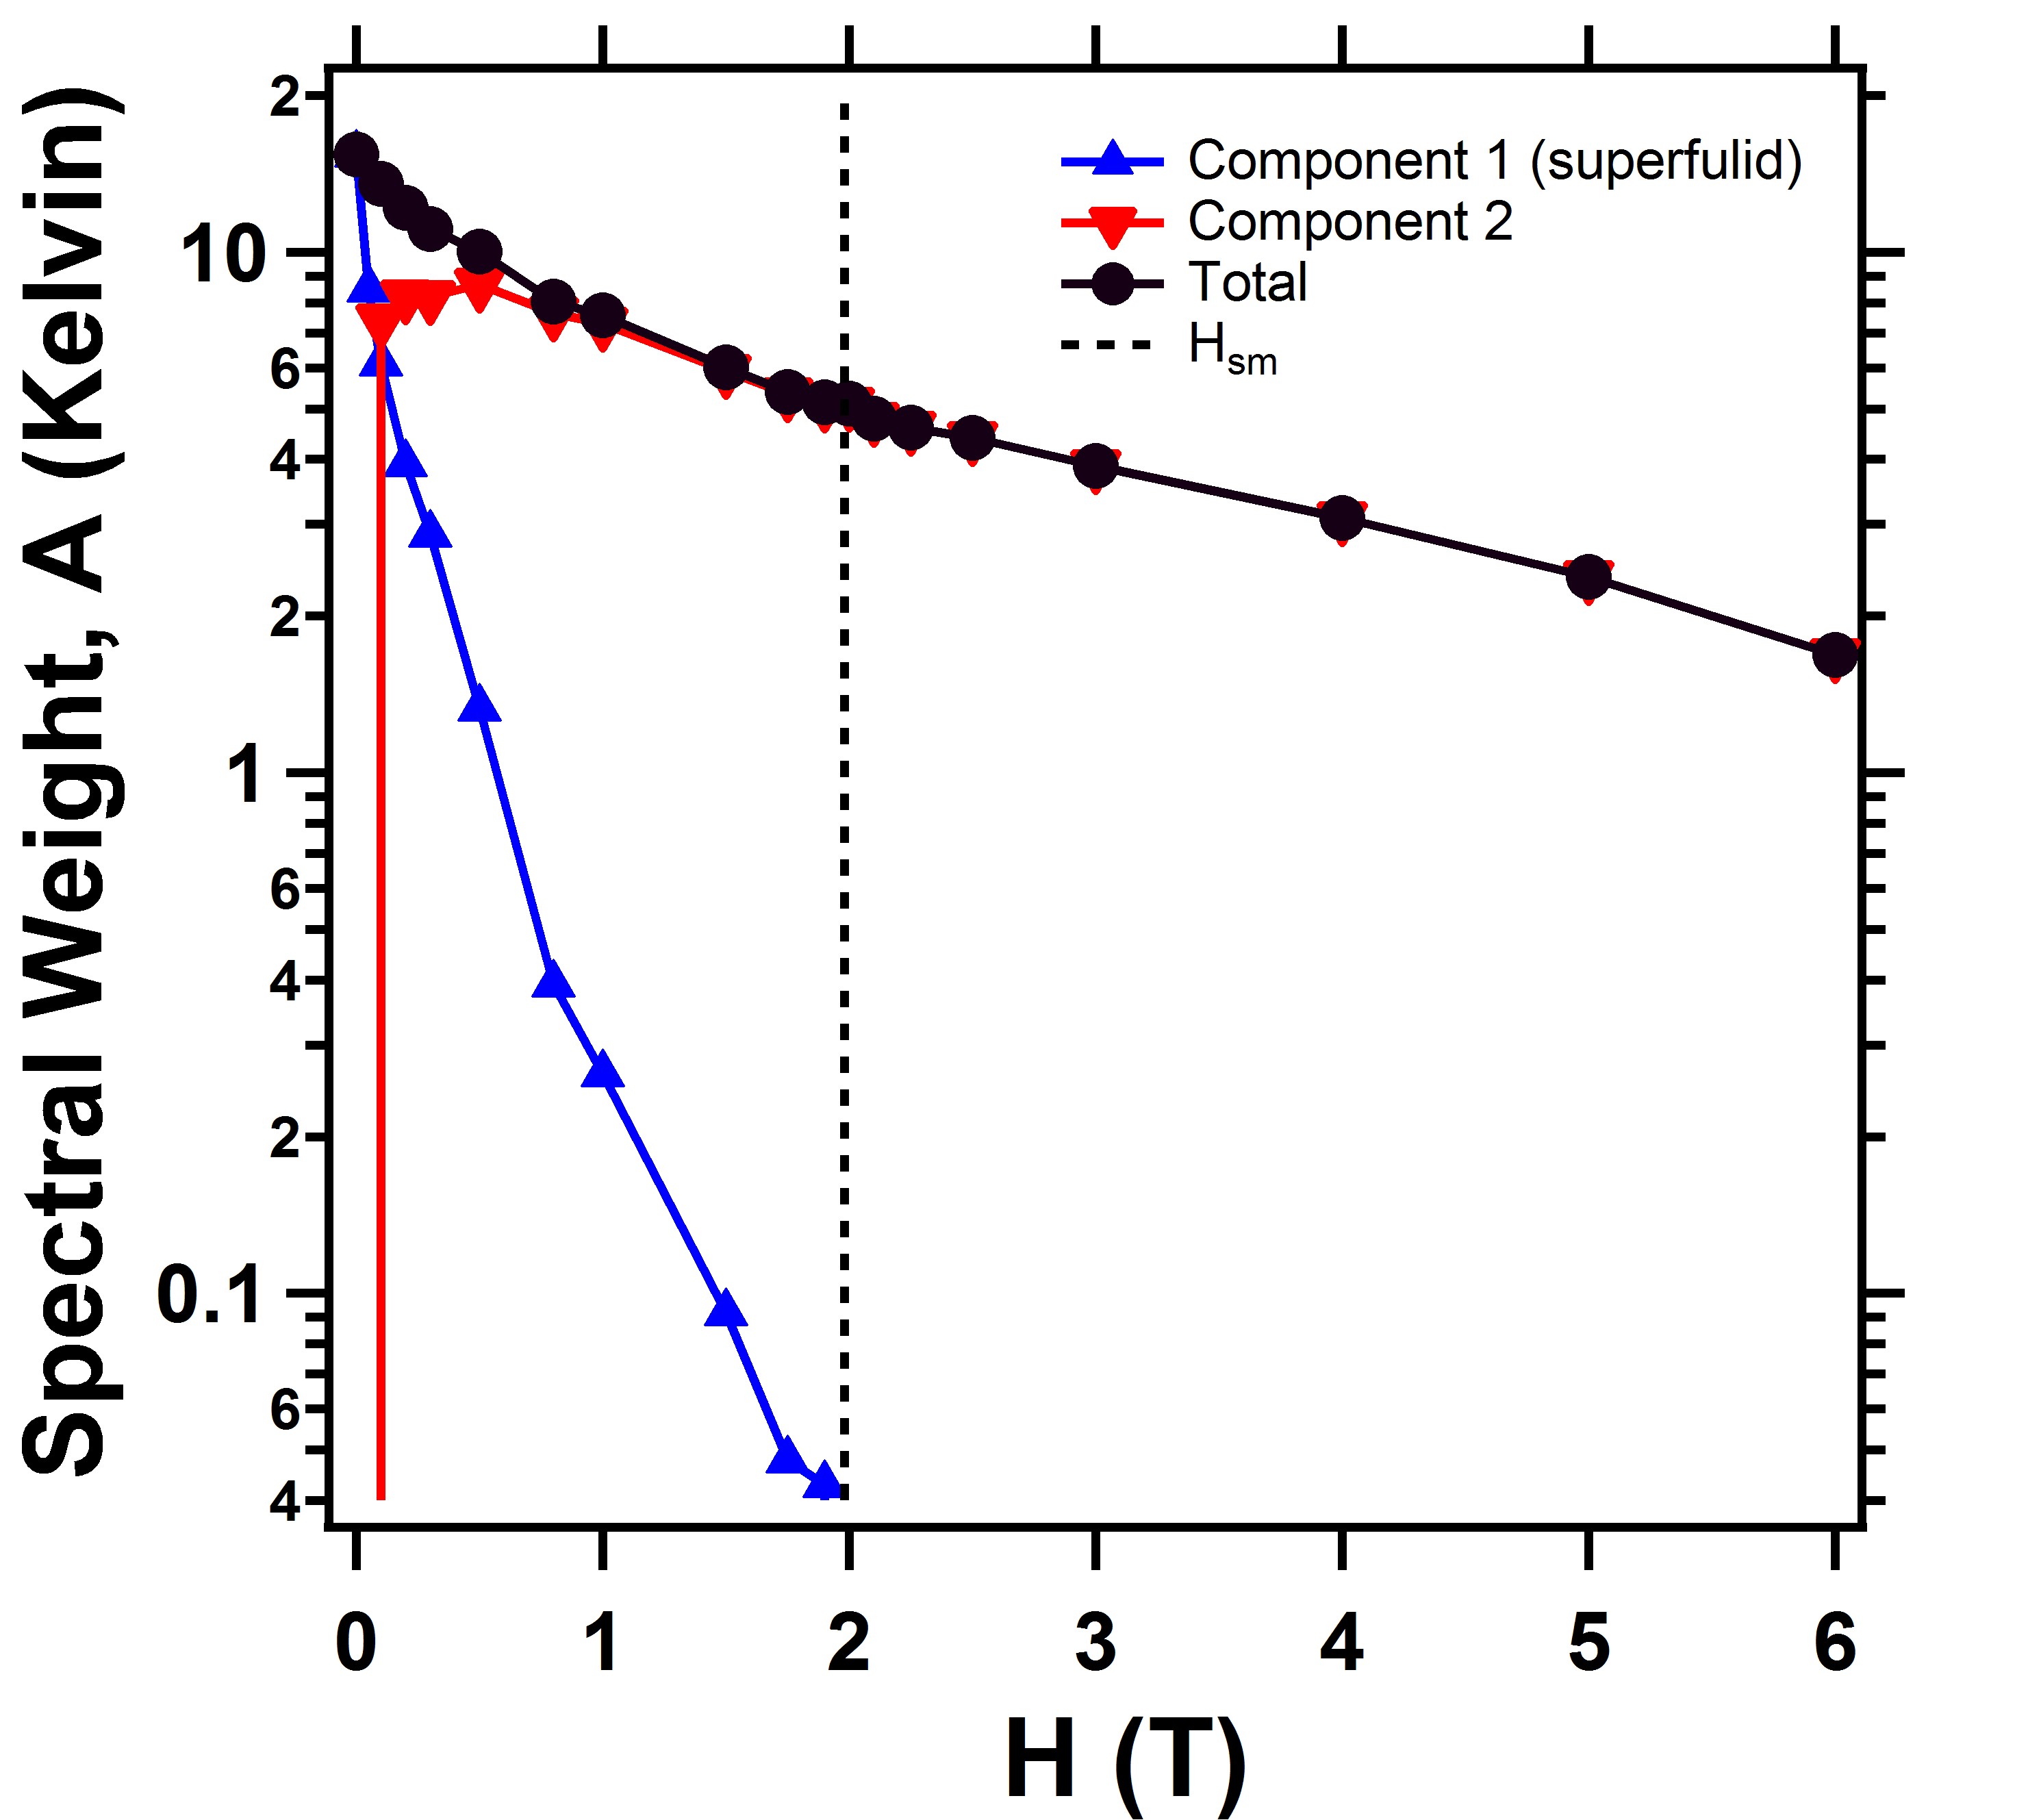
However, given these fits it is interesting to see how the spectral weight of the various features evolves as a function of field. In phase models, the spectral weight can be identified with a phase stiffness (), which one finds by multiplying the plasma frequency (explained in the SI) squared by (with the quantum of conductance ) to get the stiffness in the units of degrees Kelvin. In Fig. S3, we plot the spectral weight of the delta function, the low frequency dissipative conductance, and the total as a function of field. The spectral weight of the low frequency dissipative conductance was obtained by integrating it up to 10 GHz.
With small applied field the spectral weight of the delta function falls extremely quickly with field. Although part of the spectral weight is transferred to the low frequency peak, the rest is not and presumably goes to energy scales of order the normal state scattering. By the time the metallic state is being approached near 2 T, the delta function spectral weight has been suppressed to very small values. The transition to anomalous metal state occurs by suppressing the delta function altogether and leaving behind the anomalous low frequency peak as the dominant conducting channel at low .
Our observation of no cyclotron resonance is consistent with recent transport experiments by Breznay and Kapitulnik on InOx and TaNx thin films Breznay and Kapitulnik (2017). They report that the Hall resistance of InOx is indistinguishable from zero upon entering the anomalous metal regime at 2.0 T and remains indistinguishable from zero up to a higher field scale that is still within the anomalous metal region. We speculate that in the two component decomposition of our spectra, the narrow low frequency component exhibits no Hall response and the crossover to a regime with Hall response occurs when broader feature (which we associate with the normal state) starts to dominate the spectrum. These results suggest that the anomalous metal state itself has a robust particle-hole symmetry. Previously it was suggested in Ref. Fisher (1991) that the SIT quantum critical point had a emergent particle-hole symmetry that ensured that the pseudo-Lorentz force was zero at the transition giving zero Hall effect and a vanishing cyclotron resonance. Working from the perspective that here the critical point of the SIT broadens into a phase, it appears that the anomalous metal exhibits a similar symmetry. We should point out that a particle-hole symmetry as such is not conventionally a property of superconductors themselves. In the flux-flow regime, superconductors show a Hall response Hagen et al. (1990); Nozières and Vinen (1966); Jing and Ong (1990) that depends on the details of the vortex damping. Even in the fluctuation regime above Tc particle-hole symmetry appears to be broken by terms that depend on the derivative of the density of states with energy Fukuyama et al. (1971); Breznay et al. (2012), giving the Aslamazov-Larkin superconducting fluctuation contribution a finite Hall effect. However, note that although a corresponding cyclotron resonance-like energy scale can be defined in such calculations, it is expected to be larger than the normal metal cyclotron resonance by a factor of Michaeli et al. (2012) and moreover does not necessarily result in a resonance Fin . Therefore the particle-hole symmetry encountered here requires further perspective. It would be interesting to consider older theories Das and Doniach (1999); Dalidovich and Phillips (2002); Galitski et al. (2005); Spivak et al. (2008) in the context of these newer experiments.

Our observations are in-part reminiscent of the phenomenology of composite fermions of half-filled Landau levels in 2D electron gasses. In such systems a cyclotron resonance mode is found that depends not on the applied magnetic field, but instead an effective magnetic field which is the physical applied field minus a Chern-Simons field Halperin (2004). The cyclotron resonance disappears at fields that correspond to even-denominator Landau level filling fractions Kukushkin et al. (2002), however the actual physical Hall effect remains finite. In contrast, in the present case the cyclotron resonance is absent over a range of fields and the Hall effect vanishes. Connection of the theory of composite fermions to the SIT quantum critical point and intervening metals have been recently made Mulligan and Raghu (2016). We point out in this regard that the density of charges at the transition is of order the number of vortices (see SI).
Recently, Davison et.al. employed a hydrodynamic approach and memory matrix formalism to calculate the dynamical conductivity of a phase fluctuating superconductor in the incoherent limit Davison et al. (2016). With strong time-reversal and parity symmetry breaking, the dynamical conductivity is allowed to have a supercyclotron resonance mode at . This mode is allowed if the vortex current has a downstream component with the supercurrent , other than a transverse component due to the superfluid Magnus force Nozières and Vinen (1966), i.e. for a single vortex with vorticity in S.I. unit. The downstream vortex current then generates an emergent transverse electric field that bends the path of supercurrent. Our data constrains to be less than 65 MHz, which implies that the downstream component is much smaller than the transverse component that dominates vortex dynamics.
In this work, we have investigated the low frequency dynamical conductivity of a thin superconducting film in vicinity of the superconductor to metal transition. Remarkably the system posses cyclotron resonance, which is a ubiquitous feature of high mobility metals composed of conventional electrons. Our observation taken with that the anomalous metal state has – over a range of fields – no Hall effect Breznay and Kapitulnik (2017) shows an emergent particle-hole symmetry. This was previously considered to be a property of the SIT quantum critical point, but here is exhibited over an entire intervening phase. The anomalous metal should be considered a unique state of matter, which cannot be understood in terms of the conventional theory of metals.
This work at JHU was supported by NSF DMR-1508645. Work at the Weizmann Institute was supported by the Israel Science Foundation(ISF Grant no. 751/13) and The United States-Israel Binational Science Foundation (BSF Grant no. 2012210). We would like to acknowledge A. Finkelstein, S. Hartnoll, A. Kapituilnik, S. Kivelson, M. Mulligan, S. Parameswaran, P. Phillips, and S. Raghu for helpful conversations.
References
- Jaeger et al. (1989) H. M. Jaeger, D. B. Haviland, B. G. Orr, and A. M. Goldman, Phys. Rev. B 40, 182 (1989).
- Yazdani and Kapitulnik (1995) A. Yazdani and A. Kapitulnik, Phys. Rev. Lett. 74, 3037 (1995).
- Ephron et al. (1996) D. Ephron, A. Yazdani, A. Kapitulnik, and M.R. Beasley, Phys. Rev. Lett. 76, 1529 (1996).
- Mason and Kapitulnik (1999) N. Mason and A. Kapitulnik, Phys. Rev. Lett. 82, 5341 (1999).
- Paalanen et al. (1992) M. A. Paalanen, A. F. Hebard, and R. R. Ruel, Phys. Rev. Lett. 69, 1604 (1992).
- Chervenak and Valles (2000) J. A. Chervenak and J. M. Valles, Phys. Rev. B 61, R9245 (2000).
- Lin et al. (2012) Y.-H. Lin, J.J. Nelson, and A. M. Goldman, Phys. Rev. Lett. 109, 017002 (2012).
- Liu et al. (2013) W. Liu, L.D. Pan, J. Wen, M. Kim, G. Sambandamurthy, and N. P. Armitage, Phys. Rev. Lett. 111, 067003 (2013).
- Van der Zant et al. (1992) H.S.J. van der Zant, F.C. Fritschy, W.J. Elion, L.J. Geerligs, and J.E. Mooij, Phys. Rev. Lett. 69, 2971 (1992).
- Han et al. (2014) Z. Han, A. Allain, H. Arjmandi-Tash, K. Tikhonov, M. Feigel’Man, B. Sacépé, and V. Bouchiat, Nature Physics 10, 380 (2014).
- Eley et al. (2012) S. Eley, S. Gopalakrishnan, P. M. Goldbart, and N. Mason, Nature Physics 8, 59 (2012).
- Schneider et al. (2009) T. Schneider, A. D. Caviglia, S. Gariglio, N. Reyren, and J.-M. Triscone, Phys. Rev. B 79, 184502 (2009).
- Das and Doniach (1999) D. Das and S. Doniach, Phys. Rev. B 60, 1261 (1999).
- Kapitulnik et al. (2001) A. Kapitulnik, N. Mason, S.A. Kivelson, and S. Chakravarty, Phys. Rev. B 63, 125322 (2001).
- Dalidovich and Phillips (2002) D. Dalidovich and P. Phillips, Phys. Rev. Lett. 89, 027001 (2002).
- Galitski et al. (2005) V.M. Galitski, G. Refael, M.P.A. Fisher, and T. Senthil, Phys. Rev. Lett. 95, 077002 (2005).
- Davison et al. (2016) R. A. Davison, L. V. Delacrétaz, B. Goutéraux, and S. A. Hartnoll, Phys. Rev. B 94, 054502 (2016).
- Mulligan and Raghu (2016) M. Mulligan and S. Raghu, Phys. Rev. B 93, 205116 (2016).
- Spivak et al. (2008) B. Spivak, P. Oreto, and S. A. Kivelson, Phys. Rev. B 77, 214523 (2008).
- Breznay and Kapitulnik (2017) N. P. Breznay and A. Kapitulnik, Science Advances 3, e1700612 (2017).
- (21) See Supplemental Material[url] for recent investiagtions of SIT, which includes Refs.[22-26]
- Sambandamurthy et al. (2005) G. Sambandamurthy, L. W. Engel, A. Johansson, E. Peled, and D. Shahar, Phys. Rev. Lett. 94, 017003 (2005).
- Sambandamurthy et al. (2006) G. Sambandamurthy, A. Johansson, E. Peled, D. Shahar, P. Björnsson, and K. Moler, EPL 75, 611 (2006).
- Steiner and Kapitulnik (2005) M. Steiner and A. Kapitulnik, Physica C 422, 16 (2005).
- Crane et al. (2007b) R. W. Crane, N. P. Armitage, A. Johansson, G. Sambandamurthy, D. Shahar, and G. Grüner, Phys. Rev. B 75, 094506 (2007b).
- Gantmakher and Golubkov (2001) V. Gantmakher and M. Golubkov, JETP Lett. 73, 131 (2001).
- Fisher (1991) M. P. Fisher, Physica A: Statistical Mechanics and its Applications 177, 553 (1991).
- (28) See Supplemental Material[url]for the lack of reentrance behavior, which indicates the film is not grannular. This includes Refs.[29-30]
- Sambandamurthy et al. (2004) G. Sambandamurthy, L. W. Engel, A. Johansson, and D. Shahar, Phys. Rev. Lett. 92, 107005 (2004).
- Crane et al. (2007a) R. Crane, N. P. Armitage, A. Johansson, G. Sambandamurthy, D. Shahar, and G. Grüner, Phys. Rev. B 75, 184530 (2007a).
- (31) See Supplemental Material[url] for details about this technique and calibration procedures, which includes Refs.[8] and [32-39]
- Liu et al. (2011) W. Liu, M. Kim, G. Sambandamurthy, and N. Armitage, Phys. Rev. B 84, 024511 (2011).
- Scheffler and Dressel (2005) M. Scheffler and M. Dressel, Review of scientific instruments 76, 074702 (2005).
- Liu et al. (2014) W. Liu, L. Pan, and N. Armitage, Review of Scientific Instruments 85, 093108 (2014).
- Booth et al. (1996) J. C. Booth, D. H. Wu, S. B. Qadri, E. F. Skelton, M. S. Osofsky, A. Piqué, and S. M. Anlage, Phys. Rev. Lett. 77, 4438 (1996).
- Lee and Stutzmann (2001) M. Lee and M. L. Stutzmann, Phys. Rev. Lett. 87, 056402 (2001).
- Ohashi et al. (2009) T. Ohashi, H. Kitano, I. Tsukada, and A. Maeda, Phys. Rev. B 79, 184507 (2009).
- Scheffler (2004) M. Scheffler, Broadband microwave spectroscopy on correlated electrons (PhD thesis, University of Stuttgart, 2004).
- Liu (2013) W. Liu, Broadband microwave measurements of two dimensional quantum matter (PhD thesis, The Johns Hopkins University, 2013).
- Kohn (1961) W. Kohn, Physical Review 123, 1242 (1961).
- Abstreiter et al. (1974) G. Abstreiter, P. Kneschaurek, J. Kotthaus, and J. Koch, Phys. Rev. Lett. 32, 104 (1974).
- Kennedy et al. (1975) T. Kennedy, R. Wagner, B. McCombe, and D. Tsui, Phys. Rev. Lett. 35, 1031 (1975).
- (43) See Supplemental Material[url] for fitting models and techniques, which includes Refs.[44-45]
- Dresselhaus et al. (1955) G. Dresselhaus, A. Kip, and C. Kittel, Physical Review 98, 368 (1955).
- Kuzmenko (2005) A. Kuzmenko, Review of scientific instruments 76, 083108 (2005).
- Hagen et al. (1990) S.J. Hagen, C.J. Lobb, R.L. Greene, M.G. Forrester, and J.H. Kang, Phys. Rev. B 41, 11630 (1990).
- Nozières and Vinen (1966) P. Nozières and W. Vinen, Philosophical Magazine 14, 667 (1966).
- Jing and Ong (1990) T.W. Jing and N.P. Ong, Phys. Rev. B 42, 10781 (1990).
- Fukuyama et al. (1971) H. Fukuyama, H. Ebisawa, and T. Tsuzuki, Progress of Theoretical Physics 46, 1028 (1971).
- Breznay et al. (2012) N. P. Breznay, K. Michaeli, K. S. Tikhonov, A. M. Finkel’stein, M. Tendulkar, and A. Kapitulnik, Phys. Rev. B 86, 014514 (2012).
- Michaeli et al. (2012) K. Michaeli, K. S. Tikhonov, and A. M. Finkel’stein, Phys. Rev. B 86, 014515 (2012).
- (52) A. Finkelstein, private communication (2018).
- Halperin (2004) B. Halperin, Perspectives in Quantum Hall Effects: Novel Quantum Liquids in Low-Dimensional Semiconductor Structures pp. 225–263 (2004).
- Kukushkin et al. (2002) I. Kukushkin, J. Smet, K. Von Klitzing, and W. Wegscheider, Nature 415, 409 (2002).
Absence of cyclotron resonance in the anomalous metallic phase in InOx
Youcheng Wang1, I. Tamir2, D. Shahar2, and N. P. Armitage1
1 Institute for Quantum Matter, Department of Physics and Astronomy, Johns Hopkins University, Baltimore, Maryland 21218, USA
2 Department of Condensed Matter Physics, Weizmann Institute of Science, Rehovot 76100, Israel
I Methods
Broadband microwave experiments were performed in a home-built Corbino microwave spectrometer coupled into a He-3 cryostat Liu et al. (2011, 2013). Such a system can measure the complex conductance over a broad spectral range from 50 MHz to 10 GHz down to temperatures of 360 mK. Samples terminate a coaxial waveguide by being press fit into a custom Corbino shaped connection as described in Refs. Scheffler and Dressel (2005); Liu et al. (2014). To ensure a good electrical connection a Cr(10 nm)/Au(200 nm) metal layer in the shape of a “donut” pattern was evaporated onto silicon substrates in advance on InOx deposition. Then another Au(200 nm) layer using the same mask was added on top. We measure the complex reflectivity of the thin film using a network analyzer (see Supp. Fig. S1), from which complex sheet impedance and conductance can be obtained. Two terminal DC resistance can be simultaneously measured a bias tee. The DC resistance without microwave illumination was used to carefully check and correct for any microwave induced heating. To calibrate the system (particularly for low fields) and remove the effects of loss and extraneous reflections in the transmission line a multi-step calibration procedure was followed. First, three calibration samples with known reflection coefficients were measured (short, open and load) Booth et al. (1996); Lee and Stutzmann (2001); Scheffler and Dressel (2005); Ohashi et al. (2009); Liu et al. (2011, 2013). Calibrations were performed at 0, 0.5, 2, 4, 6, and 7.5 T and interpolated in between unless otherwise specified. Next, we “recalibrate”, by first assuming at 0 T the sample’s imaginary impedance is ideal given by a linear fit to the initially calibrated imaginary part of the impedance and then using the 0 T superconductor as a new short calibration. This procedure allows us to get accurate conductance data even deep into the superconducting state when the sample’s is much less that 50 . After performing a small further correction due to the effects of the substrate, (see SI Sec. II) the complex conductance of the InOx film can be isolated at all relevant fields and temperatures.
High-purity (99.999 %) In2O3 was e-gun evaporated in high vacuum environment onto clean high-resistivity Si substrates quenched at room temperatures. The thickness was monitored in-situ by a quartz crystal resonator to approximately 30 nm. TEM-diffraction patterns of InOx films prepared in the same fashion show diffusion rings with no diffraction spots. The lack of the reentrant behavior in versus curvesSambandamurthy et al. (2004); Crane et al. (2007a) further support that the films are morphologically homogeneous. InOx has been used extensively recently in investigations of the superconductor-insulator transition (SIT)Sambandamurthy et al. (2004, 2005, 2006); Steiner and Kapitulnik (2005); Crane et al. (2007b); Gantmakher and Golubkov (2001) and our samples show behavior in broad agreement with previous work.
II Calibrations
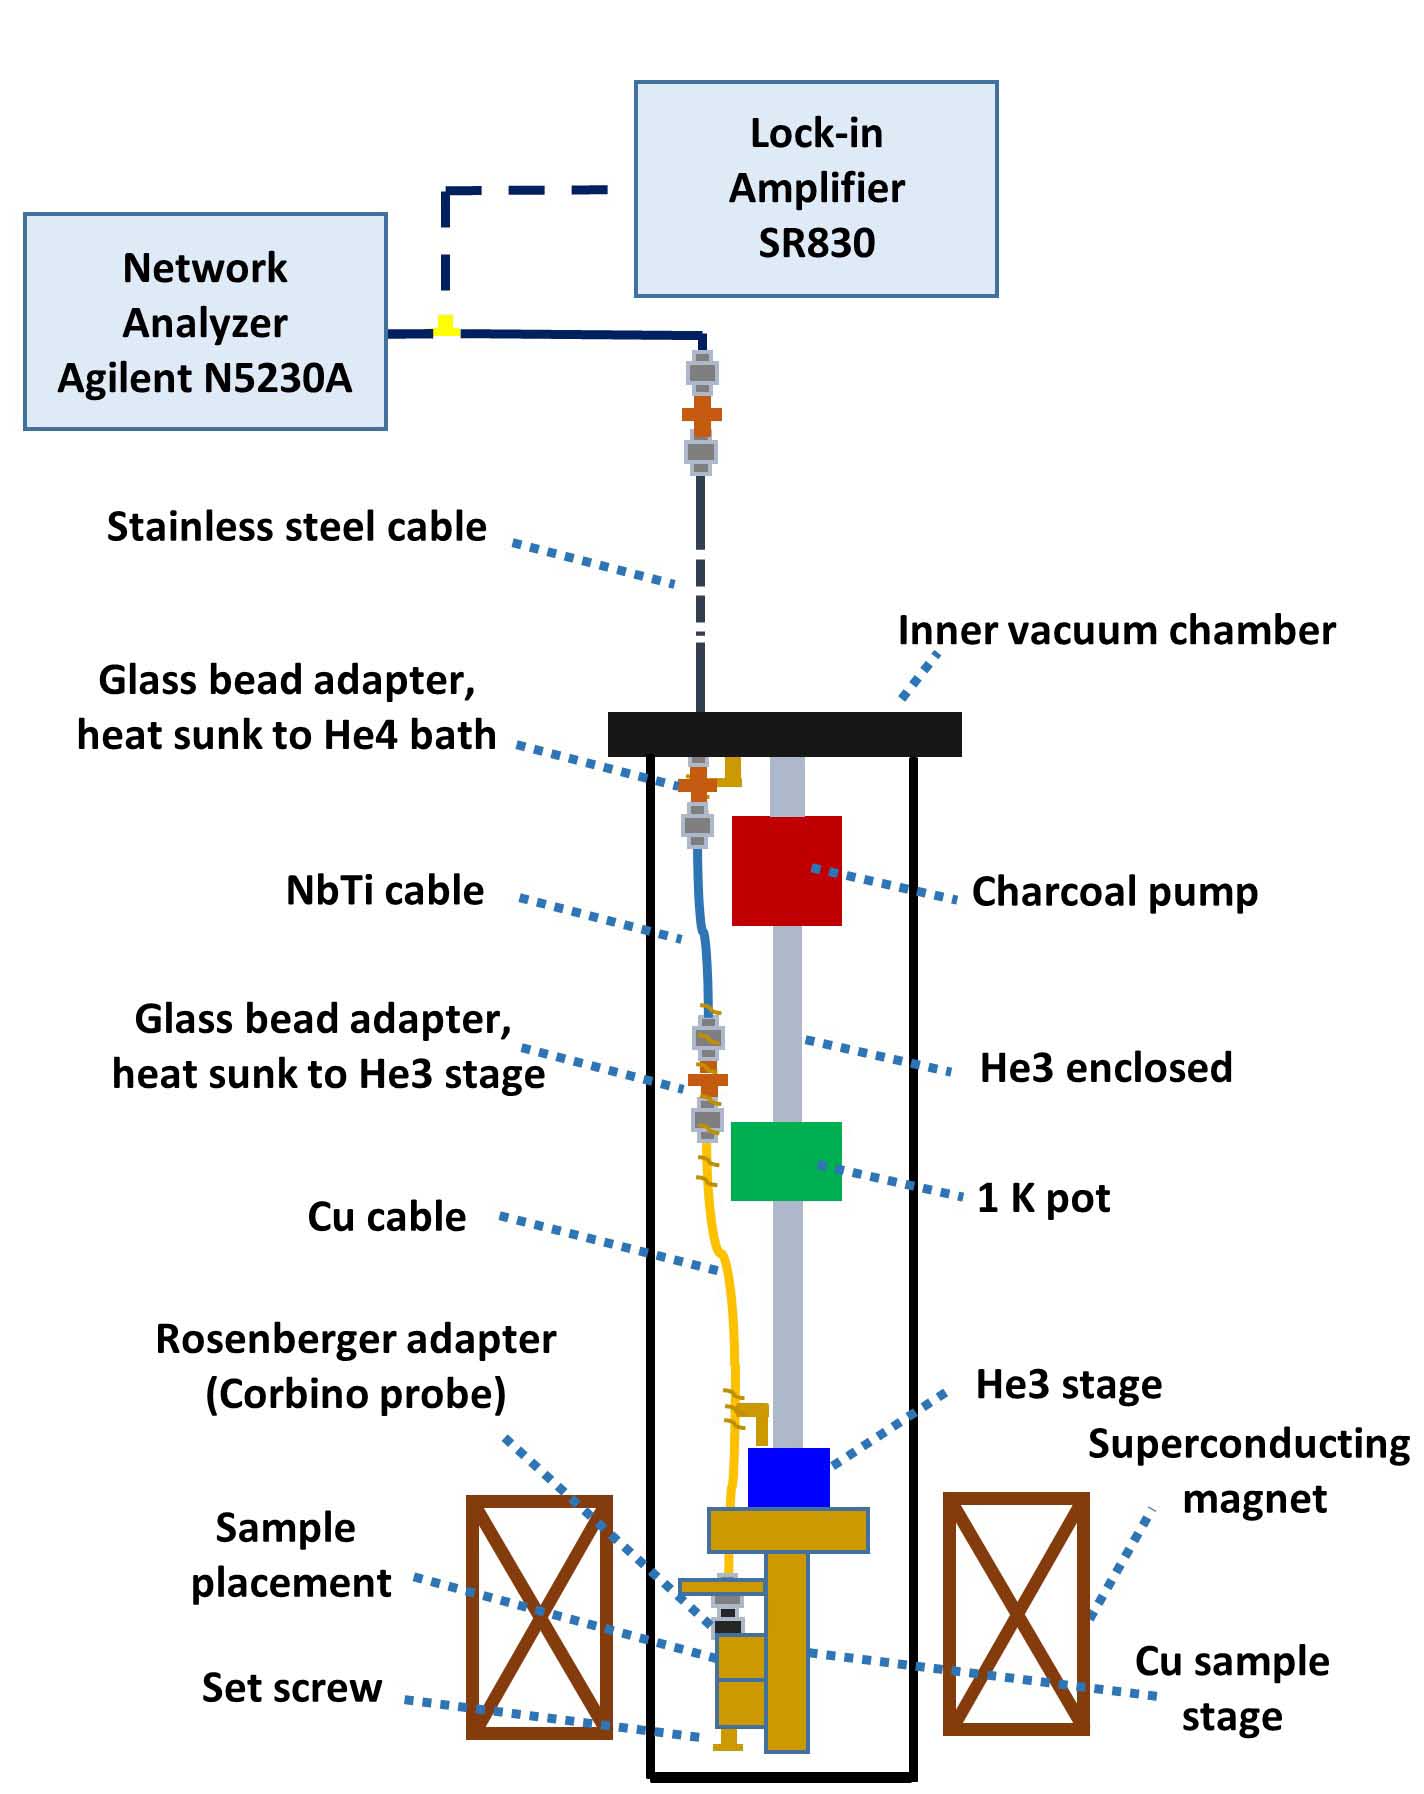
Our home-built broadband microwave “Corbino” spectrometer (Fig.S1) uses a network analyzer to directly measure the complex reflection coefficient from a coaxial transmission line that is terminated by the sample. To obtain the actual reflection coefficient from the sample surface itself, one needs to know three complex error coefficients Scheffler (2004) , , and , obtained from measurements on three calibration standards the response of which we presumably know , namely a short (), an open (), and a load (). is the intrinsic impedance of coax cable which is 50 for our experiment and is the impedance of load. Then given the measured reflection coefficient from the sample , the actual reflection from the sample surface is Liu et al. (2014); Liu (2013):
| (1) |
By impedance matching, the effective sheet impedance of a sample surface follows from the measured reflection coefficient
| (2) |
where is the geometric factor for the Corbino measurements. For our sample, the outer and inner radius of the Corbino doughnut is 2.3 mm and 0.7 mm respectively and is defined by the mask used when evaporating contacts. Assuming that the substrate impedance of the thin film sample is , then the sample impedance and measured effective impedance are related by
| (3) |
Hence a substrate correction (which will be elaborated on below) is necessary if is comparable to . In the thin film approximation, where is complex conductivity. See Ref. Liu (2013); Liu et al. (2011); Booth et al. (1996) for more details.
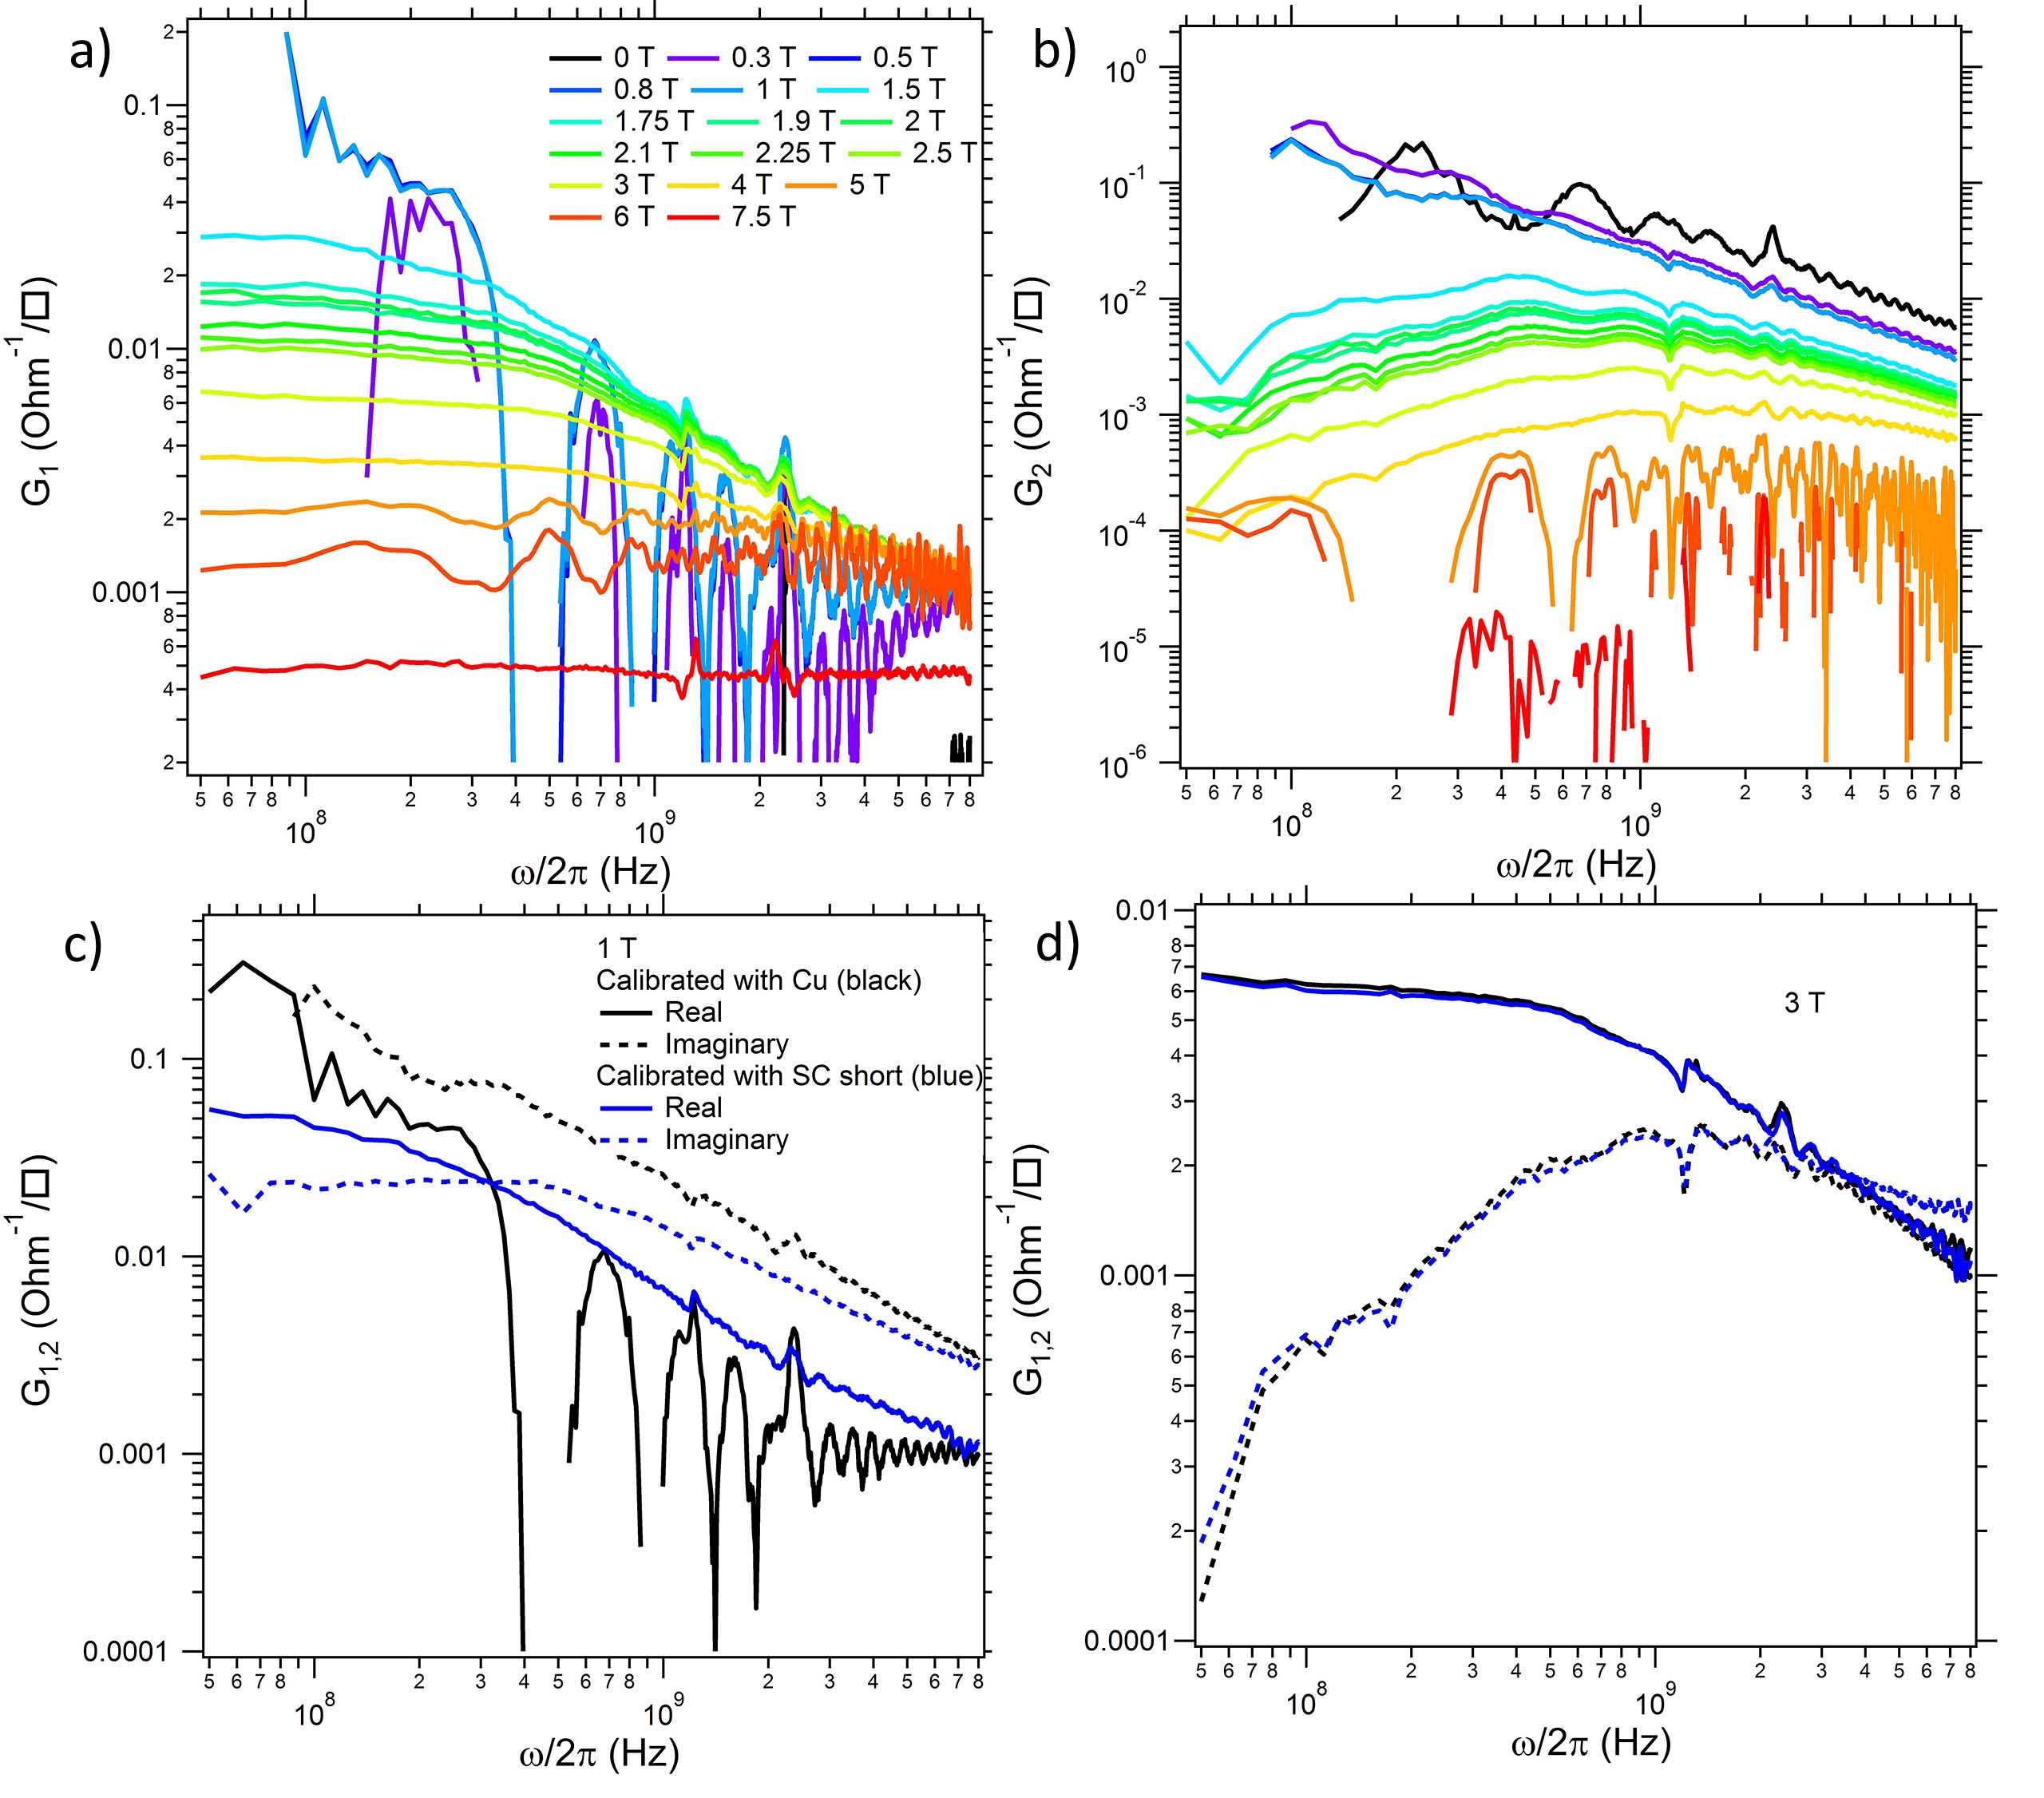
As discussed in the main text, a modified calibration procedure from our previous works Liu et al. (2014); Liu (2013) was used to increase the range of sample impedances that could be measured. This was particularly useful to extend the range of measurements to very low fields where sample impedances are very low. Here we compare our previous scheme of calibrations to the present scheme. One can see that substantial improvements are made.
In the conventional calibration, we used a bulk slab of Cu as the short, a bare intrinsic Si ( 10,000 ) wafer as an open, and a 20 nm NiCr film evaporated on Si as a load (impedance of 37 ), to calibrate sample response at each frequency/temperature/magnetic field. All standards were measured at 0 T, 0.5 T, 2 T, 4 T, 6 T, and 7.5 T. The sample response at other fields were calibrated with error coefficients linearly interpolated between the measured set of fields.
The sample response in the normal state (at 6 K) was used to obtain the substrate impedance. Since the normal state scattering rate of the sample far exceeds the high frequency limit of our experiment (10 GHz), we assume that at 6 K is purely real, and the real part of impedance is equal to DC resistance. The substrate impedance was calculated from Eq. 3 accordingly. We assumed that substrate impedance has little temperature dependence in the temperature range of 0.4 to 6 K considering the substrate is intrinsic silicon. The effective conductance following from this procedure is presented in Supp. Fig. S2(a) and (b). Comparing it with the data displayed in the main text that used an additional step of calibration (discussed below), one finds that the conductance is much noisier (particularly at low fields) with a number of obvious artifacts.
As discussed in the main text, we can improve the calibration procedure by making an assumption that the sample at zero field and low temperature has the response of an ideal conductor and use it as a short. After initial calibration using the copper standard, we fit the extracted quantity to a constant (see Eq.2 in the main text) and assumed that that the imaginary part of of the short standard is given by it. As noted in the main text, the assumption that the imaginary part is is reasonable because after this calibration procedure, the real part conductance at 50 MHz is by 4 orders of magnitude smaller than that of imaginary part, showing self-consistency. In principle, one could perturb around this simple assumption and might be able to obtain a more consistent response but obviously the correction would be very small. After this step of further calibration, the substrate correction was performed as described above.
After the “recalibration” the data is of much higher quality. Two representative fields below and above are shown in Supp. Fig. S2(c) and (d) to show the difference between using Cu as the short standard, and the sample at zero field as the short. For low fields where the impedance is low, the recalibration procedure significantly improves the data. At higher fields, where the impedance is higher the improvement is minimal.
III Field Dependence of Resistance
The field dependence of resistance at base temperature during a sweep-up is shown in Supp. Fig. S3.
IV Real Conductance on Linear Scale
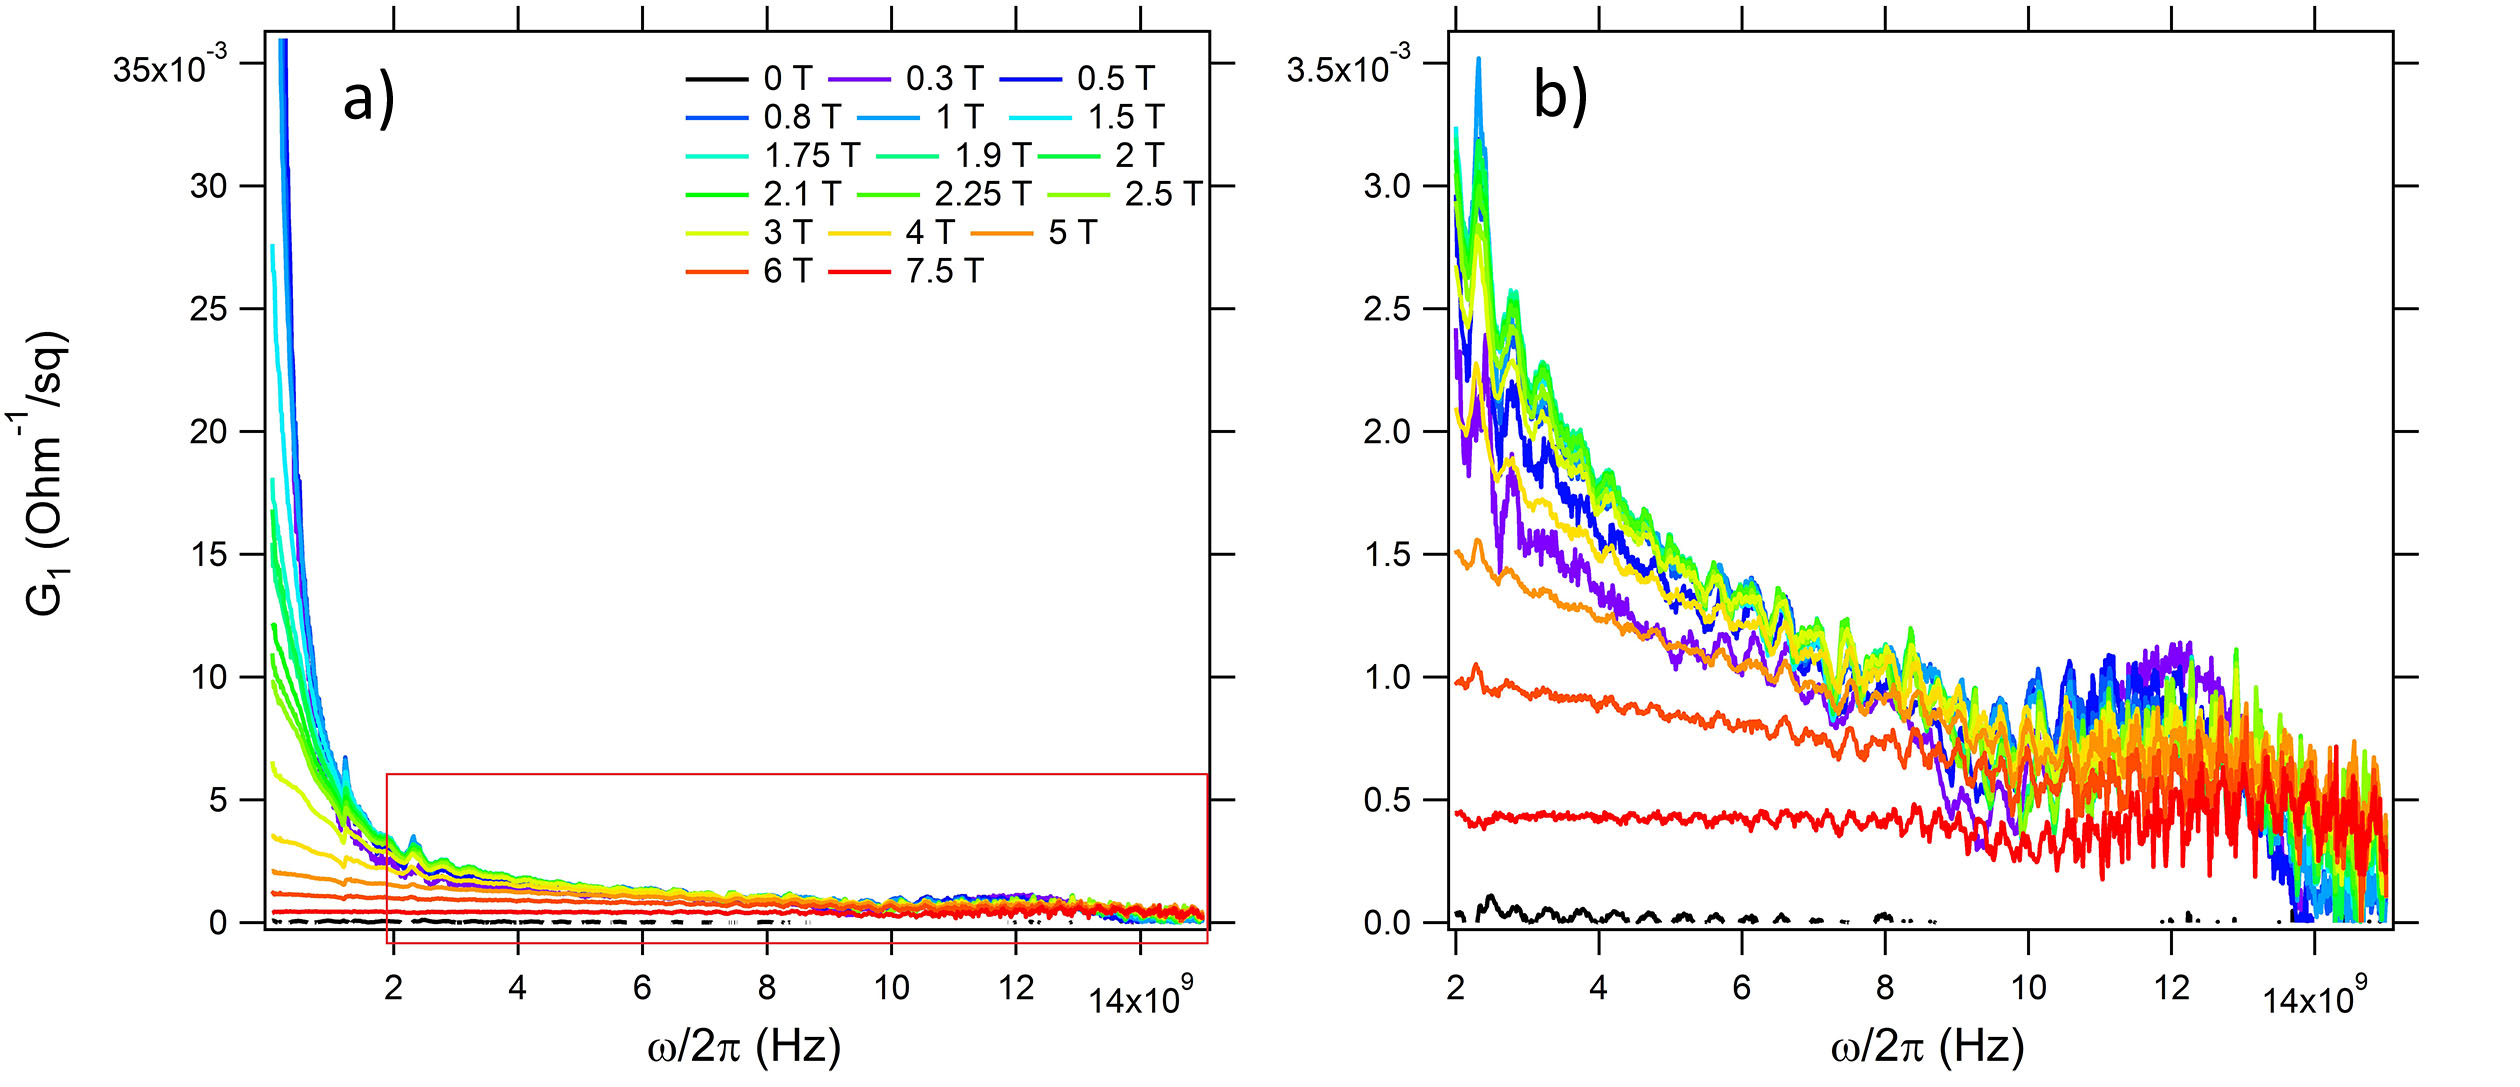
Here we show (Supp. Fig. S4) on linear scale, as a supplement to Fig. 3 in the main text of the paper. Supp. Fig. S4(b) is an expanded view of the area marked by a red rectangle in Supp. Fig. S4(a). One can find that for fields 1.5 - 4 T, the spectra almost fell on top of each other at high frequency showing that the changes to the spectra with applied field are mostly a low frequency phenomenon. The glitch at around 12 GHz comes from a significant standing wave resonance in the transmission line that could not be fully removed by calibration and exists for all samples we have measured.
V Fitting Models and Parameters
Since the data is presented as sheet conductance, equations in this section are expressed in terms of conductance .
V.1 Semi-classical Cyclotron Resonance
Here we demonstrate the model with which we use to check the existence of cyclotron resonance and estimate the magnitude of resonance frequency. Conductance is expressed as the sum of a Drude transport term plus a semi-classical cyclotron resonance term Dresselhaus et al. (1955).
| (4) |
| (5) |
| (6) |
In this model we have five real-valued parameters, which is the DC conductance of the Drude transport term, which is its momentum relaxation time, which is the DC conductance of cyclotron resonance term, which is its relaxation time, and the resonance frequency.
V.2 Supercyclotron Resonance
Davison et al. derived an expression for a “supercyclotron” resonance that could originate in the hydrodynamic theory of a quantum fluctuating superconductor Davison et al. (2016). Here one can expect that one may express the conductance as a sum of a Drude transport term plus this additional term e.g.
| (7) |
with
| (8) |
| (9) |
Here , , , , , and are real and independent quantities. The frequency dependence of the corresponds to a hydrodynamic supercyclotron mode that oscillates at with decay rate , i.e. Davison et al. (2016). Although the physical meaning of the coefficients is different, not that the functional form given for the supercyclotron mode is the same as that for classical cyclotron resonance.
V.3 Fitting Models for Fig. 2 in the Main Text
The conductance can be fit with three terms in the superconducting phase: a delta function, a narrow Drude term to capture long-lived degrees of freedom associated with supercurrent relaxation, and a much wider Drude term that may account for a “normal” contribution. The latter two terms remain in the anomalous metal phase. The full expressions are
| (10) |
| (11) |
| (12) |
| (13) |
In the above equations, plasma frequency is introduced as a fitting parameter and is defined as in a Drude model. High frequency dielectric constant in the third term accounts for interband absorptions. In practice, this fitting is done with Reffit software Kuzmenko (2005), and the delta function term is added by setting the scattering rate to zero (see eq. 12). Since always tends to be smaller than 1 in the fitting, we fix its value to be 1. In our fitting, each point in the real and imaginary part is assigned equal weight in least squared fitting. For fields above 2 T, the DC conductance is given 10 times the weight than real and imaginary AC conductance.
| () | (Hz) | () | (Hz) | |
|---|---|---|---|---|
| 4 T | 2.159E6 | 1.183E9 | 1.506E7 | 9.051E9 |
| 5 T | 1.215E6 | 1.607E9 | 1.624E7 | 13.27E9 |
| 6 T | 1.973E5 | 9.083E8 | 1.338E7 | 13.96E9 |
Supp. Fig. S5 shows fitting of 4T, 5 T and 6 T data, where the two Drude contributions are plotted separately on the same graph. The fitting parameters of the Drude terms are (for convenience is presented instead of ) collected in Table. I. At 4 T, the magnitude of the two Drude terms are comparable in the zero frequency limit but their widths differ by almost an order of magnitude. Both terms are necessary to achieve a proper fit (particularly the imaginary part). Because the width of the ”red” component (presumably related with normal charges) is larger than the upper bound of our experimental detection, the width from its fitting might not be accurate and could be larger than 9 GHz. At 5 T, and 6 T, both terms drop in magnitude but the ”blue” component associated with relaxed superfluid becomes outnumbered by normal charges.
| () | () | (Hz) | () | (Hz) | |
|---|---|---|---|---|---|
| 0.2 T | 1.738007639E+07 | 1.903851280E+07 | 2.077537581E+08 | 1.873827056E+07 | 1.358669373E+10 |
| 0.3 T | 1.408368762E+07 | 1.903851244E+07 | 2.077537608E+08 | 1.873827288E+07 | 1.358669521E+10 |
VI Small Field Data and Fit
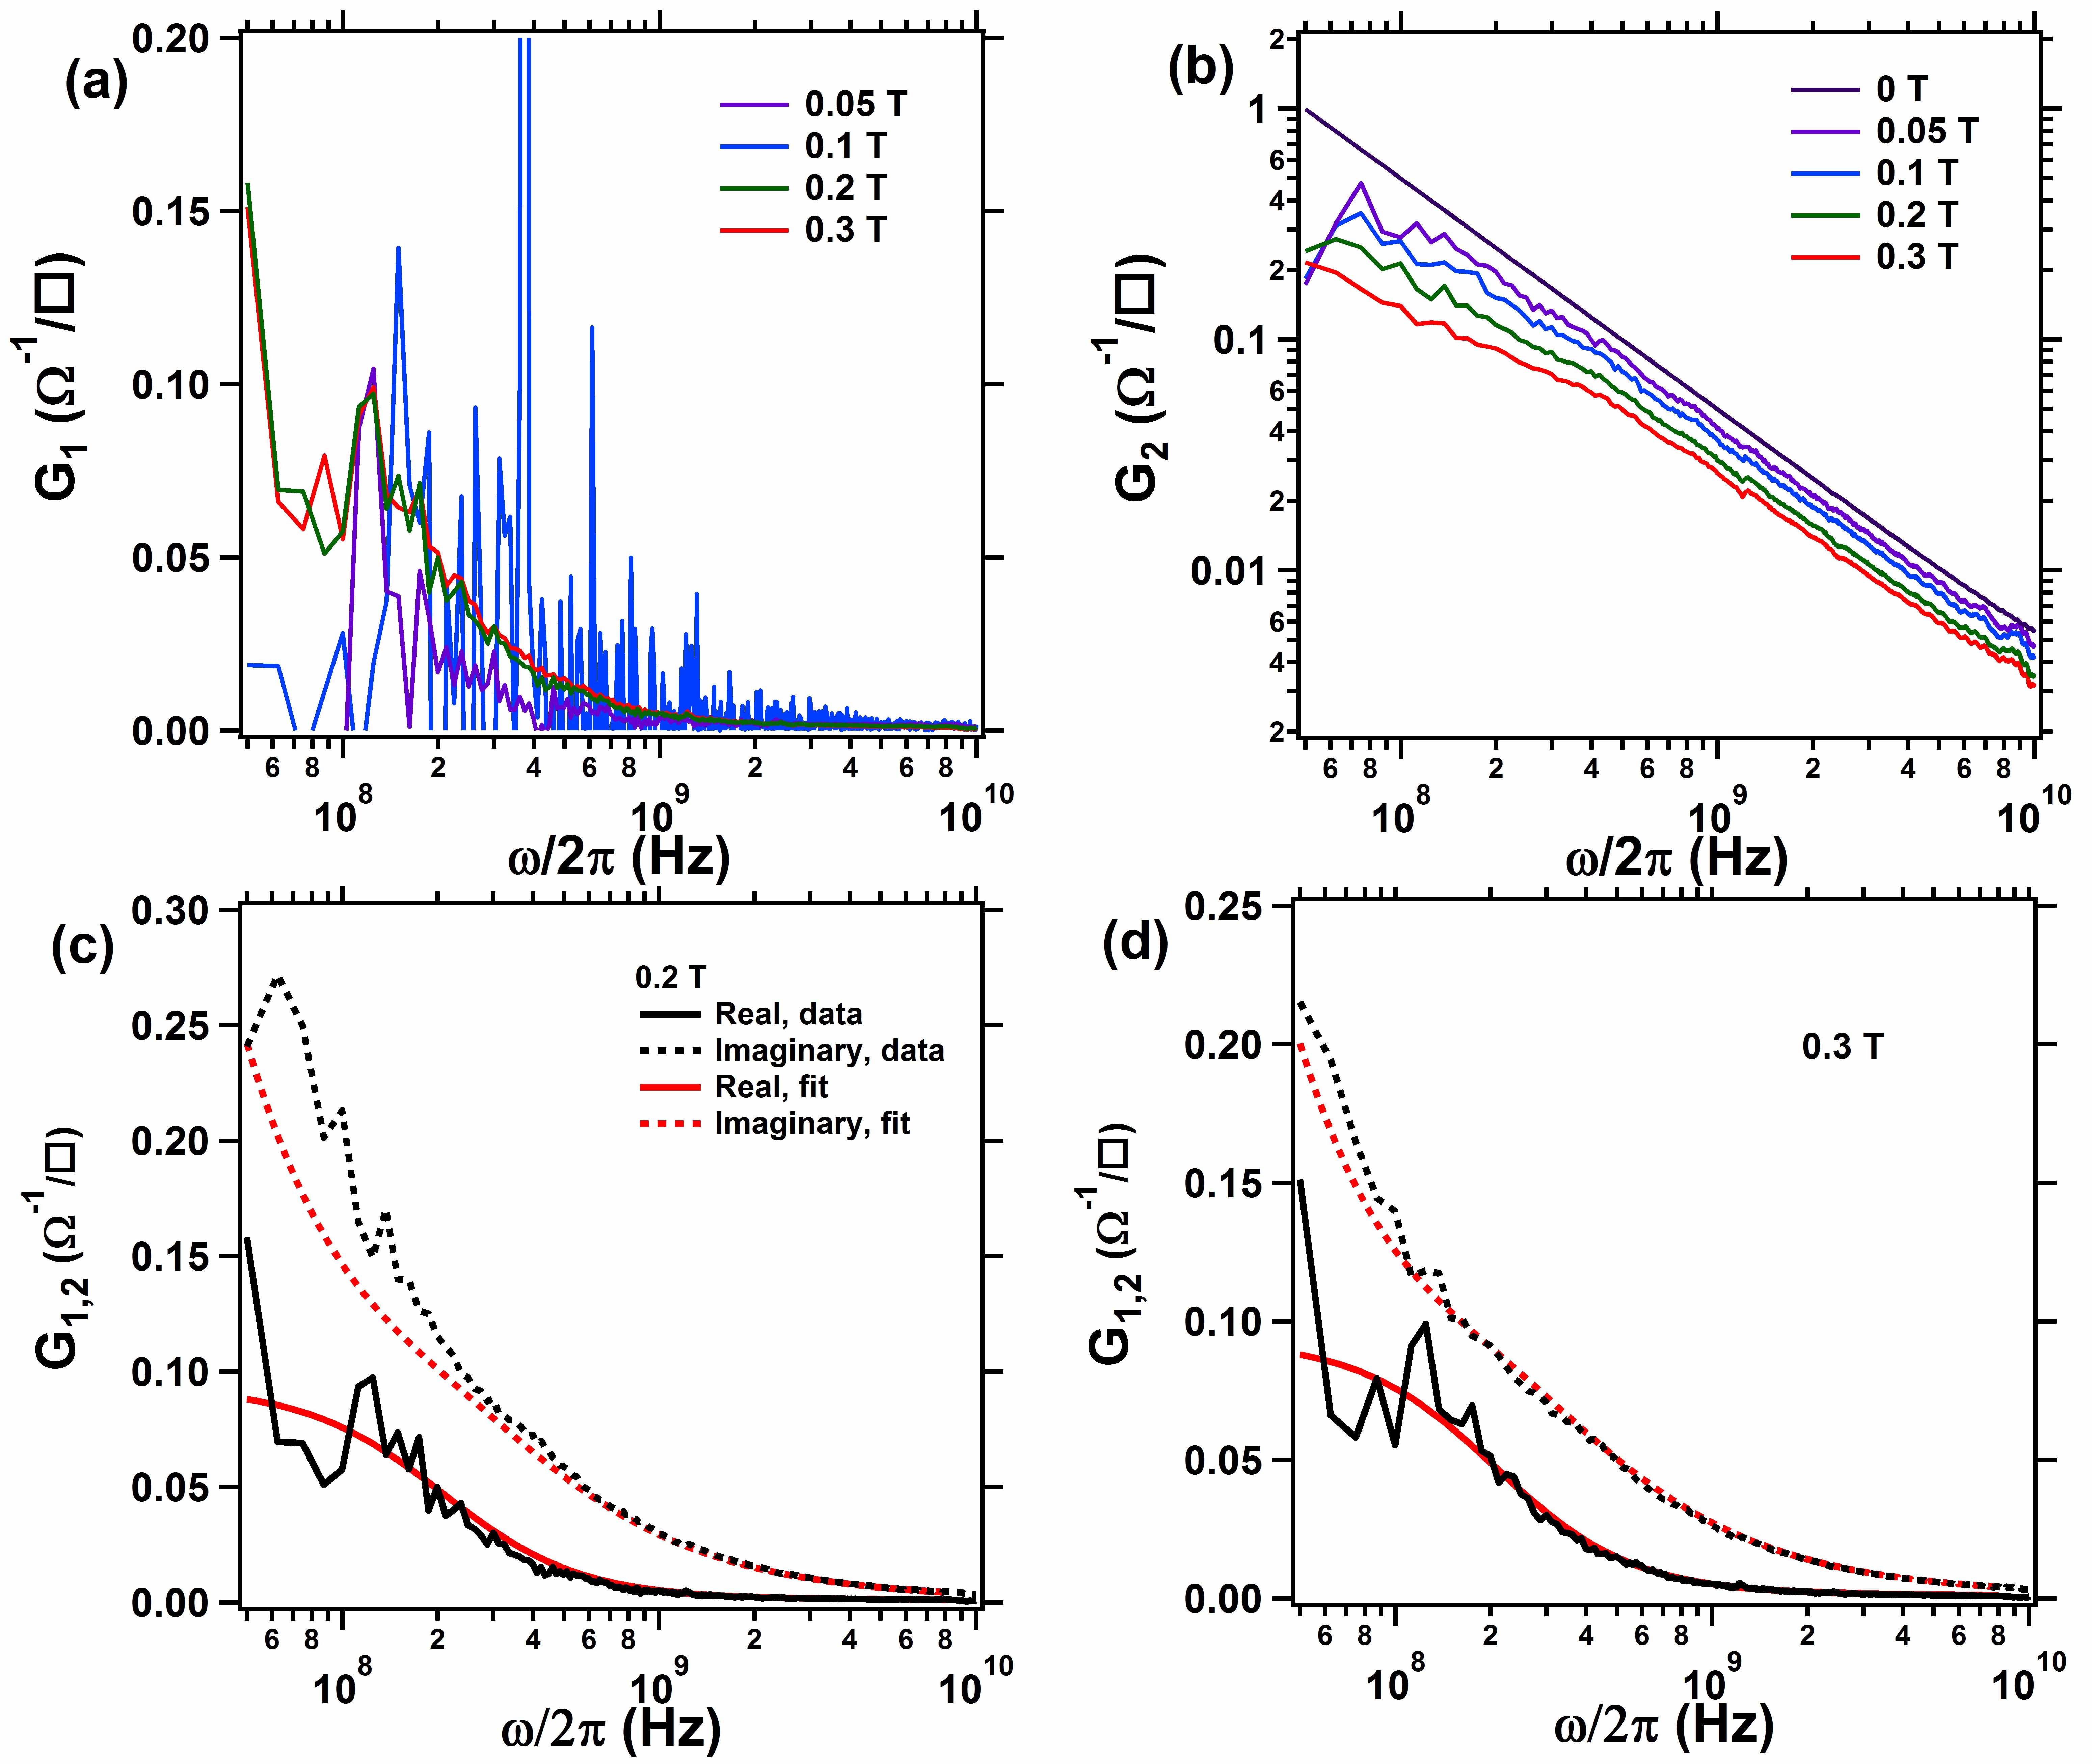
The conductance spectra below 0.3 T is presented in Supp. Fig. S6 to show that there is no cyclotron resonance-like signature in the entire range we measured. The Corbino spectroscopy technique becomes less sensitive for both highly conductive (compared with the intrinsic impedance of the coaxial cables which is 50 ) and highly insulating samplesScheffler, 2004. At small fields the real part of conductance at finite frequencies is very small and is difficult to measure accurately. For 0.05 T, the real part conductance data is very noisy and gave a negative spectral weight calculated from integrating experimental data to 10 GHz. Therefore we did not include 0.05 T data point for Component 2 and the total spectral weight. As one can see, there is no CR feature at all small fields. The imaginary part is less noisy and we could see that it follows the qualitative trend to decrease with increasing magnetic field. The small field data is consistent with our results and conclusions. Data were fit to models mentioned in Sec.1. The fitting parameters are presented in Table. II.
VII Spectral Weight on Log Scale
Supp. Fig. S7 shows the same data as in Fig. 3 of the paper but with the vertical axis on log scale. It can be clearly seen in this graph that the spectral weight of Drude terms diminish much more slowly than the delta function term that corresponds to condensed Cooper pairs.
VIII Estimate of Charge Carrier/Vortex Densities
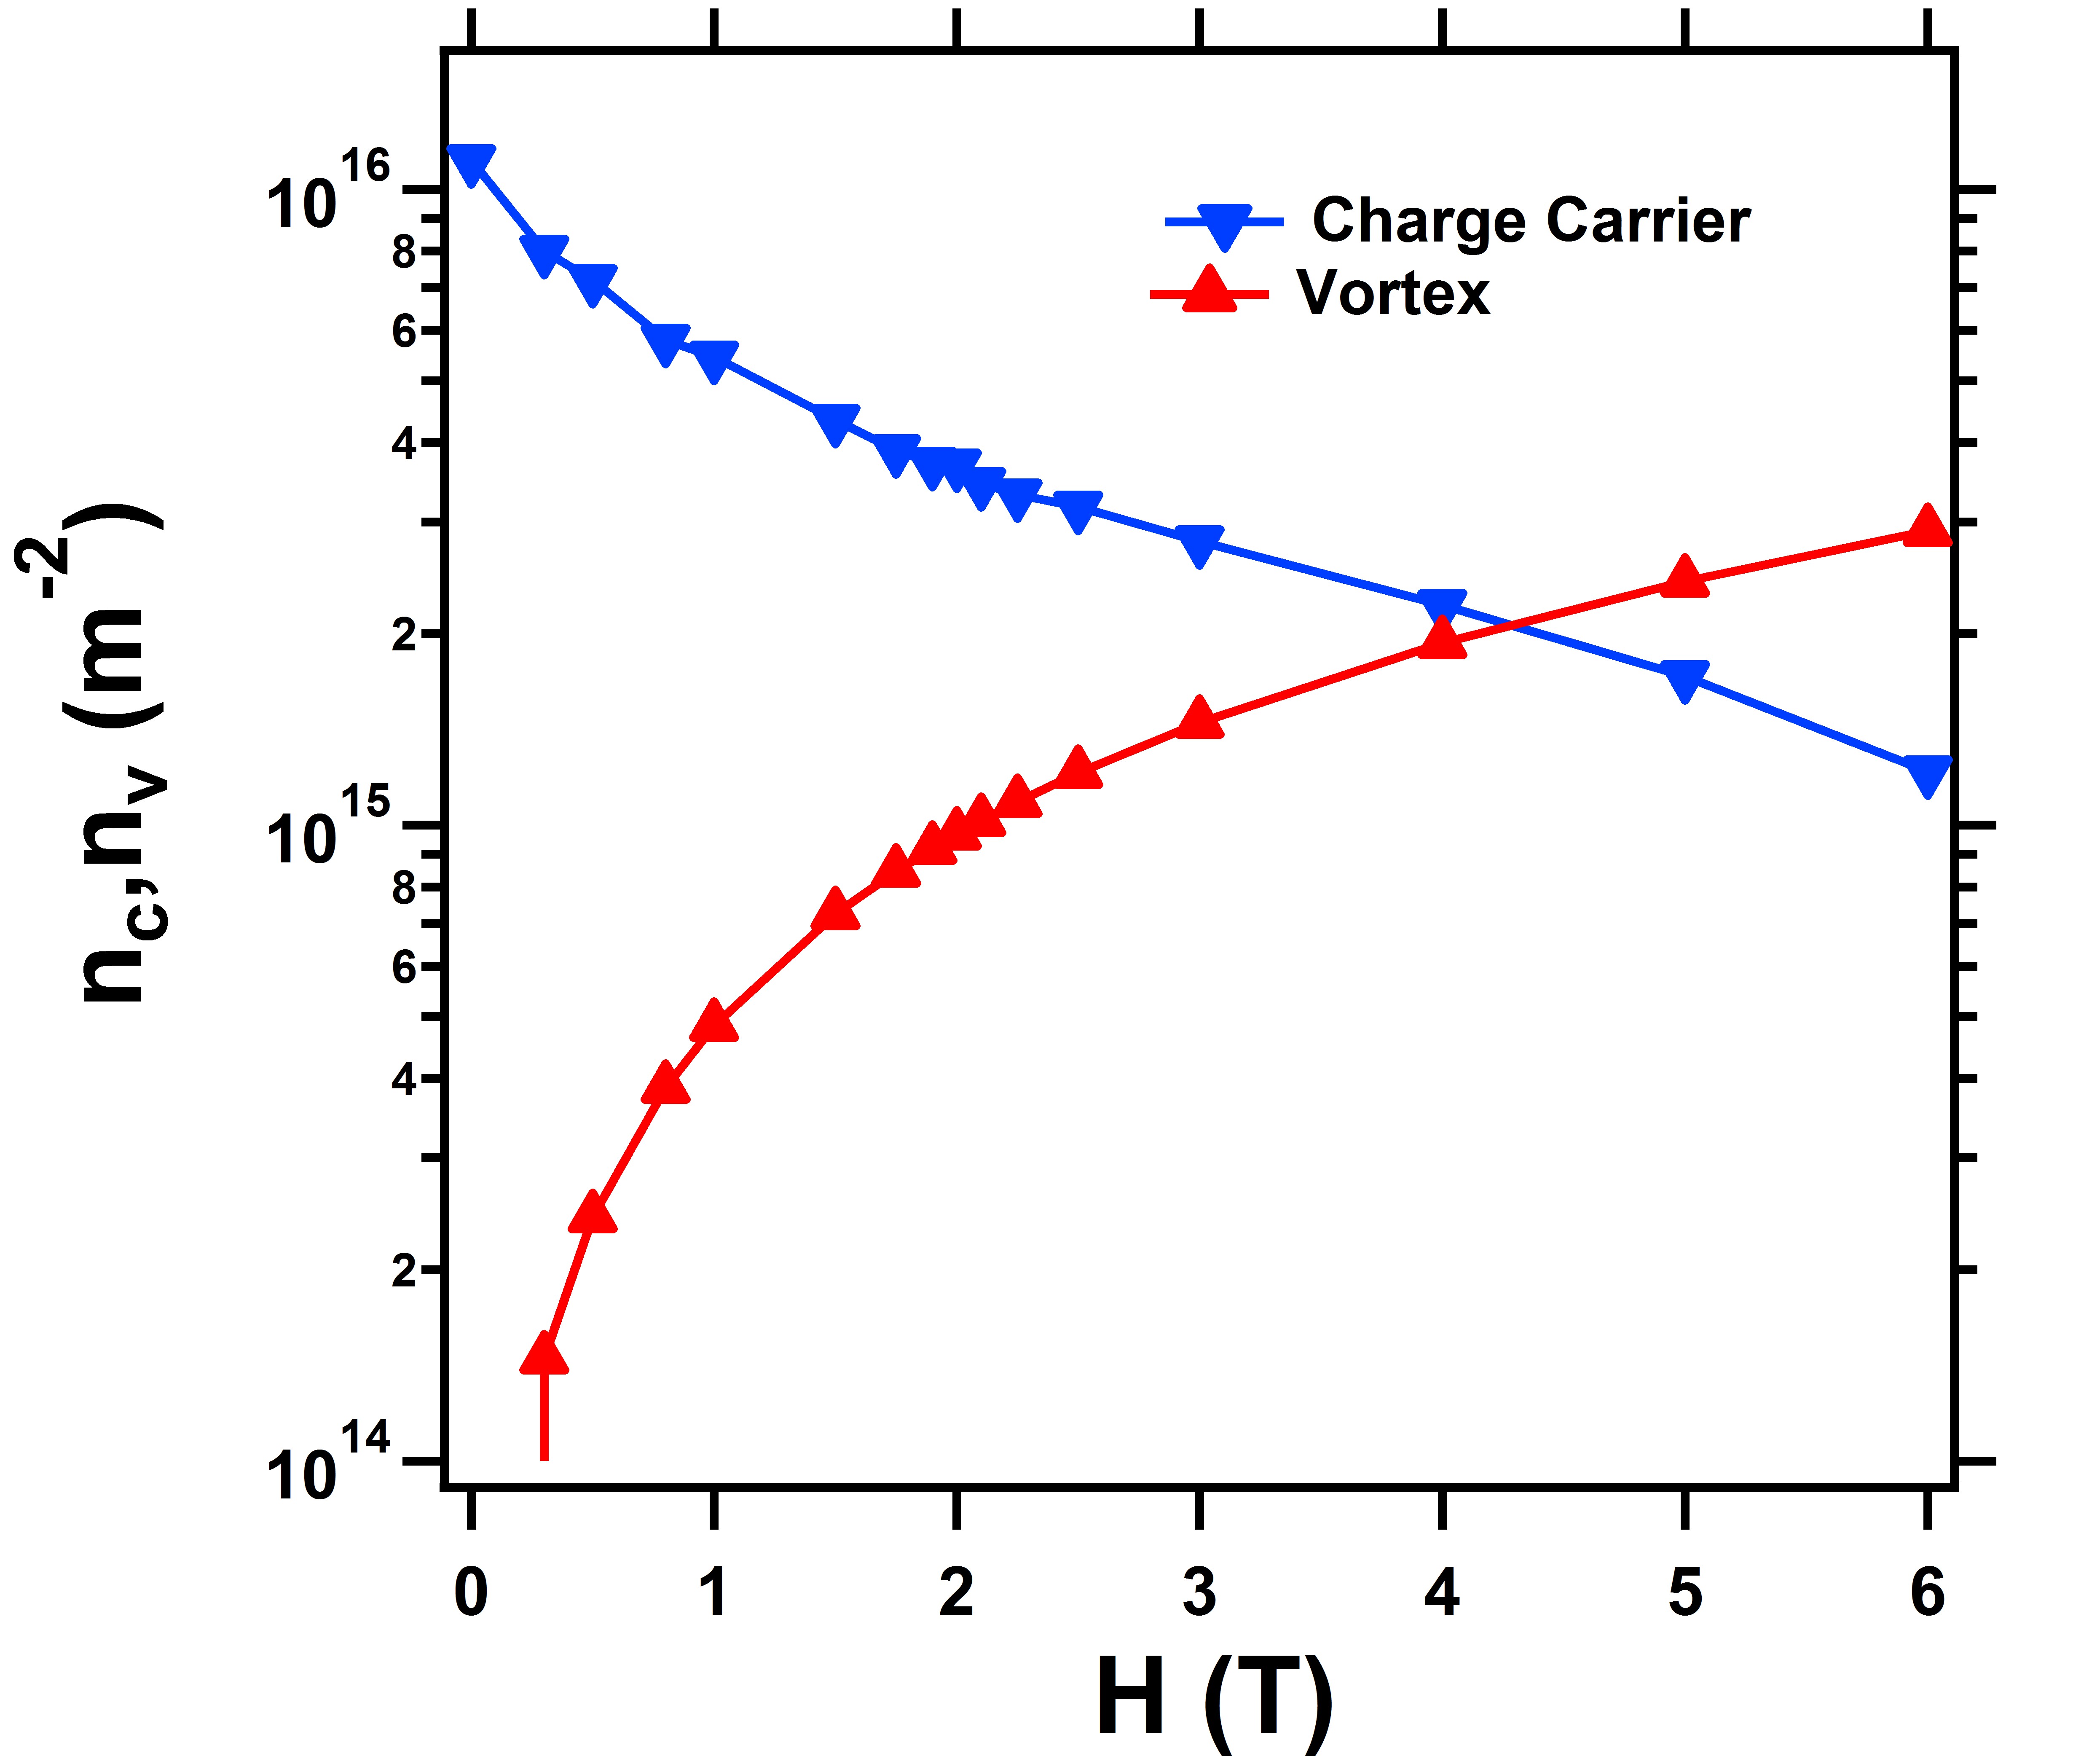
Spectra weight () in the frequency range we measured corresponds to long-lived charged degrees of freedom that contribute to transport. The ratio of the population of long-lived charges (in particular Cooper pairs) vortices is an important point of reference for studying field tuned quantum phase transitions, e.g. see ref. Mulligan and Raghu (2016). In this regard, we converted the spectral weight from data (integrated to 10 GHz) to charge density by:
| (14) |
We choose to plot 1/2 of this charge density because for most of the charge carriers could be Cooper pairs. Because of the 10 GHz cutoff, charge density is underestimated. However, not all charged degrees of freedom are Cooper pairs. The charge density estimated herein reflects the order of magnitude of Cooper pair density. Vortex density is estimated using:
| (15) |
where flux quantum . The result is shown in Supp. Fig. S8. It can be seen that near 2T the two densities are on the same order of magnitude.
References
- Liu et al. (2011) W. Liu, M. Kim, G. Sambandamurthy, and N. Armitage, Phys. Rev. B 84, 024511 (2011).
- Liu et al. (2013) W. Liu, L. Pan, J. Wen, M. Kim, G. Sambandamurthy, and N. P. Armitage, Phys. Rev. Lett. 111, 067003 (2013).
- Scheffler and Dressel (2005) M. Scheffler and M. Dressel, Review of scientific instruments 76, 074702 (2005).
- Liu et al. (2014) W. Liu, L. Pan, and N. Armitage, Review of Scientific Instruments 85, 093108 (2014).
- Booth et al. (1996) J. C. Booth, D. H. Wu, S. B. Qadri, E. F. Skelton, M. S. Osofsky, A. Piqué, and S. M. Anlage, Phys. Rev. Lett. 77, 4438 (1996).
- Lee and Stutzmann (2001) M. Lee and M. L. Stutzmann, Phys. Rev. Lett. 87, 056402 (2001).
- Ohashi et al. (2009) T. Ohashi, H. Kitano, I. Tsukada, and A. Maeda, Phys. Rev. B 79, 184507 (2009).
- Sambandamurthy et al. (2004) G. Sambandamurthy, L. W. Engel, A. Johansson, and D. Shahar, Phys. Rev. Lett. 92, 107005 (2004).
- Crane et al. (2007a) R. Crane, N. P. Armitage, A. Johansson, G. Sambandamurthy, D. Shahar, and G. Grüner, Phys. Rev. B 75, 184530 (2007a).
- Sambandamurthy et al. (2005) G. Sambandamurthy, L. W. Engel, A. Johansson, E. Peled, and D. Shahar, Phys. Rev. Lett. 94, 017003 (2005).
- Sambandamurthy et al. (2006) G. Sambandamurthy, A. Johansson, E. Peled, D. Shahar, P. Björnsson, and K. Moler, EPL 75, 611 (2006).
- Steiner and Kapitulnik (2005) M. Steiner and A. Kapitulnik, Physica C 422, 16 (2005).
- Crane et al. (2007b) R. W. Crane, N. P. Armitage, A. Johansson, G. Sambandamurthy, D. Shahar, and G. Grüner, Phys. Rev. B 75, 094506 (2007b).
- Gantmakher and Golubkov (2001) V. Gantmakher and M. Golubkov, JETP Lett. 73, 131 (2001).
- Scheffler (2004) M. Scheffler, Broadband microwave spectroscopy on correlated electrons (PhD thesis, University of Stuttgart, 2004).
- Liu (2013) W. Liu, Broadband microwave measurements of two dimensional quantum matter (PhD thesis, The Johns Hopkins University, 2013).
- Dresselhaus et al. (1955) G. Dresselhaus, A. Kip, and C. Kittel, Physical Review 98, 368 (1955).
- Davison et al. (2016) R. A. Davison, L. V. Delacrétaz, B. Goutéraux, and S. A. Hartnoll, Phys. Rev. B 94, 054502 (2016).
- Kuzmenko (2005) A. Kuzmenko, Review of scientific instruments 76, 083108 (2005).
- Mulligan and Raghu (2016) M. Mulligan and S. Raghu, Phys. Rev. B 93, 205116 (2016).