New_connection \excludeversionOld_connection
Investigation of low temperature quantum crossover in Josephson junctions
Abstract
The evidence for macroscopic quantum tunneling (MQT) in Josephson junctions at low temperatures has been reassessed. Swept bias escape distributions have been modeled with an algorithm-based simulation and the results compared with data from representative published experiments. Signatures expected of a crossover to MQT are not found in the analyzed data.
pacs:
74.50.+r, 85.25.Cp, 03.67.LxI Introduction
The physics of Josephson junctions, for a number of fundamental purposes and device applications, can be described by a classical circuit model and related dynamics BaroneVanD . At the lowest temperatures, however, there is another view in which the junction is presumed to transform into a macroscopic quantum device, a “qubit” , thereby acquiring properties specific of quantum states such as tunneling and entanglement Leggett2002 .
We have previously provided evidence that the non-quantum Resistively and Capacitively Shunted Junction (RCSJ) model of a Josephson junction can successfully replicate a number of experiments originally interpreted as manifestations of a macroscopic quantum state. These effects include microwave induced transitions, Rabi oscillations, Ramsey fringes, and entanglement of superconducting qubits Blackburn1 .
It is worth noting that new classes of superconductive devices and systems relying on the physics of Josephson tunneling have recently attracted the attention of the applied superconductivity community. In particular, new concepts in radiation detection have appeared in the literature Oelsner1 ; Oelsner2 . This paper presents an analysis of thermal and quantum effects associated with the washboard potential of the Josephson effect. Besides the specific analysis involving thermal and quantum excitations, our work might bring deeper insight into Josephson potentials and their escape mechanisms, which could be relevant in applications.
Here we present a more specific and systematic investigation of the basic phenomena from which the new “qubit” physics took motivation.The earliest indication of Macroscopic Quantum Tunneling (MQT) was provided by the least complicated experimental protocol: The bias current to a Josephson junction is applied in a steadily increasing sweep until the junction abruptly switches to a finite voltage state. The value of the current at that moment is recorded and the sweep is restarted many times. The accumulated data form a so-called switching current distribution (SCD) that for any specific junction temperature is peaked at a particular value of bias. The first claims of evidence of the macroscopic quantum phenomenon came from this kind of experiment Voss , i.e. evidence of MQT; similar claims by other authors have been reported since the mid-80’s Devoret .
It has been the standard approach in published work to infer the escape rate out of the Josephson potential Blackburn1 from the observed SCD distributions, and then to compare that rate with theory. Here we do just the opposite: we will infer the SCD peaks from an appropriate expression for the escape rate and then compare those predictions with experiment. We do this with a simulation algorithm that has been previously discussed Blackburn2012 . Any theoretical model can thus be tested by judging if it can duplicate experimental results.
Previously, we employed data from the experiment of Yu et al. Yu as a basis of assessing the predictions of a non-quantum device model from SCD peaks. Here we again use that same set of data, as well as results in the seminal work of Voss and Webb Voss , but now exclusively from the perspective of macroscopic quantum device models. We also consider some data of the same type measured for junctions made of high temperature superconductors. This allows a side by side comparison of non-quantum and quantum predictions.
For the purposes of this treatment we suppose that the measured bath temperature is indeed the same as the junction temperature.
II Theory
The RCSJ model of a Josephson junction consists of three parallel elements: a shunt resistor R, a shunt capacitor C, and a pure Josephson element. It has a long history of successfully predicting the dynamics of Josephson systems.
The current through a Josephson element is given by and the voltage across the element is governed by , where is the phase of the junction and is its critical current. With a total applied bias current , the phase dynamics is governed by
| (1) |
If time is normalized to where is the zero-bias Josephson plasma frequency, then
| (2) |
where is a normalized bias current and is a normalized loss coefficient.
A Josephson junction with phase has stored potential energy . The pre-factor in this expression is the Josephson energy:
| (3) |
The total potential energy of a junction, when an additional bias current is supplied, is
| (4) |
In this form it is apparent that the phase dynamics can be viewed in terms of a fictitious ‘particle’ moving in a potential .
At zero bias the potential is a horizontal washboard and the ‘particle’ would sit at the bottom of the well at . Small oscillations around the minimum of that well occur at the plasma frequency . At non-zero values of the bias: (a) the washboard tilts (b) the minimum of the well occupied by the particle shifts to values (c) the wells in the washboard potential become progressively shallower, with correspondingly smaller plasma frequencies, and reduced barrier heights BlackburnPLA that both disappear at a bias equal to the junction critical current.
The first escape mechanism to be recognized was classical thermal activation (TA) in which the “particle” jumps over the barrier and then bounces down the washboard generating a voltage. When the bias current is ramped up, a switching event is signalled when the ’particle’ escapes from the well and a voltage appears across the junction. At all but the lowest temperatures, the mechanism of this escape is thermal activation over the barrier and into the running state. The escape rate for such a process is Kramers
| (5) |
is Boltzmann’s constant, and is the junction temperature.
It has been proposed that for sufficiently small temperatures, the junction will change from a classical entity to a macroscopic quantum entity in which case escape would occur via quantum tunneling. The escape rate for this process is given by (see e.g. Devoret ; Martinis ).
| (6) |
where is the quality factor of the junction ().
The expression for escape due to quantum tunneling, Eq.(6), is a limiting form generally considered applicable only for the lowest temperatures. The question of possible finite temperature enhancements to this rate was explored in a number of theoretical papers Grabert ; Martinis2 . It is a widely held opinion that any judgment as to whether quantum theory actually does describe experiments must include temperature enhancement effects in a revised expression for the escape rate. MQT escape rates are expected to increase with finite temperature through thermal enhancement Washburn ; Grabert ; Martinis2 ; Cleland . We note that an enhanced escape rate (greater than ) means it is easier to escape from the well, so escape will occur sooner in the sweep. Therefore a finite temperature effect will result in SCD peaks being shifted to lower bias positions. For this reason the MQT escape peak expected from Eq.(6) must represent a maximum possible bias position - no quantum peak can advance beyond this point no matter how low the sample temperature. So there is a “cutoff” value for activation peak positions.
This finite temperature effect, as it applies to the particular case of Josephson junctions, appeared in Martinis2 where the enhanced escape rate in the weak damping limit was obtained from the zero temperature rate Eq.(6) according to the following equations (Eqs.3.16, 3.3, 3.11 in Martinis2 ):
| (7) |
where:
| (8) | ||||
| (9) |
with a damping constant for the Josephson junction and is a Riemann number.
III Simulations
An algorithm for computer simulations of swept bias experiments was described in Blackburn2012 . The program is built around appropriate escape rate expressions Eq.(5) and Eq.(6) or Eq.(7), and requires values for the following input parameters: junction critical current , junction capacitance , the junction quality factor , and the time taken for a bias sweep. There are no adjustable parameters.
For these simulations we chose to model a Josephson junction with the following parameters taken from Yu : bias ramp time ms, , , and . The zero bias plasma frequency was thus GHz. The simulations reported here represented an equivalent of repeated bias sweeps. Sample results are depicted in Fig.1.
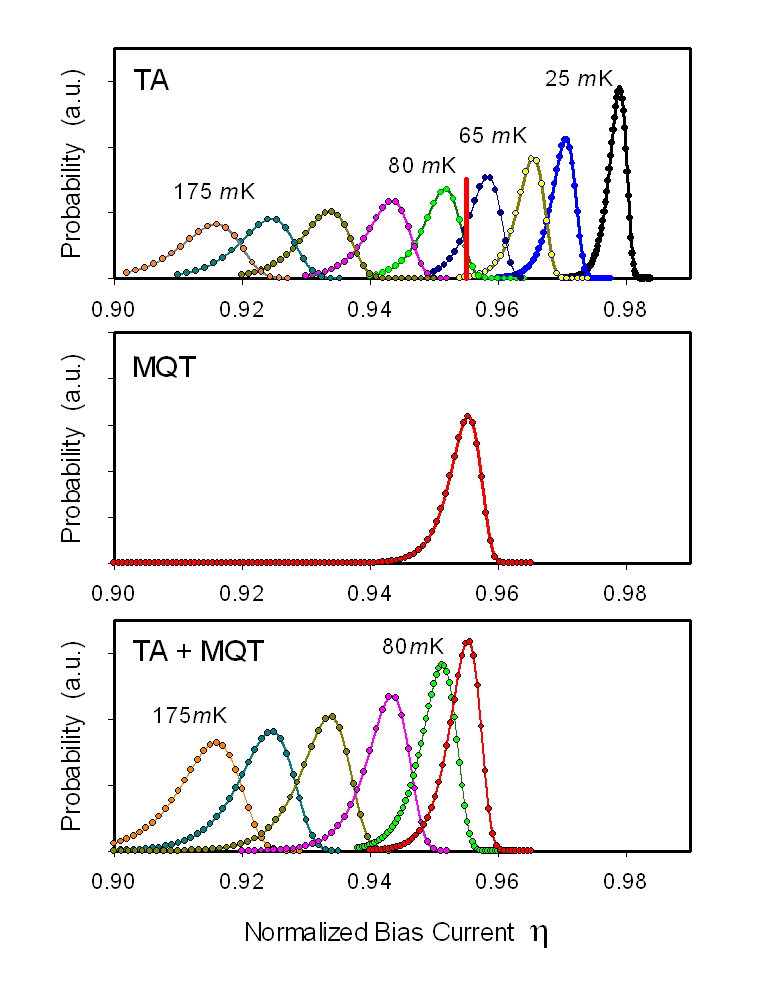
On the upper panel (TA) the SCD peaks from the simulation of escape only by thermal activation are presented. On the center panel (MQT), the single SCD peak from macroscopic quantum tunneling alone with an assumed is shown. Note that the MQT result (red peak) corresponds to a TA peak at mK.
Next we modified the original simulation algorithm to include both the thermal activation rate Eq.(5) and the quantum tunneling rate Eq.(6). That is, TA and MQT are present throughout the swept bias procedure. A simulation run produced the results shown in the lower panel (TA+MQT) of Fig.1. Here it is evident that when both escape modes are running concurrently, TA peaks for high enough temperatures appear at the same positions that they held in the absence of an MQT escape mode, but below this temperature only the MQT peak is seen.
This behavior is due to the nature of SCD peaks – they are distributions of the probability that an escape will occur at a particular bias value during a sweep. These peaks exhibit the property that on the high side of the maximum the probability returns to zero. A second process with a lower escape rate would have its SCD peak at a higher bias, but that bias region cannot be accessed. Therefore swept bias experiments will reflect only the process with the higher escape rate.
Note that the Josephson plasma frequency is bias-dependent because the curvature of the well is also bias-dependent. For example, in the harmonic approximation, . In addition, the barrier height is also bias-dependent. The thermal activation rate Eq.(5) and the thermally enhanced MQT rate Eq.(7) both explicitly depend on temperature, but the MQT escape rate Eq.(6) does not. However, the MQT rate will vary during the process of sweeping the bias current. This is shown in Fig.2.
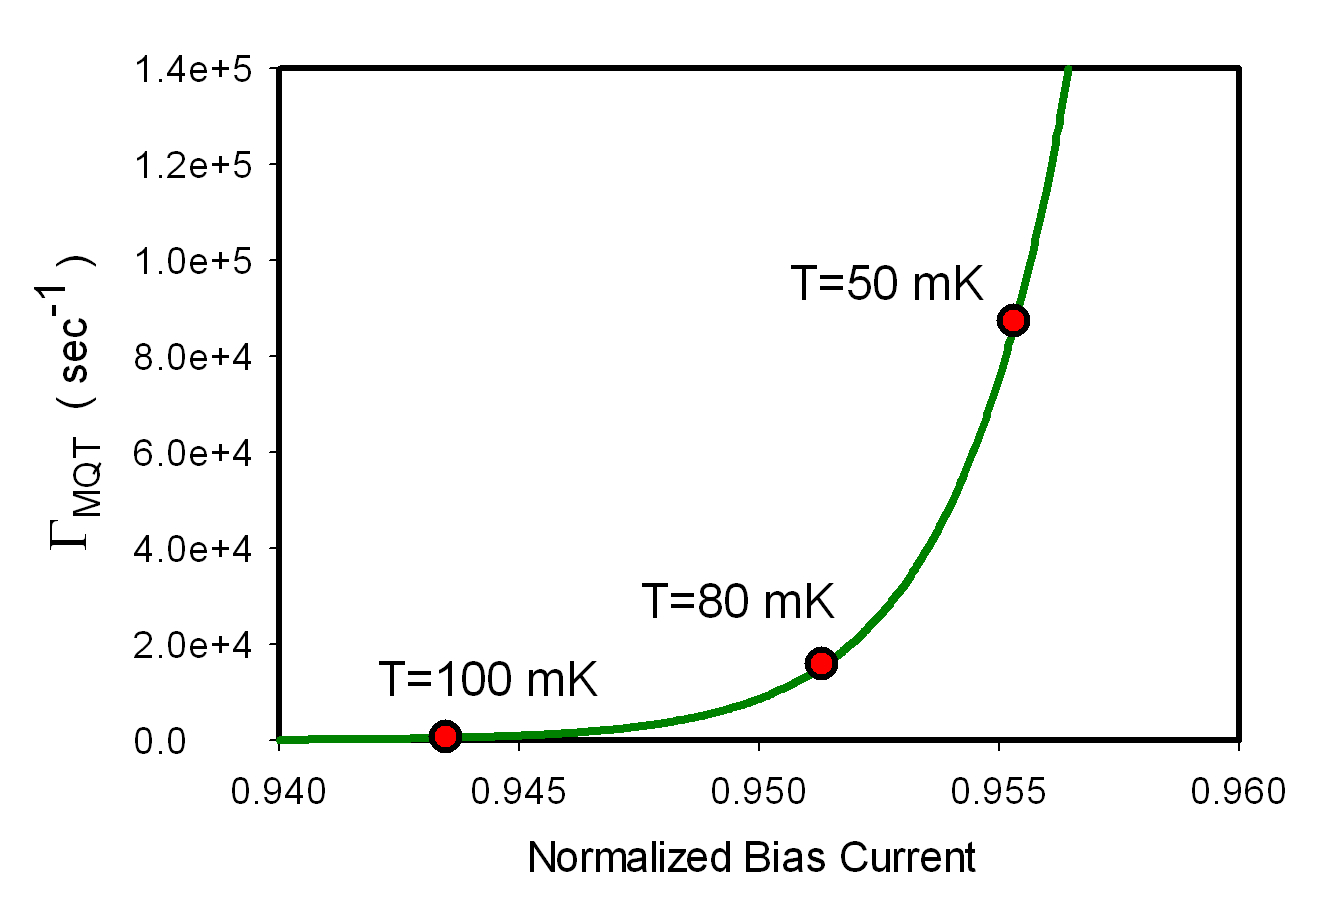
What this means is that the MQT escape rate cannot be regarded as a constant; its value depends on where in a sweep the SCD peak is located.
IV Crossover
The crossover temperature is defined by the condition that the escape rate for thermal activation equals the escape rate for MQT; hence for Eqs.(5,6),
| (10) |
With the usual assumption this leads to
Because the escape rates for TA and MQT are equal at this temperature, it is considered to be the point at which there is a crossover between the two escape modes. It should be noted that the rate expression Eq (6) is in fact a zero temperature limit Devoret ; Martinis .
This changeover to thermal activation, from both macroscopic quantum tunneling and for thermally-enhanced macroscopic tunneling, is illustrated in Fig.3.
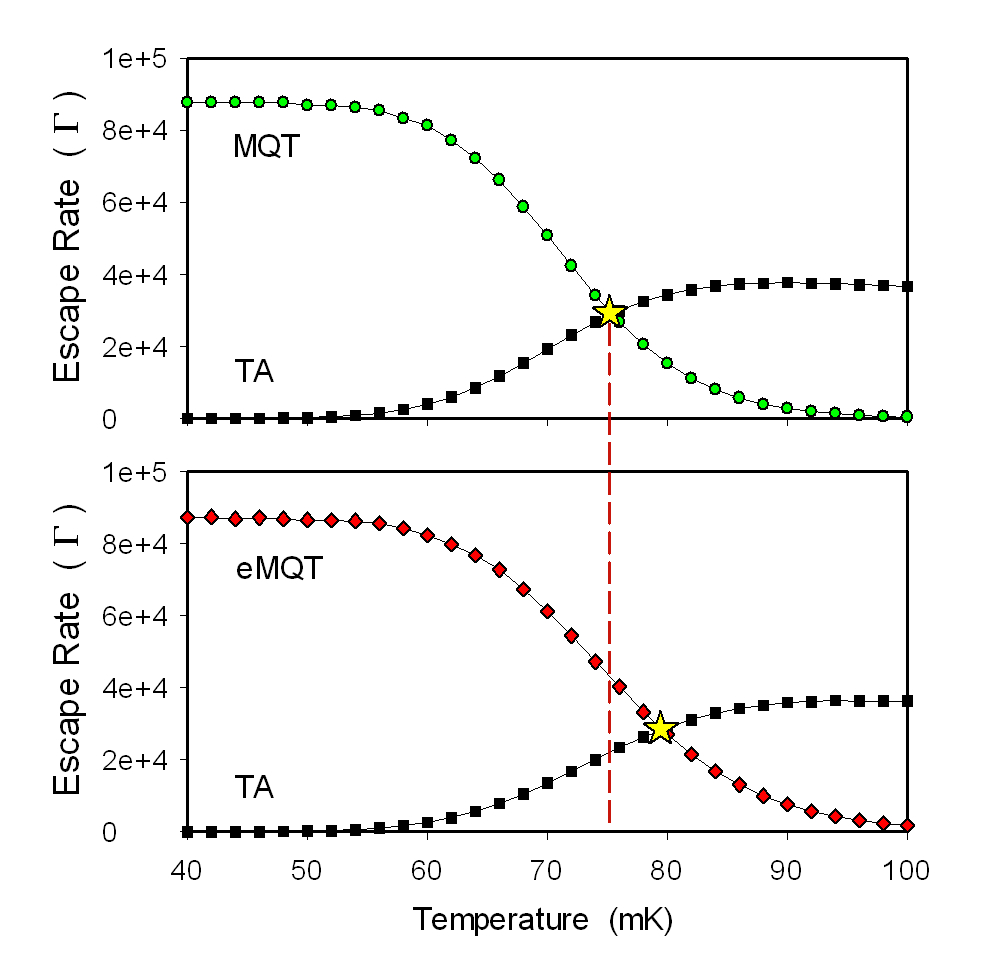
In the simulation, for a chosen temperature, the bias is ramped up until an escape peak is reached. The bias current at that point determines the potential barrier and also the plasma frequency. Therefore the thermal escape rate can be calculated from Eq.(5). Likewise the MQT escape rate can be calculated from Eq.(6). In the lower panel, this process has been repeated but with the thermally enhanced escape rate given by Eq.(7). What this shows is that for an MQT process, there is a crossover temperature , whereas for an enhanced MQT process there is a corresponding enhanced crossover temperature . As the figure illustrates, this enhancement of the crossover temperature can be quite small, .
V Comparison with Experiments
We now analyze the experiments presented in Yu . Figure 2 in Yu (also repeated in Yu2 ) includes a plot of SCD peak positions as a function of junction temperature. As discussed in the Appendix of Blackburn1 , peak positions are a more precise indication of behavior at the lowest temperatures where the width of the peaks shrinks considerably.
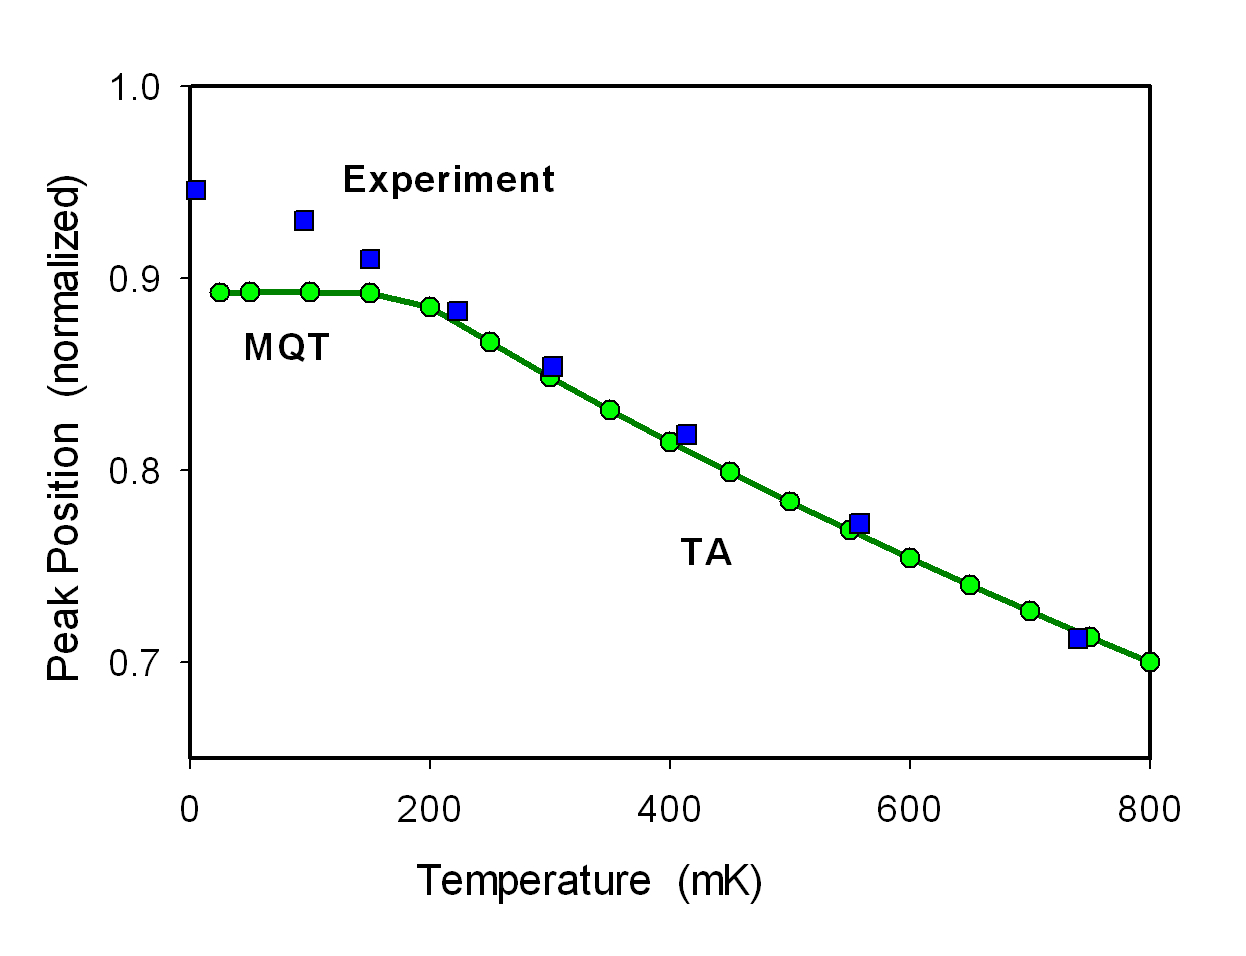
We digitized the eight lowest temperature data points and replot them as (blue) squares in Fig.4. Note that the temperature scale here is linear.
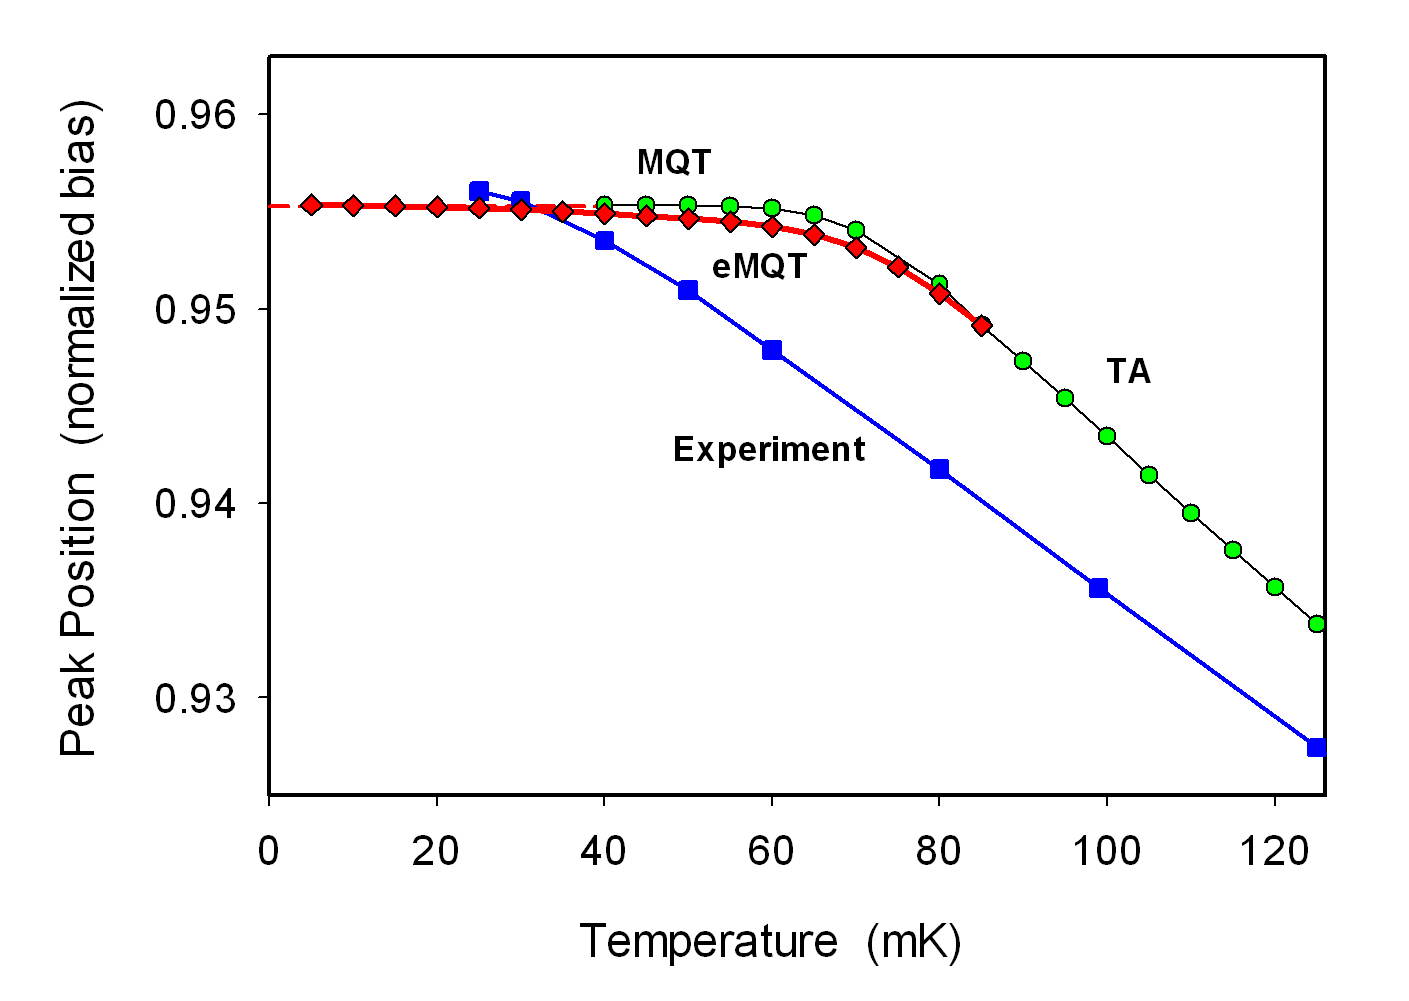
From simulation-generated plots such as shown in the lower panel of Fig.1 with TA and MQT processes acting concurrently, peak positions were extracted. The solid circles (green) in Fig.4 come from that process. This illustrates the natural transition that takes place between thermal activation and quantum tunneling.
It might be observed that the experimental data lie below the TA simulation results. However, at temperatures above mK simulation and experiment are in excellent agreement, as is apparent in Fig.2 of BlackburnEPL . In BlackburnEPL we speculated on why experimental results might peel-away from the expected TA behavior at low temperatures.
We applied Eq.(7) for the enhanced escape rate applicable to this experiment with parameter values and , mK, . The simulation yielded the results plotted as diamonds (red) in Fig.4. As would be anticipated, the predicted peak positions with thermal enhancement (diamonds) lie slightly below the corresponding simulation results without enhancement (circles). As expected from the simulation results shown in Fig.3, there has been a small upward shift in the crossover point.
With respect to “error bars” that might be associated with the data presented in Fig.4, we note the following.
For the experiments, escape data from each bias scan were sorted into bins of width . The large number of repetitive scans ( in this instance) assured that the bin with the largest number of counts corresponded to the true position of the SCD peak with a statistical uncertainty of one bin width. The junction critical current was hence the uncertainty bars for these experimental data points would be , in normalized units. In Fig.4 the experimental data are shown as (blue) squares which have a vertical dimension of ; consequently for the experiments, error bars would be approximately one half the height of the square symbols.
For the simulations based on escape rates, there were data bins evenly spaced over the normalized bias interval . Each simulation run represented an equivalent of repeated bias sweeps. The normalized bin spacing is , which is less than a tenth of the uncertainty of the experimental data, and also much smaller than the thickness of the solid line (red) that extends towards . Hence statistical error bars on simulation results would be too small to be visible. Therefore the disagreement between experiment and quantum predictions cannot be attributed to statistical errors.
We performed the same type of analysis done for the Yu et al. experiment Yu on the data reported by Voss and Webb Voss . The parameters for this simulation were: , , , zero bias plasma frequency , and a bias ramp time of . The result of the analysis is shown in Fig.5.
Error bars associated with both experimental and simulation data points in this figure can be estimated in the same manner as was done in connection with Fig.4 and the results are, as before, that on the scale of this plot the uncertainties are insignificant.
Two significant features can be seen in Fig.5. The first is that the experimental data show no evidence of a quantum transition since the peak positions continue to move up as the temperature of the junction decreases below the theoretical crossover temperature.
Secondly, the experimental data points closely track the simulation results in the ”thermal activation” regime of bath temperatures. We note that in Fig.4 the experimental data do not follow the thermal bath temperature, at least for the range of temperatures in the plot. This phenomenon has been previously interpreted as evidence that the sample temperature might be different from the bath temperature BlackburnEPL . The fact that in the experiment of Voss and Webb the temperature of the sample is identical to that of the bath could be due to their declared experimental condition that the sample was mounted inside the mixing chamber of the dilution refrigerator and not externally anchored to the chamber itself (as in most other experiments).
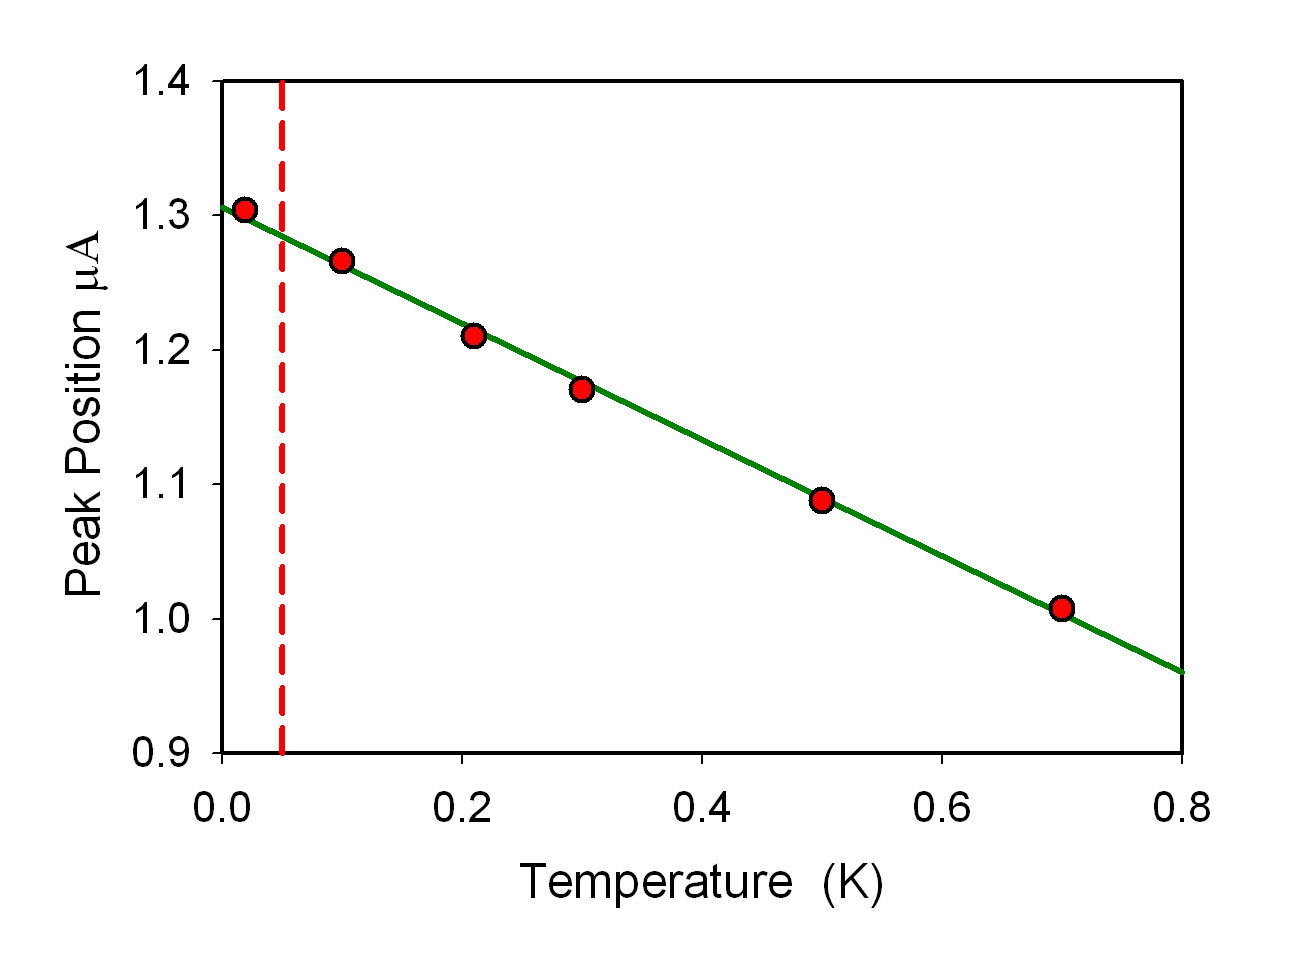
In Fig. 6 we show data digitized from plots of an experiment performed on high-Tc superconducting materials, namely a grain boundary biepitaxial junction Bauch . In the figure we display the experimentally determined position of the switching current peaks as a function of temperature. Although we have not performed a direct simulation in this case, due to the lack of sweep rate data in the paper, the nearly linear behaviour down to very low temperatures is so striking that we can very reasonably claim that no transition to the theoretically predicted MQT curve has occurred.
VI Comments
As mentioned already, there exist other sets of experiments in the literature reporting SCD experiments with claims of evidence for MQT. For this study we have chosen to focus on certain experiments that are sufficiently straightforward for us to suppose there are no unknown and/or uncontrollable effects that might disturb the nature of the mechanism by which escape takes place out of the one-dimensional Josephson potential. Low supercurrent junctions represent somewhat ‘safer’ candidates from this point of view. It has been shown, for example, that the nature of the escape processes in high-Tc junctions can be unusual Barbanera since this kind of tunnelling structure can exhibit phase-gradient effects for relatively high current densities.
A remark in Devoret captures an early view of the crossover process: “The crossover temperature at which the escape rate changes from thermal (temperature dependent) to quantum (temperature independent) is predicted to be in the limit ”. That picture has evolved somewhat. Figure 3 in Grabert summarizes the current suppositions underlying the macroscopic quantum tunneling hypothesis. It distinguishes between various temperature intervals: well below the crossover region, quantum tunneling prevails; within the crossover interval itself, quantum tunneling and thermal activation both operate; above the crossover zone quantum corrections apply to the classical thermal escape process; and then finally beyond that, thermal hopping as the only escape mode.
The present simulations are consistent with this picture. With respect to switching current distributions, a transition in SCD peak behavior is expected even when both processes coexist, and may indeed coexist on either side of the crossover point. It follows that any evidence of freezing of escape peak positions at temperatures below the crossover point would give no information about when the macroscopic quantum state actually coalesced – one could only conclude that it must have been formed at some temperature above . Even below the crossover temperature a Josephson junction could not be supposed to be fully quantum. This could have consequences for the operation of qubits.
In Washburn Eq.(7) appears in a slightly altered form, with the right hand side expressed simply as . This emphasized the expectation of a dependence of the enhanced escape rate near . With that in mind, Washburn et al. inferred escape rates from experimental SCD peak data, and then plotted the natural logarithm of that escape rate vs . From that plot, the slope was extracted. Tellingly, they stated “we do not find quantitative agreement with theoretical prediction for the slope ” and in the summary concluded that they achieved only qualitative agreement with theoretical predictions. Certainly, this fell short of confirming thermal enhancement of MQT. Similar outcomes were reported in Cleland .
In summary, for the first time escape rates arising from macroscopic quantum tunneling theory have been tested against experiments. We have extracted switching current distribution data from three selected experiments and compared those data with simulation-based predictions of both zero temperature MQT theory, and thermally enhanced MQT theory. We emphasize that no comparisons of this type have been reported before. Significantly, the scaling expression for the anticipated thermal enhancement of escape rates in a Josephson junction with small damping does not resolve discrepancies between zero temperature theory and observation, at least for the selected experiments.
VII Acknowledgement
We are deeply indebted to Hermann Grabert for clarifying some key concepts relating to thermal enhancement and for guiding us to the crucial scaling relation that allowed escape rates to be determined in the region below the crossover temperature
References
- (1) A. Barone and G. Paternò, Physics and Applications of the Josephson Effect (J. Wiley, 1982), T. Van Duzer and C. W. Turner, Principles of Superconductive Devices and Circuits (Prentice Hall, 1999).
- (2) A. J. Leggett, J. Phys. : Condensed Matter 14, R415 (2002);J. M. Martinis, S. Nam, J. Aumentado, C. Urbina, Phys. Rev. Lett. 89, 117901 (2002); I. Chiorescu, Y. Nakamura, C. J. P. M. Harmans, J. E. Mooij, Science 299, 1869 (2003); J. Q. You and F. Nori, Physics Today 58 (11), 42 (2005).
- (3) J.A. Blackburn, M. Cirillo, and N. Grønbech-Jensen, Physics Reports 611, 1-33 (2016).
- (4) G. Oelsner, C. K. Andersen, M. Reh k, M. Schmelz, S. Anders, M. Grajcar, U. H bner, K. M lmer, and E. Il ichev, Physical Review Applied 7, 014012 (2017).
- (5) G. Oelsner, L. S. Revin, E. Il ichev, A. L. Pankratov, H. G. Meyer, L. Grönberg, J. Hassel, and L. S. Kuzmin, Appl. Phys. Lett. 103, 142605 (2013).
- (6) R.F. Voss and R.A. Webb, Phys. Rev. Lett. 47, 265 (1981).
- (7) M.H. Devoret, J.M. Martinis, and J. Clarke, Physical Review Letters 55, 1908 (1985); K. Inomata et al., Phys. Rev. Lett. 95, 107005 (2005); X. Y. Jin et al., Phys. Rev. Lett. 96, 177003 (2006); P. Silvestrini, B. Ruggiero, Yu. N. Ovchinnikov, and A. Barone, Phys. Rev. B 53, 67 (1996).
- (8) J.A. Blackburn, M. Cirillo, and N. Grønbech-Jensen, Physical Review B 85, 104501 (2012).
- (9) H.F. Yu, X.B. Zhu, Z.H. Peng, W.H. Cao, D.J. Cui, Ye Tian, G.H. Chen, D.N. Zheng, X.N. Jing, Li Lu, S.P. Zhao, and Siyuan Han, Physical Review B 81, 144518 (2010).
- (10) J.A. Blackburn, M. Cirillo, and N. Grønbech-Jensen, Physics Letters A 374 2827 (2010).
- (11) H.A. Kramers, Physica VII, 284 (1940).
- (12) J. M. Martinis, M. H. Devoret. and J. Clarke, Phys. Rev. B35, 4682 (1987).
- (13) H. Grabert, P. Olschowski, and U. Weiss, Phys. Rev. B36, 1931 (1987).
- (14) J.M. Martinis and H. Grabert, Phys. Rev. B38, 2371 (1988).
- (15) S. Washburn, R.A. Webb, R.F. Voss, and S.M. Faris, Phys. Rev. Lett. 54, 2712 (1985).
- (16) A.N. Cleland, J.M. Martinis, and J. Clarke, Phys. Rev. B Rapid Comm. 37, 5950 (1988).
- (17) A. Wallraff, A. Lukashenko, C. Coqui, A. Kemp, T. Duty, and A.V. Ustinov, Rev. Sci. Instr. 74, 3740 (2003).
- (18) H.F. Yu, X.B. Zhu, Z.H. Peng, Y. Tian, D.J. Cui, G.H. Chen, D.N. Zheng, X.N. Jing, L. Lu, S.P. Zhao, and S. Han, Phys. Rev. Lett. 107, 067004 (2011); Fig. 3.
- (19) J.A. Blackburn, M. Cirillo, and N. Grønbech-Jensen, EPL 107, 67001 (2014).
- (20) T, Bauch, F. Lombardi, F. Tafuri, A. Barone, G. Rotoli, P. Delsing, and T. Claeson, Phys. Rev. Lett. 94, 087003 (2005).
- (21) S. Barbanera, M. G. Castellano, G. Torrioli, and M. Cirillo, Applied Physics Letters. 72, 1760 (1998)