The Presence of Thermally Unstable X-ray Filaments and the Production of Cold Gas in the NGC 5044 Group
Abstract
We present the results of a deep Chandra observation of the X-ray bright, moderate cooling flow group NGC 5044 along with the observed correlations between the ionized, atomic, and molecular gas in this system. The Chandra observation shows that the central AGN has undergone two outbursts in the past years, based on the presence of two pairs of nearly bipolar X-ray cavities. The molecular gas and dust within the central 2 kpc is aligned with the orientation of the inner pair of bipolar X-ray cavities, suggesting that the most recent AGN outburst had a dynamical impact on the molecular gas. NGC 5044 also hosts many X-ray filaments within the central 8 kpc, but there are no obvious connections between the X-ray and H filaments and the more extended X-ray cavities that were inflated during the prior AGN outburst. Using the linewidth of the blended Fe-L line complex as a diagnostic for multiphase gas, we find that the majority of the multiphase, thermally unstable gas in NGC 5044 is confined within the X-ray filaments. While the cooling time and entropy of the gas within the X-ray filaments are very similar, not all filaments show evidence of gas cooling or an association with H emission. We suggest that the various observed properties of the X-ray filaments are suggestive of an evolutionary sequence where thermally unstable gas begins to cool, becomes multiphased, develops H emitting plasma, and finally produces cold gas.
Subject headings:
galaxies:clusters:general – galaxies: ISM – galaxies: active – galaxies: groups: individual (NGC 5044)1. Introduction
Groups and clusters of galaxies have been traditionally divided into two main categories: cool-core systems, which have smooth X-ray morphologies and cooler gas in their centers; and non-cool-core systems, which have complex X-ray morphologies and no cool gas. Early X-ray observations showed that the radiative cooling time of gas in the center of cool-core clusters can be significantly shorter than a Hubble time, and that in the absence of reheating, the gas should cool at rates of up to hundreds of M⊙ yr-1 (Fabian et al. 1984). The primary issue with the early cooling flow scenario was the lack of significant amounts of cold gas or star formation.
Our understanding of cooling flows changed dramatically with the launch of the Chandra and XMM-Newton X-ray observatories when a strong feedback mechanism was discovered between the central AGN and hot gas that prevents the bulk of the hot gas from cooling (e.g., McNamara et al. 2000; David et al. 2001; Fabian et al. 2003a; Blanton et al. 2003; Peterson & Fabian 2006; Forman et al. 2007; McNamara & Nulsen 2011 and references therein). The AGN-cooling flow feedback mechanism has far-reaching consequences concerning galaxy formation and can explain the observed correlation between bulge mass and black hole mass (Magorrian et al. 1998; Gebhardt et al. 2000) and the cutoff in the number of massive galaxies.
Over the same time period, many studies have shown that the central dominant galaxies (CDGs) in cooling flows are far from being red and dead. Single-dish CO surveys over the past decade have shown that a substantial fraction of CDGs in groups and clusters harbor large amounts of molecular gas (Edge 2001; Salome & Combes 2003; Combes et al. 2007; Young et al. 2011). A great deal of more detailed information about the molecular gas content in cooling flows has been acquired recently with ALMA (McNamara et al. 2014; Russell et al. 2014; David et al. 2014; Russell et al. 2016,2017). In addition, star formation has now been detected in many CDGs in cooling flows with rates roughly consistent with the AGN-suppressed mass-cooling rates (Rafferty et al. 2006; Quillen et al. 2008). The fact that star formation and emission from cooler gas (e.g., H, [CII], and CO) are only detected in systems with short cooling times (Rafferty et al. 2008) or low gas entropies (Cavagnolo et al. 2008,2009) confirms that the hot gas is the primary reservoir fueling star formation. Cooling flows have always been a study of star formation in a hostile environment, but only recently has it become possible through the combination of multifrequency data to trace all the stages of star formation.
A wealth of multifrequency data is available for the cooling group NGC 5044, which makes it an ideal object for studying correlations between gas over a broad range of temperatures. Previous X-ray studies of NGC 5044 using XMM-Newton and earlier Chandra data show that the hot gas within the central region of NGC 5044 has been perturbed by AGN outbursts and the motion of the central galaxy within the group potential, based on the presence of X-ray filaments, cavities, and cold fronts (Buote et al. 2003; David et al. 2009,2011, Gastaldello et al. 2009,2013; O’Sullivan et al. 2014). David et al. (2009) showed that mechanical heating by AGN-inflated cavities is sufficient to offset radiative cooling of the gas within the central 10 kpc. While AGN-feedback is sufficient to prevent the bulk of gas from cooling in the center of NGC 5044, some gas must be cooling out of the hot phase to supply the cooler gas detected in multifrequency observations, including bright H filaments, ro-vibrational H2 line emission (Panuzzo et al. 2011), [CII] line emission (Werner et al. 2014), and CO emission (David et al. 2014). Ongoing star formation also has been observed in NGC 5044 at a rate of about 1% of the classical cooling rate. The primary objective of this paper is to identify the location of the small fraction of hot gas that is actually cooling out of the hot phase and to search for correlations between the ionized, atomic, and molecular gas.
| Date | ObsID | Total Exposure | Cleaned Exposure |
|---|---|---|---|
| (ks) | (ks) | ||
| 2000 Mar 19 | 798 | 20.5 | 18.9 |
| 2008 Mar 7 | 9399 | 82.7 | 80.4 |
| 2015 May 7 | 17653 | 35.5 | 32.6 |
| 2015 May 10 | 17654 | 25.0 | 23.5 |
| 2015 May 11 | 17196 | 88.9 | 83.8 |
| 2015 Jun 6 | 17195 | 78.0 | 74.5 |
| 2015 Aug 23 | 17666 | 88.5 | 81.9 |
Note. — Observation date, Chandra observation ID number, total exposure time, and cleaned exposure time for all ACIS observations of NGC 5044.
This paper is organized as follows. Section 2 contains a description of the Chandra data reduction. An overview of all multifrequency data is presented in and the global X-ray properties of NGC 5044 are given in . In we identify the location of the multiphase, thermally unstable gas and show that the observed properties of the X-ray filaments are consistent with the cooling of thermally unstable gas. The origin of the molecular gas kinematics is examined in and correlations between the hot gas, cold gas, and star formation are discussed in . Finally, our main results are summarized in .
2. Chandra Data Reduction
An observing log of all Chandra observations of the NGC 5044 group is shown in Table 1. All observations were centered on the backside-illuminated ACIS-S3 chip and reprocessed with CIAO 4.8 and CALDB 4.7.2. Except for the 2000 observation, all observations were carried out in very faint (VF) telemetry format, and VF background filtering was applied to the appropriate data sets. Since the X-ray emission from NGC 5044 covers the entire S3 chip, data acquired on the backside-illuminated S1 chip, which was turned on during all the observations, was used to screen for background flares. Light curves were generated in the 3.0-8.0 keV and 9.0-12.0 keV energy bands for the diffuse emission on S1, and time intervals with count rates exceeding 20% of the mean count rate were excluded from further analysis. Background data sets were generated for all active chips during the ACIS observations by extracting the appropriate blank sky background files from the Chandra CALDB based on the date of the observations. VF filtering was then applied to the background data sets, and the live time in each background file was adjusted to yield the same 9.0-12.0 keV count rate as in the corresponding NGC 5044 observation.
The CIAO tool wavdetect was run on a mosaic of all seven ObsIDs to identify point sources, which were then excised from the analysis of the diffuse emission in the NGC 5044 group. Point sources were detected in a broad energy band from 0.5-7.0 keV and a hard energy band from 2.0-7.0 keV. The broad energy band is sufficient to detect point sources outside of the core of NGC 5044, but a harder energy band is required to detect the emission from the host LMXBs in NGC 5044 because of the the high surface brightness of the hot gas (see David et al. 2009).
As shown below, there is significant structure in the hot gas within the central few arcseconds of the NGC 5044 group. After reprocessing all of the ACIS data, the rms scatter in the X-ray centroid of the AGN among the seven ObsIDs was (within the quoted uncertainties in the absolute astrometry of Chandra data111cxc.harvard.edu/proposer/POG/). To obtain the best possible imaging within this region, we used the X-ray centroid of the AGN as derived from ObsID 17196 (the deepest exposure) as the fiducial value, and re-registered the remaining ObsIDs to produce consistent X-ray centroids for the AGN using the CIAO science thread, Correcting Absolute Astrometry.222cxc.harvard.edu/ciao/threads/reproject_aspect/ We adopt a luminosity distance of 31.2 Mpc to NGC 5044 (Tonry et al. 2001), which gives a physical scale of pc. All uncertainties are quoted at the level unless otherwise noted.
3. MultiFrequency Overview
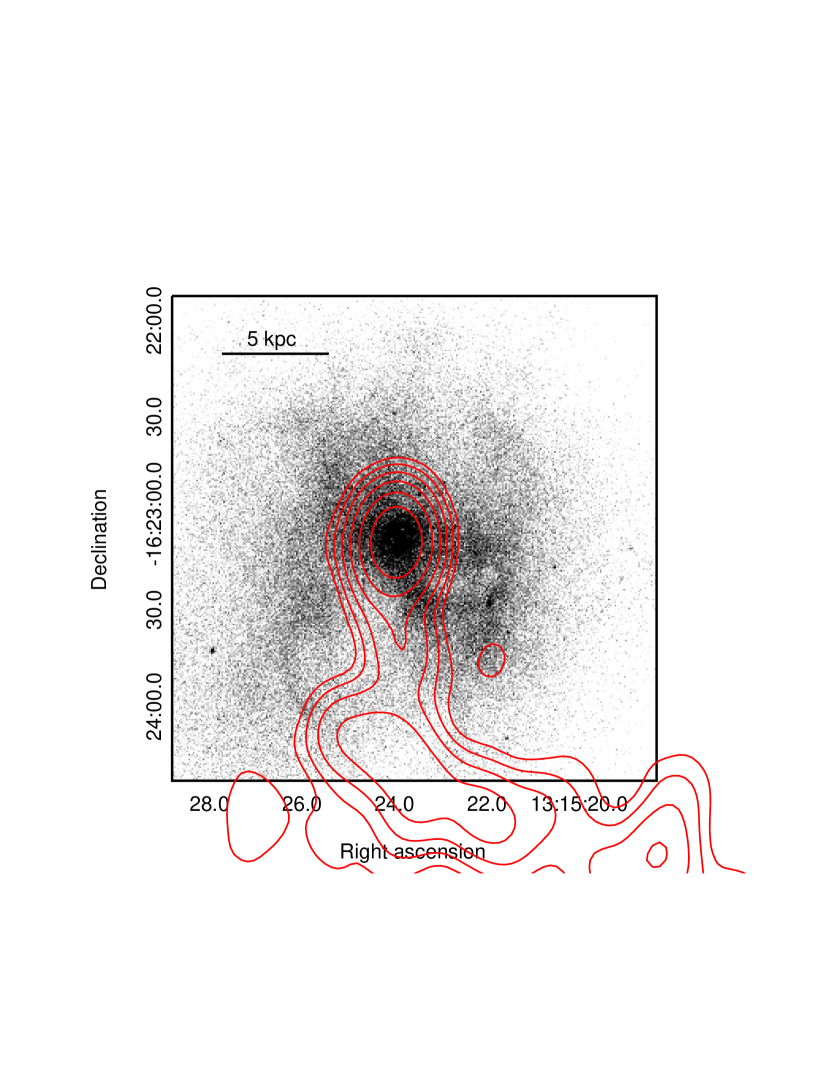
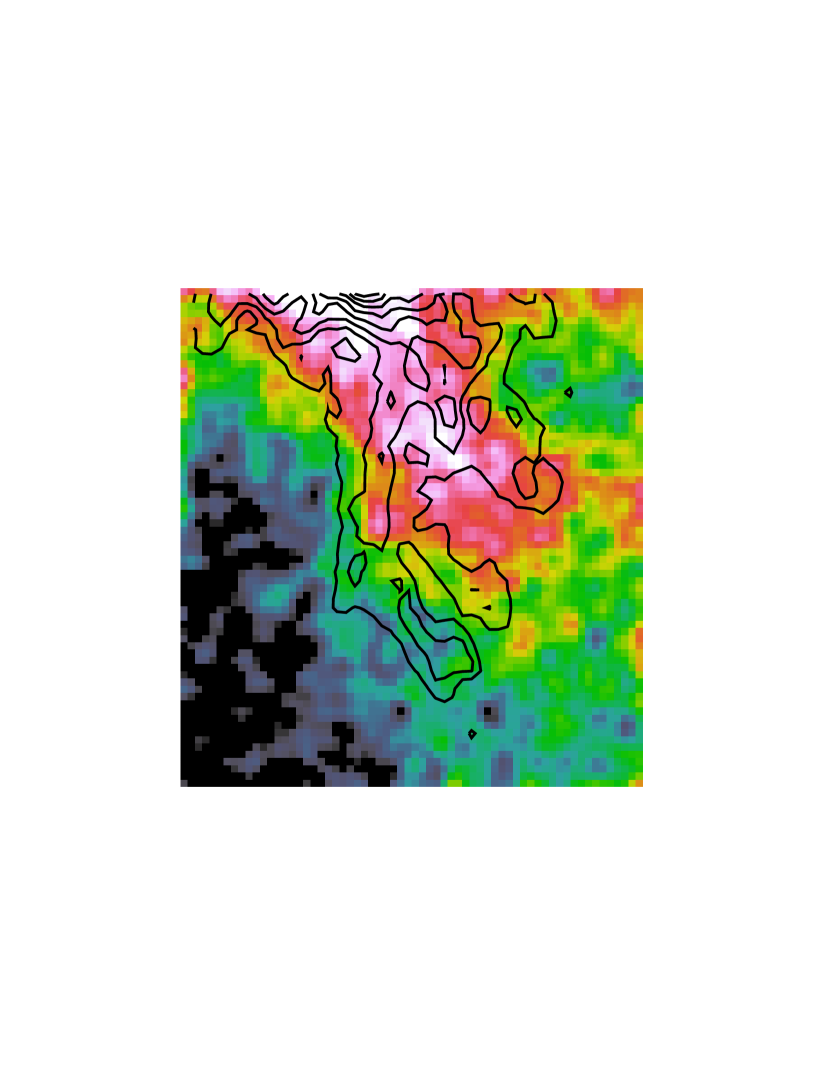
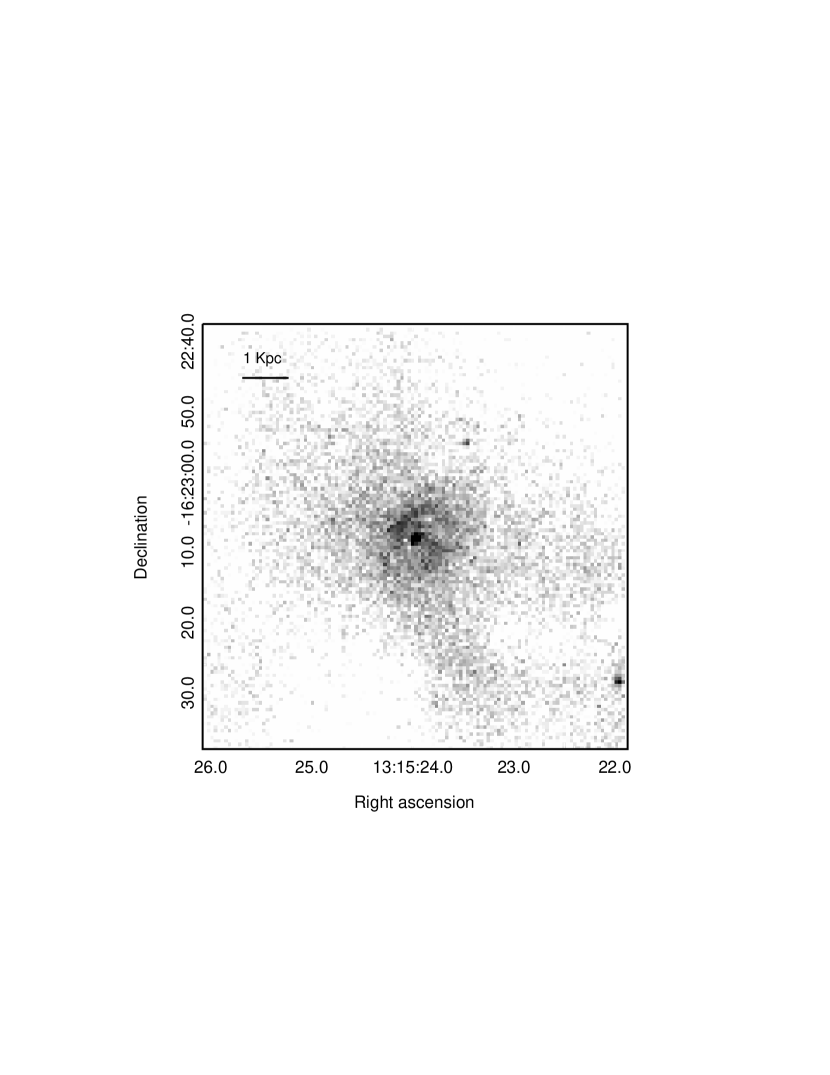
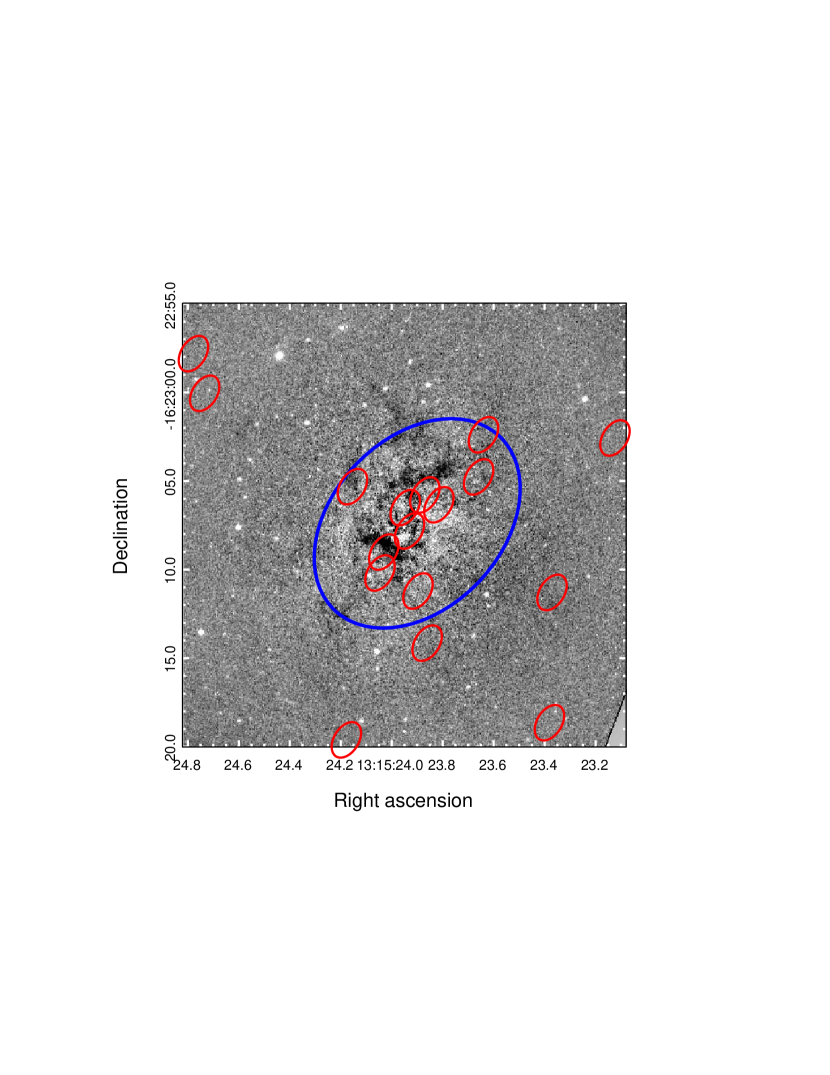
A mosaic of the combined 395 ks of ACIS data is shown in Figure 1, which highlights the X-ray structures on scales of a few kpc. Also shown in Figure 1 are the 235 MHz radio contours from our GMRT observation (Giacintucci et al. 2011). The X-ray cavities and filaments on these scales are the most prominent in the unsharp masked image shown in Figure 2. The largest X-ray cavity extends from slightly SE of the AGN toward the south and is filled with 235 MHz radio emission. There is also an X-ray cavity toward the NW in Figure 2 that was probably inflated by the same AGN outburst, but no 235 MHz emission was detected within this region above the sensitivity limit in our GMRT observation.
Many other X-ray cavities are also apparent in the unsharp masked image. To determine if the lower surface brightness regions seen in Figure 2 are true AGN-inflated cavities, we extracted tangential surface brightness profiles within the annulus shown in Figure 2 in both a soft and hard energy band (see Figure 3). The NW and SE cavities are both easily identifiable in this figure. The surface brightness depressions within the NW and SE cavities are also more significant in the soft band, indicating that these cavities were produced by the evacuation of the cooler central gas, and not hotter gas at larger radii seen in projection. In contrast, all other apparent cavities seen in Figure 2 have surface brightnesses in both energy bands consistent with the azimuthally averaged surface brightness within the annulus. This result shows that there are only two AGN-inflated cavities on intermediate scales in NGC 5044, probably produced by a single AGN outburst, and that the other apparent X-ray cavities seen in Figure 2 are simply average surface brightness regions surrounded by X-ray bright filaments.
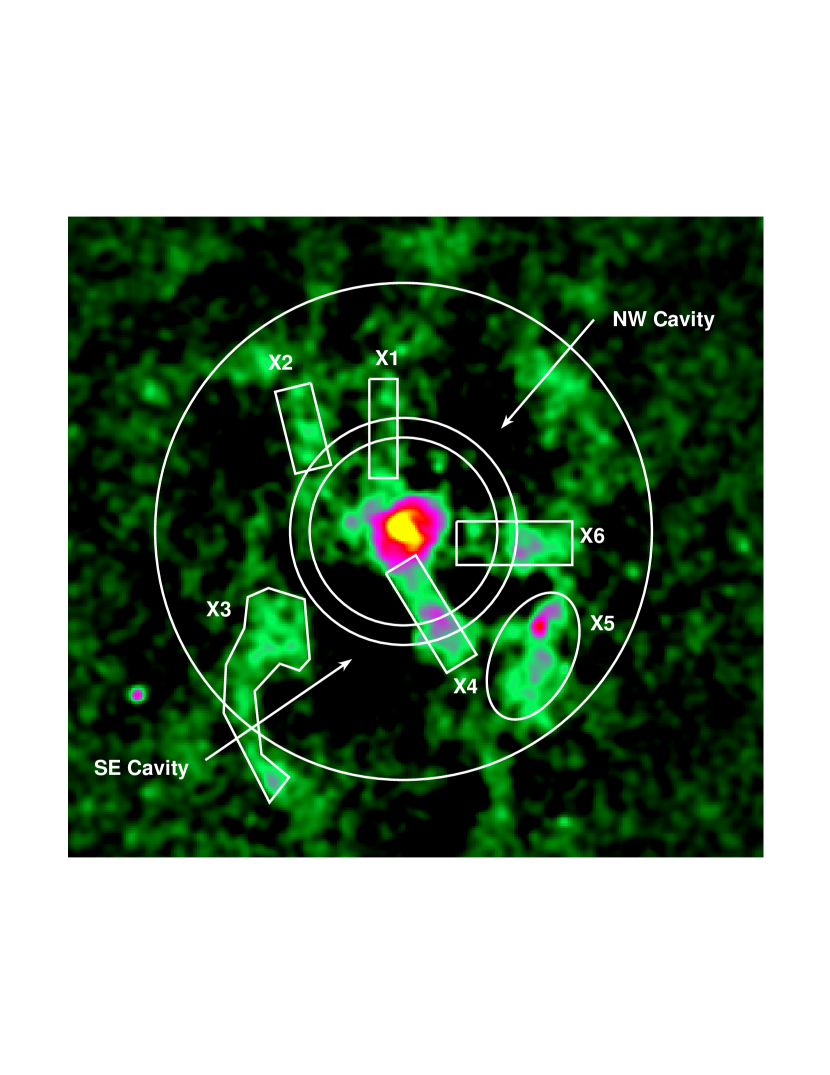
The X-ray bright filaments (X1, X2, X4, and X6) that intersect the annulus shown in Figure 2 are also easily identifiable as enhancements in the surface brightness profiles shown in Figure 3. However, the X1 and X4 filaments are much more pronounced in the soft band than the hard band, while the X2 and X6 filaments show the same enhancement in both energy bands. This suggests that either the X1 and X4 filaments are simply cooler than the X2 and X6 filaments or they contain multiphase gas. A full spectroscopic analysis of the X-ray filaments is presented in .
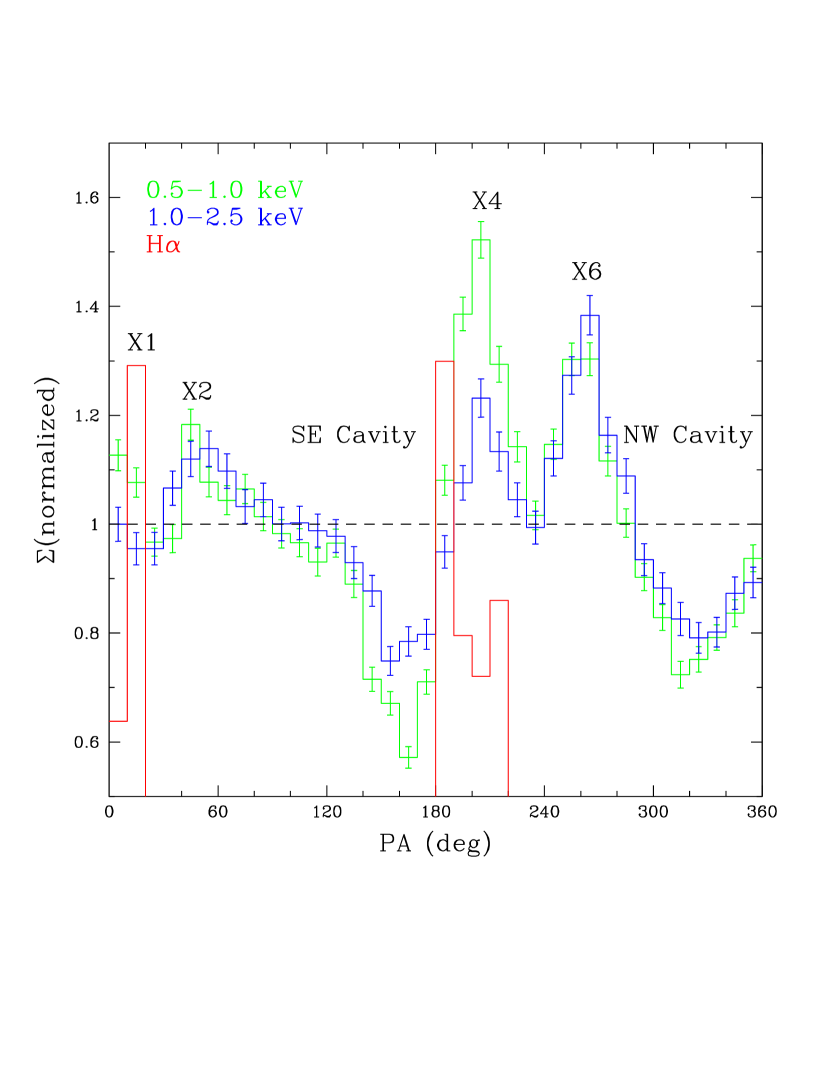
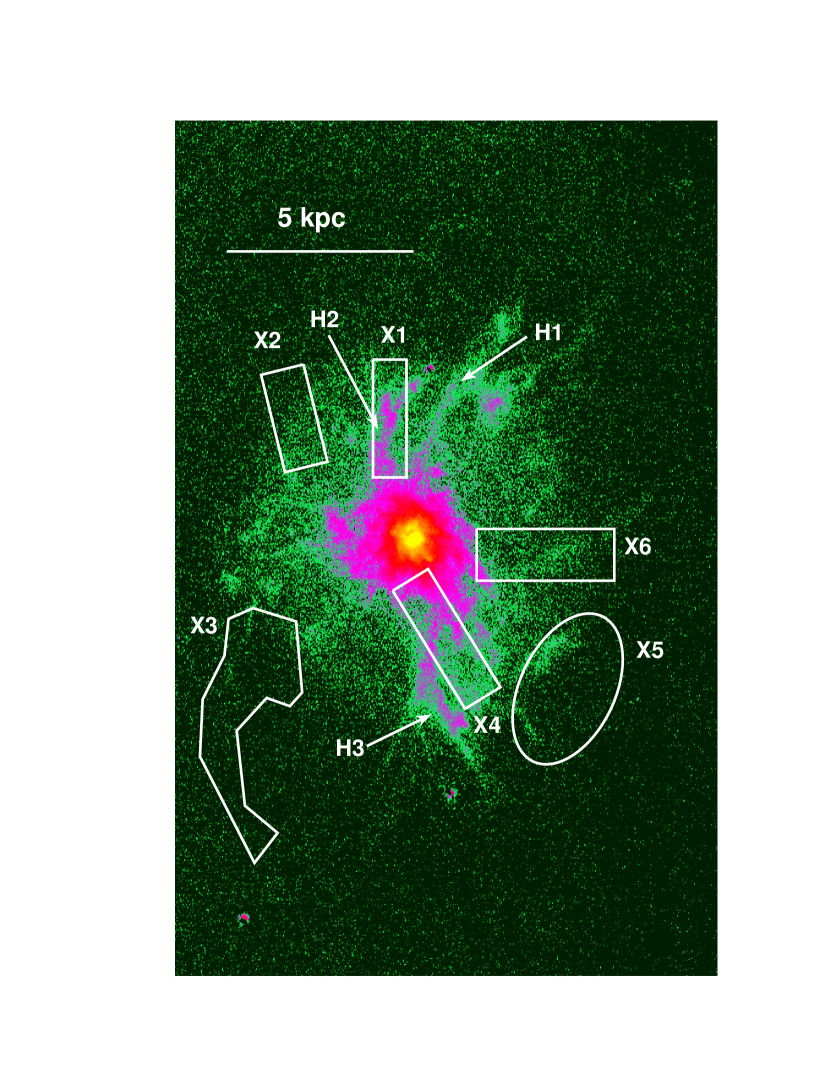
NGC 5044 hosts a very luminous system of H filaments with erg s-1 (Werner et al. 2014). Figure 4 shows a comparison between the X-ray and H filaments. Note that all of the X-ray and H filaments lie in the region between the two largest X-ray cavities. In addition, only the X1 and X4 filaments, which have the softest X-ray spectra, are coincident with extended H filaments, while the remaining X-ray filaments only contain diffuse or very faint filamentary H emission. We also show a comparison between X-ray and H emission in Figure 3 where we include the tangential H surface brightness profile within the same annulus as used for the X-ray data. Only the X1 and X4 filaments are associated with H emission in Figure 3; however, the brightest portion of the H3 filament is slightly offset from the brightest portion of the X4 filament. This is further illustrated in Figure 5 which shows that the H3 filament lies along the interface between the X4 filament and the southeastern cavity.
By combining our deep Chandra observation with archival data, we are able to investigate the central region of NGC 5044 on arcsecond scales, which was not possible with the limited statistics in previous observations. Figure 6 shows a full-resolution raw 0.5-2.0 keV ACIS image of the central region of NGC 5044. Obvious in Figure 6 is a pair of bipolar cavities aligned along a SE-NW direction. The significance of the inner cavities can be estimated by comparing the counts within the cavities with that expected based on the average surface brightness within an annulus that encloses the two cavities. For the NW cavity, the reduction in counts is significant at 4.3, while the reduction in counts in the SE cavity is significant at 4.1. The orientation of the inner pair of bipolar cavities is consistent with the orientation of the central regions of the larger SE and NW cavities, indicating that both AGN outbursts inflated cavities along the same axis.
Our ALMA observation of NGC 5044 showed that the central AGN is a bright continuum source at 230 GHz with a flux density of 55 mJy (David et al. 2014). Since the 230 GHz flux density exceeds the flux density of the central point source at 1.4 GHz (Giacintucci et al. 2011), NGC 5044 may be a less powerful version of GHz-peaked sources (O’Dea 1998), which are thought to be radio galaxies in the early stages of an outburst. While the inner pair of bipolar cavities is probably still being powered by the GHz-peaked AGN, the larger and older SE and NW cavities are no longer being powered and are buoyantly rising within the group potential. The complex large-scale morphology of the southern radio lobe (Giacintucci et al. 2011) probably arises from the sloshing motion of NGC 5044 within the group potential (O’Sullivan et al. 2014). Since the inner cavities are still being powered by the AGN, the age of the most recent AGN outburst can be estimated from the sound crossing time, which gives Myr. Assuming the southern radio lobe is buoyantly rising at its terminal velocity, we obtain Myr for the older AGN outburst.
There is an obvious correlation between the central dust lanes in NGC 5044 (as seen in an HST extinction image), the molecular gas, and the alignment of the inner pair of bipolar cavities (see Figure 7). Temi et al. (2007) suggested that the extended dust emission detected by Spitzer in NGC 5044 resulted from the disruption of a central dusty disk or torus by a recent AGN outburst. The close agreement in alignment between the dust, molecular gas, and X-ray cavities seen in Figure 7 certainly supports this hypothesis. Moreover, there is no kinematical evidence in the ALMA data for a residual molecular disk. However, it is difficult to understand how the inner pair of bipolar cavities could have a dynamical impact on the molecular gas, since the inner cavities cannot dredge up more mass than they displaced, which is approximately . When we assume a galactic conversion factor between and CO ( cm-2 (K km s-1)-1), the total mass of the molecular gas within the inner cavities is , a factor of ten greater than the hot gas mass displaced by the cavities. The dust mass within the filamentary structures seen in Figure 7 is (Temi et al. 2007), which gives an unusually high gas-to-dust mass ratio of 1000 assuming a galactic . The conversion factor is sensitive to many environmental factors (e.g., Bolatto et al. 2013). Assuming a factor ten times less than the galactic value produces a molecular mass consistent with the mass displaced by the cavities and a more reasonable gas-to-dust mass ratio of 100. Thus, the alignment of the molecular gas and cavities gives at least indirect evidence for a lower value of in NGC 5044.
4. Global X-Ray Properties
To fully investigate the thermodynamic state of the X-ray filaments, we need to determine a number of basic properties of the NGC 5044 group, including the gas pressure profile, total mass distribution, gravitational potential, free-fall time, and radiative cooling time. All of these quantities depend on derivations of the gas density and temperature distributions, which is the focus of this section. While azimuthally averaged gas density and temperature profiles have been derived previously from archival chandra data for NGC 5044, we currently have four times the data at our disposal, so it is worth repeating the analysis.
The azimuthally averaged deprojected temperature profile of NGC 5044 is shown in Figure 8. The temperature profile was derived by extracting spectra from all seven ObsIDs in concentric annuli with widths ranging from at small radii to at large radii. The central is excluded from the analysis because of the X-ray emission from the central AGN. The seven spectra extracted from each annulus were then simultaneously fit to an absorbed single-temperature model phabs*apec in XSPEC with the hydrogen column density fixed to the galactic value and the temperature and abundance of heavy elements treated as free parameters. The XSPEC tool projct was used to deproject the spectra. Figure 8 shows that the deprojected temperature profile is well fit with an analytic function given by
| (1) |
which is similar to the temperature profile used by Allen et al. (2001) for the inner region of cooling flows. The best-fit parameters for NGC 5044 are , , and , with fixed at 10.0 kpc. The largest deviation between the data and analytic model occurs around 4 kpc from the central AGN, which coincides with the location of the SE cavity.
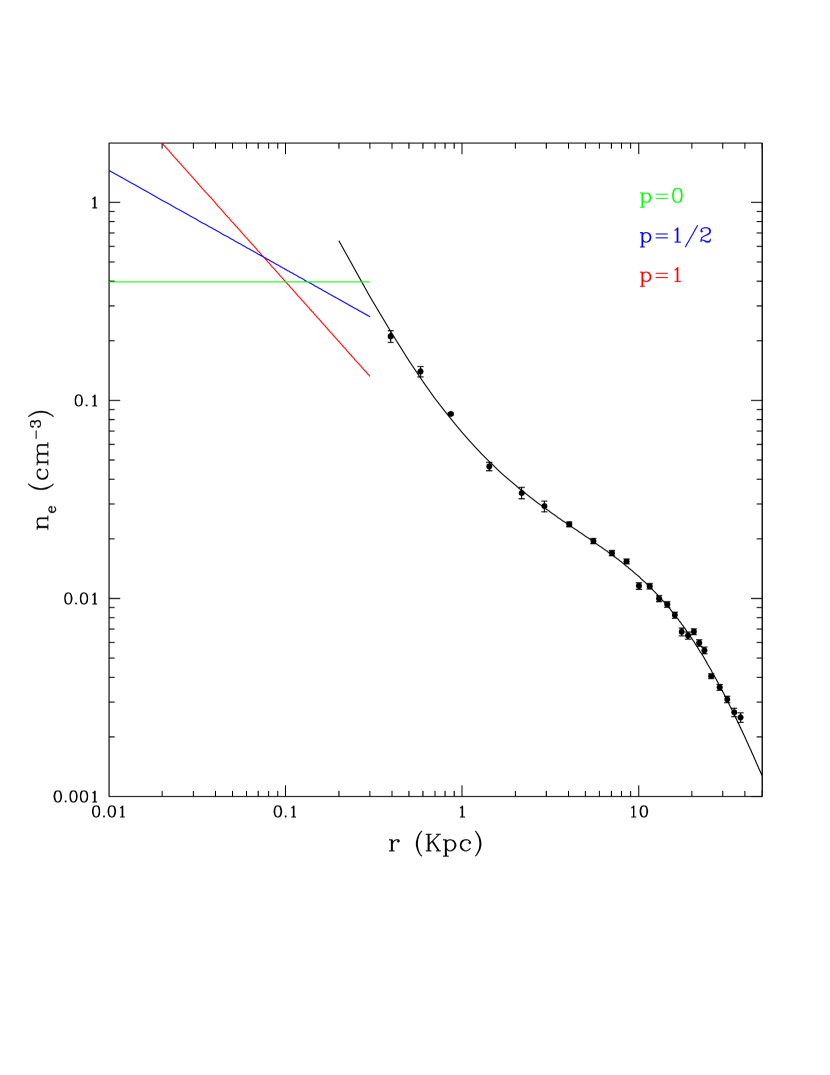
The azimuthally averaged density profile was computed from the best-fit emission measures derived in the deprojected spectral analysis (see Figure 9). We first tried to fit the density profile with an analytic function similar to that used by Sun et al. (2009) and Vikhlinin et al. (2006), but found that an extra power-law component was required to account for the emission within the central few kpcs. Fitting the density profile to a model given by
| (2) |
we derived best-fit values of , , , , , and , with fixed at 1 kpc. Figure 9 shows that between 0.3 and 1.0 kpc. To determine if the density profile at smaller radii follows the same power-law profile, we extracted a spectrum from within the central region and fit the spectrum to an absorbed power-law (to account for the emission from the central AGN) plus thermal model. Assuming a power-law for the density profile (), with p=0, p=1/2, and p=1, we derived the allowed density profiles that would reproduce the observed emission measure (see Figure. 9). This calculation shows that the density profile must flatten within the central 300 pc in order to not exceed the observed emission measure within this region.

5. Where Does the Gas Cool, Exactly?
Many studies, both observational and theoretical, have investigated the criteria that must be met for the central gas in clusters to cool out of hot phase. Observations show that multiphase gas (primarily identified by H emission) and recent star formation are only present in systems with central cooling times shorter than years (Rafferty et al. 2008) or central entropies lower than 30 keV cm2 (Cavagnolo et al. 2008,2009). Voit et al. (2008) showed that these two criteria both result from the competing effects of radiative cooling and thermal conduction. Conduction is unable to suppress radiative cooling in systems with lower entropies based on the Field criterion. In addition, Werner et al. (2014) used the Field criterion to show that [CII] emission, which originates from the photodissociation region surrounding molecular clouds, arises only from groups, including NGC 5044, that have thermally unstable gas over an extended region.
Numerical simulations (McCourt et al. 2012; Sharma et al. 2012; Gaspari et al. 2012,2013,2015; Li & Bryan 2014a,2014b) suggest that a separate criterion that governs the development of a multiphase medium in clusters. These simulations find that perturbations in a globally stable atmosphere (i.e., a balance between heating and cooling over large spatial and temporal scales) only become nonlinear if , where is the isochoric cooling time and is the free-fall time333Some authors use the thermal instability timescale, , instead of . Using the equations in Sharma et al. (2012), we obtain for the average gas temperature in NGC 5044. These studies suggest that the AGN is fueled by the accretion of cold gas, as in Pizzolato & Soker (2005,2010), and not by Bondi accretion of hot gas.
Based on a subsample of ACCEPT clusters with Hα measurements, Voit & Donahue (2015a) found that the entropy and criteria serve as complementary indicators for the presence of multiphase gas in clusters. In a subsequent paper, Voit et al. (2015b) developed a “precipitation” model for the growth of galaxies based on the criterion. However, McNamara et al. (2016) recently claimed that alone was a more reliable indicator for the presence of H emission and star formation than the ratio. The presence of some clusters with short cooling times, but no indications of cooler gas or star formation (e.g., A2029), suggests that an additional process must be present in the cores of clusters to trigger thermal instability. McNamara et al. thus proposed a “stimulated feedback” mechanism that requires the presence of buoyantly rising radio cavities that lift up low-entropy gas as an essential ingredient in the production of molecular gas and star formation. Along the same lines of argument as McNamara et al., Brighenti et al. (2015) presented numerical simulations of NGC 5044 and found that buoyantly rising cavities trigger episodes of enhanced cooling.
Using the deprojected spectroscopic results, we computed within the central 40 kpc of NGC 5044 (see Figure 10). We determined the total gravitating mass and free-fall time (, where is the local acceleration of gravity) assuming hydrostatic equilibrium, and Equations (1) and (2) for the temperature and density profiles of the hot gas. In addition, we also computed the free-fall time assuming an isothermal sphere and the stellar velocity dispersion for NGC 5044, where , as done in other studies (e.g., Gastaldello et al 2009; Voit & Donahue 2015). The Hα filaments in NGC 5044 extend to approximately 8 kpc from the central AGN, mostly in a north-south direction (see Figure 4). Werner et al. (2014) found that the [CII] emission also has a similar extent. Figure 10 shows that the observed 8 kpc extent of the H and [CII] emission corresponds to the radius where attains its minimum value of approximately 12. More sensitive observations could potentially detect more extended H and [CII] emission, but remains lower than 30 within the central 25 kpc, which is three times the observed extent of the H and [CII] emission. Within the central 8 kpc in NGC 5044, the radiative cooling time of the hot gas is shorter than 500 Myr and the entropy, , is lower than 15 keV cm-2. Since NGC 5044 also hosts two pairs of bipolar X-ray cavities, NGC 5044 satisfies all suggested criteria for the presence of multiphase gas. Below we identify the exact location of the thermally unstable multiphase gas.

5.1. Deprojected Two-Temperature Results
While the Hα and [CII] emissions reveal the presence of K and 100 K gas within the central 8 kpc of NGC 5044, a key question is within which radius the X-ray emitting gas is actually cooling. To address this question, we extracted spectra from all seven ObsIDs in concentric annuli beyond from the central AGN with widths of and fit these spectra simultaneously with a deprojected two-temperature thermal apec model with the abundances linked between the two thermal components and the hydrogen column density fixed to the galactic value. The results of the deprojected spectral analysis are shown in Table 2. For spectra extracted beyond (7.8 kpc), the addition of a second temperature component did not produce a statistically significant improvement in the fit above that attained with a single-temperature model. This radius is remarkable similar to the observed extent of the Hα and [CII] emission and the radius where attains its minimum value. Assuming pressure balance between the two thermal components, the volume-filling factor of the cooler component is
| (3) |
where and are the emission measures of the hot and cool components, respectively. For the outer spectra, we fixed the temperature of the cooler component at 0.5 keV to derive 90% upper limits on the emission measure of the cooler thermal component. Figure 11 shows a a sharp transition around 8 kpc between the outer regions, which have , and the inner regions, which have . Table 2 shows that the temperature ratio between the two thermal components is roughly a factor of two, indicating that the mass fraction of the cool component increases up to approximately 20% within the central 1 kpc. This study thus confirms that not only is there multiphase gas in the form of Hα and [CII] emission within the central 8 kpc, but also that this is the region where the X-ray emitting gas is actually cooling out of the hot phase.

| Radii | ||||
|---|---|---|---|---|
| (arcseconds) | (keV) | ( cm-5) | (keV) | ( cm-5) |
| 2-12 | 0.530 (0.483 - 0.549) | 14.6 (13.6 - 16.4) | 0.862 (0.851 - 0.864) | 39.1 (37.5 - 40.9) |
| 12-22 | 0.434 (0.422 - 0.474) | 3.43 (2.82 - 4.19) | 0.861 (0.857 - 0.865) | 19.3 (18.3 - 20.3) |
| 22-32 | 0.439 (0.422 - 0.544) | 4.09 (3.10 - 5.71) | 0.864 (0.858 - 0.874) | 35.5 (34.3 - 36.3) |
| 32-42 | 0.536 (0.391 - 0.572) | 3.82 (2.69 - 5.49) | 0.862 (0.858 - 0.864) | 48.2 (47.4 - 49.6) |
| 42-52 | 0.433 (0.423 - 0.448) | 9.51 (8.12 - 12.6) | 0.873 (0.863 - 0.879) | 60.8 (59.8 - 61.3) |
| 52-62 | 0.5 | 0.881 (0.875 - 0.889) | 92.2 (90.2 - 93.5) | |
| 62-72 | 0.5 | 0.948 (0.945 - 0.954) | 58.0 (56.9 - 59.1) | |
| 72-82 | 0.5 | 0.969 (0.964 - 0.975) | 73.7 (72.0 - 74.7) |
5.2. A Method for Detecting Multiphase Gas
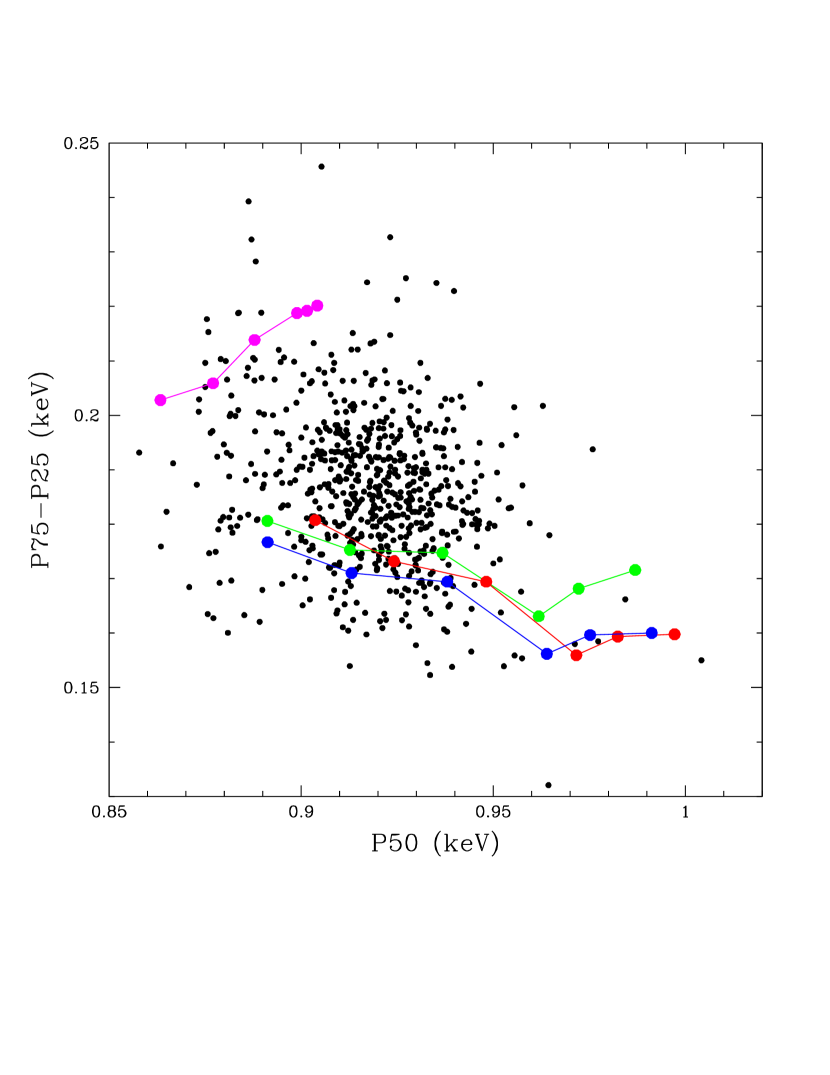
Multi-phase gas can be detected from the width of the blended Fe-L lines, which requires far fewer photons than a full spectral analysis. Most of the X-ray emission from 1 keV groups arises from L-shell transitions from Fe with ionization states between Fe XIX (Ne-like) and Fe XXIV (He-like). With CCD spectral resolution, these L-shell lines are blended into a single feature between approximately 0.7 and 1.2 keV. To calibrate the effect of multiphase gas on the width of the blended Fe-L line, we generated a grid of simulated single- and two-temperature thermal models with a range of temperatures, hydrogen column densities, and abundance of heavy elements. For each simulated spectrum, we computed the 25th, 50th and 75th percentiles in the cumulative photon number distribution between 0.7 and 1.2 keV. Figure 12 shows how the width of the blended Fe-L lines (the difference between the 75th and 25th percentile energies) varies with the median or 50th percentile energy (which is a measure of the emission-weighted temperature) for each simulated spectrum. While there is some trend of increasing Fe-L linewidth with decreasing temperature, all single-temperature models have have fairly narrow linewidths. Varying the abundance of heavy elements and NH also has little effect on the Fe-L linewidth in single-temperature spectra. For the simulated two-temperature models, we set the temperature of the cooler component to one-half of the temperature of the hotter component and fixed the emission measures for the two components so that each thermal component produced the same 0.5-2.0 keV flux. Figure 12 shows that the simulated two-temperature spectra have significantly broader Fe-L linewidths that the single-temperature models for a given median photon energy.
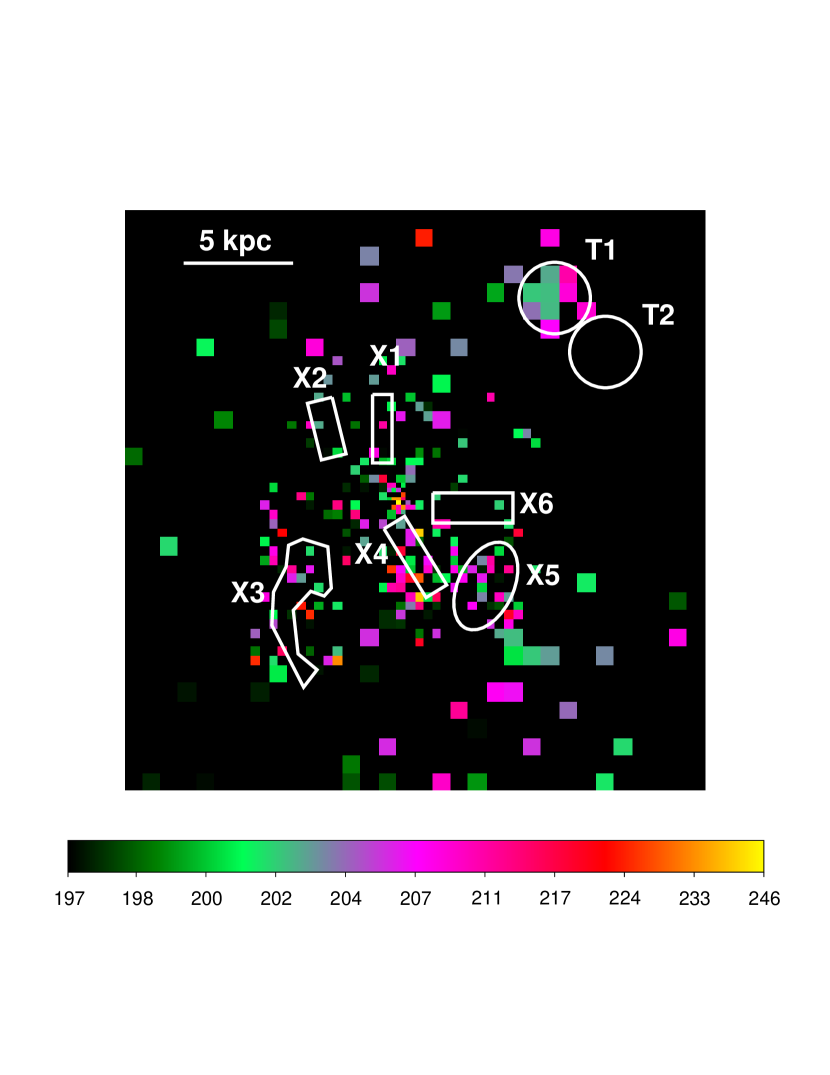
To compare the results of the simulated spectra with the NGC 5044 data, we adaptively binned the ACIS data to a S/N of 30 within the 0.7-1.2 keV energy band and computed the 25th, 50th, and 75th percentile photon energies within each binned region. The resulting values are plotted in Figure 12 and fully span the region between the simulated single- and two-temperature results. Regions containing the highest level of multiphase gas (i.e., Fe-L linewidths greater than 190 eV) are shown in color in Figure 13. Regions with narrower Fe-L linewidths are shown in black in this figure. As seen in Figure 13, the regions with the broadest Fe-L linewidths coincide with the X4 and X5 filaments, and the regions with the narrowest Fe-L linewidths fill the regions between the filaments. Actually, the region containing the greatest degree of multiphase gas lies to the SE of the X4 filament and is coincident with the H3 filament (see Figure 5).
Of interest in Figure 13 is an additional region toward the NW (labeled T1) with a broad Fe-L linewidth. This region is unremarkable in the X-ray image, but lies in the same direction as the NW cavity. Region T1 is well outside of the detected H and [CII] emission and approximately twice as far from the central AGN as the other multiphase filaments. Since region T1 lies along the same direction as the NW cavity, it may contain low-entropy gas that was dredged up by an earlier AGN outburst. A more detailed spectroscopic analysis of the identified multiphase regions is presented below.
5.3. Multiphase Gas in the X-ray and H Filaments
The azimuthally averaged spectroscopic analysis of the ACIS data only shows evidence for multiphase within the central 8 kpc, while the Fe-L linewidth method also detects an additional region at larger radii with multiphase gas. In this section, we perform a detailed spectroscopic analysis of the X-ray filaments and the additional region with a large Fe-L linewidth to determine the exact location of cooling gas and the underlying conditions in these regions. ACIS spectra were extracted from all regions shown in Figures 2 and 13 and fit to absorbed single- and two- temperature thermal models with the hydrogen column density fixed at the galactic value. Other models were also fit to the spectra (e.g., a partial covering model, a variable elemental abundance model, and a charge-exchange model), but none of these models produced a statistically significant improvement in the fit above that attained with a two-temperature model. While the temperature of the gas in the filaments only varies by about 20% (see Table 3), it is clear that the X4 filament is the coolest and highest X-ray surface brightness filament in NGC 5044. We also note that region T1 (broad Fe-L linewidth) is about 10% cooler that the nearby region T2 (narrow Fe-L linewidth) used for comparison. In Table 4 we show the results of fitting a two-temperature thermal model to all the regions shown in Table 3. Since the F-test cannot be used to compare the single- and two-temperature results (Protassov et al. 2002), we generated 1000 simulations of the best-fit single-temperature model for each region shown in Table 3, fit the simulated spectra to single- and two-temperature models, and computed the cumulative distribution of between the single- and two-temperature fits. Only regions with a greater than 95% of the simulations are listed in Table 4. This analysis shows that the X4 and X5 filaments and the T1 region have the greatest fraction of multiphase gas, which is consistent with our Fe-L linewidth diagnostic (see Figure 13).
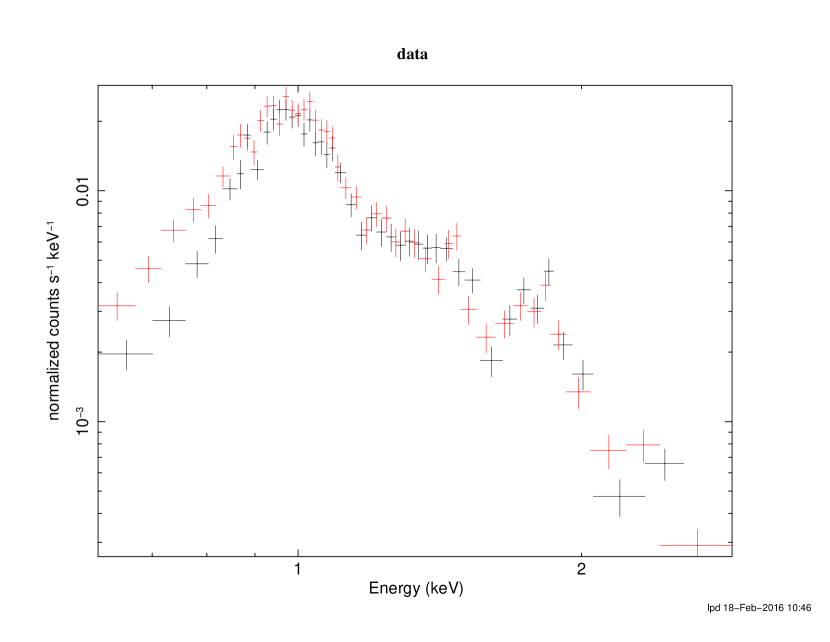
To illustrate the differences between the filaments, we coadded the spectra extracted from the observations between 2015 May and August, during which time there was little change in the ACIS response. A comparison of the coadded spectra for the T1 and T2 regions is shown in Figure 14. Even though these regions are adjacent to one another and show no morphological features, there is clear evidence for a soft excess in region T1. Figure 14 also shows that it is not the case that the gas in region T1 is cooler than the gas in region T2. Above 1 keV, the spectra are essentially the same, indicating that both regions contain ambient gas of the same temperature, but only region T1 contains an additional component of cooler gas.
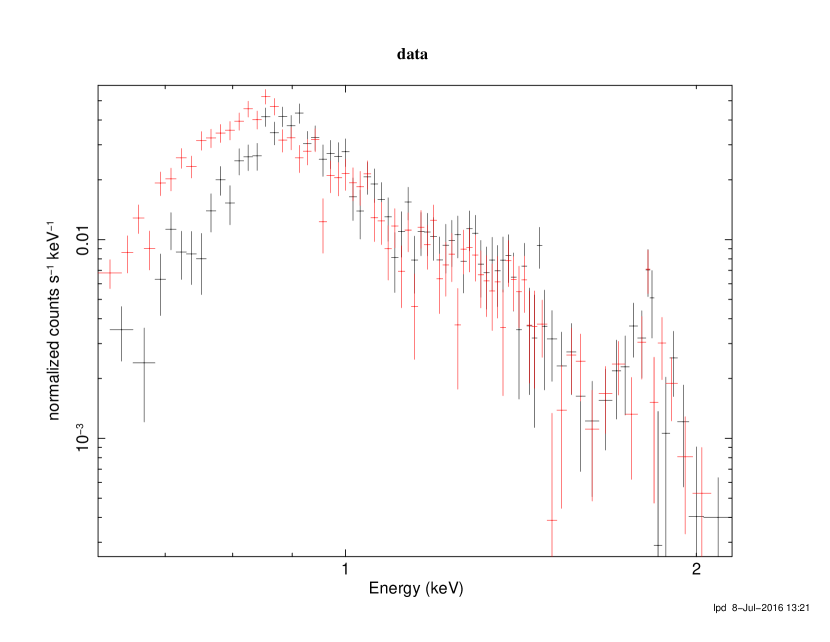
Of particular interest is a comparison between the X6 filament (no evidence for a cooler thermal component and little association with Hα emission) and the X4 filament (strong evidence for cooler gas and significant Hα emission). These two filaments have very similar X-ray morphologies (see Figure 2). A comparison of the coadded spectra from the 2015 observations for the two filaments is shown in Figure 15 after renormalizing the spectra to yield the same 1.5-3.0 keV count rate. Similar to the comparison between regions T1 and T2, the shape of the spectra is nearly identical above 1 keV, but only the X4 filament clearly shows a soft excess, indicative of cooling gas. Using the emission measure from the best-fit single-temperature model and assuming a cylindrical geometry for the X4 and X6 filaments, we find that the cooling times in the X4 and X6 filaments are essentially the same ( years for the X4 filament and years for the X6 filament). Since the two filaments reside at approximately the same distance from the central AGN, the free-fall times are also very similar. Thus, both X-ray filaments have very similar cooling times and free-fall times, but only one contains cooling gas and Hα emission.
| Region | kT | Z | DOF | |
|---|---|---|---|---|
| (keV) | (Z⊙) | |||
| X1 | 0.831 (0.823-0.839) | 0.53 (0.48-0.58) | 268.5 | 234 |
| X2 | 0.903 (0.895-0.912) | 0.64 (0.58-0.72) | 306.2 | 247 |
| X3 | 0.939 (0.934-0.944) | 0.71 (0.67-0.76) | 544.4 | 440 |
| X4 | 0.756 (0.750-0.761) | 0.49 (0.46-0.53) | 447.5 | 364 |
| X5 | 0.823 (0.819-0.828) | 0.60 (0.57-0.64) | 497.3 | 447 |
| X6 | 0.909 (0.903-0.915) | 0.79 (0.73-0.86) | 501.8 | 393 |
| T1 | 1.02 (1.01-1.03) | 0.48 (0.44-0.53) | 240.0 | 192 |
| T2 | 1.14 (1.12-1.16) | 0.70 (0.61-0.80) | 219.6 | 169 |
| Region | kTc | kTh | DOF | |
|---|---|---|---|---|
| (keV) | (keV) | |||
| X4 | 0.543 (0.456-0.601) | 0.776 (0.768-0.783) | 437.2 | 363 |
| X5 | 0.432 (0.395-0.514) | 0.812 (0.807-0.819) | 477.9 | 446 |
| T1 | 0.685 (0.620-0.768) | 1.06 (1.05-1.09) | 227.1 | 191 |
One possible explanation for the differences between the X4 and X6 filaments is that filament X4 contains lower entropy gas that was dredged up by a recent AGN outburst, while filament X6 is composed of gas that is still falling inward. If filament X4 contains dredged-up gas, the abundance of heavy elements in this filament should be enhanced as a result of enrichment from supernovae, while the gas resides within the central galaxy. However, a simple examination of Figure 15 shows that the Si abundance (which is produced by both SNe Ia and SNe II) is very similar between the two filaments. A full spectral analysis also reaches the same conclusion. A comparison of the Fe abundance (which is primarily produced by SNe Ia) would be more informative, but it is very difficult to derive tight constraints on the Fe abundance in multiphase gas with CCD resolution spectra (Buote 1999).
6. Kinematics of Molecular Gas
The observed velocities of the giant molecular associations (GMAs) detected by ALMA can be used to determine their place of origin, assuming the clouds are able to fall unimpeded under the influence of gravity. We computed the gravitational potential of NGC 5044 directly from the best-fit density and temperature distributions given in eqs. (1) and (2) and the assumption of hydrostatic equilibrium. Figure 16 shows the distance over which each of the 24 GMAs must fall radially inward to achieve its observed line-of-sight velocity for a range of inclination angles (i.e., the orientation of the cloud trajectory relative to the plane of the sky with corresponding to motion within the plane of the sky). The required infall distance for a given line-of-sight velocity increases with decreasing inclination angle, since the inferred space velocity increases with decreasing inclination angle. Figure 16 shows that the GMAs can attain their observed velocities through unimpeded gravitational infall over distances of only 0.1-1 kpc. Since we detect multiphase gas out to 15 kpc, unimpeded infall of thermally unstable clouds is essentially ruled out. If the kinematics of the GMAs are gravitational in origin, then the cooling clouds must be pinned to the hot gas, possibly by magnetic fields, or experience significant drag during most of the cooling process.
It is interesting to compare our results with a study of the molecular gas in PKS 0745-191 by Russell et al. (2016). Even though NGC 5044 is a group and PKS 0745-191 is a massive cluster, the central dominant galaxies in these two systems have very similar gravitating masses of within 30 kpc (David et al. 2009; Sanders et al. 2014). However, PKS 0745-191 has clear X-ray cavities exterior to the molecular gas, while NGC 5044 shows no evidence for X-ray cavities beyond the ends of X-ray and H filaments. In addition, the cavity power in PKS0724-191 is a factor of 1000 times greater than that in NGC 5044 (David et al. 2009). The ALMA observation of the central galaxy in PKS 0745-191 reveals three molecular filaments with systemic velocities lower than 100 km s-1 and FWHMs for the CO(1-0) and CO(3-2) lines smaller than 150 km s-1 (Russell et al. 2016). For comparison, the FWHM of the CO(2-1) line derived from the IRAM 30m observation of NGC 5044 is 220 km s-1 (David et al. 2014). Based on the observed velocities, Russell et al. conclude, as we do for NGC 5044, that the velocities of the molecular structures are too low to be produced by uninhibited gravitational infall. They suggest that the molecular gas arises from in situ cooling of warm gas dredged up by the AGN-inflated cavities. While we both arrive at similar conclusions regarding the influence of gravity on the kinematics of the molecular gas, it is interesting that the FWHM of the CO line in NGC 5044 is broader than that in PKS0724-191, even though the cavity power in NGC 5044 is a factor of 1000 times lower than the cavity power in PKS0724-191.
There is no evidence for an extended component of CO emission associated with the X-ray or radio cavities in NGC 5044, unlike the case in the Phoenix cluster (z=0.596), where the CO emission drapes the two large X-ray cavities (Russell et al. 2017). This could simply be due to the large contrast in spatial scales that are sampled by the ALMA data. Interferometric observations are only sensitive to emission over a limited range of angular scales. Our cycle 0 ALMA data had a beam size of (300 pc) and a maximum recoverable size (MRS) of (1.3 kpc), while the ALMA data presented in Russell et al. (2017) had a beam size of (4 kpc). Thus, our ALMA data are insensitive to molecular structures on the same scales as those detected in the Phoenix cluster. It may be that the more extended and diffuse CO emission detected in the Phoenix cluster is molecular gas that was recently uplifted or cooled in situ in the wake of the X-ray cavities, as argued in Russell et al. (2017), and the molecular structures detected by ALMA in NGC 5044 are more evolved structures that have since decoupled from the hot gas.
Unlike the molecular gas in NGC 5044, the velocity dispersions of the 100 K gas (as seen in [CII]) and K gas (as seen in H ) are much greater. Hamer et al. (2016) measured a FWHM for the H emission of 457 km s-1 in NGC 5044, which is a fairly typical FWHM for the 73 clusters in their sample. Werner et al. (2014) presented the results of a [CII] study of six cooling flow groups using Herschel data. While Werner et al. do not list the FWHM of the [CII] line in NGC 5044, the [CII] velocity dispersion obtained from their velocity dispersion map (Figure 4 in Werner et al.) is about km s-1, which gives a FWHM for the [CII] line of 420 km s-1. Thus, both the H and [CII] emitting gas have significantly greater velocity dispersions than the CO emitting gas. The broad [CII] emission line is particularly hard to understand, since [CII] emission originates in the photodissociation region surrounding molecular clouds.

7. Discussion
As discussed above, several criteria have been suggested for the onset of cooling in the central region of clusters, including the central cooling time, the central entropy, the ratio of the cooling time to the free-fall time, and the presence of X-ray cavities that dredge up low-entropy gas. The NGC 5044 group satisfies all these criteria. Since we only present the results for a single object, we cannot shed light on which of these criteria is the fundamental requirement for the production of cold gas, but we can shed light on exactly where the gas does cool and which conditions prevail in these regions.
An azimuthally averaged analysis of the X-ray emission from the NGC 5044 group shows that the hot gas is thermally unstable, based on the empirical evidence for multiphase gas, within the central 8 kpc. This radius coincides with the extent of the H and [CII] emission and the minimum value of . A more spatially resolved analysis shows that only a small fraction of the gas within the central 8 kpc is thermally unstable. Based on the Fe-L linewidth, which is a good diagnostic for multiphase gas, coupled with a detailed spectroscopic analysis of selected regions, the bulk of the multiphase gas is confined to the filamentary X-ray structures.
A spectroscopic analysis of the X-ray filaments shows that they display a variety of properties. The X-ray filaments X2, X3, and X6 contain gas that is cooler than the ambient gas, but there is no evidence of a soft X-ray excess or any association with H filaments. The X-ray filament X5 shows evidence of a soft X-ray excess but there is only some faint diffuse H emission coincident with the filament. The X-ray filament X4 has the most significant soft X-ray excess and is also coincident with the brightest H filament. Thus, the differences between the X-ray filaments might simply reflect the evolution of thermally unstable gas from the initial production of a cool filament, to the development of a soft X-ray excess, and finally to the production of lower ionization gas. The only exception to this scenario is filament X1, which does not show any evidence of a soft X-ray excess, but is coincident with an Hα filament. However, filament X1 has the poorest photon statistics of any filament, so this could just be a sensitivity issue.
Other than in situ cooling, the X-ray filaments could result from the dredge up of lower entropy gas, but there is no evidence of any AGN-inflated cavities external to the filaments. In fact, the filaments are confined to the regions between the largest X-ray cavities, which were likely inflated by an AGN outburst about 13 Myr ago. Another possible method for dredging up lower entropy gas is through AGN-induced turbulence. Even though there are no obvious X-ray cavities exterior to any of the X-ray or H filaments in NGC 5044, the buoyantly rising cavities may drive turbulence throughout the central region. In NGC 5044, it is possible that the X-ray filaments are uplifted lower entropy gas within the turbulent eddies.
The kinetic energy within any AGN-induced turbulence will eventually be dissipated as heat at a rate per unit volume given by
| (4) |
Here is the gas density, is the turbulent velocity, is the length scale of the eddies and (Dennis & Chandran 2005). To balance radiative cooling within the central 2 kpc (the region covered by ALMA) by the dissipation of turbulent kinetic energy requires a turbulent velocity of
| (5) |
| Region | ne | S | |||
|---|---|---|---|---|---|
| (cm-3) | () | (yr) | () | (keV cm-2) | |
| X1 | 0.031 | 0.038 | 7.0 | ||
| X2 | 0.024 | 0.029 | 9.6 | ||
| X4 | 0.041 | 0.13 | 5.3 | ||
| X5 | 0.040 | 0.12 | 5.8 | ||
| X6 | 0.033 | 0.10 | 8.3 |
The only measurement of the turbulent velocity in a cluster is the Hitomi XRS observation of the Perseus cluster, which detected small-scale ( 10 kpc) motions with a velocity dispersion of 164 km s-1 (Hitomi Collaboration 2016). This observed level of turbulence is very similar to the level required to balance radiative cooling in the core of NGC 5044. It is also interesting to note that the turbulent velocity required to balance radiative cooling is similar to the observed velocity dispersion of the GMAs in NGC 5044. As noted above, the observed velocities of the GMAs are inconsistent with unimpeded gravitational infall over distances of more than 1 kpc. Thus, it is possible that thermally unstable gas remains pinned to the ambient hot gas during most of the cooling process, possibly by magnetic fields, as suggested for the H filaments in the Perseus cluster by Fabian et al. (2008), and the observed velocity dispersion of the GMAs primarily reflects the level of turbulence in the hot gas. This scenario does not require that the GMAs are still pinned to the hot gas, only that the coldest gas recently decoupled from the hot gas.
A summary of the basic properties of the X-ray filaments is given in Table 5, excluding the filament X3, which has a complex geometry. The gas density and mass within each filament were computed from the emission measure of the best-fit single-temperature model along with an assumed geometry for each region: (1) cylindrical symmetry for filaments X1, X2, X4, and X6; and (2) prolate spheroidal symmetry for filament X5. Figure 13 shows that these filaments contain the majority of the multiphase gas based on the Fe-L linewidth diagnostic. The individual masses of the X-ray filaments vary by a factor of three with an average mass of and a total mass of . The cooling times are also very similar with an average cooling time of yr. The mass-cooling rates within the filaments vary between 0.04-0.13 yr-1 with a total mass-cooling rate of 0.54 yr-1. The inclusion of gas cooling within the X3 filament would only increase this estimate by about 20%. It is interesting to note that the combined mass-cooling rate within the multiphase gas detected with the Fe-L linewidth diagnostic is approximately 10% of the classical mass-cooling rate within 8 kpc (within which the cooling time is shorter than 1 Gyr).
For comparison, the mean mass of the 24 GMAs detected by ALMA is . Thus, each filament is capable of cooling and fragmenting into tens of molecular structures with masses comparable to those observed. The combined mass of the 24 molecular structures detected in the ALMA data is , but the integrated CO(2-1) flux in the IRAM 30m observation of NGC 5044 is approximately three times the integrated CO(2-1) flux of the 24 molecular structures detected in the ALMA data. The discrepency between the single-dish and interferometric observations is probably due to the presence of diffuse emission on scales greater than the scales sampled by the ALMA observation. Based on the CO(2-1) IRAM 30m observation of NGC 5044, the total molecular mass in NGC 5044 is approximately . Assuming the molecular gas is supplied by gas cooling within the multiphase filaments, the supply time for the molecular gas is years.
The star formation rate in NGC 5044 is 0.07 yr-1 (Werner et al. 2014), which is approximately 13% of the mass-cooling rate, or equivalently, . For comparison, Rafferty et al. (2006) derived mass-cooling rates for a sample of CDGs in cooling flows through a spectroscopic analysis of ACIS data using the isobaric cooling flow model MKCFLOW and found an average value of of about four, but with values up to 20 for systems with low rates of star formation like NGC 5044. Molendi et al. (2016) recently presented a spectroscopic analysis using the MKCFLOW model for a sample of BCGs with very high star formation rates, and in all cases, only obtained upper limits on the mass-cooling rates and values as low as 0.1. Molendi et al. discuss several possibilities for their result, including the possibility of a delay between the peak mass cooling and star formation rates.
Within molecular clouds, star formation is suppressed by magnetic fields, turbulence, and stellar feedback (i.e., supernovae and stellar winds), which prevents most of the molecular gas from forming stars. Assuming that one Type II supernova (SNe II) is produced for every 100 consumed into stars and that every supernova produces erg, we derive a SNe II heating rate of erg s-1 in NGC 5044. This SNe II heating rate can only reheat the observed molecular gas up to K. Thus, SNe II heating, by itself, is not sufficient to reheat the molecular gas that is not consumed into stars up to X-ray emitting temperatures. There must therefore be a two-stage feedback mechanism operating within the center of NGC 5044 where molecular gas that is not consumed into stars is reheated to K by SNe II and then some of this gas mixes with the hot gas and is reheated to keV by AGN-feedback, while some gas re-cools and forms a subsequent generation of molecular structures.
Our deep Chandra observation of NGC 5044 shows that the central AGN has undergone only two outbursts over the past years based on the presence of two pairs of nearly bipolar X-ray cavities. In David et al. (2009) we argued that the AGN had undergone multiple weak outbursts in the recent past. This conclusion was based on the view that all of the central depressions in the X-ray surface brightness were AGN-inflated cavities. A more detailed analysis of the deeper Chandra data shows that these apparent depressions are simply regions of average surface brightness located between X-ray bright filaments.
8. Summary
Our main focus in this paper has been to identify the hot gas responsible for the production of the observed atomic and molecular gas in the center of NGC 5044. Based on the Fe-L linewidth technique, most of the multiphase thermally unstable gas in NGC 5044 is contained within the X-ray filaments. Unlike some other groups and clusters, which show obvious connections between cooler gas and AGN-inflated cavities, the X-ray filaments in NGC 5044 are predominately located between the largest X-ray cavities. Given the existing data, it is difficult to distinguish between in situ cooling or enhanced cooling within low-entropy gas that has been dredged up by AGN-induced turbulence without more detailed information about the kinematics and abundances of the gas within the X-ray filaments.
While the cooling times, entropy, and free-fall times of the gas within the X-ray filaments are very similar, the deep Chandra observation of NGC 5044 shows that the X-ray spectra and association with H emission vary significantly between the filaments. The variety of observed properties among the X-ray filaments can be explained as an evolutionary sequence. Of the six X-ray filaments, three do not show evidence of a soft X-ray excess or any correlation with H filaments. It is likely that these three filaments just recently began to cool out of the hotter ambient gas. One X-ray filament exhibits a soft X-ray excess, but only contains some diffuse H emission, while another X-ray filament shows a strong soft X-ray excess and is coincident with the brightest H filament. Thus, there is a general evolutionary sequence from the production of a cool X-ray filament to the development of a soft X-ray excess to the production of atomic gas. However, even in the most evolved filament, X4, there is an offset between the coolest X-ray emitting gas and the brightest portions of the H filament.
Our cycle 0 ALMA observation only covered the central 2 kpc of NGC 5044, so we cannot make a detailed comparison between the X-ray filaments and the molecular gas, but the observed low velocities of the molecular structures suggest that most of the cooling took place while the gas was prevented from freely falling through the gravitational potential of NGC 5044, possibly as a result of the effects of drag or magnetic support. The offset between the X4 and H filaments shows that the cooling gas eventually detaches from the hotter gas. Without an extended free-fall period, the observed velocity dispersion of the molecular structures, 120 km s-1, should reflect the level of turbulence in the hot gas from which it originated. The turbulent velocity required to balance radiative cooling with the dissipation of turbulent kinetic energy within the central 2 kpc of NGC 5044 is 150 km s-1. This calculation certainly suggests that the dissipation of AGN-induced turbulence can prevent the bulk of hot gas from cooling within the central region of NGC 5044. As noted above, the H and [CII] linewidths are significantly greater than the CO linewidth, but the linewidths for the warmer gas are computed over a larger region. We were awarded a cycle 4 ALMA observation that will mosaic the central 5 by 5 kpc region of NGC 5044, from which we can make a more direct comparison between the hot, atomic, and molecular gas.
The mass-cooling rate within the X-ray filaments is approximately 10% of the classical mass-cooling rate and eight times the observed star formation rate. Based on the mass-cooling rate within the X-ray filaments, the molecular gas can be supplied in approximately years. The discrepancies between the classical mass-cooling rate and the star formation rate can only be reconciled with a two-stage feedback mechanism in which AGN-heating prevents approximately 90% of the hot gas from cooling to molecular gas, and stellar feedback prevents 80-90% of the molecular gas from forming stars. The required star formation efficiency in NGC 5044 is typical of that observed in star forming galaxies. An estimate of the Type II supernova heating rate based on the observed star formation rate shows that stellar feedback can only heat the molecular gas not consumed into stars to about K. Further heating by AGN-feedback is required to reheat any residual molecular gas to X-ray emitting temperatures.
This work was supported in part by NASA grant GO5-16135X. We would like to acknowledge some very informative conversations we had with Paul Nulsen, Grant Tremblay, and Sebastian Heinz concerning the AGN-feedback mechanism and the production of cold gas in cooling flows.
References
- (1) Allen, S. W., Schmidt, R. W., & Fabian, A. C. 2001, MNRAS, 328, L37.
- (2) Blanton, E., Sarazin, C. & McNamara 2003, ApJ, 585, 227.
- (3) Bolatto, A., Wolfire, M. & Leroy, A. 2013, ARA&A, 51, 207.
- (4) Brighenti, F., Mathews, W., Temi, P. 2015, ApJ, 802, 118.
- (5) Buote, D. 1999, MNRAS, 309, 685.
- (6) Buote, D., Lewis, A., Brighenti, F. & Mathews, W. 2003, ApJ, 594, 741.
- (7) Cavagnolo, K. W., Donahue, M., Voit, G. M. & Sun, M. 2008, ApJ, 683, L107.
- (8) Cavagnolo, K. W., Donahue, M., Voit, G. M. & Sun, M. 2009, ApJS, 182, 12.
- (9) Combes, F., Young, L. & Bureau, M. 2007, MNRAS, 377, 1795.
- (10) David, L., Nulsen, P., McNamara, B., Forman, W., Jones, C., Ponman, T., Robertson, B., Wise, M. 2001, ApJ, 557, 546.
- (11) David, L., Jones, C., Forman, W., Nulsen, P., Vrtilek, J., O’Sullivan, E., Giacintucci, S. & Raychaudhury, S. 2009, ApJ, 705, 624.
- (12) David, L., O’Sullivan, E.,Jones, C., Giacintucci, S., Vrtilek, J., Raychaudhury, S., Nulsen, P., Forman, W., Sun, M. & Donahue, M. 2011, ApJ, 728, 162.
- (13) David, L., Lim, J., Forman, W. et al. 2014, ApJ, 792, 94.
- (14) Dennis, T. & Chandran, B. 2005, ApJ, 622, 205.
- (15) Edge, A. 2001, MNRAS, 328, 762.
- (16) Fabian, A.C., Nulsen, P.E.J., & Canizares, C. 1984, Nature, 310, 733.
- (17) Fabian, A., Sanders, J, Allen, S., Crawford, C., Iwasawa, K., Johnstone, R., Schmidt, W. & Taylor G. 2003a, MNRAS, 344, 43.
- (18) Fabian, A.C., Johnstone, R., Sanders, J., Conselice, C., Crawford, C., Gallagher, J., & Zweibel, E. 2008, Nature, 545, 7207.
- (19) Forman, W., Jones, C., Churazov, E. et. al. 2007, ApJ, 665, 1057.
- (20) Gaspari, M., Ruszkowski, M. & Sharma, P. 2012, ApJ, 746, 94.
- (21) Gaspari, M., Ruszkowski, M. & Oh, S. Peng 2013, MNRAS, 432, 3401.
- (22) Gaspari, M., Brighenti, F. & Temi, P. 2015, A&A, 579, 18.
- (23) Gastaldello, F., Buote, D., Temi, P., Brighenti, F., Mathews, W. & Ettori, S. 2009, ApJ, 693, 43.
- (24) Gastaldello, F.,Di Gesu, L., Ghizzardi, S., Giacintucci, S., Girardi, M., Roediger, E., Rossetti, M., Brighenti, F., Buote, D., Eckert, D., Ettori, S., Humphrey, P. & Mathews, W. 2013, ApJ, 770, 56.
- (25) Gebhardt, K., Kormendy, J., Ho, L., Bender, R., Bower, G., Dressler, A., Faber, S., Filippenko, A., Green, R., Grillmair, C., Lauer, T., Magorrian, J., Pinkney, J., Richstone, D. & Tremaine, S. 2000, ApJ, 543, L5.
- (26) Giacintucci, S., O’Sullivan, E., Vrtilek, J., David, L., Raychaudhury, S., Venturi, T., Athreya, R., Clarke, T., Murgia, M., Mazzotta, P., Gitti, M., Ponman, T., Ishwara-Chandra, C., Jones, C. & Forman, W. 2011, ApJ, 732, 95.
- (27) Hamer, S., Edge, A., Swinbank, A., Wilman, R., Combes, F., Salome P., Fabian, A., Crawford, C., Russell, H., Hlavacek-Larrondo, J., McNamara, B. & Bremer, M. 2016, MNRAS, 460, 1758.
- (28) Hitomi Collaboration 2016, Nature, 535, 117.
- (29) Li, y. & Bryan, G. 2014a, ApJ, 789, 54.
- (30) Li, y. & Bryan, G. 2014b, ApJ, 789, 153.
- (31) Magorrian, J., Tremaine, S., Richstone, D., Bender, R., Bower, G., Dressler, A., Faber, S. Gebhardt, K., Green, R., Grillmair, C., Kormendy, J. & Lauer, T. 1998, AJ, 115, 2285.
- (32) Molendi, S., Tozzi, P., Gaspari, M., De Grandi, S., Gastaldello, F., Ghizzardi, S. & Rossetti, M. 2016, A&A, 595, 123.
- (33) McCourt, M., Sharma, P., Quataert, E. & Parrish, I.J. 2012, MNRAS, 419, 3319.
- (34) McNamara, B., Wise, M., Nulsen, P. E. J. et al. 2000, ApJ, 534, 135.
- (35) McNamara, B. & Nulsen, P. 2011, ARAA, 45, 117.
- (36) McNamara, B., Russell, H., Nulsen, P. E. J. et al. 2014, ApJ, 785, 44.
- (37) McNamara, B., Russell, H., Nulsen, P., Hogan, M., Fabian, A., Pulido, F. & Edge, A. 2016, ApJ, 830, 79.
- (38) O’Dea, C. 1998, PASJ, 110, 493.
- (39) O’Sullivan, E., David, L. & Vrtilek, J. 2014, MNRAS, 437, 730.
- (40) Panuzzo, P., Rampazzo, R., Bressan, A., Vega, O., Annibali, F., Buson, L. M., Clemens, M. S. & Zeilinger, W. W. 2011, A&A, 528, A10.
- (41) Pizzolato, F., & Soker, N. 2005, ApJ, 632, 821.
- (42) Pizzolato, F., & Soker, N. 2010, MNRAS, 408, 961.
- (43) Peterson, J. & Fabian, A. 2006, Phys. Rep., 427, 1.
- (44) Protassov, R., van Dyk, D., Connors, A., Kashyap, V. & Siemiginowska, A. 2002, ApJ, 571. 545.
- (45) Quillen, A., Zufelt, N., Park, J. et al. 2008, ApJSuppl, 176, 39.
- (46) Rafferty, D., McNamara, B. Nulsen, P. & Wise, M. 2006, ApJ, 652, 216.
- (47) Rafferty, D., McNamara, B. & Nulsen, P. 2008, ApJ, 687, 899.
- (48) Rostislav, P., van Dyk, A., Connors, A., Kashyap, V. & Siemiginowska, A. 2002, ApJ, 571, 545.
- (49) Russell, H., McNamara, B., Edge, A. C. et al. 2014, ApJ, 784, 78.
- (50) Russell, H., McNamara, B., Fabian, A. C. et al. 2016, MNRAS, 458, 3134.
- (51) Russell, H., McDonald, M., McNamara, B. et al. 2017, ApJ, 836, 130.
- (52) Salome, P. & Combes, F. 2003, A&A, 412, 657.
- (53) Sanders, J., Fabian, A. C., Hlavacek-Larrondo, J., Russell, H., Taylor, G., Hofmann, F., Tremblay, G. & Walker, S. 2014, MNRAS, 444, 1497.
- (54) Sharma, P. McCourt, M., Quataert, E. & Parrish, I.J. 2012, NNRAS, 420, 3174.
- (55) Sun, M., Voit, G. M., Donahue, M., Jones, C., Forman, W. & Vikhlinin, A. 2009, ApJ, 693, 1142.
- (56) Temi, P., Brighenti, F. & Mathews, W. 2007, ApJ, 666, 222.
- (57) Tonry, J., Dressler, A., Blakeslee, J., Ajhar, E., Fletcher, A., Luppino, G., Metzger, M. & Moore, C. 2001, ApJ, 546, 681.
- (58) Vikhlinin, A., Kravtsov, A., Forman, W., Jones, C., Markevitch, M., Murray, S. S. & Van Speybroeck, L. 2006, ApJ, 640, 691.
- (59) Voit, G. M., Cavagnolo, K. W., Donahue, M., Rafferty, D. A., McNamara, B. R., Nulsen, P. E. J. 2008, ApJ, 681, 5.
- (60) Voit, G. M. & Donahue, M. 2015a, ApJ, 799, L1.
- (61) Voit, G. M., Bryan, G., O’Shea, B., Donahue, M. 2015b, ApJ, 808, L30.
- (62) Werner, N., Oonk, J., Sun, M. et al. 2014, MNRAS, 439, 2291.
- (63) Young, L., Bureau, M., Davis, T. et al. 2011, MNRAS, 414, 940.