Tracking System Behavior from Resource Usage Data
Abstract
Resource usage data, collected using tools such as TACC_Stats, capture the resource utilization by nodes within a high performance computing system. We present methods to analyze the resource usage data to understand the system performance and identify performance anomalies. The core idea is to model the data as a three-way tensor corresponding to the compute nodes, usage metrics, and time. Using the reconstruction error between the original tensor and the tensor reconstructed from a low rank tensor decomposition, as a scalar performance metric, enables us to monitor the performance of the system in an online fashion. This error statistic is then used for anomaly detection that relies on the assumption that the normal/routine behavior of the system can be captured using a low rank approximation of the original tensor. We evaluate the performance of the algorithm using information gathered from system logs and show that the performance anomalies identified by the proposed method correlates with critical errors reported in the system logs. Results are shown for data collected for 2013 from the Lonestar4 system at the Texas Advanced Computing Center (TACC).
Index Terms:
Tensor Analysis, Feature Extraction, HPC, performance monitoring, anomaly detectionI Introduction
Modern high performance computing (HPC) systems play a critical role in advancing scientific and engineering research. Given the high costs associated with the operation of such systems, it is vital that they are utilized as efficiently as possible. System level monitoring plays an important role in understanding the performance of such systems to ensure smooth and efficient operations.
Several tools exist for collecting and visualizing resource usage data from large scale HPC installations (e.g. Texas Advanced Computing Center TACC_Stats [5], XSEDE Metrics on Demand or XDMoD [17], etc.). Such tools can produce large amounts of high dimensional resource usage data at a high temporal frequency for each computational node. The data collected by such tools provides a real-time view of the performance of the system and can be analyzed to identify system performance anomalies.
Existing methods typically monitor each system resource or state for every compute node independently for potential deviations or anomalies [18], relying on a pre-defined threshold. Such methods can identify only those anomalous scenarios in which an individual node exhibits significant deviation for individual resources. These methods often miss anomalies that are under the threshold. Such anomalies, are weakly manifested across several nodes and multiple system resources and can be potentially detected by understanding the interactions between the different aspects of the system.
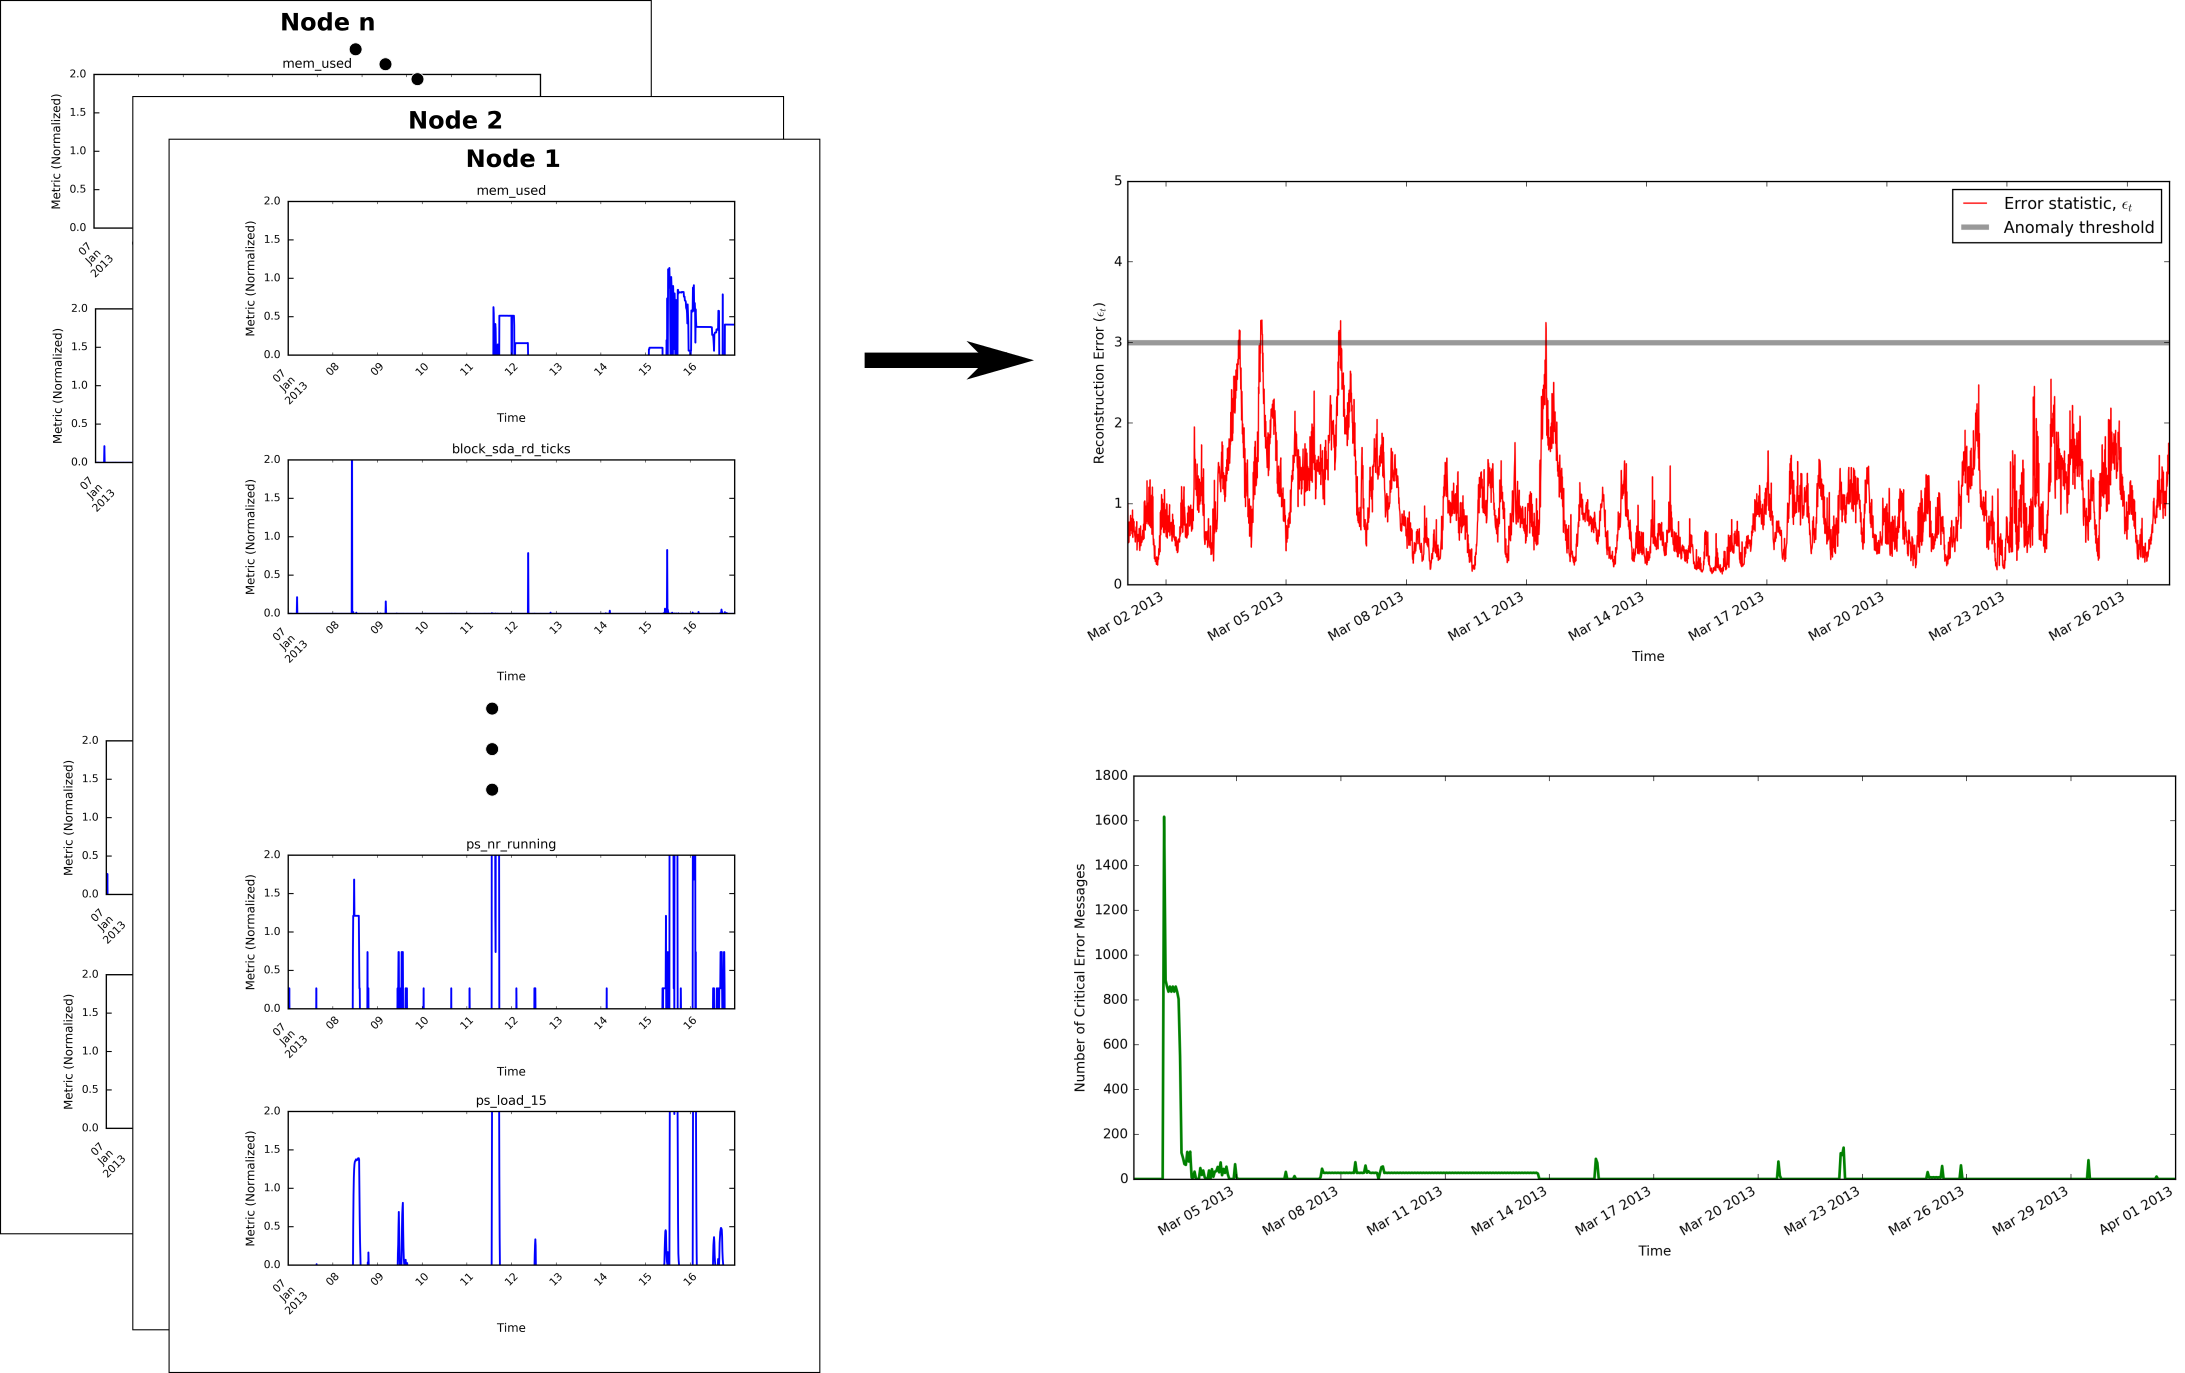
We present a method that operates on resource usage data, such as hardware performance counters, filesystem operational counts, network device usage, etc., to produce a single error metric, that can be used to track the peformance of the HPC system over time. In particular, the method models the multi-dimensional resource usage metrics available for the entire system, as a three way tensor (a generalization of a two-way matrix), as shown in Figure 1. The three dimensions of the tensor correspond to the compute nodes, performance metrics associated with system resources (cpu load, memory usage, etc.), and time. We argue that the behavior of an HPC system will exhibit correlations across the different dimensions, at least within a short temporal neighborhood. Hence, the tensor representing the resource usage data can be reasonably represented using a lower rank tensor approximation.
Similar arguments have been posed in the area of network anomaly detection, where the data is typically modeled as a 2-way matrix, instead of a tensor [11]. We empirically demonstrate the correlations in the resource usage data and show how a significantly lower rank approximation of the tensor can capture most of the information in the original tensor. Moreover, we observe that the residual information, or the residual error, is reasonably stable under the assumption of normal system behavior.
We base our algorithm on the key assumption that when the system is exhibiting anomalous behavior, in terms of performance, the residual error can be used as an indicator for the anomaly. The overall methodology for identifying performance anomalies is illustrated in Figure 2. The method combines the multi-dimensional, multi-node, resource usage data into a univariate error time series. This error time series can be used as an anomaly signal to identify performance anomalies. Experiments results are shown using data obtained for the Lonestar4 cluster at the Texas Advanced Computing Center (TACC). Error information from application level logs is used to validate the anomalies identified by the proposed solutions.
II System Model
The system under consideration in this paper is a typical high performance cluster consisting of a set of compute nodes running jobs or tasks at any time instance on one or more nodes. The resource usage data, used in this paper, is collected by monitoring tools such as the TACC_Stats. The monitoring tool collects usage statistics and hardware performance counters, collectively referred to as metrics for each node at a given time instance. See Table I for a list of usage metrics used in our experiments. This data is collected either at the beginning or end of a job, or periodically via a scheduled collection. This data can be represented as a matrix, denoted as , where is the number of nodes, is the number of metrics, and the subscript is the time at which the data was recorded. Thus, is the value of the metric for the node111For metrics that correspond to running counters, we consider the difference between values for successive time instances.. At the same time, the data also provides job specific information, i.e., what jobs are running at each node at a given time instance . The job information is aggregated for a time window, instead of a specific time instance, as explained below.
II-A Tensor Representation of Resource Usage Data
In our analysis, we consider data for a time window instead of a specific time instance. Considering only the periodically collected data (typically collected in intervals of 10 minutes), we define a 3 way tensor, denoted as , where is the number of time samples available in a fixed sized time window. The subscript denotes the starting time instance for this time window. Each slice in the tensor is essentially the usage matrix defined earlier, . This is illustrated in Figure 1.
II-B Job Matrix for a Time Window
While the tensor for a given time window only considers the periodically collected usage data, we use the data collected at start and end of every job, to construct a job matrix for a time window starting at time . is the total number of active jobs in the system for that time window. Each entry, , is set to 1 if the node was running the job during that time window, otherwise it is set to 0.
III Tensor Decomposition Based Error Statistic
One reason for using a tensor based representation of the resource usage data is to be able to exploit the correlations among the different modes in the data. For instance, several usage metrics (See Table I) are expected to exhibit a correlated structure. Similarly, one would expect a temporal regularity in the data and correlations across different computational nodes. We exploit the presence of these structures by employing tensor decomposition methods to express the data in terms of low rank factorization of the previously defined tensor representation for a given time window. Two types of error statistics are defined using the low rank approximation of the tensor. We first provide a short background on tensor decomposition, which will then be used to obtain the statistics.
III-A Background - Tensor Decomposition
Two of the most widely used tensor decomposition methods are: the CANDECOMP/PARAFAC or CP method [13] and Tucker decomposition [22]. Both methods are higher order generalizations of the widely used Singular Value Decomposition (SVD) and Principal Component Analysis (PCA), respectively. We provide brief description of the two methods here.
Tucker
CP
III-A1 Tucker Tensor Decomposition
The Tucker decomposition [22] is a higher order generalization of PCA and involves decomposition of a tensor into a lower rank core tensor, multiplied by a matrix along each mode as illustrated in Figure 3.
Definition III.1
Let be a tensor of size . A rank-() Tucker decomposition of yields a core tensor of size and three factor matrices (usually orthogonal), , , and , of sizes , , and , respectively, such that:
| (1) |
is referred to as the rank of the tensor. The core tensor and the factor matrices capture the level of interaction between different modes. The Tucker decomposition is typically computed by solving the following optimization problem:
| (2) |
where is the Frobenius norm of the matrix. The most popular approach to solve the above formulation is the higher order orthogonal iteration (HOOI) method, which uses the leading singular vectors of the matricized tensor along each mode to compute the factor matrices in an iterative fasion.
III-A2 CANDECOMP/PARAFAC (CP) Tensor Decomposition
The CP decomposition [13] method treats the tensor as a sum of finite number of rank one tensors (See Figure 3).
Definition III.2
Let be a tensor of size . A rank- CP decomposition of yields arrays for each mode, such that:
| (3) |
where denotes the outer vector product. is referred to as the rank of the tensor.
For a given rank, , computing the CP decomposition is typically done using an Alternating Least Squares (ALS) approach that minimizes the following objective function:
| (4) |
where the vectors are the columns of the matrices , respectively.
III-B Error Statistic for Tracking Performance
Both Tucker and CP methods allow us to reconstruct a low rank approximation of the original tensor using (1) and (3), respectively. The low rank approximation captures the core behavior of the underlying system and ignores the noise, which allows for better performance tracking. We wish to extract a single statistic for each window, based on the low rank approximation. One obvious metric could be the recontruction error, defined for the tensor , as:
| (5) |
where, are obtained via the Tucker decomposition of for a specified rank, .
However, we use a slightly different procedure to compute the error statistic, as outlined in Algorithm 1.
The error statistic, , measures how well can the last time slice of the window be predicted using the first time slices. To achieve this, the observed values in the last time slice of the tensor is replaced with a “dummy” slice consisting of mean values obtained using first slices of the tensor. The Tucker decomposition followed by the reconstruction replaces the dummy entries with the predicted values.
The error statistic is then used to identify performance anomalies. The key hypothesis is that, given fixed rank and normal operating conditions, the capability of a tensor to make future predictions, measured as , will be stable. Anomalies in the system performance will result in the error to become significantly larger than expected, and will be detected by inspecting the error statistic, .
The rank is a critical parameter in the analysis and is typically chosen by empirically studying the behavior of for different rank values. Clearly, if the rank is set to the size of the original tensor, i.e., , , and , will be zero. On the other, if the rank is minimal, i.e., , then will be very high. However, we seek an optimal small rank, such that the error statistic is small but captures the behavior of the system during the given time window. This will allow for effective monitoring of the system behavior.
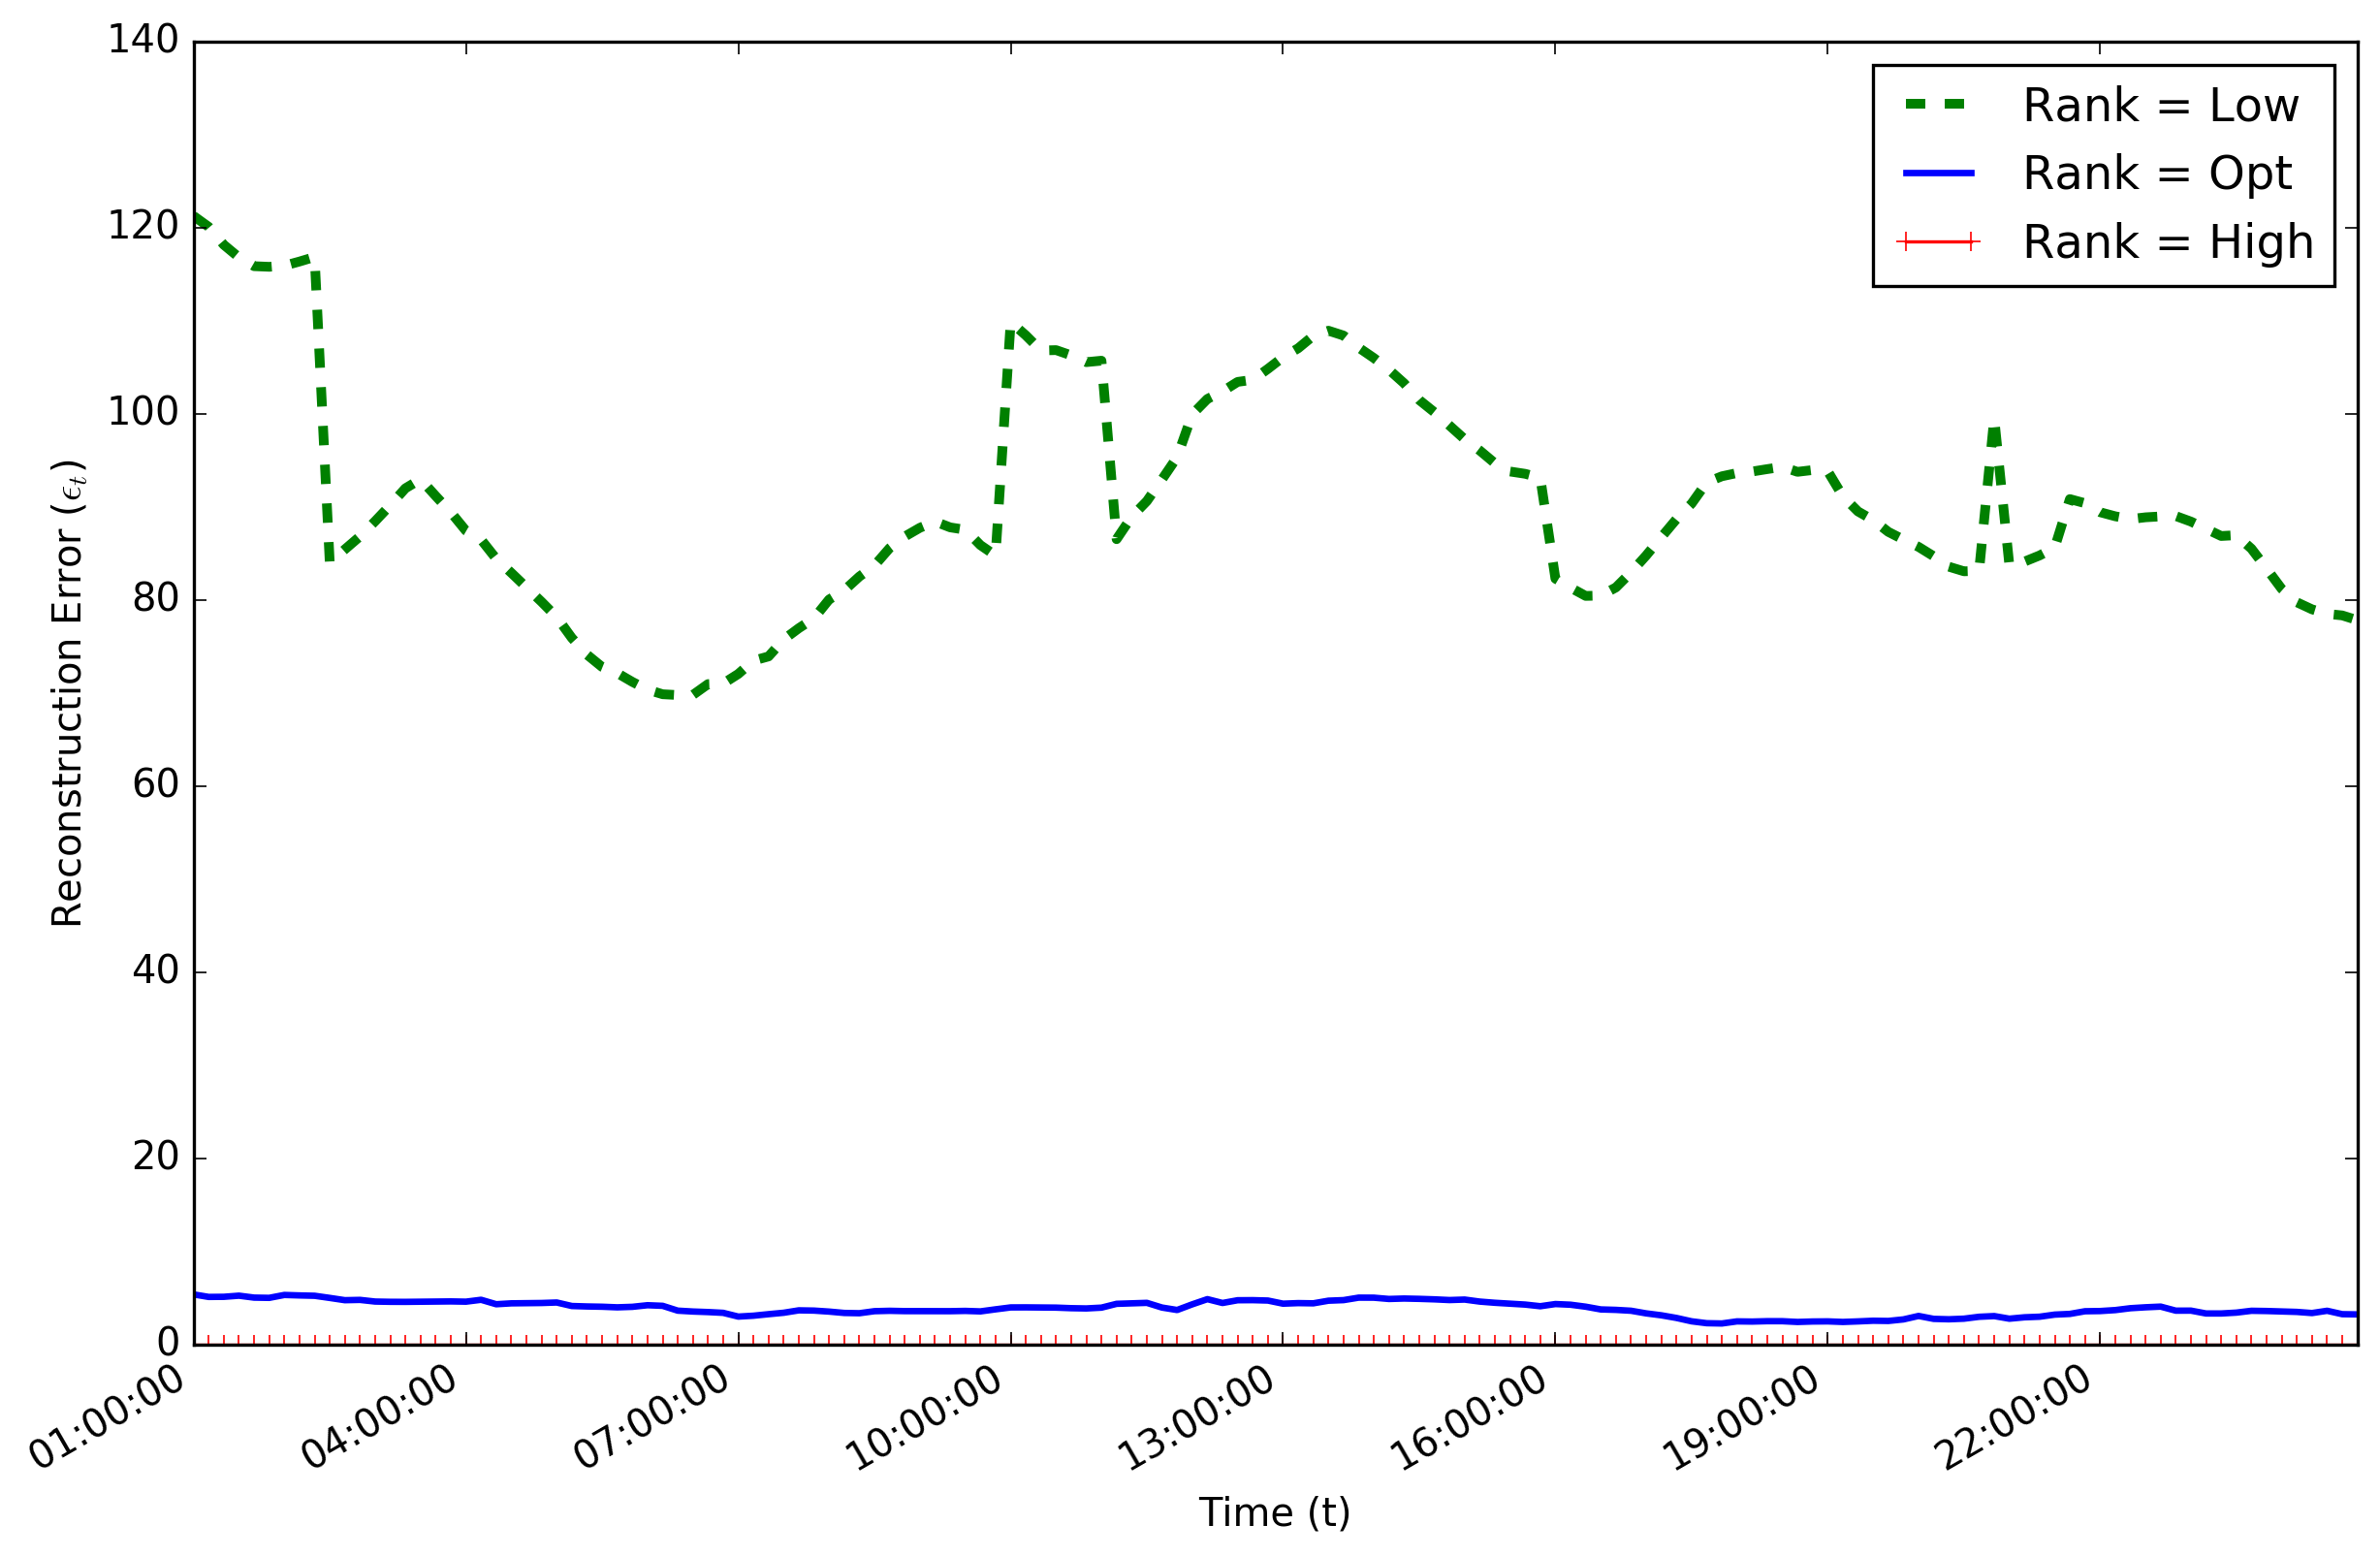
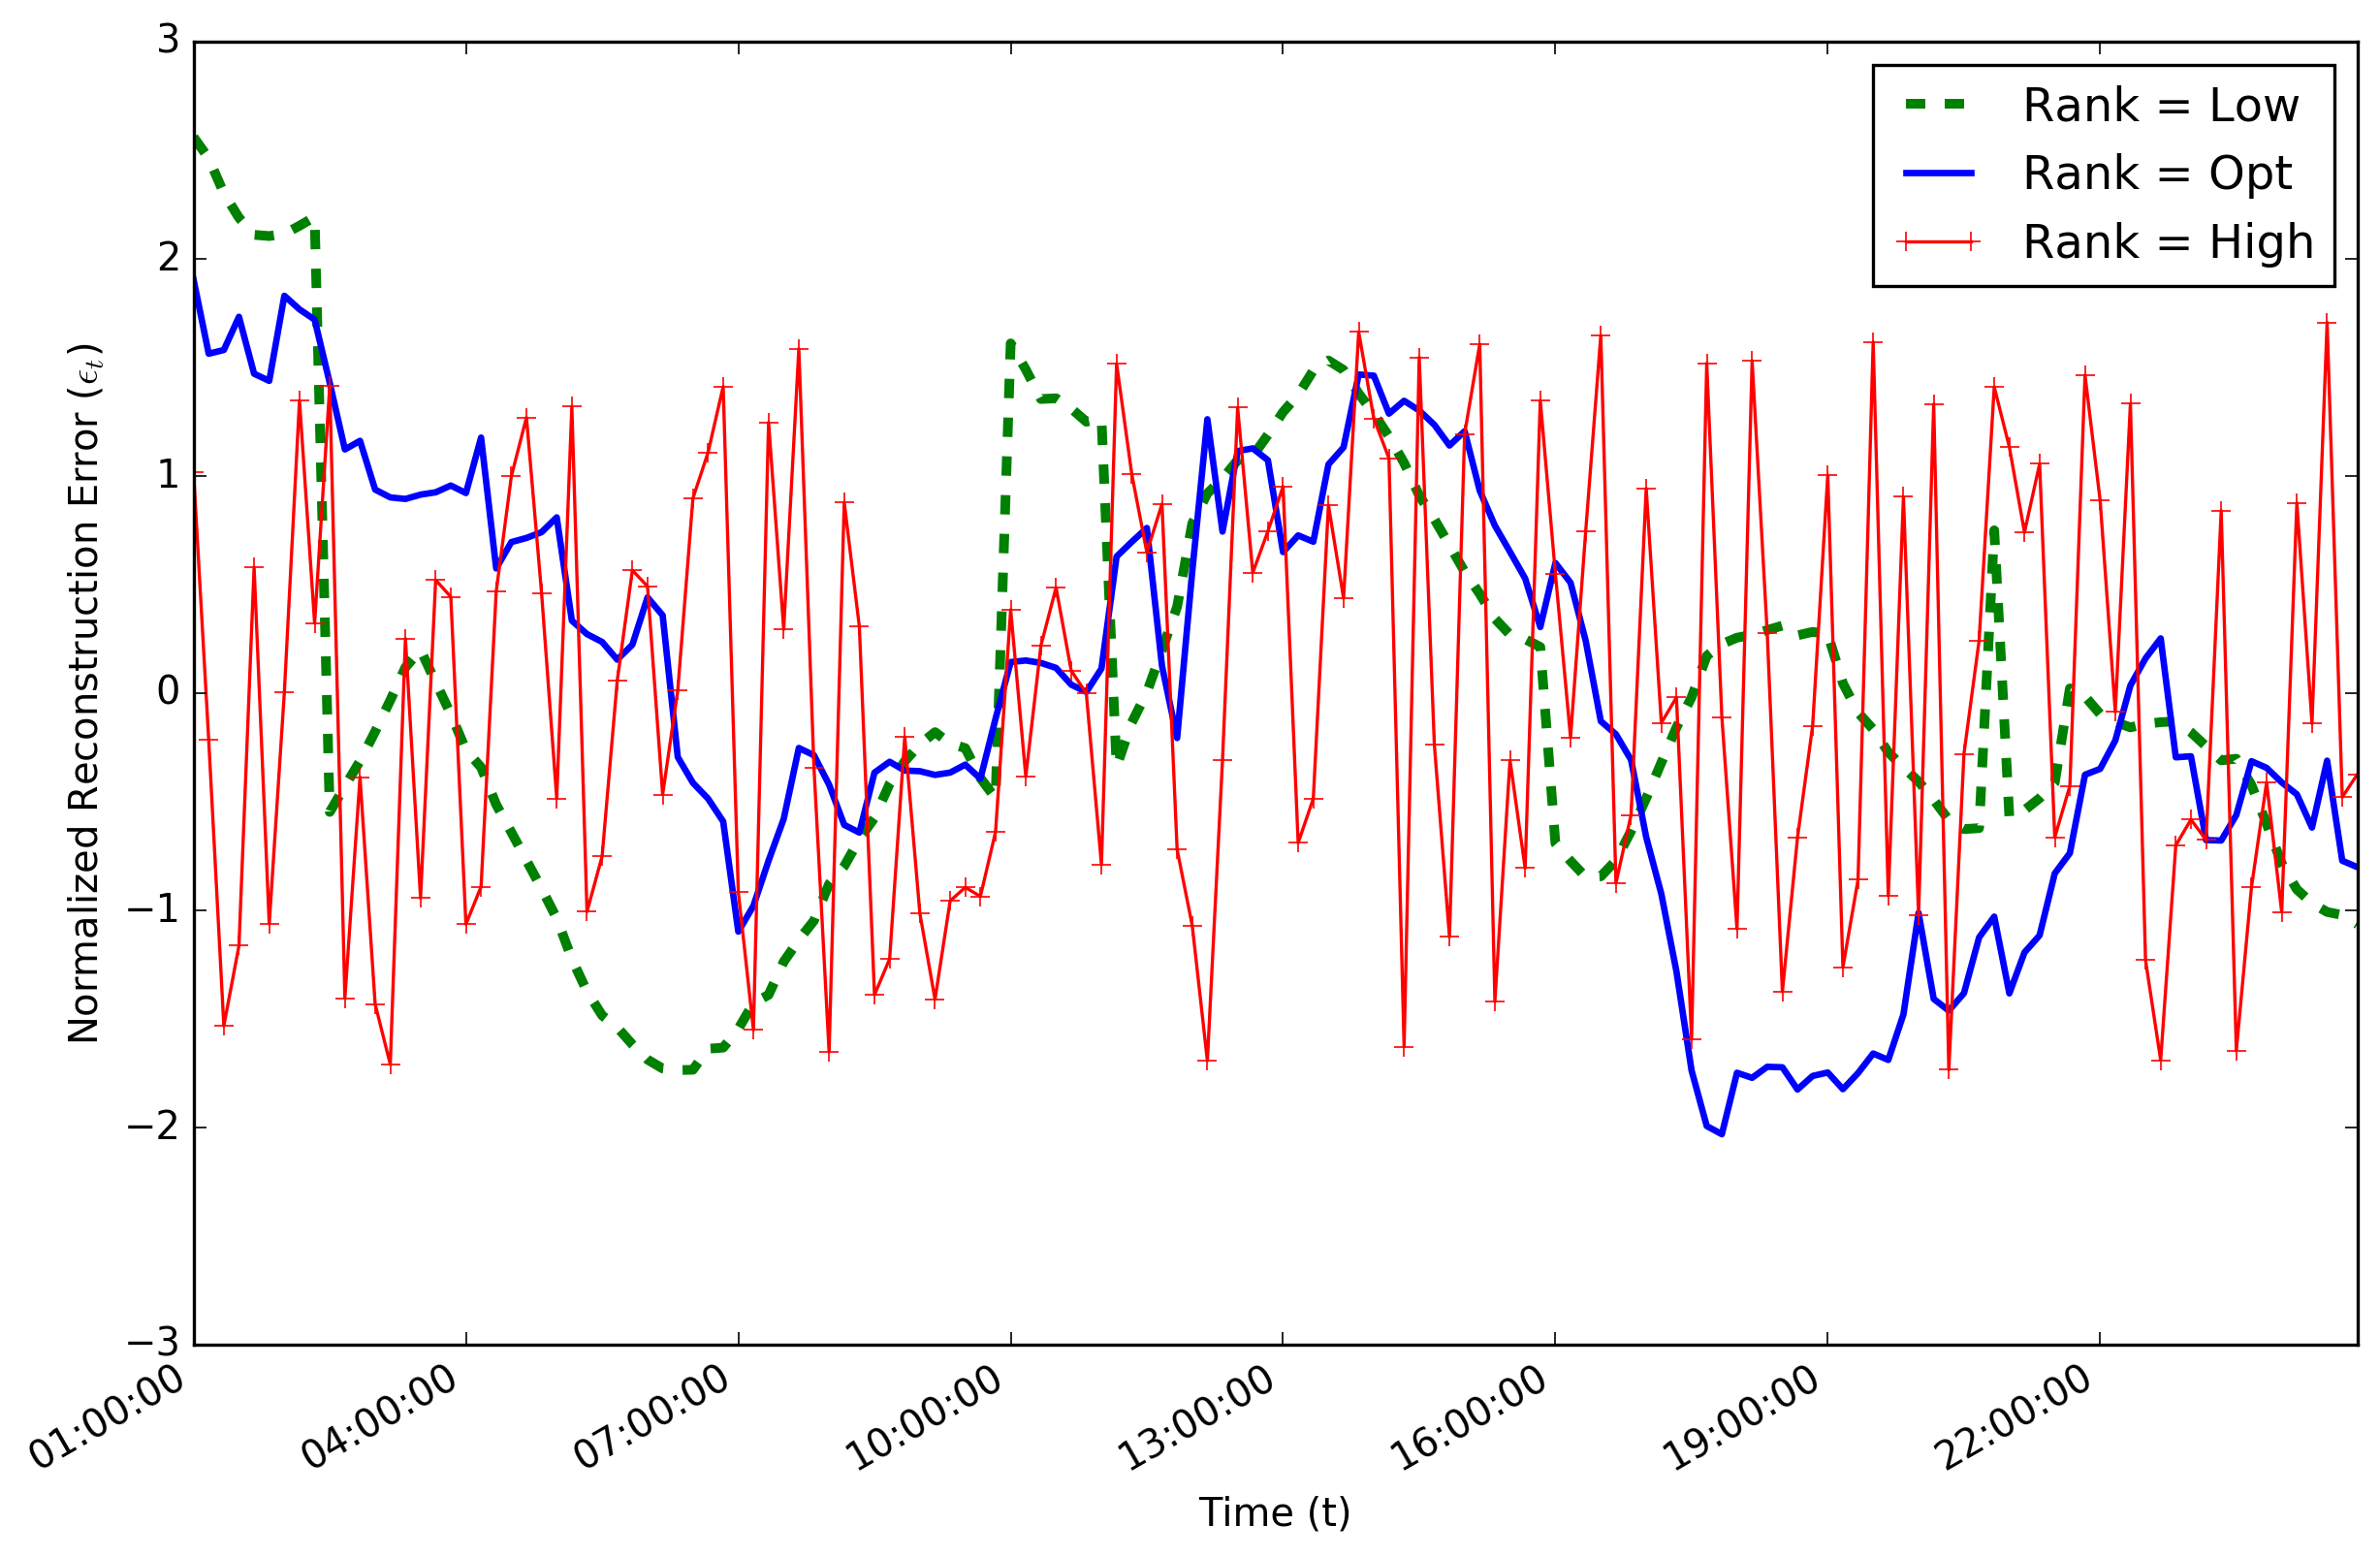
For instance, Figure 4 compares the value of on Lonestar4 TACC_Stats data for three different rank settings. When using full rank of the tensor for reconstruction, the error is nearly zero but does not capture any variance in the system behavior. Using the smallest possible rank exhibits higher variance along time, however, the error is high which means that the approximation poorly captures the information in the corresponding tensor, which will result in unreliable monitoring. An intermediate value of the rank provides a better tradeoff between the error and the variance over time. We will later show how to empirically determine the optimal rank, by studying the behavior of .
III-C Using Job Information for a Refined Statistic
For a given rank, the error statistic, , is an indicator of the relative activity in the system. For a time window in which there are no running jobs, one would expect that the will be low, since all nodes would have similar resource usage during that time interval. On the other hand, if the job load is highly varied across nodes, the value of will be relatively higher. We use this knowledge to improve the predictive capability of the above approach, which in turn lowers the value of the error statistic.
We use the job matrix available for the time window, denoted as and defined in Section II. In this representation, each node is described using a length binary vector, where is the number of jobs active in the system during that time window. The nodes are clustered using the data in into clusters. While any clustering algorithm [12] maybe employed for this task, we use the widely used K-means clustering algorithm, using cosine distance to compute distance between a pair of nodes. The cosine distance between nodes and is defined as:
The output of the clustering is a length vector, , such that each element of indicates the cluster index (between 1 and ) to which the corresponding node is assigned by the clustering algorithm. The vector is used to calculate the error statistic using the procedure outlined in Algorithm 2. The idea is to consider the data for nodes corresponding to each cluster separately. The sub-tensor corresponding to nodes in each cluster (computed in Line 5) is then passed to the TuckerError algorithm (See Algorithm 1). The errors for each cluster are then combined to obtain the final statistic.
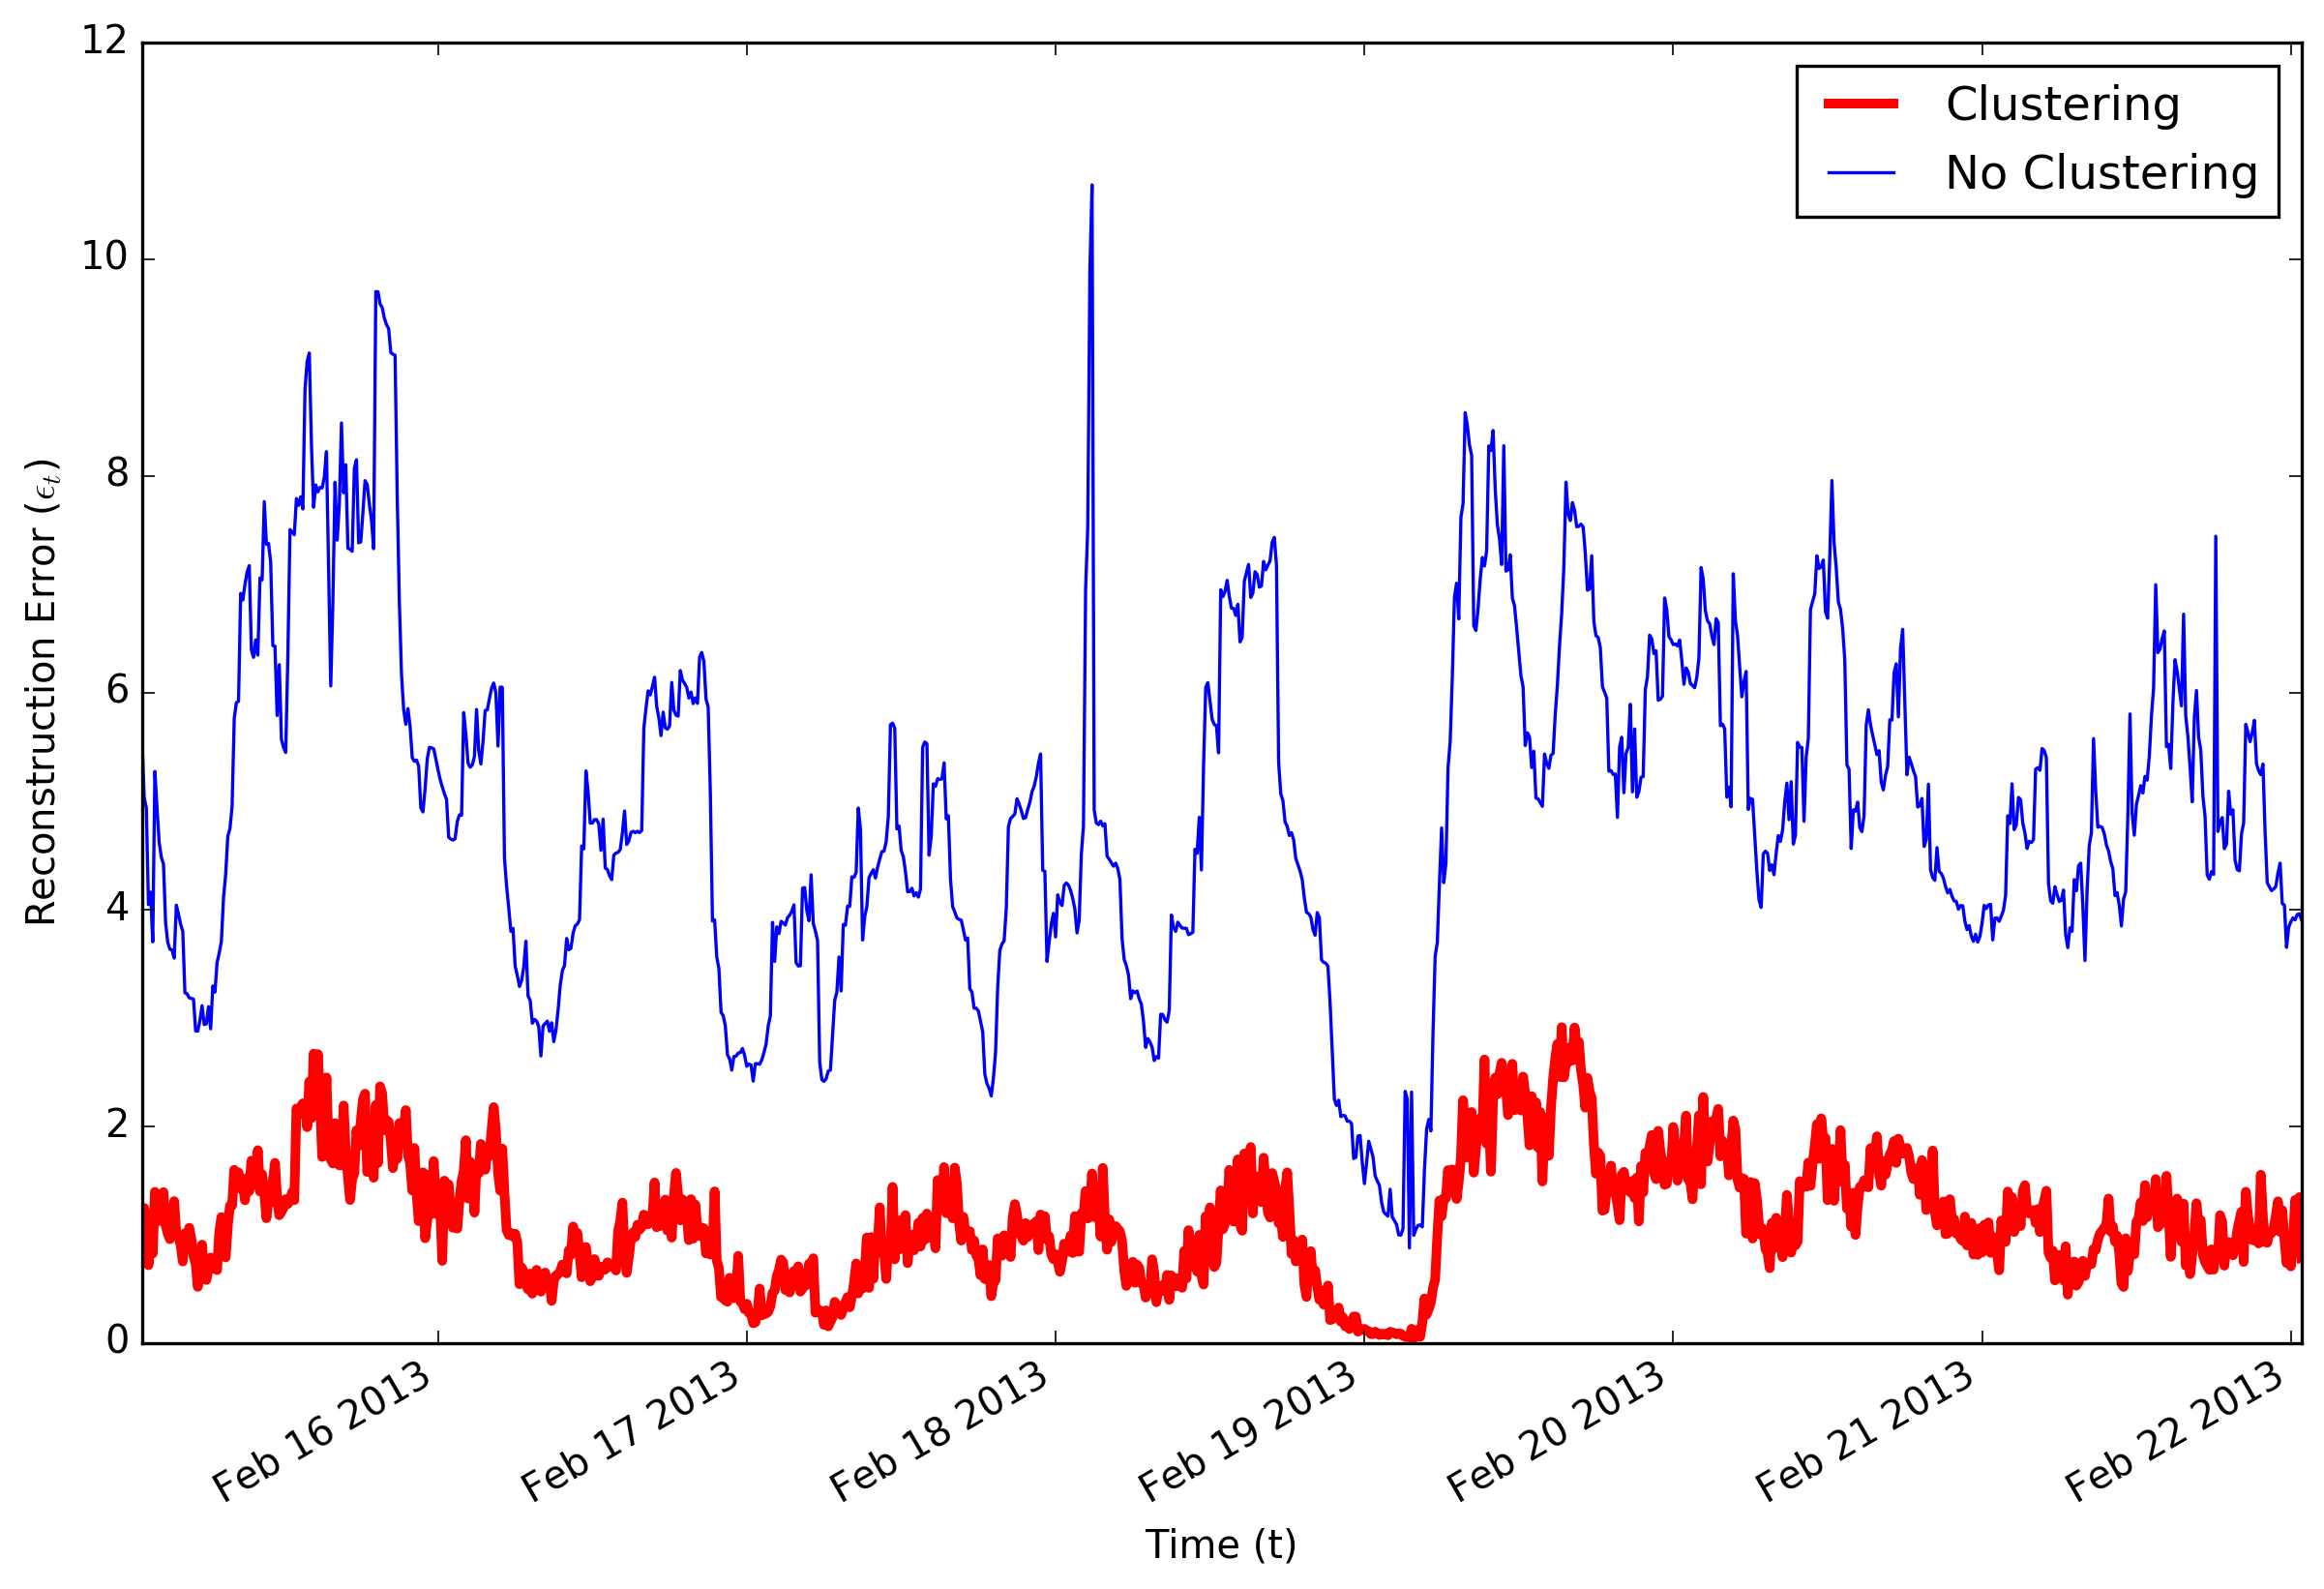
Intuitively, it is easy to see that the value of the error statistic using the clustering scheme will be lower than the error statistic computed, i.e.,:
| (6) |
for .
Since each sub-tensor consists of resource usage data for nodes that have similar workloads, in terms of the running jobs, the low rank decomposition of the sub-tensor can better predict the sub-matrix within the last slice. In fact, one can arrive at an analytical proof to show that the above relation holds. The proof is not included in this paper. Figure 5 shows the comparison for one week worth of the TACC_Stats data.
The choice of the number of clusters, , is an important parameter. Methods such as K-means expect to be specified. Other methods such as mean-shift [4] and Affinity Propagation [7] can operate without specifying . However, such methods have their own parameters which are equally challenging to specify. translates to the number of different possible workloads that exist for a given window, which could be inferred by studying the job specific information from the resource usage data. In this paper, we directly specify a fixed value for .
IV Anomaly Detection
The error statistic computed using Algorithm 2 can be used as a single statistic to track the performance of the system, under the hypothesis that the value of can be reasonably modeled using a univariate time series model, under normal operations of the system. In case of an anomaly, the value of will deviate significantly from the underlying model. The model can be as simple as modeling as a Gaussian random variable with stationary mean and variance and using methods such as Cumulative Sum (CUSUM) or Exponentially Weighted Moving Average (EWMA), which are some of the classical methods for statistical process control [15]. At the same time, the statistic also provides a visual output to track the system performance. For instance, the output in Figure 5 shows an approximately half-day cyclic pattern in the behavior. Sudden spikes in this behavior can reveal performance anomalies, as will be discussed in Section VI.
V Data and Experimental Setup
Experimental results are provided on data obtained from the (now inactive) Lonestar4 supercomputing cluster, situated at the Texas Advanced Computing Center. This cluster consists of compute nodes from which nodes are used for this study. The primary analysis is done on resource usage data for 2013 and the output is evaluated against system message logs obtained for the same time duration.
V-A Resource Usage Data
The resource usage data is collected using the TACC_Stats system monitor [5], which collects a range of usage related metrics from the overall system, including hardware performance counters, Lustre filesystem operation counts, and Infiniband device usage. Data is collected at each computational node, both periodically and at the beginning and end of a job.
| Component | Resource usage metrics |
|---|---|
| CPU | user, nice, system, idle, iowait, irq, softirq |
| I/O | rd_ios, rd_merges, rd_sectors, rd_ticks, wr_ios, wr_merges, wr_sectors, wr_ticks |
| Lustre /scratch, /work | read_bytes, write_bytes, direct_read, direct_write, dirty_pages, dirty_pages, ioctl, open, close, mmap, seek, fsync, setattr, truncate, flock, getattr, statfs, alloc_inode, setxattr, getxattr, listxattr, removexattr, inode_permission, readdir, create, lookup, link, unlink, symlink, mkdir, rmdir, mknod, rename |
| Lustre network | tx_msgs, rx_msgs, rx_msgs, tx_bytes, rx_bytes, rx_bytes |
| Virtual Memory | pgpgin, pgpgout, pswpin, pswpout, pgalloc_normal, pgfree, pgactivate, pgdeactivate, pgfault, pgmajfault, pgrefill_normal, pgsteal_normal, pgscan_kswapd, pgscan_direct, pginodesteal, slabs_scanned, kswapd_steal, kswapd_inodesteal, pageoutrun, allocstall, pgrotated |
Each file generated by the monitor is self-describing with a meta-data header and actual measurements grouped into records as shown in Table II.
| tacc_stats 1.0.3 |
| hostname c300-101.ls4.tacc.utexas.edu |
| uname Linux x86_64 2.6.18-194.32.1.el5_TACC #2 … |
| uptime 14043540 |
| block rd_ios,E rd_merges,E rd_sectors,E,U=512B |
| rd_ ticks,E,U=ms ,… |
| 1369285201 0 |
| block sr0 0 0 0 0 0 0 0 0 0 0 0 |
| block sda 49084176 677526 6343808434 188319052 |
| cpu 0 319172960 135 16110118 1068725347 235978 |
The data is available from January 1, 2013 to December 31, 2013 and contains 52,560 records per node, sampled once every 10 minutes. The records collected when a job starts or terminates were ignored for this analysis. In all, the TACC_Stats monitor provides 216 performance metrics. We used 86 of these metrics which measure the resource usage for CPU, memory, and I/O systems. See Table I for the list of usage metrics used in this paper. These are similar to the metrics chosen for similar analyses in previous works [9]. Note that the cpu related metrics were available for each processor, and a single average was used for each 10 minute block. For the metrics that record counters, we used the difference with the next block’s counter value. The individual metrics were normalized to have zero mean and unit variance.
V-B System Log Messages
While the proposed method operates on resource usage data, we use the system message log for the same time period to verify the identified events. This motivated from past studies that have shown correlations between events identified from resource usage data and event logs [3]. We use POSIX formatted log messages that include one message per line, consisting of the timestamp, host, protocol, and the event message. Few examples are shown below:
Feb 16 04:30:50 c318-116 kernel: [10716468.440192] Lustre: 14751:(file.c:3312:ll_inode_revalidate_fini()) failure -2 inode 250689312
Feb 12 01:28:42 c337-314 kernel: [10359976.556231] Lustre: 10883:(client.c:1476:ptlrpc_expire_one_request() ) @@@ Request x1424903135350826 sent from work
For the year of 2013, a total of 642,988,509 log messages were available for the Lonestar4 system.
V-C System Setup
All experiments were performed on a Ubuntu Server with Intel(R) Xeon(R) CPU E5-2630 v3 @ 2.40GHz CPU, NVIDIA Corporation GK110GL [Quadro K5200] 8GB GPU and 16 GB memory. For the tensor decomposition we use the scikit-tensor library [25] written in Python. For the Tucker based method in Algorithm 1, we avoid the high computational cost of reconstructing the tensor (Line 9), by utilizing the tensor manipulation routines in the Theano toolbox [21] which uses the GPU to accelerate the computation. The matrix and vector operations were done using the Python numpy library.
VI Results
In this section we show the effectiveness of using the proposed error statistic in tracking the performance of an HPC system. Additionally we show visual inspection can reveal anomalies which are then verified to be meaningful by comparing with the system log messages. The data is from the Lonestar4 system, as described in Section V.
VI-A Optimal Parameters
There are five parameters required to estimate the error statistic in Algorithm 2. These are the lower rank for tensor decomposition, i.e., , the length of the window, , and the number of clusters, . As discussed earlier, we fix the parameter in this paper, though one can infer optimal for a given time window based on the expected number of job usage patterns in the system. In these experiments we set .
Setting Optimal Window Size
To understand the impact of window size, , on the analysis, we conducted the following experiment. For a given window size and a fixed node and metric rank, i.e., and , we varied the time rank, from 1 to (full rank) and observed how the error statistic () varies with the time rank for a randomly chosen window. This allows us to understand the dependence among nodes and metrics along the time mode. The results are shown in Figure 6. Ideally, in the presence of correlations along the time dimension, one would expect the error curve to decline sharply towards a low value and then stabilize.
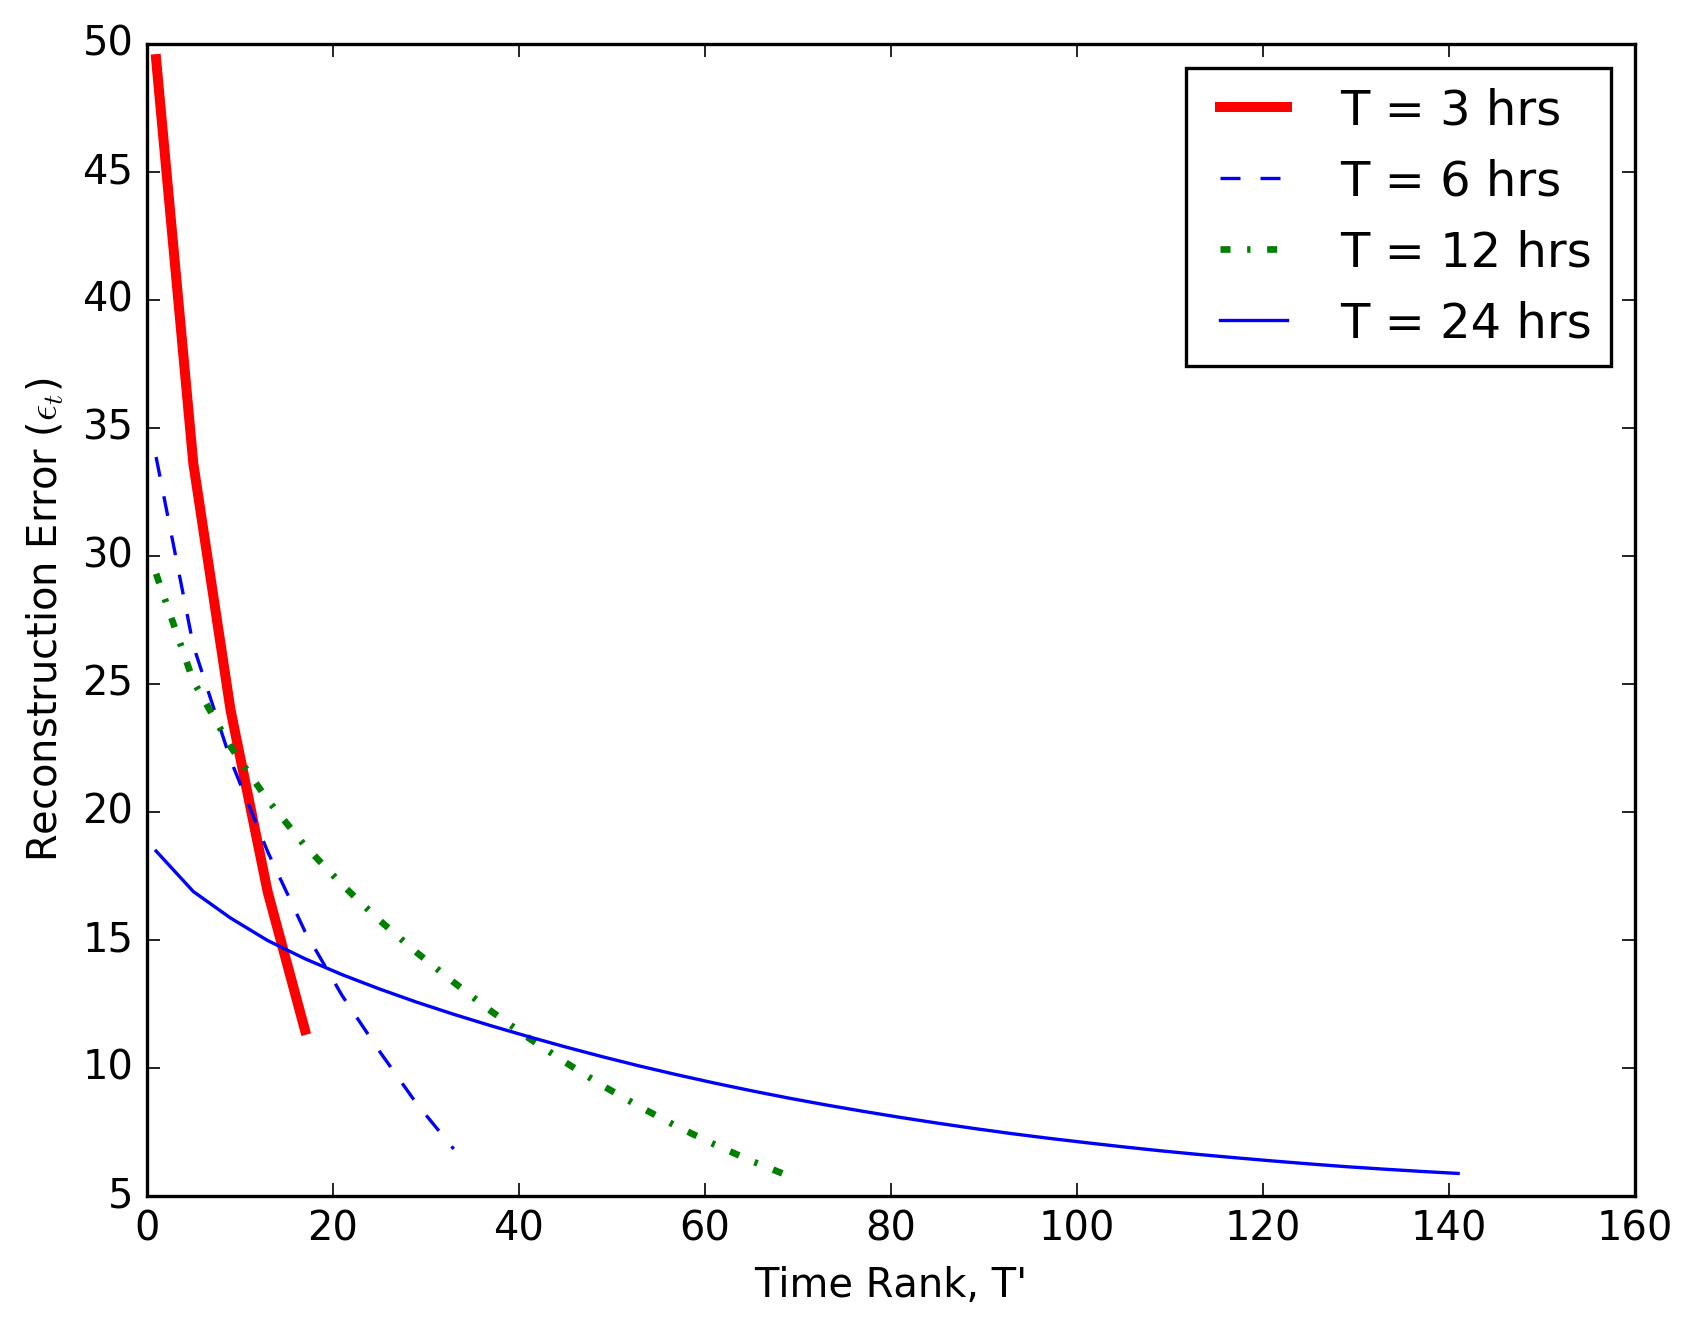
However, as observed in Figure 6, the value of the error statistic decreases almost linearly until rank is increased to 18 (corresponding to 18 10-minute slices or 3 hours). This means that within a 3 hour window, the system does not exhibit significant correlation along the time mode. Moreover, even if the window size is greater than 3 hours, one needs to consider a rank of more than 18 to get low error. For this reason, we choose the window size to be equivalent to 3 hours of observations.
Setting Optimal Rank
For the chosen window size of 3 hours, the error statistic decreases linearly with increasing time rank (See Figure 6). Thus we set to be the full rank along the time mode, i.e., .
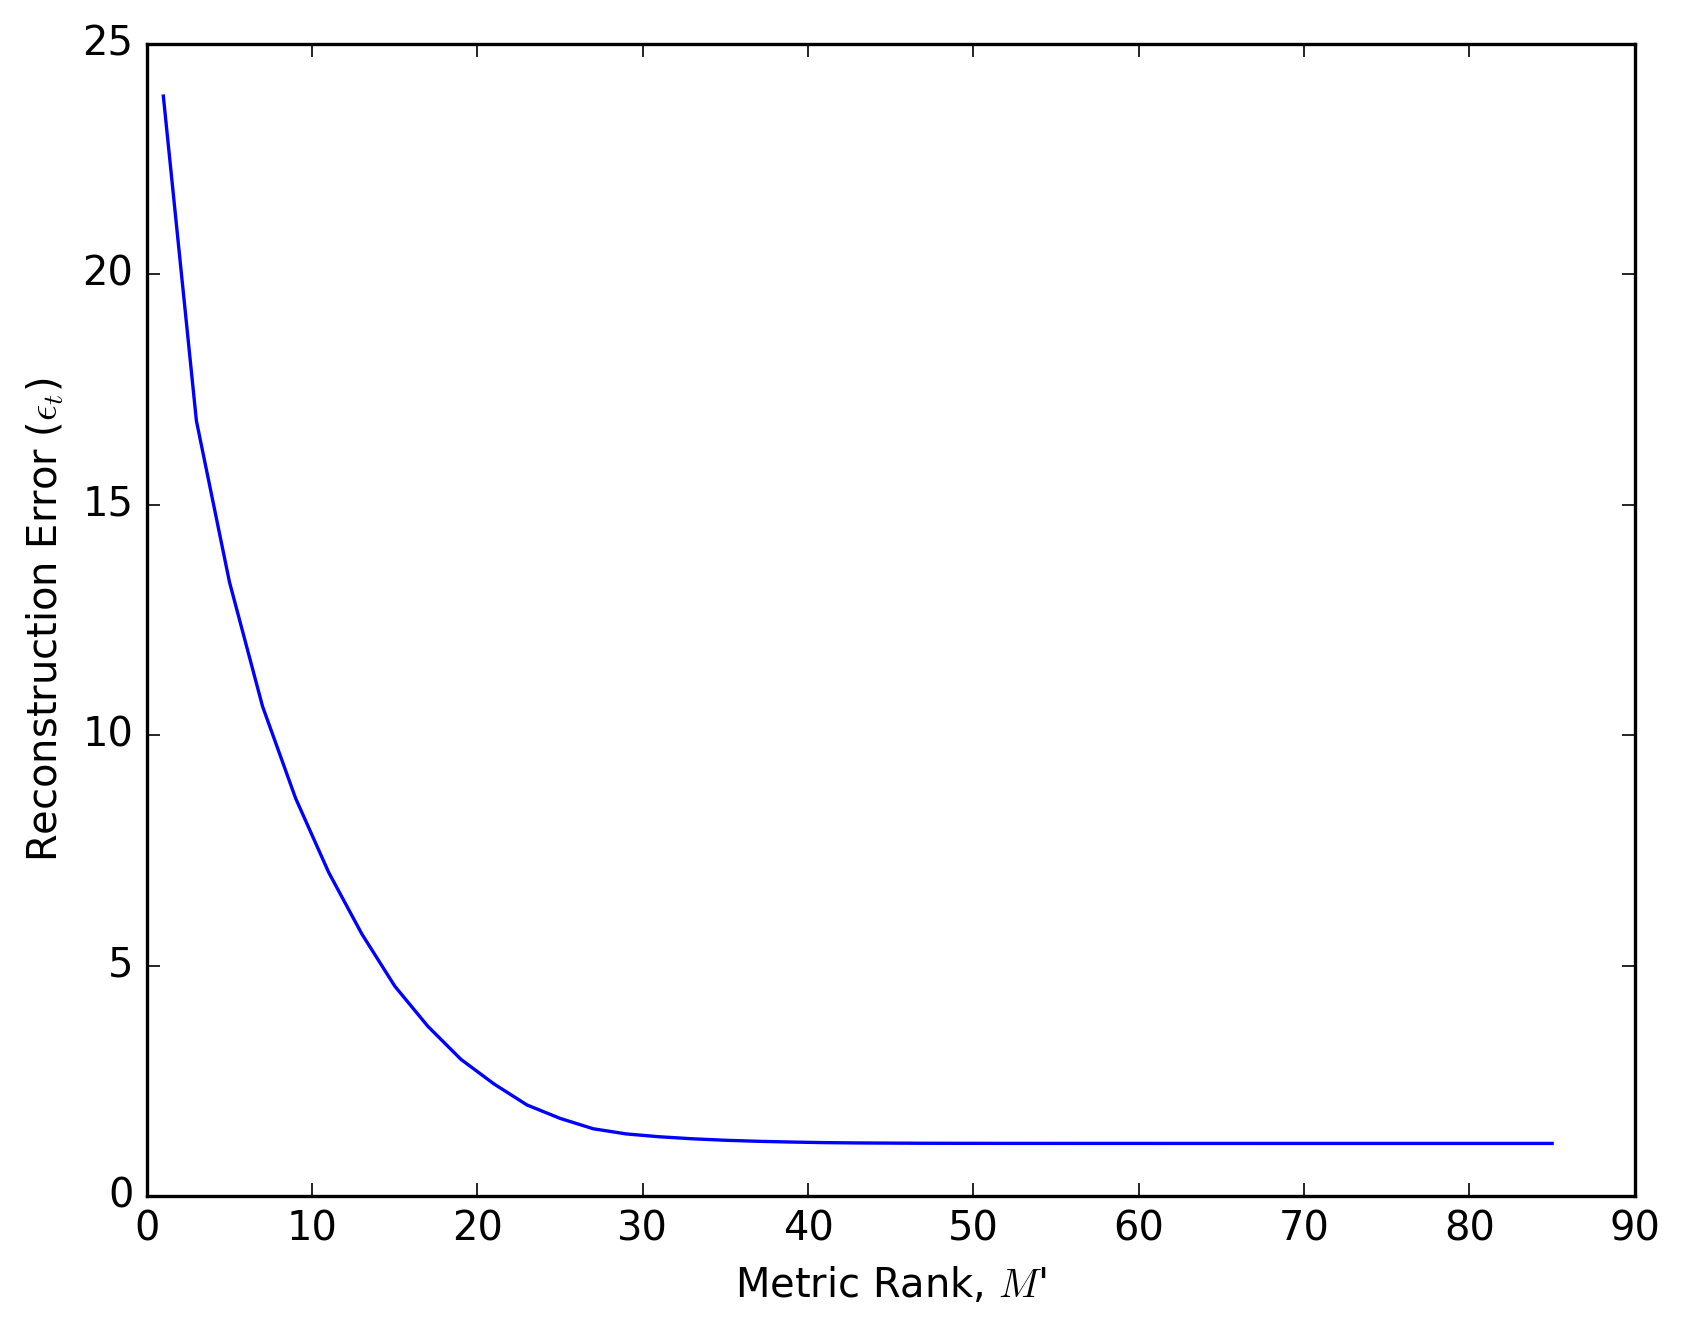
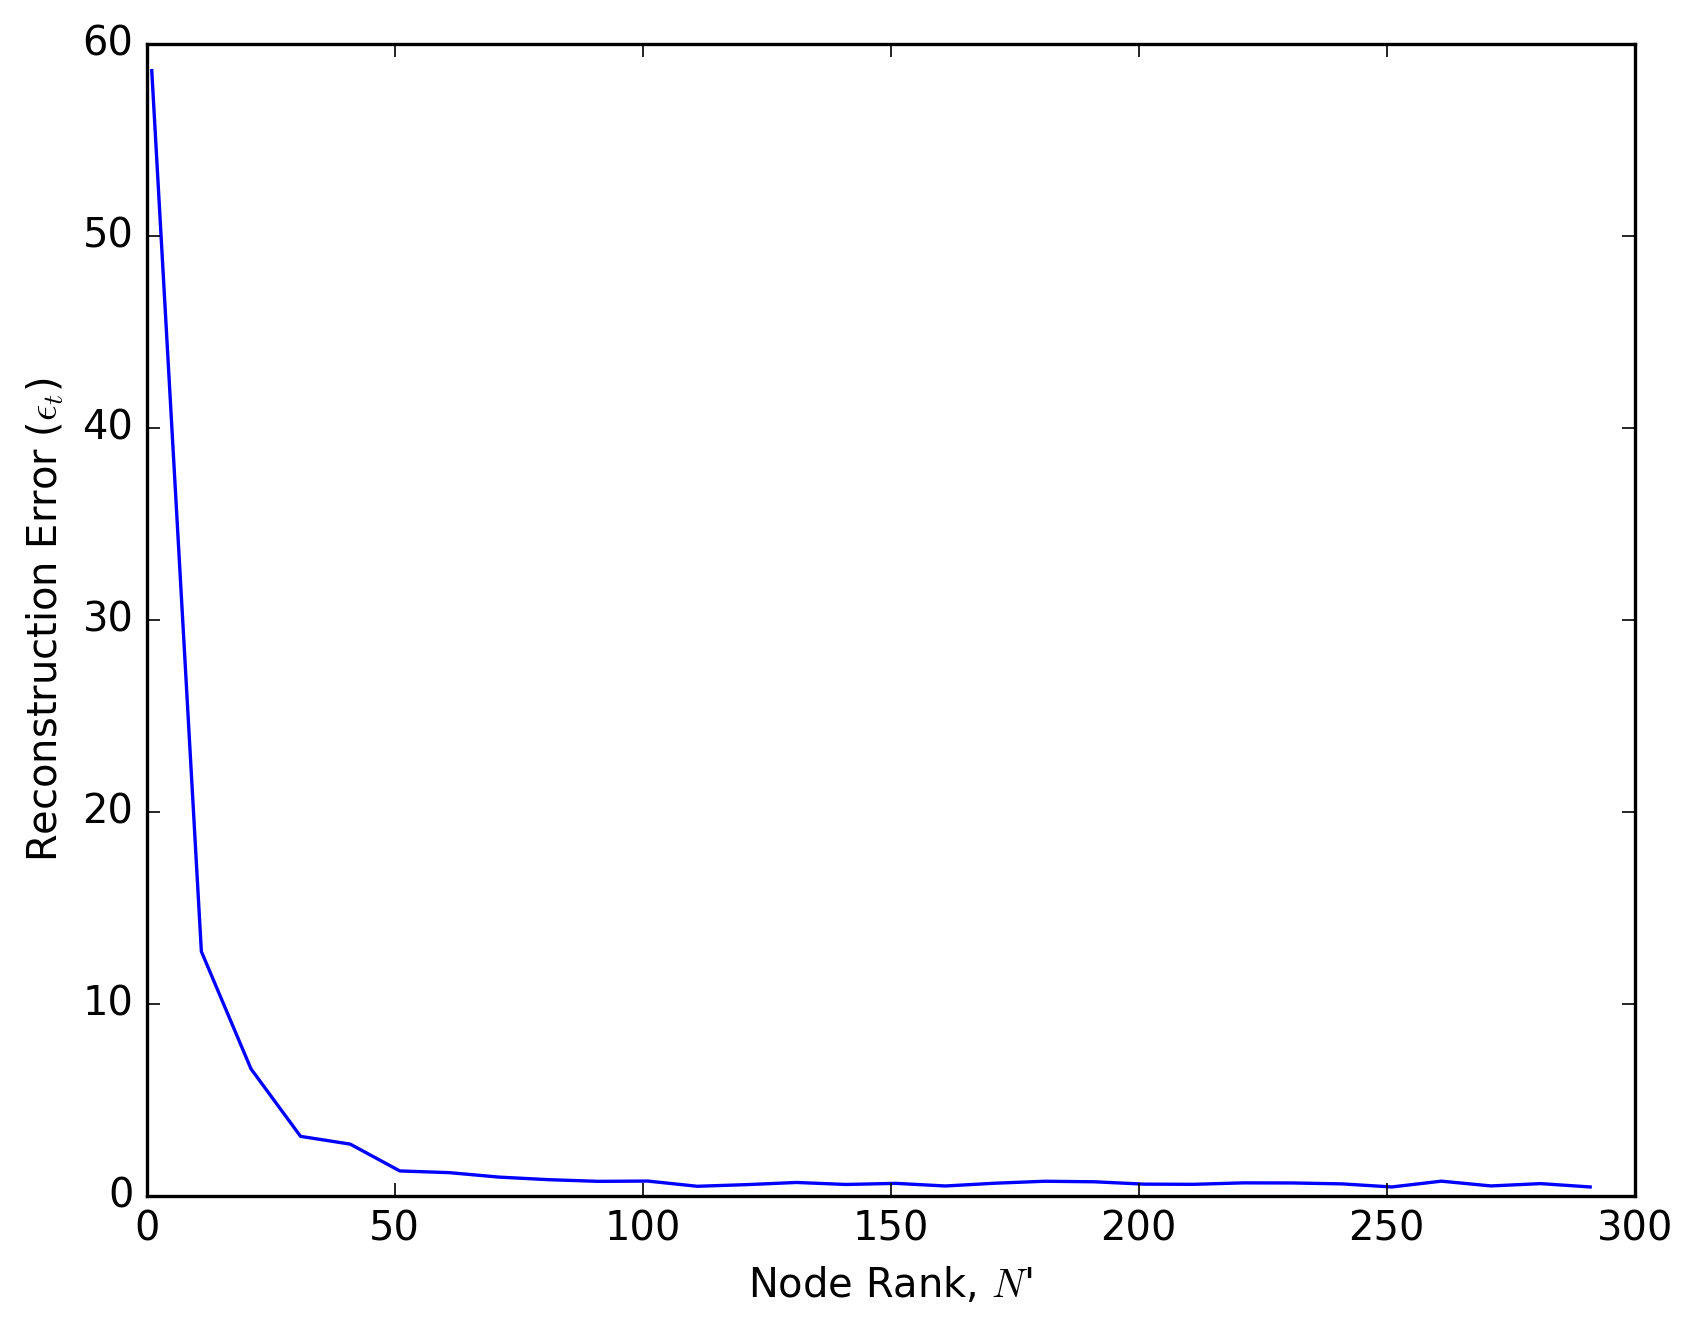
Figure 7 shows that a metric rank of 30 is enough to capture most of the information in the data. In the experiments, we set . Similarly, the node rank, , is set to 50, based on the behavior of the error statistic with varying , as shown in Figure 8.
VI-B Using Error Statistic for Identifying Performance Anomalies
Using the optimal parameters discussed above, we analyzed several weeks of the Lonestar4 data to understand the system performance. Figure 9 show the error statistic for four weeks in March, 2013. We choose a threshold of 3 to identify performance anomalies from this data, which gives us four anomalous events during the month. In general, one can study the statistical properties of to automatically determine an appropriate threshold for identifying anomalies.
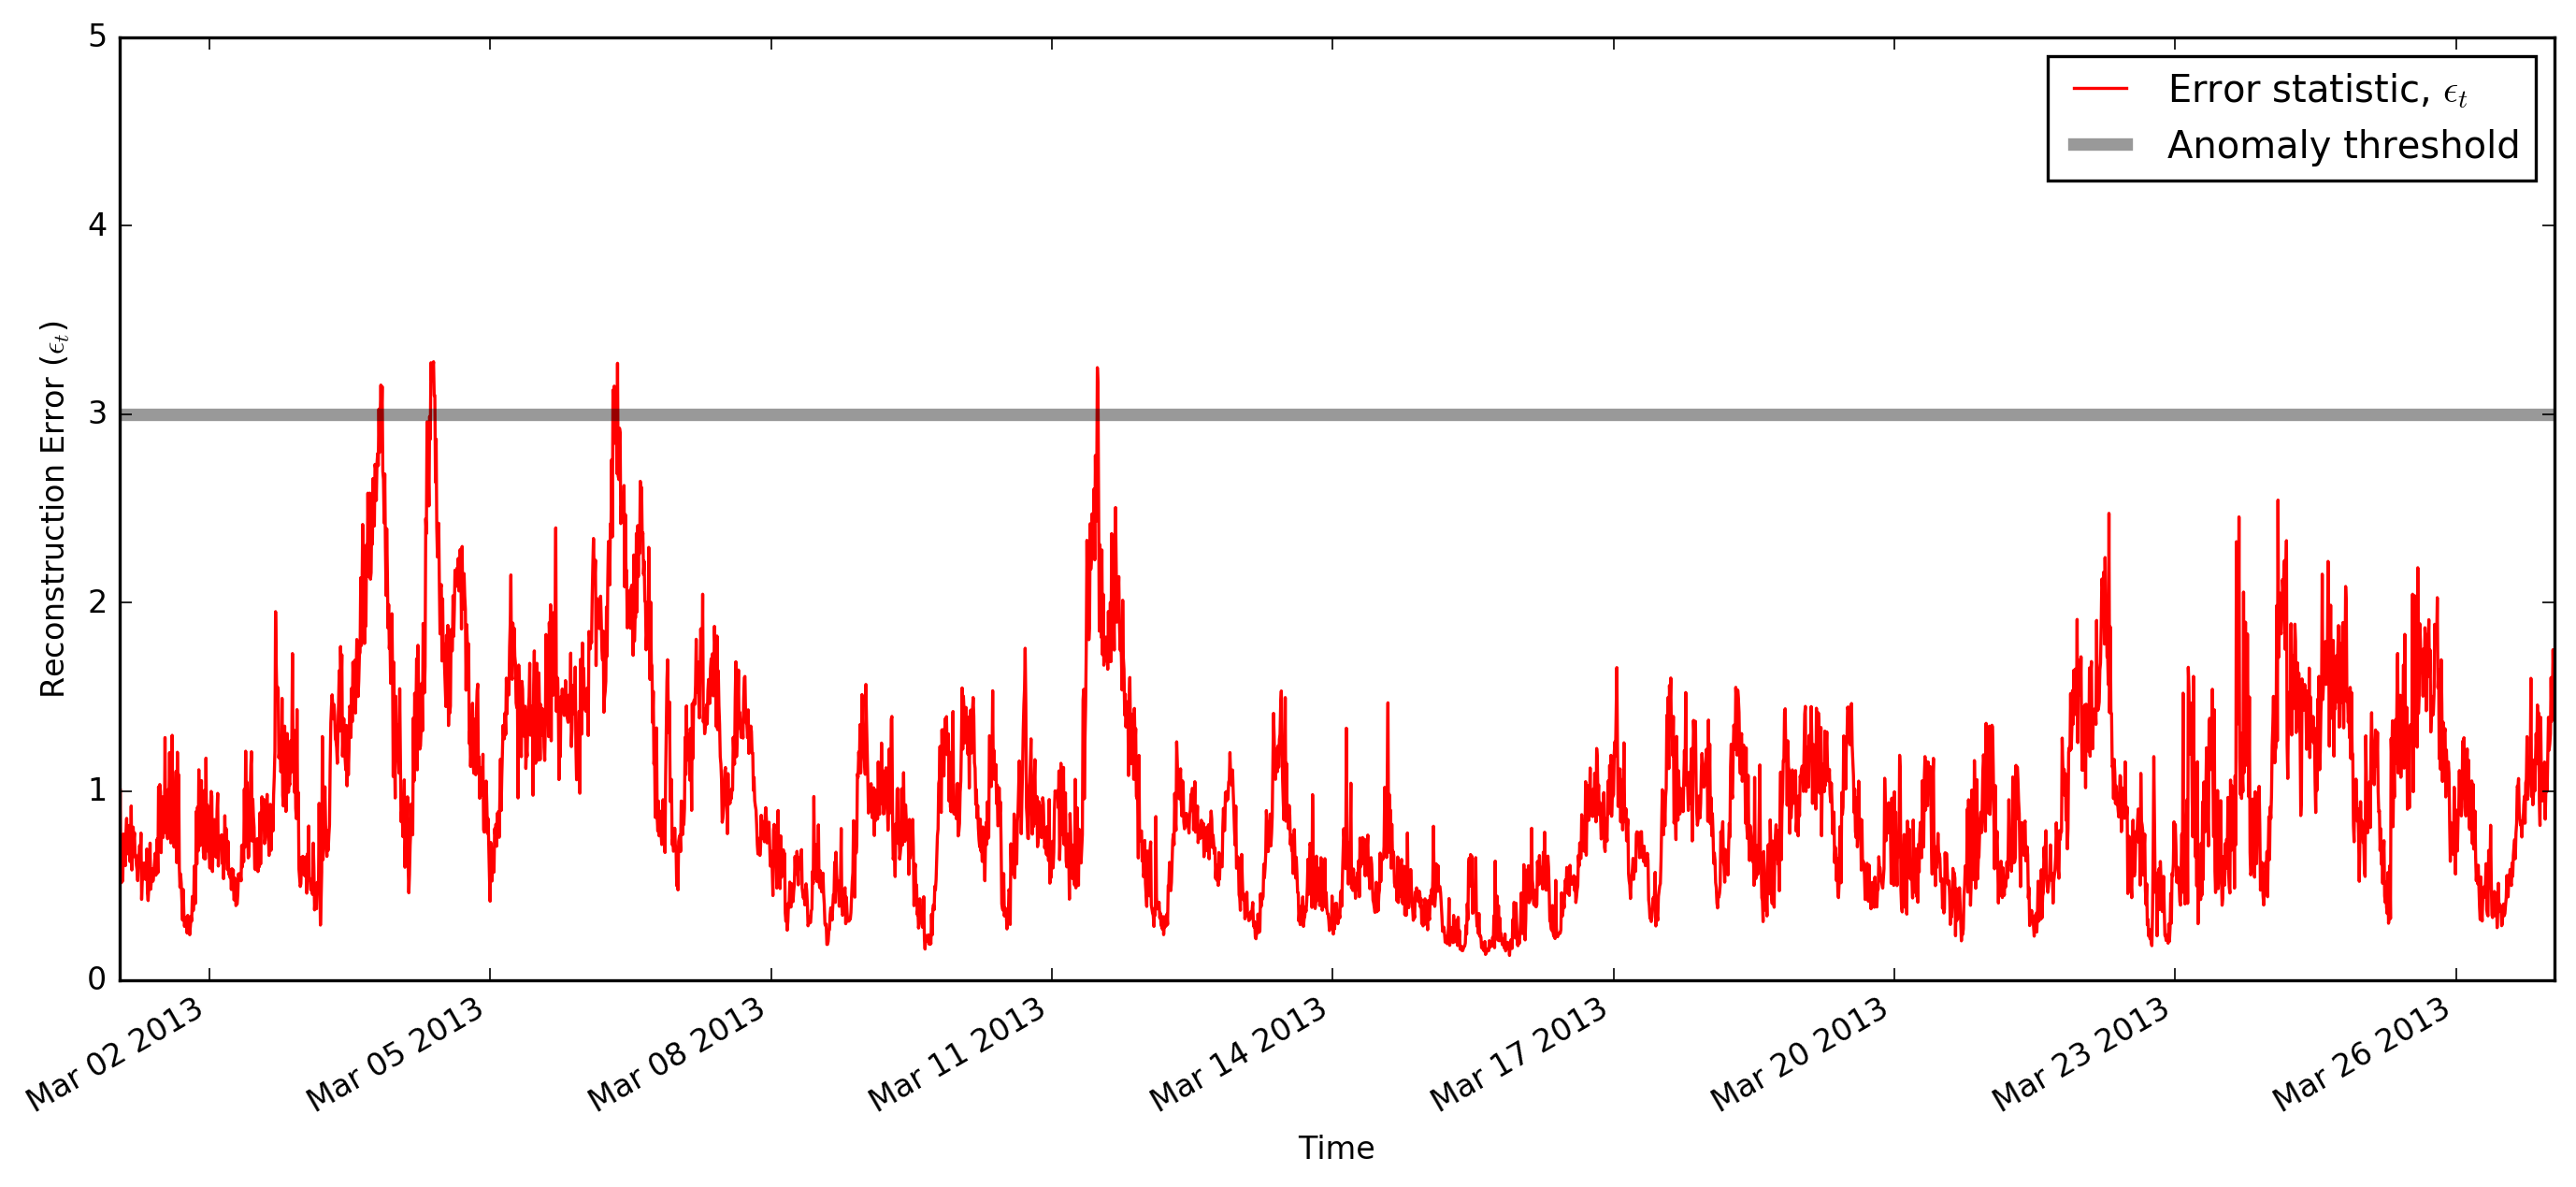
Table III lists the critical errors from the system log data for the time windows corresponding to the four anomalous events identified in Figure 9. We observe that the system reported several critical error messages during each of the four identified events, confirming that the proposed error statistic is able to identify truly anomalous events. For comparison, we also analyze the error messages for time windows with low value of , such as the last row in Table III. While some error messages occur in those windows as well, e.g., segfaults, errors such as unreachable nodes only occur for the anomalous time windows.
| Time | Type | Errors |
|---|---|---|
| Mar 4, 23:50 - Mar 5, 00:40 | Anomalous | Lustre inode failure (kernel), CRITICAL host unreachable, segfault (kernel) |
| Mar 5, 14:20 - Mar 5, 15:20 | Anomalous | Lustre inode failure (kernel), segfault (kernel), lustre communication error (kernel) |
| Mar 7, 15:00 - Mar 7, 16:00 | Anomalous | CRITICAL host unreachable, Lustre write error (kernel), Lustre inode failure (kernel) |
| Mar 13, 13:10 - Mar 13, 13:20 | Anomalous | CRITICAL host unreachable, Lustre inode failure (kernel), Lustre write error |
| Mar 17, 16:00 - Mar 17, 17:00 | Normal | Lustre inode failure (kernel), segfault (kernel) |
VII Related Works
We briefly discuss related research in two areas that are relevant to the proposed methodology. First is the area of system monitoring using log data and second is the area of tensor based monitoring of non-HPC systems.
HPC system performance monitoring methods
Solutions for detecting, diagnosing, and predicting faults and failures in large high performance computing installations have typically relied on message logs [23, 16, 8, 20, 19] or resource usage data [9, 1], or both [3, 10, 2]. Since this paper focuses on the detection task, we present a brief overview of related methods that deal with detecting faults. Methods operating on message logs typically aggregate message logs by an entity of interest, e.g., a computational node/block [16, 23] or a job [8], and identify anomalous entities using different data representations, such as message arrival statistics [16], vector representation derived from the message content [23] or a state machine that models the dynamic behavior of the entity [8]. However, message logs are typically noisy and often incomplete, which has led to methods that analyze alternate data sources such as resource usage metrics or performance counter data [9, 1]. However, these solutions perform a node-specific or job-specific analysis of resource usage to identify anomalous nodes [9] or jobs [1]. Recently, solutions that combine resource usage data and message logs to improve fault detection have been proposed [10, 2]. The Crude system uses resource usage data to improve the performance of a PCA driven anomaly detection method [23] that operates at node and job level. However, none of the existing methods model the temporal dimension to better identify faults..
Tensor decomposition based monitoring in other domains
In this paper we model the resource usage data as a 3-way tensor. While, a tensor based approach has not been previously employed for system monitoring, related approaches have been explored in other contexts, including fundamental work in using tensor decomposition techniques for mining multi-aspect data [14]. In particular, methods that use the reconstruction error between the raw data tensor and the tensor recovered from the low-rank representation have been applied for identifying anomalies in hyper-spectral imagery [24] and surveillance from spatio-temporal sensor measurements [6]. The latter work [6] deals with time as one of the tensor dimensions, similar to our work. However, the approach tracks the changes in the subspace from one temporal “slice” (as a 2-way matrix) to the next. In our proposed work, we use a fixed size historical tensor to predict the next one or more temporal slices.
VIII Conclusions and Future Directions
The proposed approach performs system level monitoring and provides a coarse assessment of the global behavior of an HPC system. The results on Lonestar4 data have shown that the method effectively captures the relationships across usage metrics, computational nodes, and time to extract a single temporal signal which can be used by system administrators to monitor the system health.
In future, we plan to integrate the information from system messages into the analysis, rather than using that for post-validation. Other researchers have reported promising results by analyzing the two sources of information together [10, 2]. While the proposed error statistic allows for a visual tracking of the system performance, we plan to build a statistical anomaly detection model that leverages the expected behavior of the statistic to identify appropriate thresholds for flagging an anomalous event. Moreover, while the statistic by itself allows for only identifying anomalies, one can inspect the low rank decomposition to explain the anomalies, and will be explored in near future.
Acknowledgements
Authors wish to acknowledge support provided by the Center for Computational Research at the University at Buffalo. Additionally, the authors thank researchers at Texas Advanced Computing Center for access to the Lonestar4 data and related support.
References
- [1] G. Bronevetsky, I. Laguna, B. R. de Supinski, and S. Bagchi. Automatic fault characterization via abnormality-enhanced classification. In Proceedings of the 2012 42Nd Annual IEEE/IFIP International Conference on Dependable Systems and Networks (DSN), pages 1–12, 2012.
- [2] E. Chuah, A. Jhumka, J. C. Browne, N. Gurumdimma, S. Narasimhamurthy, and B. Barth. Using message logs and resource use data for cluster failure diagnosis. In 23rd annual IEEE International Conference on High Performance Computing, Data, and Analytics (HiPC 2016), 2016.
- [3] E. Chuah, A. Jhumka, S. Narasimhamurthy, J. Hammond, J. C. Browne, and B. Barth. Linking resource usage anomalies with system failures from cluster log data. In Proceedings of the 2013 IEEE 32Nd International Symposium on Reliable Distributed Systems, SRDS ’13, pages 111–120, Washington, DC, USA, 2013. IEEE Computer Society.
- [4] D. Comaniciu and P. Meer. Mean shift: A robust approach toward feature space analysis. IEEE Trans. Pattern Anal. Mach. Intell., 24(5):603–619, May 2002.
- [5] T. Evans, W. Barth, J. Browne, R. DeLeon, T. Furlani, S. Gallo, M. Jones, and A. Patra. Comprehensive resource use monitoring for HPC systems with TACC stats. In International Workshop on HPC User Support Tools, pages 13–21, 2014.
- [6] H. Fanaee-T and J. Gama. Eigenevent: An algorithm for event detection from complex data streams in syndromic surveillance. CoRR, abs/1406.3496, 2014.
- [7] B. J. Frey and D. Dueck. Clustering by Passing Messages Between Data Points. Science, 315, 2007.
- [8] Q. Fu, J.-G. Lou, Y. Wang, and J. Li. Execution anomaly detection in distributed systems through unstructured log analysis. In International conference on Data Mining, 2009.
- [9] Q. Guan, D. Smith, and S. Fu. Anomaly detection in large-scale coalition clusters for dependability assurance. In 2010 International Conference on High Performance Computing, pages 1–10, 2010.
- [10] N. Gurumdimma, A. Jhumka, M. Liakata, E. Chuah, and J. Browne. Crude: Combining resource usage data and error logs for accurate error detection in large-scale distributed systems. In 2016 IEEE 35th Symposium on Reliable Distributed Systems (SRDS), pages 51–60, 2016.
- [11] L. Huang, X. Nguyen, M. N. Garofalakis, M. I. Jordan, A. D. Joseph, and N. Taft. In-network PCA and anomaly detection. In Advances in Neural Information Processing Systems, pages 617–624, 2006.
- [12] A. K. Jain, M. N. Murty, and P. J. Flynn. Data clustering: A review. ACM Comput. Surv., 31(3):264–323, Sept. 1999.
- [13] H. A. L. Kiers. Towards a standardized notation and terminology in multiway analysis. Journal of Chemometrics, 14(3):105–122, 2000.
- [14] T. G. Kolda and J. Sun. Scalable tensor decompositions for multi-aspect data mining. In 2008 Eighth IEEE International Conference on Data Mining, 2008.
- [15] D. C. Montgomery. Introduction to Statistical Quality Control. John Wiley and Sons, 4th. edition, 2001.
- [16] A. J. Oliner, A. Aiken, and J. Stearley. Alert detection in system logs. In 2008 Eighth IEEE International Conference on Data Mining, pages 959–964, Dec 2008.
- [17] J. Palmer, S. Gallo, T. Furlani, M. Jones, R. DeLeon, J. White, N. Simakov, A. Patra, J. Sperhac, T. Yearke, R. Rathsam, M. Innus, C. Cornelius, J. Browne, W. Barth, and R. Evans. Open XDMoD: A tool for the comprehensive management of high-performance computing resources. Computing in Science Engineering, 17(4):52–62, 2015.
- [18] M. Peiris, J. H. Hill, J. Thelin, S. Bykov, G. Kliot, and C. Konig. Pad: Performance anomaly detection in multi-server distributed systems. In Proceedings of the 2014 IEEE International Conference on Cloud Computing, pages 769–776, 2014.
- [19] A. Pelaez, A. Quiroz, J. C. Browne, E. Chuah, and M. Parashar. Online failure prediction for hpc resources using decentralized clustering. In 2014 21st International Conference on High Performance Computing (HiPC), pages 1–9, 2014.
- [20] T. Reidemeister, M. A. Munawar, M. Jiang, and P. A. S. Ward. Diagnosis of recurrent faults using log files. In Proceedings of the 2009 Conference of the Center for Advanced Studies on Collaborative Research, pages 12–23, 2009.
- [21] Theano Development Team. Theano: A Python framework for fast computation of mathematical expressions. arXiv e-prints, abs/1605.02688, 2016.
- [22] L. R. Tucker. Some mathematical notes on three-mode factor analysis. Psychometrika, 31(3):279–311, 1966.
- [23] W. Xu, L. Huang, A. Fox, D. Patterson, and M. Jordan. Mining console logs for large-scale system problem detection. In Proceedings of the Third Conference on Tackling Computer Systems Problems with Machine Learning Techniques, SysML’08, pages 4–4, Berkeley, CA, USA, 2008. USENIX Association.
- [24] X. Zhang, G. Wen, and W. Dai. A tensor decomposition-based anomaly detection algorithm for hyperspectral image. IEEE Transactions on Geoscience and Remote Sensing, 54(10):5801–5820, 2016.
- [25] Scikit Tensor. https://github.com/mnick/scikit-tensor.