Abstract
I describe the manifestation of the non-Euclidean geometry in the behavior of collective observables of some complex physical systems. Specifically, I consider the formation of equilibrium shapes of plants and statistics of sparse random graphs. For these systems I discuss the following interlinked questions: (i) the optimal embedding of plants leaves in the three-dimensional space, (ii) the spectral statistics of sparse random matrix ensembles.
Chapter 0 Non-Euclidean geometry in nature
1 Non-Euclidean geometry in complex physical systems: Knots, jupe à godets, ultrametricity and number theory
Our everyday experience tells us that we live in a three-dimensional Euclidean space… well, in a four-dimensional space-time, if we take into account the fourth dimension, the time. If gravitational effects are supposed to be negligible, we expect that this four-dimensional space-time, , is flat and has Euclidean metric, . However, when looking at the world around us through the magnifying glass, one can notice various incarnations of the non-Euclidean Hyperbolic geometry, also known as the Lobachevsky geometry, in the behavior of collective observables of some complex systems. The Lobachevsky geometry emerges in bizarre buckling of some leafs of plants, in structure of cones and corals, in fashion of clothes, in folding of DNA in chromosomes, in statistics of eigenvalues of rare random clusters…
Despite all these systems are of very different physical origins, they still have some common property which is crucial for the nontrivial statistical behavior of collective variables: the systems considered above have exponential number of states, and these states should be embedded into the low-dimensional “physical” space subject to some natural constraints. What is seen as a result – is an “optimal” (typical) statistical configuration which minimizes the “conflicts” imposed by constraints. Namely,
-
-
for a leaf of a plant, the exponential proliferation of cells is in conflict with the embedding of a growing tissue into the tree-dimensional space, thus leading to a peculiar stable fractal boundary structure of the plant;
-
-
for packing of a DNA in chromosome, the selection of an unknotted compact loop among exponentially large number of various topological states, leads to a stable space-filling hierarchical fractal folding of the entire molecule;
-
-
for an ensemble of sparse adjacency matrices, the condition to have small fraction of non-zero elements in each row and column leads to a stable ultrametric structure of the eigenvalue density which is ultimately related to the energetic approach of compressed lattices considered in the context of phyllotaxis.
The review is structured as follows. The Section 1 consists of four introductory parts 1-4, where the problems and questions dealing with manifestation of Hyperbolic geometry in nature are formulated, while the detailed consideration of subjects mentioned in Subsections 2-4 are provided in Sections 2 and 3.
1 Topology of knots
Unknotting heavily tangled ropes, we are not even surprised that long threads, left to themselves, get entangled in most the unpleasant way of all. We can only utter a bitter sigh, when almost unravelled ball of wool accidentally falls into the clutches of a curious kitten… and definitely, we are hardly aware that the spontaneous knotting of long strands, managed by the laws of probability theory, is a consequence of non-Euclidean geometry of the phase space of knots, i.e., a hypothetical space that contains all possible knots and in which there is a concept of metric, or the distance between ”topologically similar” knots. The more the topological types of two knots differ, the greater the distance between them in this space. In general, the construction of this space, called the universal covering, and the description of its properties, are challenging problems. However, for some special cases, this space can be described analytically. So, it turns out that, in order to untie ropes in a purely scientific way, one has first to understand the Lobachevsky-Riemann geometry and its relation to knot theory, and then to learn how probability theory works in this non-Euclidean space.
Some conceptual steps in the analytic description of topological interactions, which constitute the basis of a new interdisciplinary branch in mathematical physics, emerging at the edge of topology and statistical physics of fluctuating non-phantom rope-like objects have been reviewed in Ref. [1]. This new branch is called statistical (or probabilistic) topology. Its most fascinating manifestation, in my opinion, is connected with the nonperturbative description of DNA packing in chromosomes in a form of a crumpled globule [2, 3]. After the experimental work [4] of the MIT-Harvard team in 2009, the concept of crumpled globule became a kind of a new paradigm allowing to understand the mathematical origin of many puzzling features of DNA structuring and functioning in the human genome. The mathematical background of the crumpled globule deals with the statistics of Brownian bridges in the non-Euclidean space of constant negative curvature (see Ref. [1] for review).
The crumpled globule shown in Fig. 1a is a state of a polymer chain which in a wide range of scales is self-similar and almost unknotted, forming a fractal space-filling structure. The chain is painted from one end to another in continuously changing colors from red to violet. Such painting allows to visualize the peculiar spatial structure of the globule: parts of the chain which are neighbors along the path, are also neighbors in the space. This structure resembles the three-dimensional Peano curve depicted in Fig. 1b.
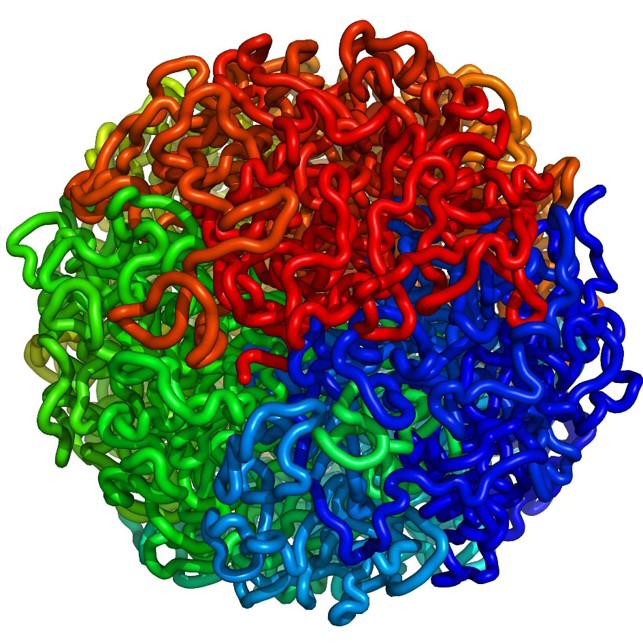
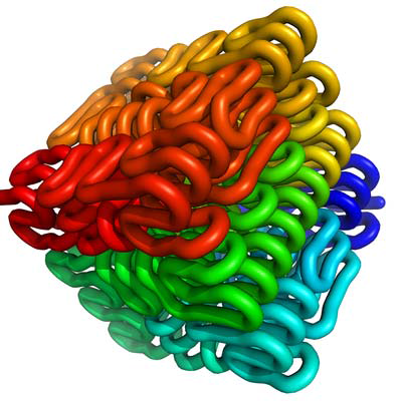

The self-similarity and the absence of knots, are essential for genome folding: fractal organization makes genome tightly packed in a broad range of scales, while the lack of knots ensures easy and independent opening and closing genomic domains, necessary for transcription [3, 5]. In a three-dimensional space such a tight packing results in a space-filling with the fractal dimension . The contact probability, , between two genomic units, and in a -unit chain, depends on a combination of structural and energetic factors. Simple mean-field arguments (see, for example, Ref. [4]) demonstrate that in a fractal globule with the average contact probability, , between two units separated by the genomic distance , decays as
Combining the general hierarchical fractal globule folding mechanism with the assumption that chromatin can be considered as a heteropolymer chain with a quenched primary sequence [6], one can reproduce the large-scale chromosome compartmentalization, not assumed explicitly from the very beginning. The account for the hierarchical folding together with the conjecture about quenched heterogeneous volume interactions [7] results in construction of artificial maps, possessing ultrametric properties (see the next Section for discussion of ultrametricity). The structures found in the frameworks of the toy model resemble the so-called Hi-C222Genome-whide chromosome conformational capture method contact maps experimentally observed in chromosomes.
It should be mentioned that the crumpled globule resembles the Korean fast food ”dosirak” shown in Fig. 1c which is the brick of dehydrated spaghetti. This resemblance has a deep physical sense: to absorb water effectively, spaghetti should unfold quickly as hot water penetrates inside the brick, to allow exterior folds open sequentially as fast as possible.
In this review I will not discuss anymore questions dealing with non-Euclidean geometry in statistics of knots, since this subject has deserved much attention in Ref. [1]. Rather I will concentrate on other challenging manifestations of hyperbolic geometry in physics where the ”conflict” between the hyperbolic protocol of growth of natural tissues (like plants) with the restricted geometry of the three-dimensional space leads to high variety of self-similar shapes.
2 Buckling of leaves
Walking in the garden on in the forest we are often fascinated by diversity of shapes of buckled and wrinkled leaves and flowers of plants. Such amusing variety of their forms has very straightforward geometrical explanation. Buckling of the two-dimensional growing tissues emerges due to the incompatibility of local internal (differential) growth protocol with geometric constraints imposed by embedding of these tissues into the space. For example, buckling of a lettuce leaf (see Fig. 2a) can be naively explained as a conflict between natural growth due to the periphery cells division (typically, exponential), and growth of circumference of a planar disc with gradually increasing radius. Due to a specific biological mechanism which inhibits growth of the cell experiencing sufficient external pressure, the division of inner cells is insignificant, while periphery cells have less steric restrictions and proliferate easier. Thus, the division of border cells has the major impact on the instabilities in a tissue. Such a differential growth induces an increasing strain in a tissue near its edge and results in two complimentary possibilities: i) in-plane tissue compression and/or redistribution of layer cells accompanied by the in-plane circumference instability, or ii) out-of-plane tissue buckling with the formation of saddle-like surface regions. The latter is typical for various undulant negatively curved shapes which are ubiquitous to many mild plants growing up in air or water where the gravity is of sufficiently small matter [8, 9].
The circular surface whose perimeter grows exponentially with the radius is called hyperbolic. Currently, two groups of works, devoted to the determination of shapes of growing tissues, can be distinguished in the literature. In the first group of works, denoted as “geometric” in Refs. [10, 11, 12, 13], the determination of the typical profile of 2D surface is dictated by optimal ”isometric” embedding of discretized 2D surface into 3D space, and is described by an appropriate change of conformal metrics.
In the second, more numerous group of works [14, 15, 16, 17, 18, 9], conventionally named “energetic”, more realistic approach, based on a minimization of a bending free energy of non-uniformly deformed thin elastic plates, is realized. Authors of almost all works, devoted to buckling of 2D growing tissues, state that geometric and energetic approaches are complimentary to each other. Besides, still an explicit comparison of results of geometric and energetic approaches is very demanded.
Here we stay in the frameworks of the geometric approach. Take some elementary bounded domain of a flat surface, make finite radial cuts and insert in these cuts flat triangles, modelling the newly born periphery cells. The resulting surface obtained by joining together all elementary domains and inserted extra triangles, is not flat anymore. Continue the process recursively as shown in Fig. 2b, i.e. make cuts in the new surface, insert extra flat triangles and so on… One gets this way a surface whose perimeter and area grow exponentially with the radius. Anyone who pays attention to the tendencies in fashion can immediately recognize in the growth protocol described above, the so-called ”jupe à godets” shown in the Fig. 2c.

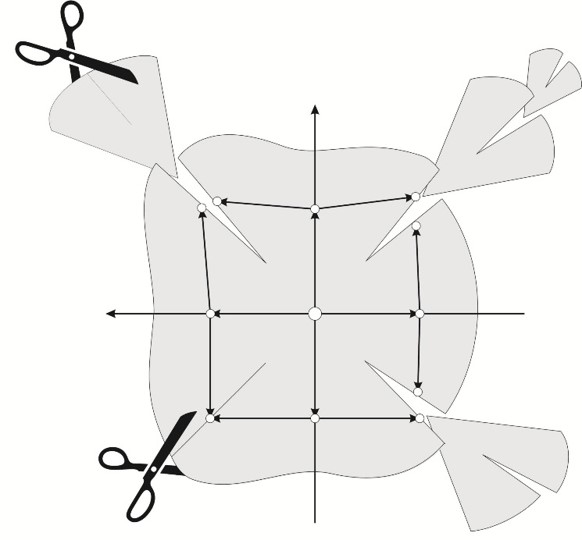

A similar problem had been discussed by the great the Russian mathematician, P.L. Chebyshev in his talk ”On the cut of clothes” in Paris in August of 1878. Some traces concerning this talk could be found in Ref. [19], however apparently the entire work has remained unpublished. Among the modern developments of that subject one can mention the paper [20] by P. Bowers proving in 1997 the theorem on quasi-isometric embedding of a uniform binary tree into a negatively curved space, as well as the contribution [21] by S. Duval and M. Tajine devoted to isometric embeddings of trees into metric spaces for fractal description. Despite rather transparent geometrical image, the very problem under consideration is still too vague. Let us formulate it in more rigorous terms, which allow for the mathematical analysis.
To make our viewpoint more transparent, suppose that all cells in a growing colony, represented by equilateral triangles, divide independently and their proliferation is initiated by the first ”protocell”. Connecting the centers of neighboring triangles by nodes, we rise a graph . The number of vertices, , in the generation , grows exponentially with : (). It is known that the exponential graphs possess hyperbolic metrics, meaning that they can be isometrically (with fixed branch lengths and angles between adjacent branches) embedded into a hyperbolic plane. Thus, it is clear, that the corresponding surface, pulled on the isometry of such graph in the 3D Euclidean space, should be negatively curved. To have a relevant image [22], suppose that we grow the surface by crocheting it spirally starting from the center. Demanding two nearest neighboring circumference layers, and , to differ by a factor of 2, i.e., , we construct an exponentially growing surface – see the Fig. 3a known in geometry as Amsler surface [23].
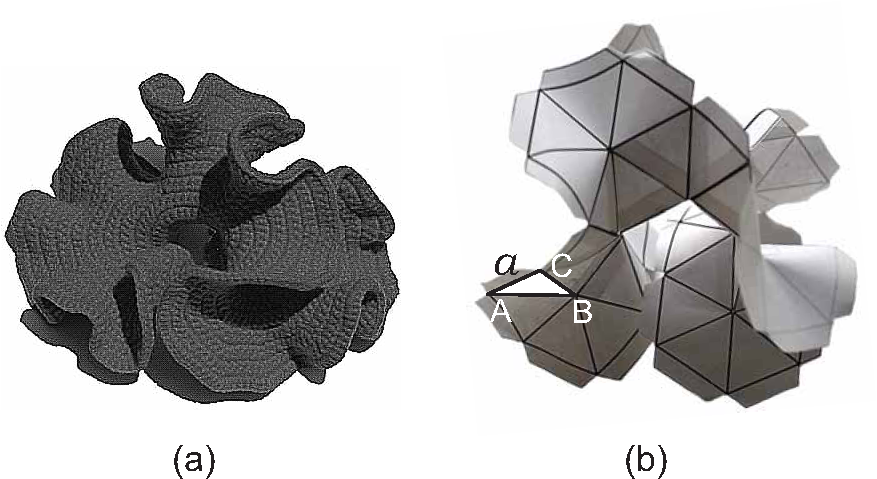
The crocheting surface has well-posed properties on large scales, but should be precisely described on the scale of order of the elementary cell. As we have mentioned, the microscopic description is connected with the specific local growth protocol. The simplest way to generate the discrete hyperbolic-like surface out of equilateral triangles, consists in gluing 7 such triangles in each graph vertex and construct a piecewise surface , shown in the Fig. 3b. On the scale less than the elementary cell this surface is flat. Thus, the size () of the triangle stands for the rigidity parameter, playing the role of a characteristic scale in our problem, on which no deviations from the Euclidean metrics survive. Later on we shall see that bending ability of growing surface crucially depends on this parameter: above some critical buckling is suppressed, while below the tissue is flexible enough and buckling is profound.
3 Ultrametricity
Embedding of a Cayley tree into the metric space is called ”isometric” if covers that space, preserving all angles and distances. The Cayley tree isometrically covers the surface of constant negative curvature (the Lobachevsky plane) . One of possible representations of , known as a Poincaré model, is the upper half-plane of the complex plane endowed with the hyperbolic metric . In Ref. [11] we have constructed the ”continuous” analog of the standard 3-branching Cayley tree by means of modular functions and have analyzed the structure of the barriers separating the neighboring valleys. In particular, we have shown that these barriers are ultrametrically organized.
A metric space is a set of elements equipped by pairwise distances. Generically, the metric meets three requirements:
-
i)
Non-negativity, for , and for
-
ii)
Symmetry,
-
iii)
the triangle inequality, .
The concept of ultrametricity is related to a special class of metrics, obeying the strong triangular inequality, , which allows the existence of acute isosceles and equilateral triangles only.
The strong triangle inequality radically changes the properties of spaces in comparison with our intuitive expectations based of Euclidean geometry. In ultrametric spaces, the sum of distances does not exceed the largest summand, i.e. the Archimedean principle does not hold. Few counterintuitive properties are related to ultrametric balls: every point inside a ball is its center; the radius of a ball is equal to its diameter; there are no balls that overlap only partially, if two balls have a common point, then one of them is completely embedded into the other. The last property implies that any ultrametric ball can be divided into a set of smaller balls, each of them can be divided into even smaller ones, etc. In other words, an ultrametric space resembles not a line of segments, but a branching tree of hierarchically nested balls (“basins”). The terminal points of a tree, constituting the tree boundary, also obeys the strong triangle inequality: for any two points, and , the distance to the root of the minimal subtree to which these points belong, determines the distance between and . As a result, ultrametric geometry, in general, fixes taxonomic (i.e. hierarchical) tree-like relationships between the elements and, speaking figuratively, is closer to Lobachevsky geometry, rather to the Euclidean one.
Perhaps most naturally ultrametric spaces emerge in the realm of complex systems. Indeed, the ultrametric description is inherently multi-scale, thus it is not surprising that ultrametricity provides a fertile framework for describing complex systems characterized by a large number of order parameters. For instance, signatures of ultrametricity were discovered in the context of spin glasses (see Ref. [24] for an earlier review). Spin glasses are characterized by a huge number of metastable states and the equilibration in spin glasses proceeds via tree-like splitting of the phase space into hierarchically nested domains. When the temperature decreases, the most distant groups of spin-glass states get factorized first. Then, each of these groups splits into a number of subgroups, etc. The scales of hierarchically nested sets of equilibrated states satisfy the strong triangle inequality, i.e. the multi-scale splitting of spin-glass phases obey ultrametric relations.
Shortly after the formulation of the ultrametric ansatz in the context of spin glasses, similar ideas were proposed for the description of native states of protein molecules [25, 26]. Proteins are highly frustrated polymer systems characterized by rugged energy landscapes of very high dimensionality. The ultrametricity of proteins implies a multi-scale representation of the protein energy landscape by means of ranging the local minima into hierarchically embedded basins of minima. Ultrametricity follows from the conjecture that the equilibration time within the basin is significantly smaller than the time to escape the basin. As a result, the transitions between local minima obey the strong triangle inequality. In such an approximation, dynamics on a complex energy landscape can be modelled via a jump-like random process, propagating in an ultrametric space of states. The approximation of the protein energy landscape by a self-similarly branching tree of basins has been shown to be very fruitful for describing a large body of experimentally justified features of protein conformational dynamics and protein fluctuation mobility at temperatures covering very wide range from room temperatures up to the deeply frozen states [27].
Ultrametricity emerges in diverse subjects, e.g., in genetic trees, in the behavior of hierarchically organized ecological, social, and economic systems, etc. The fact that ultrametricity is naturally rooted in high dimensionality, randomness, and sparse statistics, has been unambiguously shown recently in Ref. [28]. It was proven that in a -dimensional Euclidean space the distances between points in a highly sparse sampling tends to the ultrametric distances as .
Here we review another intriguing connection between rare-event statistics, ultrametricity and hyperbolic geometry. Consider a large symmetric matrix . The matrix elements, , are assumed to be independent, identically distributed, binary random variables, such that diagonal elements vanish, , and
for . The matrix can be regarded as an adjacency matrix of a random Erdős-Rényi graph, , without self-connections. The eigenvalues, (), of the symmetric matrix are real. Let be the eigenvalue density of the ensemble of such matrices. For the limiting shape of is known in various cases. If , the function tends to the Wigner semicircle law, , typical for the Gaussian matrix ensembles. For (), the matrix is sparse and the density of the sparse matrix ensemble has singularities at finite values of (see Refs. [29, 30, 31]). In Refs. [32, 33, 34, 35], the behavior of the spectral density, , has been analyzed near (). It has been pointed out that the function becomes more and more singular as approaches 1 from above.
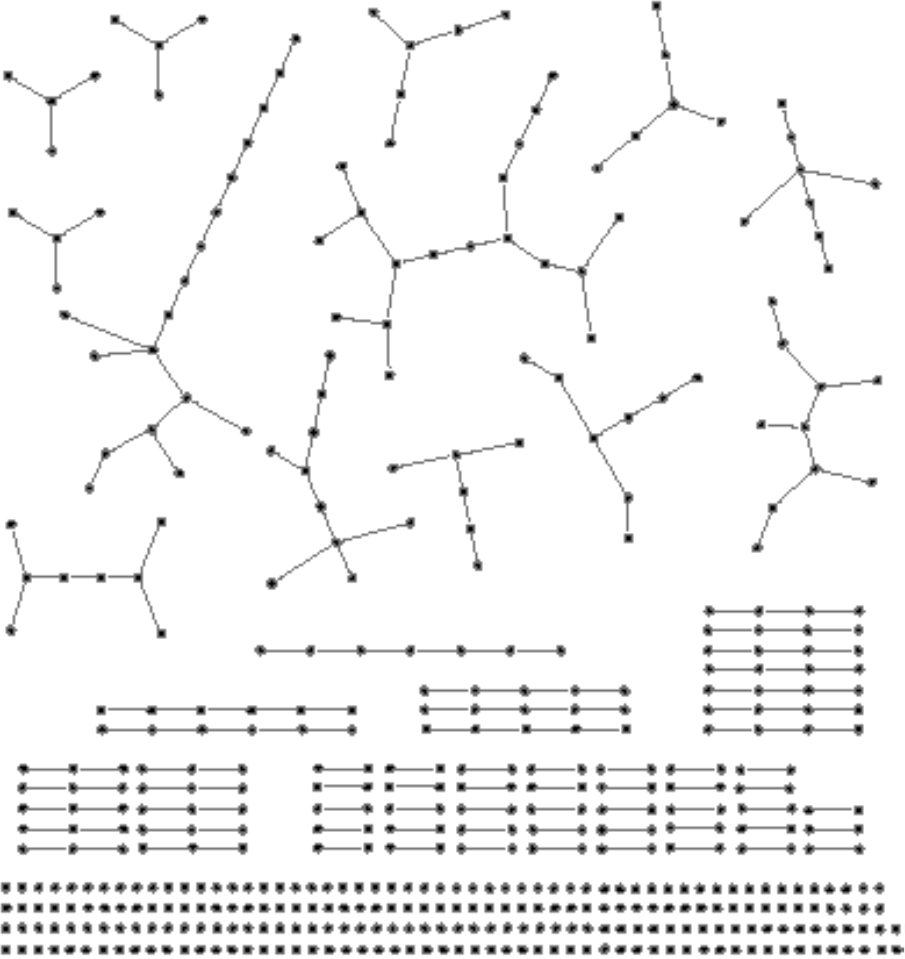
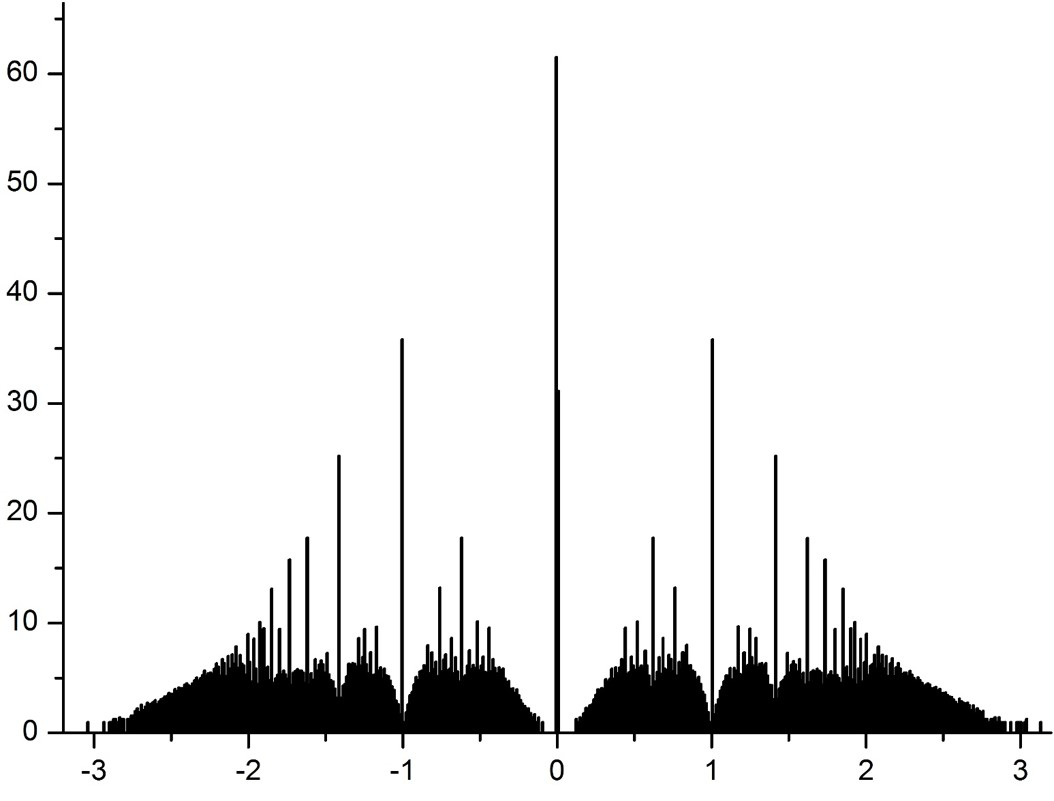
In ensemble of matrices the percolation point is (the true phase transition is defined in the thermodynamic limit, , only). For , the graph has a giant component whose size is proportional to , accompanied with numerous small components (almost all of them are trees); for , the graph is composed of the collection of small components (almost all of them are again trees). For the isolated vertices dominate, contributing to the trivial spectral density, . The most interesting region is close to . In the scaling window , the size of the largest component scales as . In what follows we discuss the behavior of the spectral density for in this region. An example, in Fig. 4a we depict a collection of subgraphs for some randomly generated adjacency matrix at is shown. Note that the components are predominantly linear subgraphs. In other realizations we observed components with a single loop, but they are rare, usually a few per realization; more complicated components, namely those with more than one loop, appear very rarely. In Fig. 4b we show a spectral density, plotted as , for an ensemble of 1000 random symmetric adjacency matrices , each of size at . Near the value the enveloping curve exhibits a clearly visible fracturel. The choice of the exponent 1/3 for the curve is an ”experimental” selection: we have just noted that such a scaling gives the best linear shape for the enveloping curve and clearly demonstrates the fracture of the shape near . The spectrum possesses the regular ultrametric hierarchical structure which is ultimately related to number-theoretic properties of some modular functions with discrete symmetries of the Lobachevsky plane.
Our discussion provides an example of a nontrivial manifestation of rare-event Bernoullian noise in some collective observables in large systems (like spectral density, , for example). From this point of view, we want to warn researchers working with effects of ultra-low doses of chemicals: in the statistical analysis of, say, absorption spectra of extremely diluted solutions of chain-like polymer molecules, the valuable signal should be clearly purified from the background noise, which itself could have a very peculiar ultrametric shape.
4 Phyllotaxis
Amusing connection of cell packing with Fibonacci sequences, known as phyllotaxis, was observed long time ago in studies of many naturalists, and currently is one of most famous manifestations of number theory in natural science – see Fig. 5a,b. The generic description of growing plants based on symmetry arguments, allowed to uncover the role of Farey sequences in the plant’s structure formation, however the question why nature selects just the Fibonacci sequence among other possible Farey ones, was hidden until modern time. A tantalizing answer to this question has been given by L. Levitov in 1990 (see Ref. [36]) who proposed an ”energetic” approach to the phyllotaxis, suggesting that the development of a plant is connected with an effective motion along the geodesics on a Riemann surface associated with the energetic relief of a growing tissue.


The energetic mechanism suggested in Ref. [36] was applied later in [37] to the investigation of geometry of flux lattices pinned by layered superconductors. It has been shown that under the variation of magnetic field, the structure of the flux lattice can undergo a sequence of rearrangements encoded by the Farey numbers. However, dynamically accessible lattices are characterized by the subsequence of the Farey set, namely, by the Fibonacci numbers. Very illuminating experiments have been provided in Ref. [38] for lattice formed by drops in rotating liquid, and in Ref. [39] for equilibrium structure of ”magnetic cacti”.
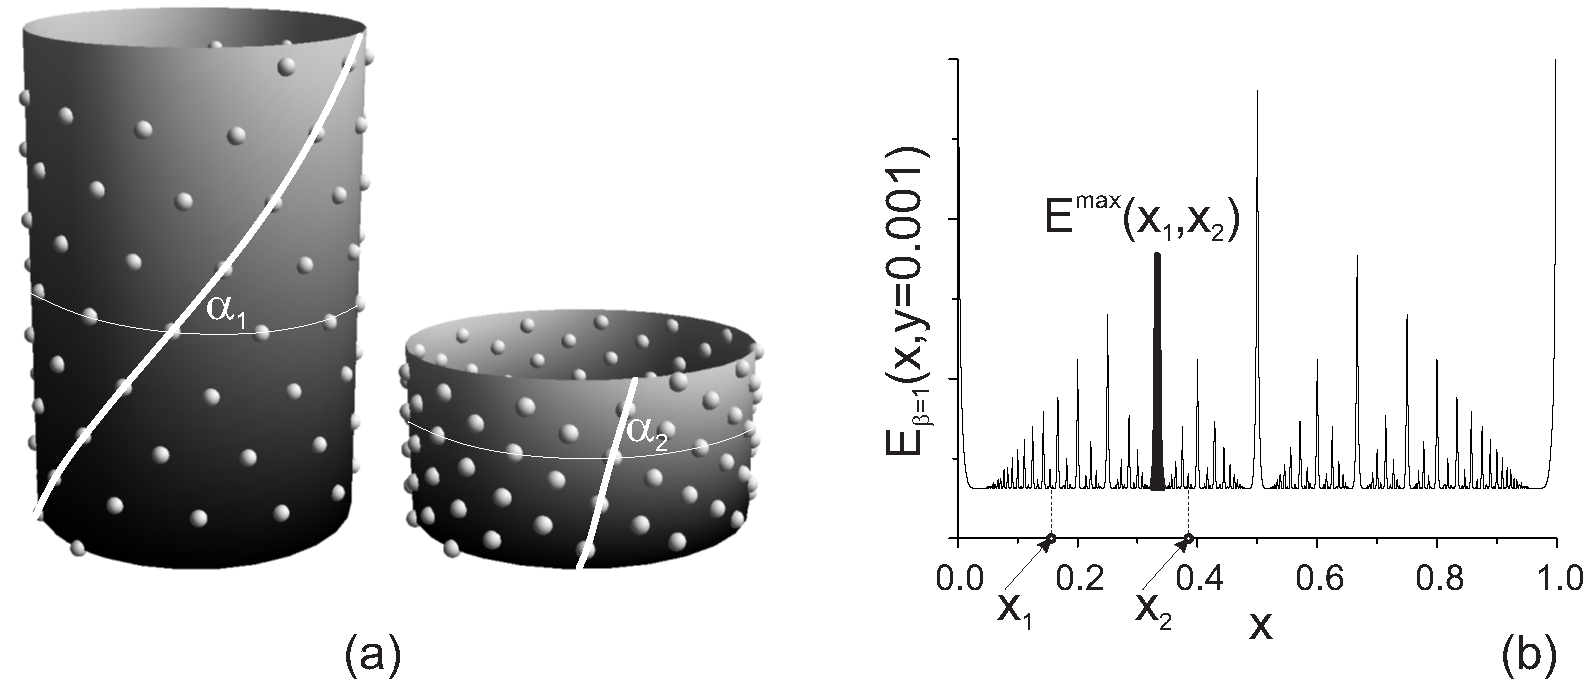
Following L. Levitov, consider the model system of strongly repulsing particles equilibrated on the surface of a cylinder of fixed diameter, , and hight, , and look at the rearrangement of these particles when the cylinder is compressed along its height under the condition that and remain unchanged – see Fig. 6a. At the continuous compression, for each height, the particles form a lattice with a minimal energy. Different lattice topologies, parameterized by the modular parameter, represent in the phase space the valleys separated by energetic barriers having non-Archimedian ultrametric structure and the lattice ground state energy, , can be expressed in terms of the so-called modular Dedekind -function. Moreover, one can relate to the spectral density, , of an ensemble of exponentially distributed bi-diagonal operators with the off-diagonal disorder. The ultrametric organization of the energy relief, as a function of , should be understood as follows. Identifying the energy with the metrics, namely setting as shown in the Fig. 6b we immediately arrive at the picture which resembles the Fig. 4. In details this scenario is considered in the Section 3.
In Secton 3 we claim that the ultrametricity is the consiquence of number-theoretic collective properties of distributions appearing in discrete physical systems when some observable is a quotient of two independent exponentially weighted integers. The example is the density of eigenvalues of the ensemble of linear polymer chains distributed with the exponential law (), where is the chain length. As , the spectral density can be expressed through the function, discontinuous at all rational points, known as Thomae (”popcorn”) function. We suggest a continuous approximation of the popcorn function, based on the Dedekind -function near the real axis. Moreover, we provide simple arguments, based on the ”Euclid orchard” construction, that demonstrate the presence of Lifshitz tails at the spectral edges, typical for the 1D Anderson localization. We emphasize that the ultrametric structure of the spectral density is ultimately connected with number-theoretic properties of modular functions.
2 Buckling of thin tissues and hyperbolic geometry
1 Basic facts about the eikonal equation
To make the content of the paper as self-contained as possible, it seems instructive to provide some important definitions used at length of the paper. The key ingredient of our consideration is the ”eikonal” equation, which is the analogue of the Hamilton-Jacobi equation in geometric optics. As we show below, the eikonal equation provides optimal embedding of an exponentially growing surface into the 3D Euclidean plane. Meaning of the notion ”optimal” has two different connotations in our approach:
-
i)
On one hand, from viewpoint of the Hamilton-Jacobi theory, the eikonal equation appears in the minimization of the action with some Lagrangian . According to the Fermat principle, the time of the ray propagation in the inhomogeneous media with the space-dependent refraction coefficient, , should be minimal.
-
ii)
On the other hand, the eikonal equation emerges in our work in a purely geometric setting following directly from the conformal approach.
First attempts to formulate classical mechanics problems in geometric optics terms goes back to the works of Klein [40] in 19th century. His ideas contributed to the corpuscular theory in a short-wavelength regime, as long as the same mechanical formalism applied to massless particles,was consistent with the wave approach. Later, in the context of general relativity, this approach was renewed to treat gravitational field as an optic medium [41].
The Fermat principle states that the time for a ray to propagate along a curve between two closely located points and in an inhomogeneous media, should be minimal. The total time can be written in the form where is the refraction coefficient at the point of a -dimensional space , and are correspondingly the light speeds in vacuum and in the media, and is the spatial increment along the ray. Following the optical-mechanical analogy, according to which the action in mechanics corresponds to eikonal in optics, one can write down the ”optic length” or eikonal, in Lagrangian terms: with the Lagrangian , where . We would like to mention here, that optical properties of the media can be also treated in terms of induced Riemann metrics in vacuum:
| (1) |
where stands for induced metrics components in isotropic media case. Thus, from the geometrical point, the ray trajectory can be understood as a ”minimal curve” in a certain Riemann space. This representation suggests to consider optimal ray paths as geodesics in the space with known metrics .
Stationarity of optic length, , i.e. , together with the condition , defines the Euler equation:
| (2) |
from which one can directly proceed to the Huygens principle by integrating (2) over : . Squaring both sides of the latter equation we end up with the eikonal equation:
| (3) |
The eikonal equation Eq.(3) has the same form as the Hamilton-Jacobi equation in mechanics for action in the -dimensional space, which in turn can be understood as the relativistic equation for the light, propagating in the Riemannian space.
2 The model: formalization of physical ideas
We discuss buckling phenomena for two different growth symmetries shown schematically in the Fig. 7a-b:
-
i)
uniform two-dimensional division from the point-like source (Fig. 7a),
- ii)
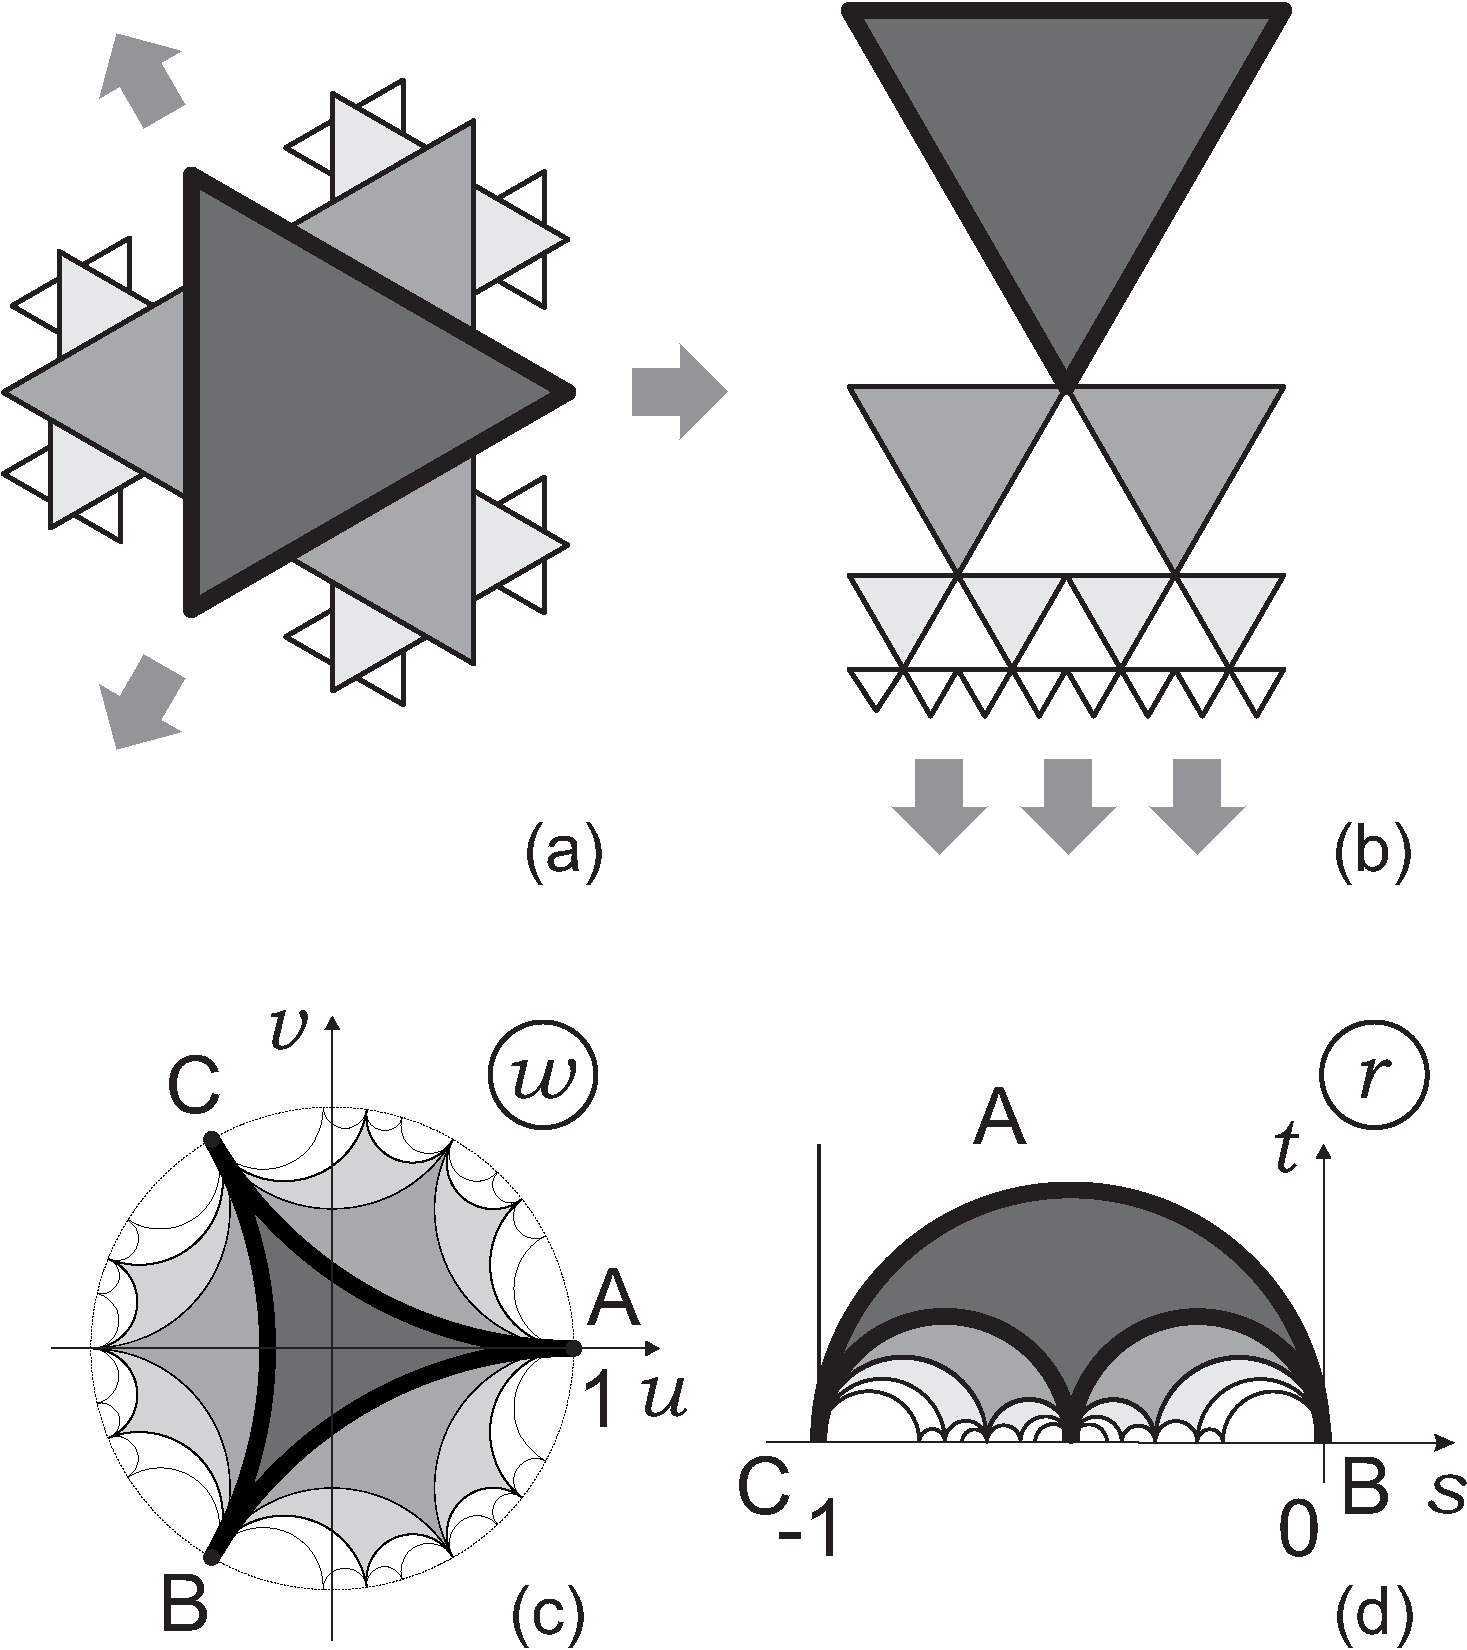
For convenience of perception, sizes of cells in each new generation are decreasing in geometric progression, otherwise it would be impossible to draw them in a 2D flat sheet of paper and the figure would be incomprehensible. In Figs. 7c,d we imitate the protocols of growth depicted above in Figs. 7a,b by embedding the exponentially growing structure in the corresponding plane domain equipped with the hyperbolic metrics. The advantage of such embedding consists in the possibility to continue all functions smoothly through the boundaries of elementary domains, that cover the whole plane without gaps and intersections. Details of this construction and its connection to the growth in the 3D Euclidean space are explained below.
It is known (see, for example Ref. [17]) that the optimal buckling surface is fully determined by the metric tensor through the minimization of the discrete functional of special energetic form. Namely, define the energy of a deformed thin membrane, having buckling profile above the domain, parameterized by , as:
| (4) |
where is the induced metrics of the membrane, is the distance between neighboring points and is the equilibrium distance between them. The typical (optimal) shape is obtained by minimization of (4) for any rigidity. However, the metric tensor, is a priori unknown since its elements depend on specifics of the differential growth protocol, therefore some plausible conjectures concerning its structure should be suggested. For example, in Ref. [17] a directed growth of a tissue with one non-Euclidean metrics component, , was considered. The diagonal component was supposed to increase exponentially in the direction of the growth, , and crumpling of a leaf near its edge was finally established and analyzed.
3 Conformal approach to buckling
The preset rules of uniform exponential cells division determine the structure of the hyperbolic graph, , while the infinitesimal membrane thickness allows for the isometrical embedding of the graph into the 3D space. We exploit conformal and metric relations between the surface structure in the 3D space and the graph embedded into the flat domain with the hyperbolic metrics. The embedding procedure consists of a sequence of conformal transformations with a constraint on area preservation of an elementary plaquette. This eventually yields the knowledge of the Jacobian (the ”coefficient of deformation”), , for the hyperbolic surface, which is embedded into the 3D space via the orthogonal projection. Equipped by the key assumption, that a smooth yet unknown surface is function, our procedure straightforwardly implies a differential equation on the optimal surface. Note that a version of the Amsler surface cannot be reconstructed in the same way since it is not a function above some planar domain.
To realize our construction explicitly, we embed isometrically the graph (as it has been mentioned above):
-
i)
into the Poincaré disk () for the model of uniform planar growth,
-
ii)
into the strip of the half-plane () for the model of one-dimensional growth.
In the Fig. 8 we have drawn the tessellation of the Poincaré disc and of the strip by equilateral curvilinear triangles, which are obtained from the flat triangle of the hyperbolic surface by conformal mappings and discussed below (see Ref. [13] for details). Note, that a conformal mapping preserves the angles between adjacent branches of the graph. The graph , shown in the Fig. 8, connects the centers of the triangles and is isometrically embedded into the corresponding hyperbolic domain. Besides, the areas of images of the domain ABC are the same.
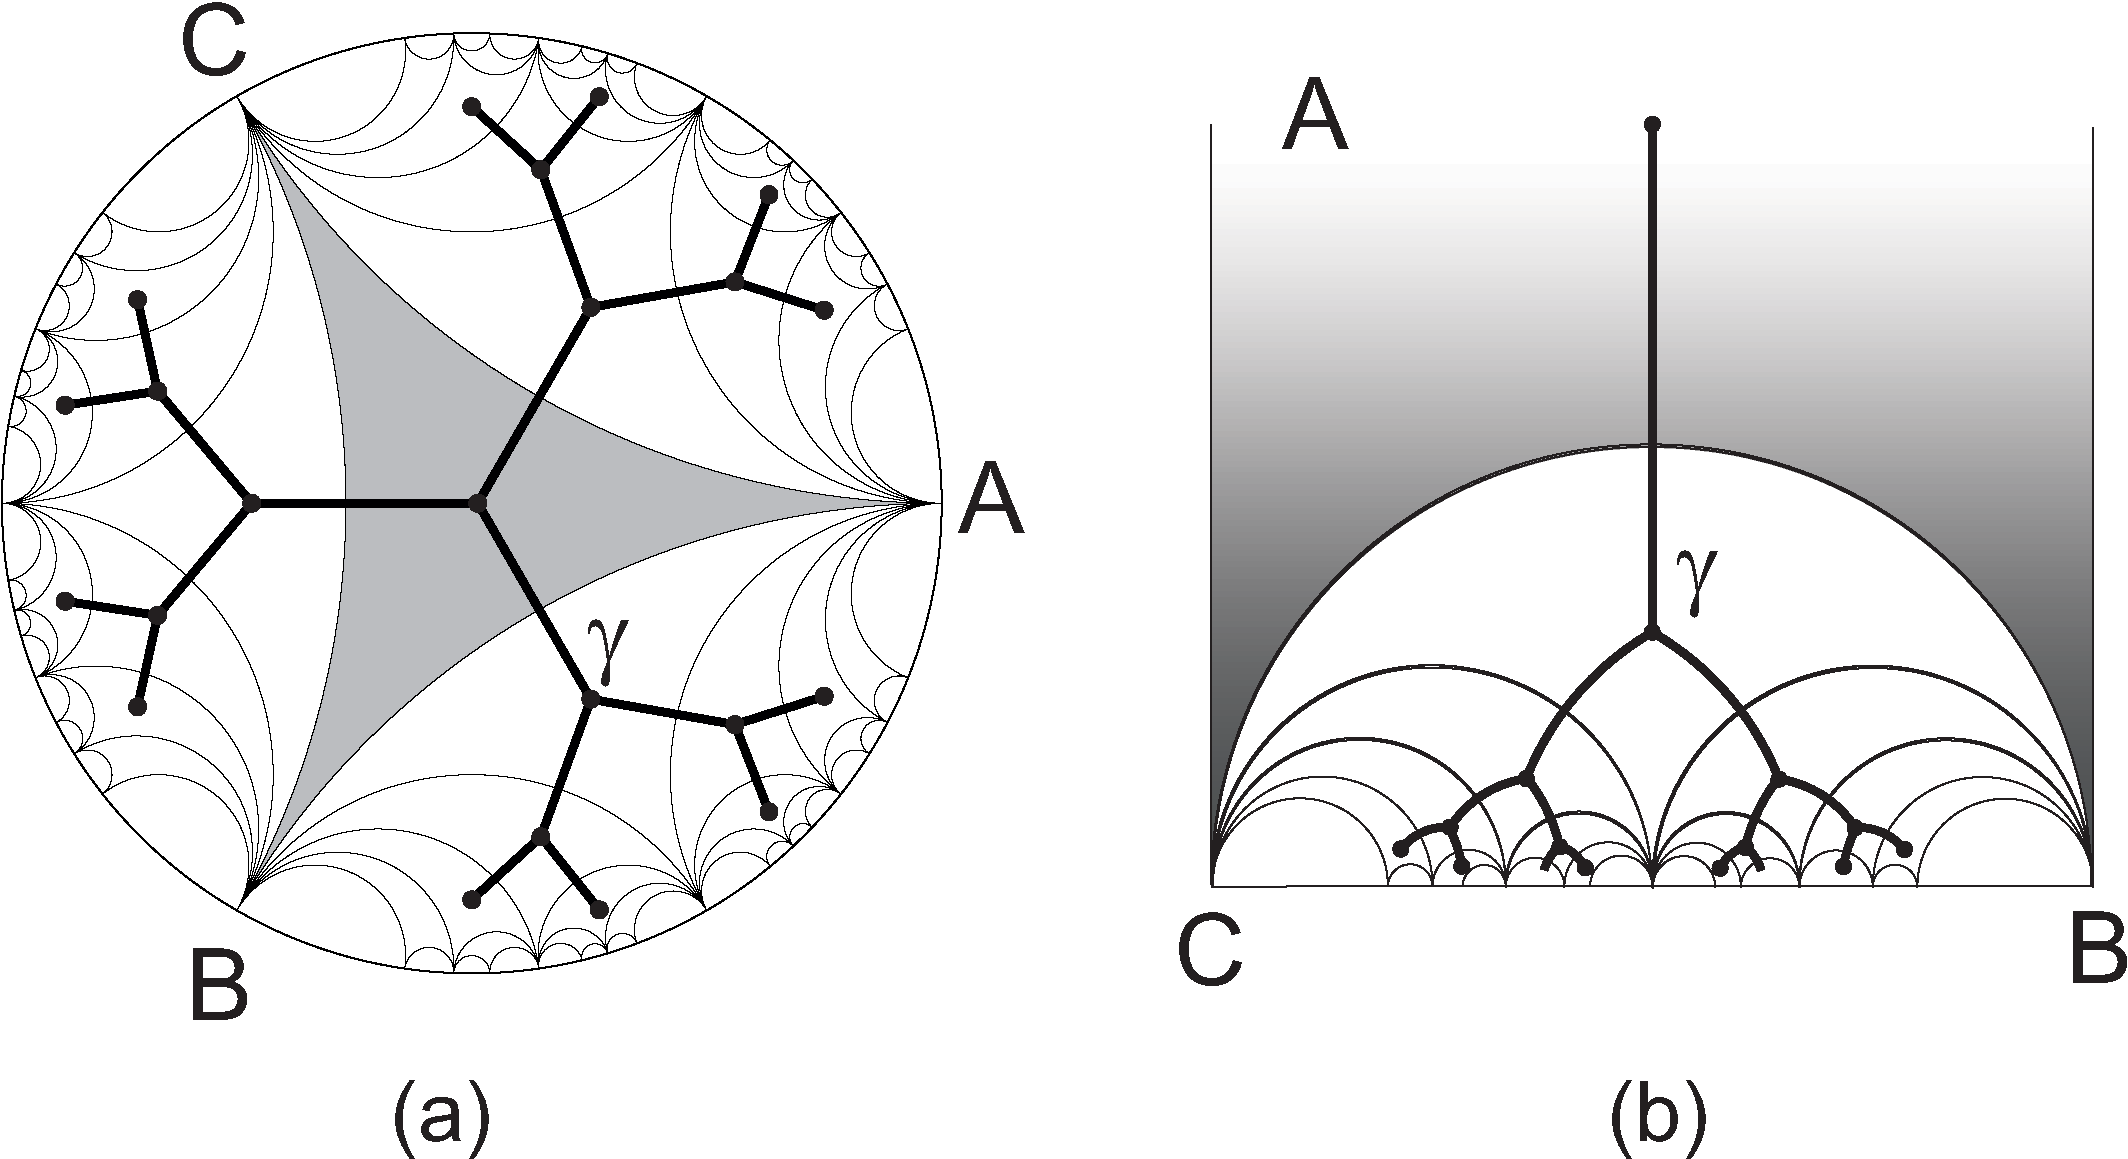
For the sake of definiteness consider the graph , isometrically embedded into the hyperbolic disk, shown in the Fig. 8a. Now, we would like to find the surface in the 3D Euclidean space above the -plane such that its Euclidean metrics coincides with the non-Euclidean metrics in the disk. The Hilbert theorem [42] prohibits to do that for the class of -smooth surfaces. However, since we are interested in the isometric embedding of piecewise surface consisting of glued triangles of fixed area, we can proceed with the standard arguments of differential geometry [43]. The metrics of a 2D surface, parameterized by , is given by the coefficients
| (5) |
of the first quadratic form of this surface:
| (6) |
The surface area then reads .
The area of the planar triangle on the plane can be written as:
| (7) |
where the integration is restricted by the boundary of the triangle. Since we aimed to conserve the metrics, let us require that the area of the hyperbolic triangle , after the conformal mapping, is not changed and, therefore, it reads:
| (8) |
where is the Jacobian of transition form to new coordinates, . If is holomorphic function, the Cauchy-Riemann conditions allow to write
| (9) |
From the other hand, we may treat the value of the Jacobian, , as a factor relating the change of the surface element under transition to a new metrics, the co-called ”coefficient of deformation”. As long as the metrics in the hyperbolic domain should reproduce the Euclidean metrics of the smooth surface, , one should set , where are the coefficients of the first quadratic form of the surface . Now, if is function above -plane, its Jacobian adopts a simple form:
| (10) |
Making use of the polar coordinates in our complex -domain, , we eventually arrive at nonlinear partial differential equation for surface profile in the polar coordinates above :
| (11) |
In the case of the hyperbolic strip domain, Fig. 8b, the equation for the growth profile above the domain can be written in local cartesian coordinates, :
| (12) |
Note, that the inequalities , following from (11)-(12), determine the local condition of existence of non-zero real solution and, as we discuss below, can be interpreted as the presence of a finite scale surface rigidity.
To establish a bridge between optic and growth problems, let us mention that, say, equation (11), coincides with the two-dimensional eikonal equation (3) for the wavefront, , describing the light propagating according the Huygens principle in the unit disk with the refraction coefficient
| (13) |
We can construct the conformal mappings and of the flat equilateral triangle in the Euclidean complex plane onto the circular triangle in the complex domains and correspondingly. The absolute value of the Gaussian curvature is controlled by the number, , of equilateral triangles glued in one vertex: the surface is hyperbolic only for . The surfaces with any have qualitatively similar behavior, however the simplest case for analytical treatment corresponds to , when the dual graph is loopless. The details of the conformal mapping of the flat triangle with side to the triangle with angles in the unit strip are given in Ref. [13]. The Jacobian of conformal mapping reads:
| (14) |
and the Jacobian of the mapping , is written through the function that conformally maps the triangle from the strip onto the Pincaré disk:
| (15) |
where
| (16) |
In (14) and (15), the function is the so-called Dedekind -function [44].
4 Physical interpretation of results and conjectures
The eikonal equation, (3), with constant refraction index, , corresponds to optically homogeneous 2D domain, in which the light propagates along straight lines in Euclidean metrics. From the other hand, in this case the eikonal equation yields the action surface with zero Gaussian curvature: a conical surface above the disk, , for the uniform 2D growth and a plane above the strip, , for the directed growth. Note, that at least one family of geodesics of these surfaces consists of lines that are projected to the light propagation paths in the underlying domain. We will show below that the geodesics of the eikonal surface conserve this property even when the media becomes optically inhomogeneous.
For growth, the constant refraction index corresponds to an isometry of a planar growing surface and absence of buckling. The conformal transformation, that results in the corresponding ”coefficient of deformation”, , is uniformly compressive and the tissue remains everywhere flat. Thus, it becomes clear, why the essential condition for buckling to appear is the differential growth, i.e. the spatial dependence of local rules of cells division.
We solve (11) and (12) numerically with the Jacobian, corresponding to exponentially growing circumference, (14)-(15), for different parameters . We have chosen the Dirichlet initial conditions along the line (for directed growth above the strip) and along the circle of some small enough radius (for uniform 2D growth above the disk). The right-hand side of the eikonal equations for the specific growth protocol is smooth and nearly constant up some radius and then becomes more and more rugged. The constant plateau in vicinity of initial stages of growth is related with the fact, that exponentially dividing cells can be organized in a Euclidean plane up to some finite generations of growth. However, as the cells proliferate further, the isometry of their mutual disposition becomes incompatible with the Euclidean geometry and buckling of the tissue is observed. Note, that the Jacobian is angular-dependent, that is the artefact of chosen triangular symmetry for the cells in our model. The existence of real solution, of the eikonal equation is related to the sign of its right-hand side and is controlled by the parameter , while the complex solution can be found for every .
First, we consider the 2D growth above the Poincaré domain, starting our numerics from low enough values of , for which the right-hand side of the eikonal equation, (11), is strictly positive on the plateau around the source of growth. Physically that means flexible enough tissues, since, by construction, we require to be a scale on which the triangulated tissue does not violate flat geometry. The real solution for these parameters exists up to late stages of growth, see Fig. 10 left. Note, that a conical solution at early stages of growth is related to the plateau in the Jacobain and, as it was discussed above, corresponds to the regime when cells can find place on the surface without violation flat geometry. From the geometric optics point of view, that corresponds to constant refraction index and straight Fermat geodesic paths in the underlying 2D domain. We show in the Fig. 10 that under increasing of the initial area of conical behavior is shrinking, since the critical generation, at which the first buckling mode appears, is lower for larger cells. In course of growth, the surface is getting negatively curved for some angular directions, consistent with chosen triangular symmetry. It is found reminiscent of the shape of bluebells and, in general, many sorts of flowers.
At late stages of growth, as we approach the boundary of the Poincaré disk, at some fixed value of , corresponding values of the right hand side of (11) become negative, leading to the complex solution of the eikonal equation. Fortunately, we may infer some useful information from the holomorphic properties of the eikonal equation in this regime, not too close to the boundary of the disc. Applying the Cauchy-Riemann conditions to the solution of the eikonal equation, , we have: and . Thus, the function can be analytically continued in the vicinity of points along the curve in the plane, at which the right hand side of the eikonal equation nullifies. Moreover, using this property, one can show, that the absolute value of the complex solution in the vicinity of smoothly transfers to the real-valued solution, as one approaches the curve:
| (17) |
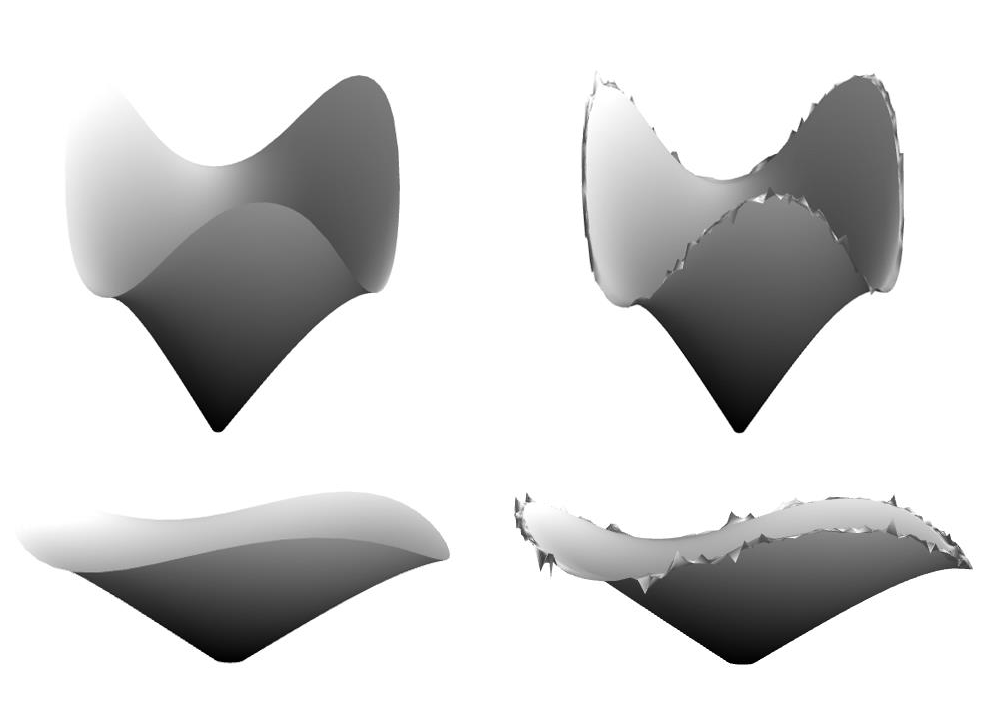
The non-existence of real solutions of the eikonal equation at late stages is a direct consequence of the presence of finite bending scale, on which the tissue is locally flat. As it was mentioned above and is shown in the Fig. 10, low values of lead to elongated conical regime. Since stands for the scale on which the circumference length of the tissue doubles, in the limit the real solution exists everywhere inside the disk, but it is everywhere flat (conical). Hopefully, the analytic continuation allows one to investigate buckling for negative values of by taking the absolute value of the solution, at least not far away from the zero-curve . In this regime buckling instabilities on the circumference of the bluebell arise. In the Fig. 11 we show proliferation of buckling near the critical point. First, the evolution of buckling instabilities at the edge can be understood as a subsequent doubling of peaks and saddles along the direction of growth. Then some hierarchy in peaks size is seen. We note, that this hierarchical organization is a natural result due to the theoretic-number properties of the Dedekind -function. Though it is known, that in real plants and flowers buckling instabilities do not proliferate profoundly, since the division process is getting limited at late stages of growth, the formal continuation of the eikonal equation beyond predicts a self-similar buckling profile at the circumference of growing tissues.
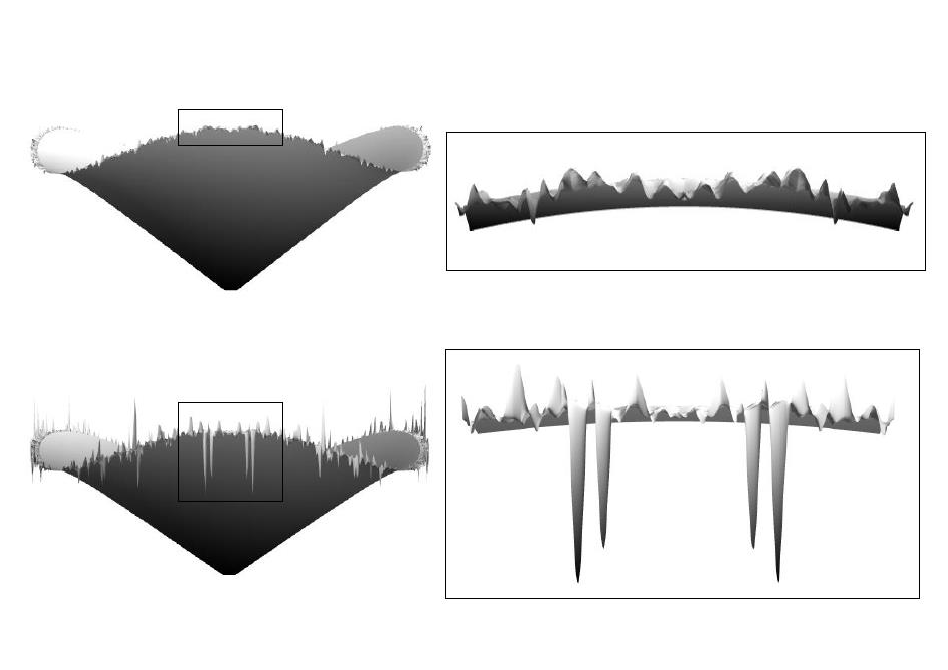
Now we pay attention to the directed growth above the half-plane domain. Here we solve the equation (12) with the Dirichlet boundary conditions, set along the line , and the tissue is growing towards the boundary in the upper halfplane . At low stages of growth the solution is flat until the first buckling mode appear, Fig. 12. The subsequent growth is described by taking the absolute value of the solution, since no real solution exists anymore. As in the former case, the behavior is controlled by the value of .
When the growth approaches the boundary, the edge of the tissue becomes more and more wrinkled. Emergence of new buckling modes is the consequence of the Dedekind -function properties: doubling of parental peaks at the course of growth. Under the energetic approach for a leaf, very similar fractal structures can be inferred from the interplay between stretching and bending energies in the limit of extremely thin membranes: while the cell density (and the corresponding strain, ) on the periphery increases, the newly generating wavelengths decrease, as discussed in Ref. [45].
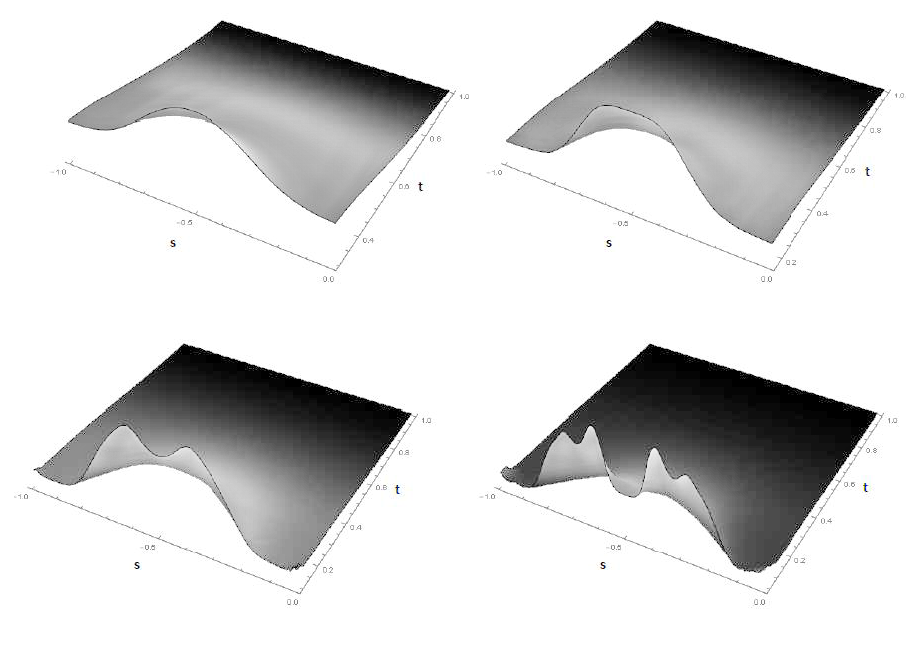
Increasing the size of the elementary flat triangle domain, we figure out, that for some critical value, , the starting plateau of the corresponding Jacobian crosses the zero level and becomes negative. Our model implies no solutions for such stiff tissues. This limitation is quite natural since we do not consider in-plane deformations of the tissue. In reality, for the tissue is so stiff, that it turns beneficial to be squeezed in-plane rather than to buckle out. One may conjecture that is the analogue of the Young modulus, , that is known to regulate the rigidity of the tissue in the energetic approach, along with the thickness, , and the Poisson modulus, , in their certain combination, known as bending stiffness, .
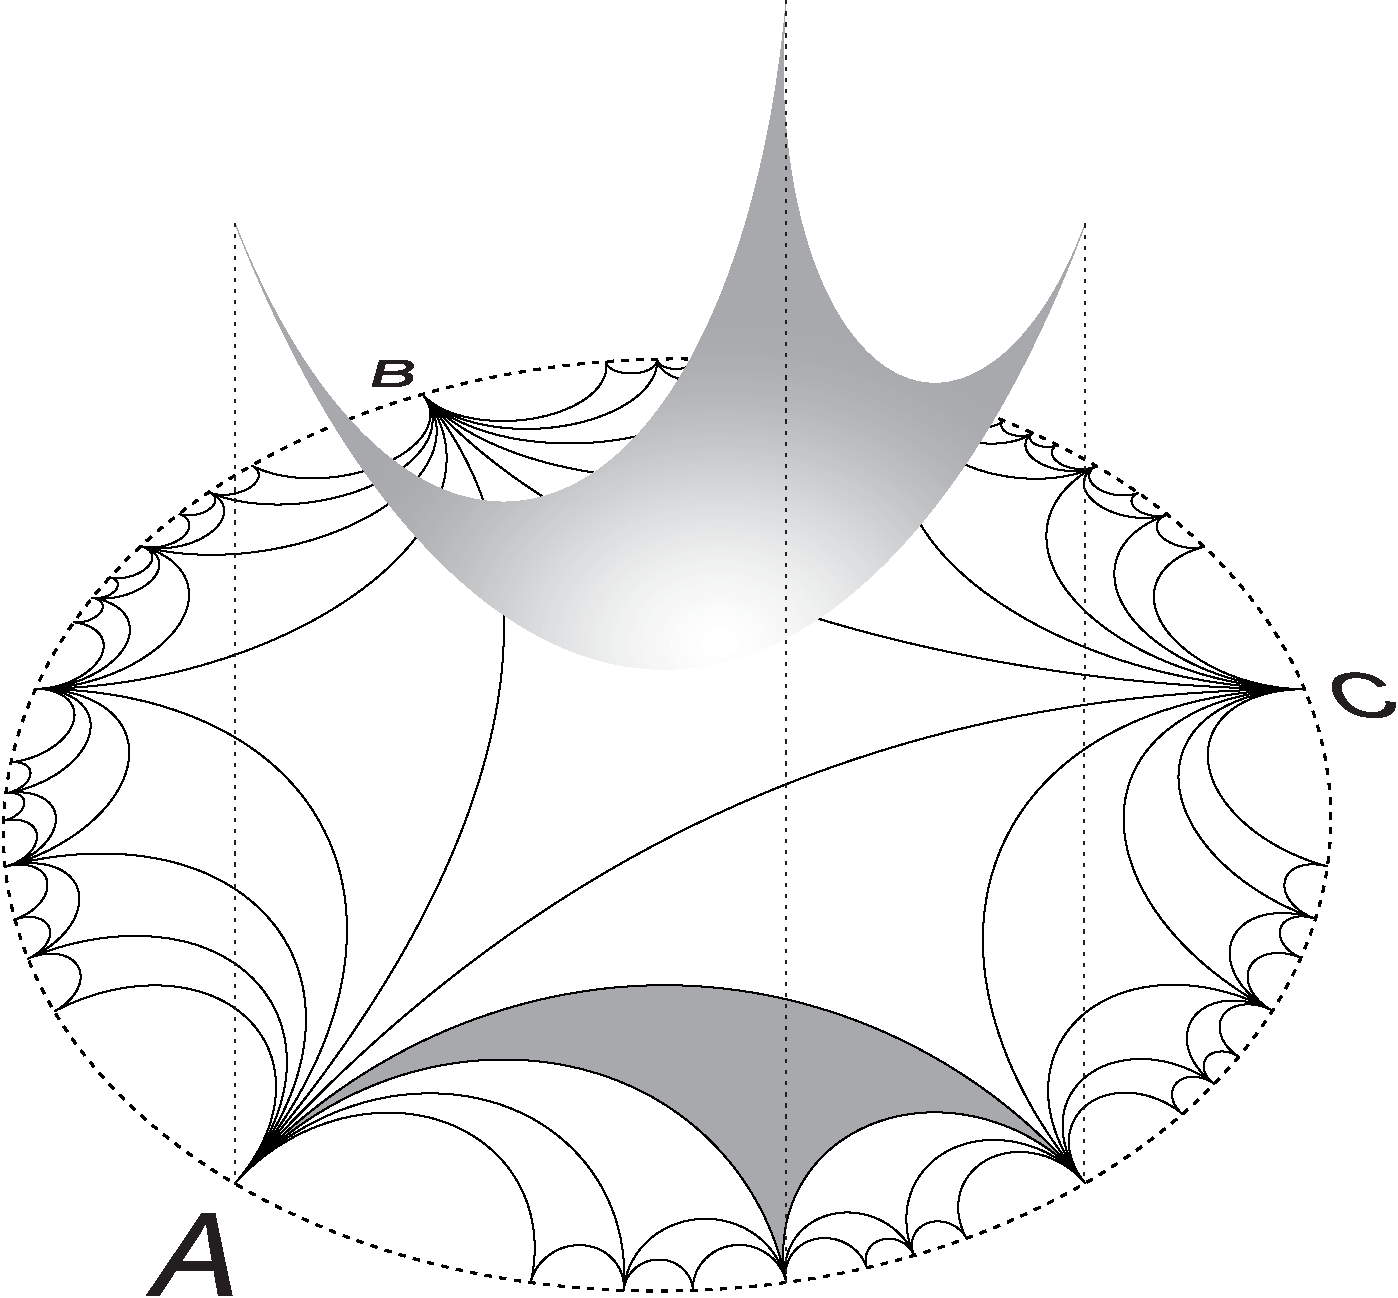
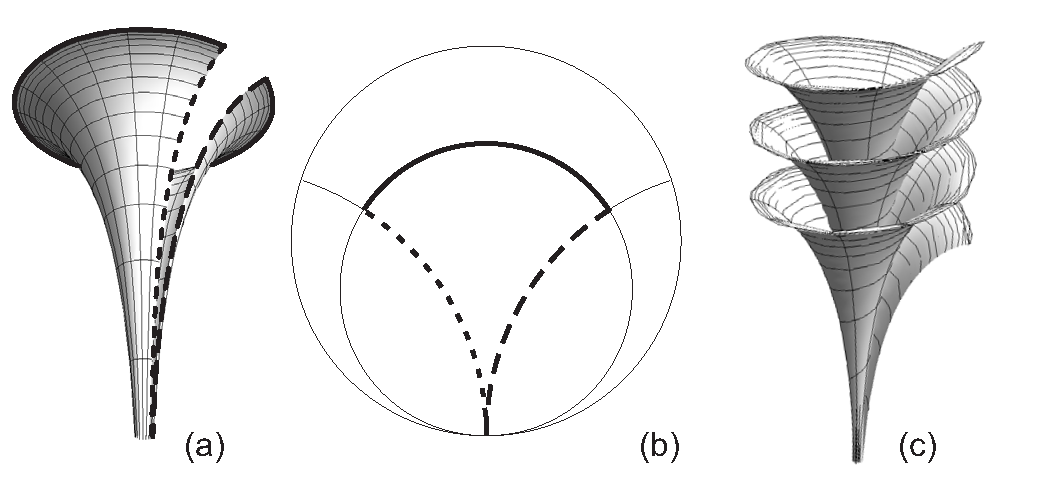
It is worth mentioning that at first stages of growth, until the instabilities at the circumference have not yet appeared, at certain angles (triangle-like cells) the surface bends similar to the Beltrami’s pseudosphere, that has a constant negative curvature at every point of the surface (compare Fig. 10 and Fig. 13). The similarity is even more striking for very low , when the triangulating parameter is fairly small. It is known that the pseudosphere locally realizes the Lobachevsky geometry and can be isometrically mapped onto the finite part of the half-plane or of the Poincaré disk, Fig. 13a-b. We have mentioned already that according to the Hilbert theorem, [42], no full isometric embedding of the Poincaré disk into the 3D space exists. Thus, in order to organize itself in the 3D space, the plant grows by the cascades of pseudospheres, resembling peaks and saddles, that is an alternative view on essence of buckling.
Interestingly, some flowers, such as calla lilies, initially grow psuedospherically, but then crack at some stage of growth and start twisting around in a helix. Apparently, this is another route of dynamic organization of non-Euclidean isometry in the Euclidean space. The Dini’s surface, Fig. 13c is known in differential geometry as a surface of constant negative curvature and, in comparison with the Beltrami’s pseudosphere, is infinite. The problem of sudden cracking of the lilies seems to be purely biological, but as soon as the crack appeared, the flower may relief the stresses caused by subsequent differential growth through twisting its petals in the Dini’s fashion.
Turn now to the eikonal interpretation of buckling. For the sake of simplicity, we will proceed here in the cartesian coordinates. Seeking the solution of (3) and (12) in the implicit form with , , , we can rewrite (12) as:
| (18) |
Eq.(18) reveals the relativistic nature of the eikonal equation [41] and describes the propagation of light in a (2+1)D space-time in the gravitational field with induced metrics defined by the metric tensor , where , speed of light put . Having , one can reconstruct geodesics that define the paths of the light propagation in our space-time. The parameterized geodesics family, , where , can be found from the equation:
| (19) |
where
| (20) |
are Christoffel symbols and is the covariant form of the metrics (). Calculating the symbols for the specific metrics (18), we end up with the set of equations for the geodesics in a parametric form:
| (21) |
From the first two lines of (21), one gets . Note, that the same relation follows directly from (2), if the planar domain is parameterized by the same coordinates . Thus, one may conclude, that the projections of the geodesics from the (2+1)D space-time onto the -plane coincide with light trajectories in the flat domain with refraction coefficient .
In this paper we discussed the optimal buckling profile formation of growing two-dimensional tissue evoked by the exponential cell division from the point-like source and from the linear segment. Such processes imply excess material generation enforcing the tissue to wrinkle as it approaches the domain boundary. Resulting optimal hyperbolic surface is described by the eikonal equation for the two-dimensional profile, and allows for simple geometric optics analogy. It is shown that the surface height above the domain mimics the eikonal (action) surface of a particle moving in the 2D media with certain refraction index, , which, in turn, is linked to microscopic rules of elementary cell division and symmetry of the plant. The projected geodesics of this ”minimal” optimal surface coincide with Fermat paths in the 2D media, which is the intrinsic feature of the eikonal equation. This result suggests an idea to treat the growth process itself as a propagation of the wavefronts in the media with certain metrics.
We have derived the metrics of the growing plant’s surface from microscopic rules of cells division and have shown that the solution of the eikonal equation describes buckling of tissues of different rigidities. Our results, being purely geometric, rhyme well with a number of energetic approaches to buckling of thin membranes, where the stiffness is controlled by the effective bending rigidity. We show that presence of a finite scale on which the tissue remains flat, results in negatively curved growing surfaces and the eikonal equation implies absence of real solution at late stages of the growth. Though, an analytical continuation can be constructed and erratic self-similar patterns along the circumference can be obtained. In reality high energetic costs for the profound cell division after bifurcation point would prohibit infinite growth and intense buckling.
Recall, that the right-hand side of the eikonal equation mimics the squared refraction index, (13), if buckling is interpreted as wavefront propagation in geometric optics. At length of our work it was pointed out, that for the differential growth problem, negative square of refraction index leads to complex solution for . Does complex solution have any physical meaning for growth? We can provide the following speculation. The complex solution appears for the late stages of growth when the finite bending scale of the tissue prohibits formation of very low-wavelength buckling modes. Since in this regime the tissue would experience in-plane deformations, one may improve the geometric model by letting branches to accumulate the ”potential energy”. Thereby, the analogy between optics and differential growth can be advanced by noting that the negative squared refraction index means absorbtion properties of the media. The propagating wavefront of a moving particle, dissipates the energy in areas where the refraction index is complex-valued. In the differential growth the proliferation of buckling modes may be limited by the energy losses at branches, that would suppress buckling.
The challenging question concerns the possibility to extend our approach to the growth of three-dimensional objects, for example, of a ball that size grows faster than . In this case, the redundant material can provoke the surface instabilities. We conjecture that some analogy between the boundary growth and optic wavefronts survives in this case as well.
3 Rare-event statistics and hyperbolic geometry
The spectral analysis of ensemble of random adjacency matrices at the percolation threshold is cumbersome since the spectra of the components depend on their topology. For random Erdős-Rényi graphs, however, almost all components are trees (see e.g. Ref. [46, 47]). Furthermore, at the percolation point (and certainly below it) the majority of subgraphs are linear chains. It has been shown in Ref. [48] that in the vicinity of the percolation point linear chains constitute the overwhelming majority of clusters—about 95%. This has led us to study the spectral density of ensemble of linear chains only. The advantage of this consideration is the possibility of exact treatment which allowed us to uncover the number-theoretic structure of the corresponding density of states. The spectrum of each linear chain is easy to compute, so to get the spectral density, , of an ensemble of chain-like subgraphs we should know the distribution, , of linear chains of length at the percolation point. In Ref. [48] an explicit expression for has been derived within a kinetic theory approach which allows one to determine the size distribution of generic clusters (irrespective of their topology) and then adopt this framework to the computation of the size distribution of linear chains. As concerns exact results, we have shown in Ref. [48] that the spectral density, , in the ensemble of linear chains with the exponential distribution of their lengths demonstrates a very peculiar ultrametric structure related to the so-called ”popcorn function” [49].
The ”popcorn” (or Thomae) function, , has also many other names: the raindrop function, the countable cloud function, the modified Dirichlet function, the ruler function, etc. It is one of the simplest number-theoretic functions possessing nontrivial fractal structure (another famous example is the everywhere continuous but never differentiable Weierstrass function). The popcorn function is defined on the open interval according to the following rule:
| (22) |
The popcorn function is discontinuous at every rational point because irrationals come infinitely close to any rational number, while vanishes at all irrationals. At the same time, is continuous at irrationals.
One of the most beautiful incarnations of the popcorn function arises in a so-called ”Euclid orchard” representation. Consider an orchard of trees of unit hights located at every point of the two-dimensional square lattice, where and are nonnegative integers defining the lattice, and is the lattice spacing, . Suppose we stay on the line between the points and , and observe the orchard grown in the first quadrant along the rays emitted from the origin – see the Fig. 14.
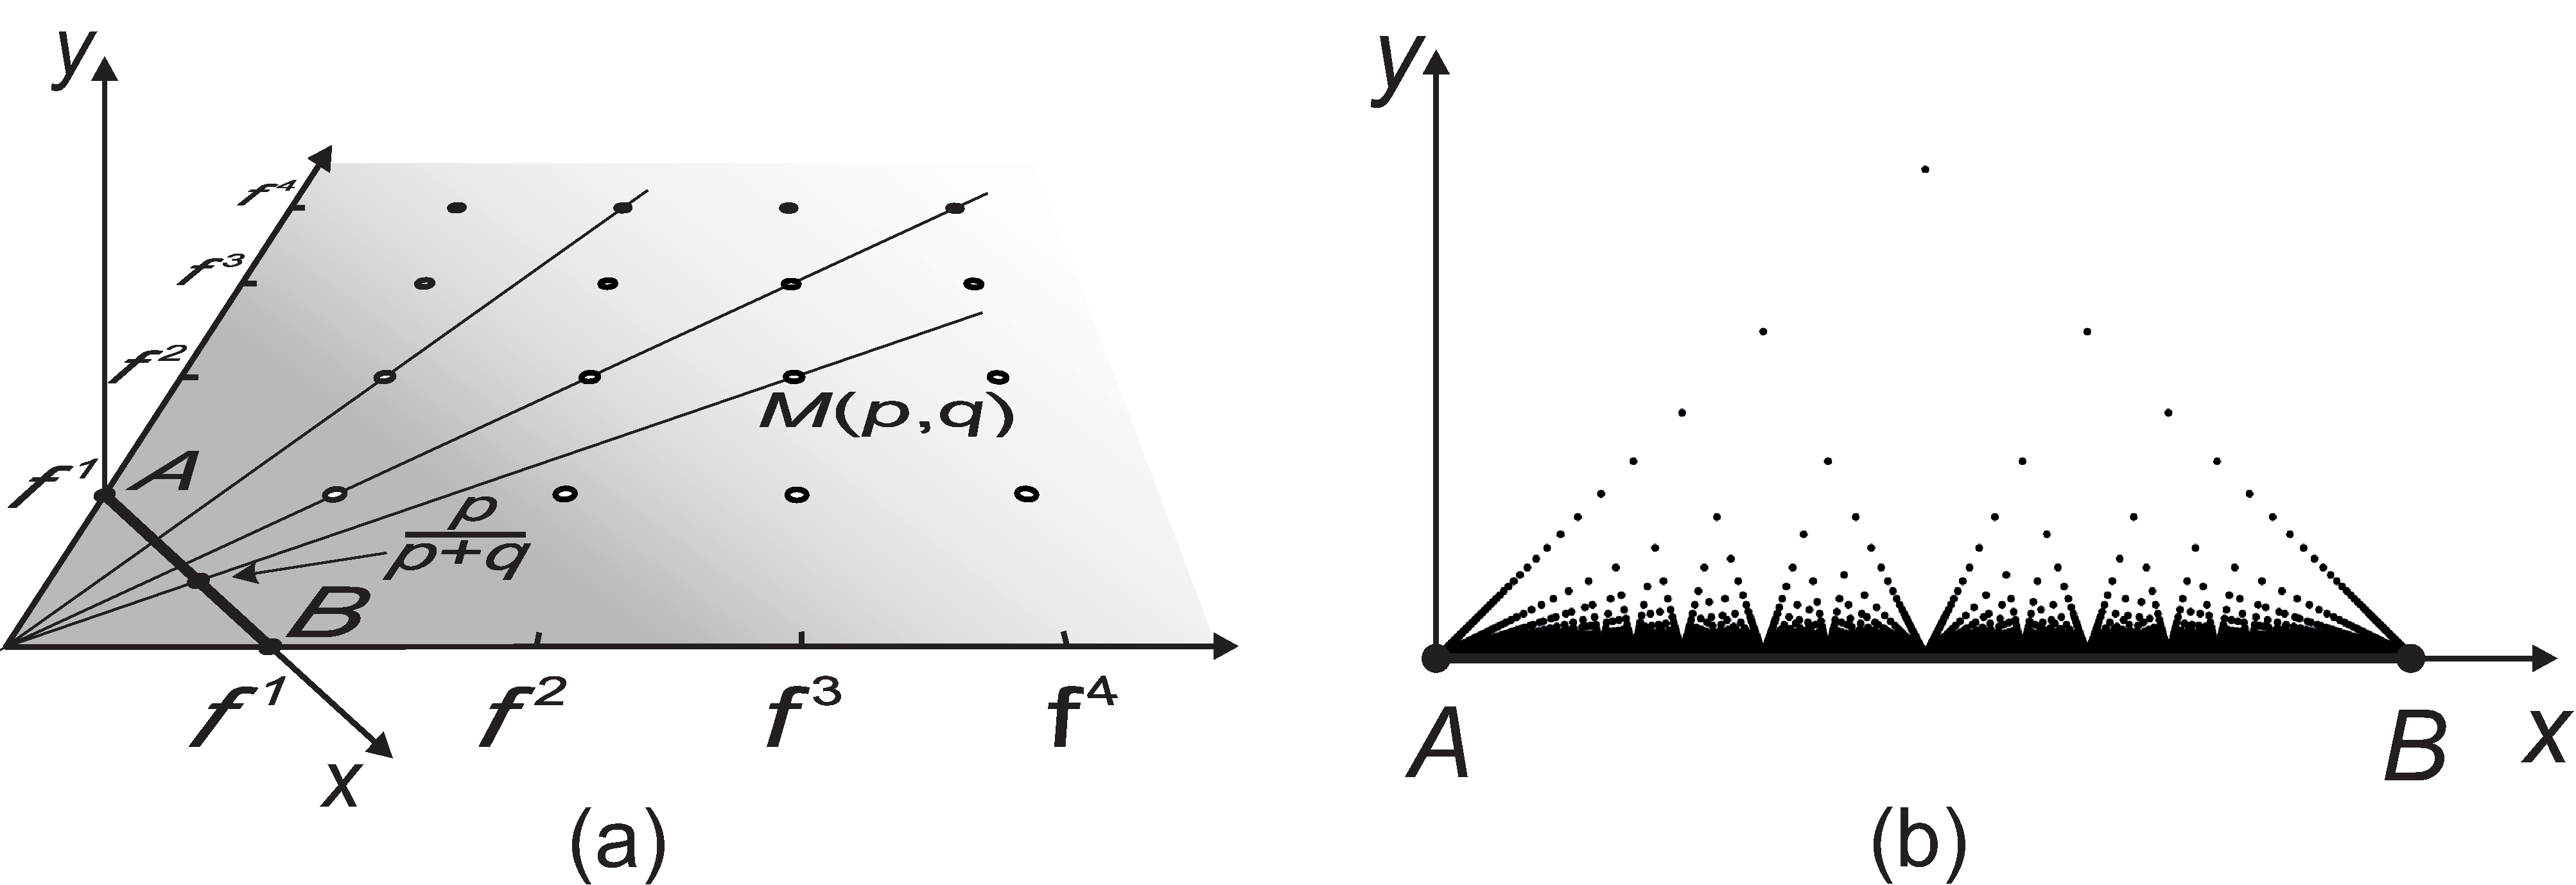
Along these rays we see only the first open tree with coprime coordinates, , while all other trees are shadowed. Introduce the auxiliary coordinate basis with the axis along the segment and normal to the orchard’s plane (as shown in the Fig. 14a). We set the origin of the axis at the point , then the point has the coordinate . It is a nice school geometric problem to establish that: (i) having the focus located at the origin, the tree at the point is spotted at the place , (ii) the visible height of this tree is . In other words, the ”visibility diagram” of such a lattice orchard is exactly the popcorn function.
The popcorn correspondence arises in the Euclid orchard problem as a purely geometrical result. However, the same function has appeared as a probability distribution in a plethora of biophysical and fundamental problems, such as the distribution of quotients of reads in DNA sequencing experiment [50], quantum noise and Frenel-Landau shift [51], interactions of non-relativistic ideal anyons with rational statistics parameter in the magnetic gauge approach [52], or frequency of specific subgraphs counting in the protein-protein network of a Drosophilla [53]. Though the extent of similarity with the original popcorn function could vary, and experimental profiles may drastically depend on peculiarities of each particular physical system, a general probabilistic scheme resulting in the popcorn-type manifestation of number-theoretic behavior in nature, definitely survives.
Suppose two random integers, and , are taken independently from a discrete probability distribution, , where is a ”damping factor”. If , then the combination has the popcorn-like distribution in the asymptotic limit :
| (23) |
The formal scheme above can be understood on the basis of the Euclid orchard construction, if one would consider a walker on the lattice (see Fig. 14a), who performs steps along one axis of the lattice, following by steps along another axis. At every step the walker dies with probability . Then, having a number of the walkers starting from the origin of the lattice, one would get an ”orchard of walkers”, i.e. at every spot on the axis a fraction of survived walkers would be described exactly by the popcorn function.
In order to have a relevant physical picture, consider a toy model of diblock-copolymer polymerization. Without sticking to any specific polymerization mechanism, consider an ensemble of diblock-copolymers , polymerized independently from both ends in a cloud of monomers of relevant kind (we assume, only and links to be formed). Termination of polymerization is provided by specific ”radicals” of very small concentration, : when a radical is attached to the end (irrespectively, or ), it terminates the polymerization at this extremity forever. Given the environment of infinite capacity, one assigns the probability to a monomer attachment at every elementary act of the polymerization. If and are molecular weights of the blocks and , then the composition probability distribution in our ensemble, , in the limit of small is ”ultrametric” (see Ref. [54] for the definition of the ultrametricity) and is given by the popcorn function:
| (24) |
In the described process we have assumed identical independent probabilities for the monomers of sorts (”colors”) and to be attached at both chain ends. Since no preference is implied, one may look at this process as at a homopolymer (”colorless”) growth, taking place at two extremities. For this process we are interested in statistical characteristics of the resulting ensemble of the homopolymer chains. What would play the role of ”composition” in this case, or in other words, how should one understand the fraction of monomers attached at one end? As we show below, the answer is rather intriguing: the respective analogue of the probability distribution is the spectral density of the ensemble of linear chains with the probability for the molecular mass distribution, where is the length of a chain in the ensemble.
To our point of view, the popcorn function has not yet received decent attention among researchers, though its emergence in various physical problems seems impressive, as we demonstrate below. Apparently, the main difficulty deals with the discontinuity of at every rational point, which often results in a problematic theoretical treatment and interpretation of results for the underlying physical system. Thus, a natural, physically justified ”continuous approximation” to the popcorn function is very demanded.
Below we provide such an approximation, showing the generality of the ”popcorn-like” distributions for a class of one-dimensional disordered systems. We demonstrate that the popcorn function can be constructed on the basis of the modular Dedekind function, , when the imaginary part, , of the modular parameter tends to 0.
1 Spectral density and the popcorn function
The former exercises are deeply related to the spectral statistics of ensembles of linear polymers. In a practical setting, consider an ensemble of noninteracting linear chains with exponential distribution in their lengths. We claim the emergence of the fractal popcorn-like structure in the spectral density of corresponding adjacency matrices describing the connectivity of elementary units (monomers) in linear chains.
The ensemble of exponentially weighted homogeneous chains, is described by the bi-diagonal symmetric adjacent matrix :
| (25) |
where the distribution of each () is Bernoullian:
| (26) |
We are interested in the spectral density, , of the ensemble of matrices in the limit . Note that at any , the matrix splits into independent blocks. Every block is a symmetric bi-diagonal matrix with all , , which corresponds to a chain of length . The spectrum of the matrix is
| (27) |
All the eigenvalues for appear with the probability in the spectrum of the matrix (25). In the asymptotic limit , one may deduce an equivalence between the composition distribution in the polymerization problem, discussed in the previous section, and the spectral density of the linear chain ensemble. Namely, the probability of a composition in the ensemble of the diblock-copolymers can be precisely mapped onto the peak intensity (the degeneracy) of the eigenvalue in the spectrum of the matrix . In other words, the integer number in the mode matches the number of -monomers, , while the number of -monomers matches , where , in the respective diblock-copolymer.
To derive for arbitrary values of , let us write down the spectral density of the ensemble of random matrices with the bimodal distribution of the elements as a resolvent:
| (28) |
where means averaging over the distribution , and the following regularization of the Kronecker -function is used:
| (29) |
The function is associated with each particular gapless matrix of sequential ”1” on the sub-diagonals,
| (30) |
Collecting (27), (28) and (30), we find an explicit expression for the density of eigenvalues:
| (31) |
The behavior of the inner sum in the spectral density in the asymptotic limit is easy to understand: it is at and zero otherwise. Thus, one can already infer a qualitative similarity with the popcorn function. It turns out, that the correspondence is quantitative for . Driven by the purpose to show it, we calculate the values of at the peaks, i.e. at rational points with and end up with the similar geometrical progression, as for the case of diblock-copolymers problem (23):
| (32) |
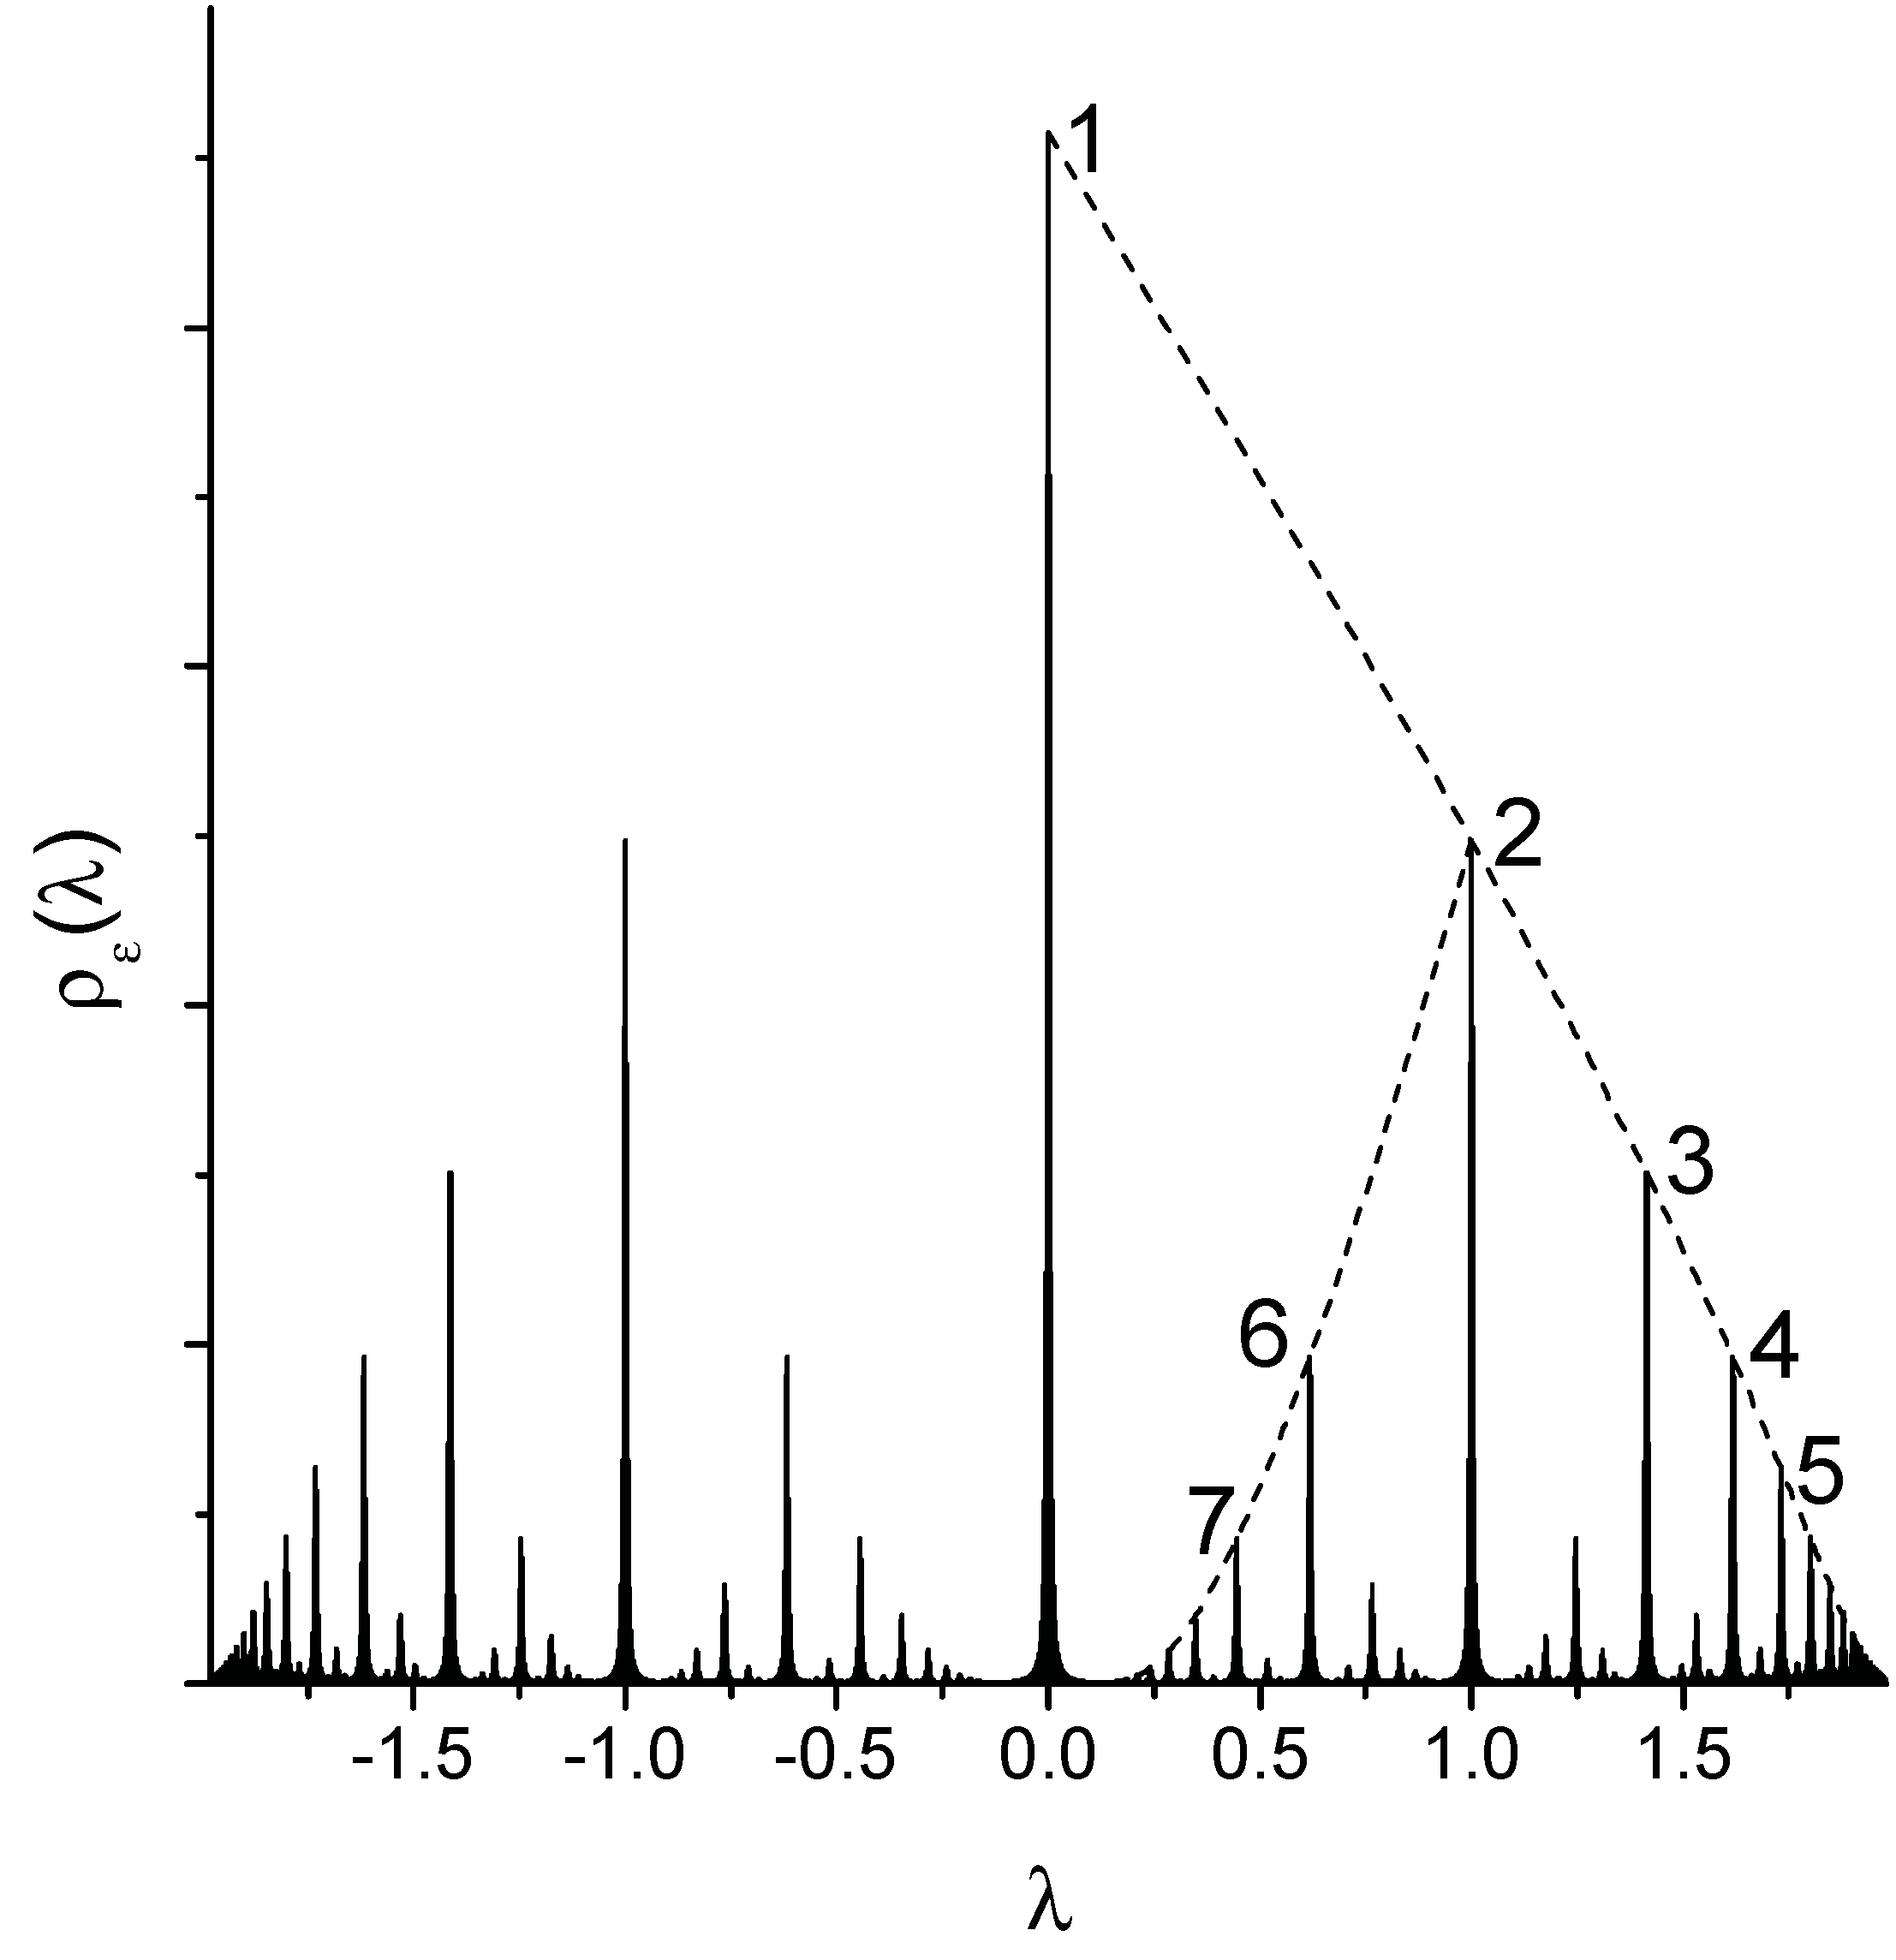
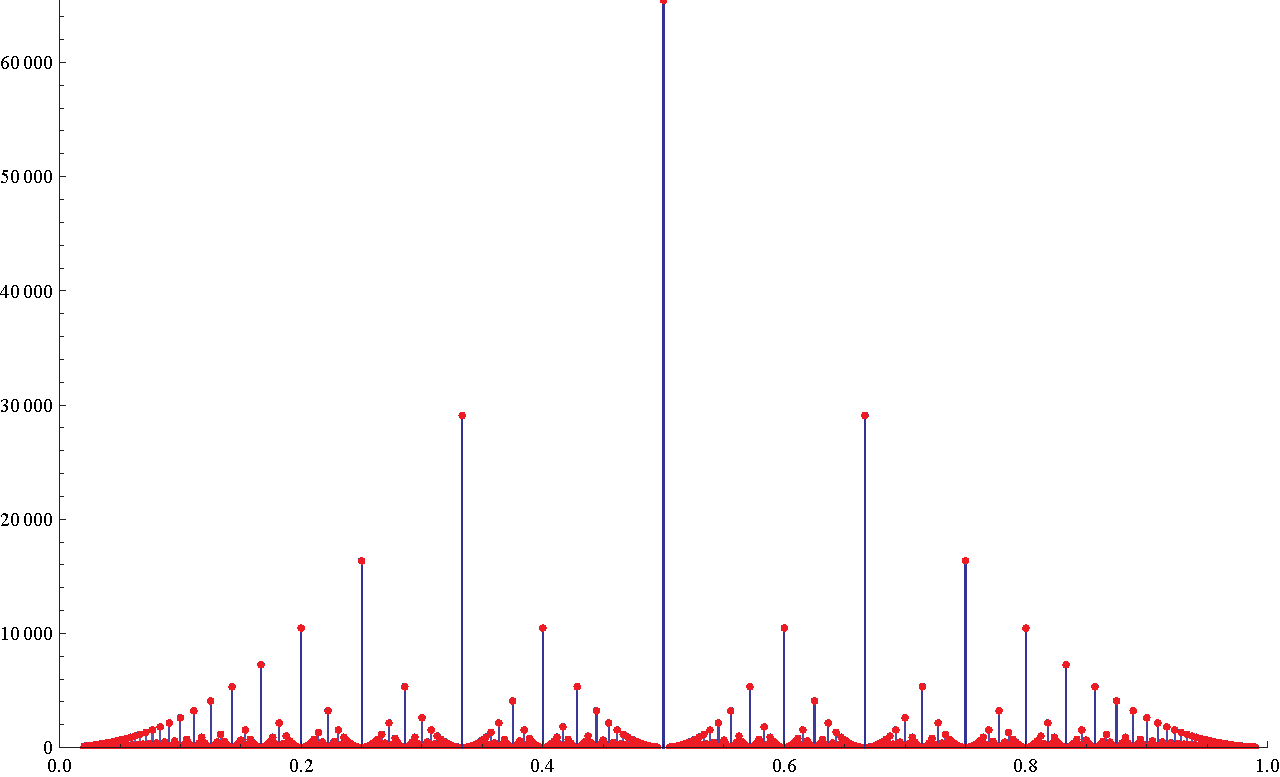
The typical sample plot for computed numerically via (31) with is shown in the Fig. 15 for .
2 Enveloping curves and tails of the eigenvalues density
Below we pay attention to some number-theoretic properties of the spectral density of the argument , since in this case the correspondence with the composition ratio is precise. One can compute the enveloping curves for any monotonic sequence of peaks depicted in Fig. 15, where we show two series of sequential peaks: 1–2–3–4–5–… and 2–6–7– …. Any monotonic sequence of peaks corresponds to the set of eigenvalues constructed on the basis of a Farey sequence [55]. For example, as shown below, the peaks in the series are located at:
while the peaks in the series are located at:
Positions of peaks obey the following rule: let be three consecutive monotonically ordered peaks (e.g., peaks 2–3–4 in Fig. 15), and let
where and () are coprimes. The position of the intermediate peak, , is defined as
| (33) |
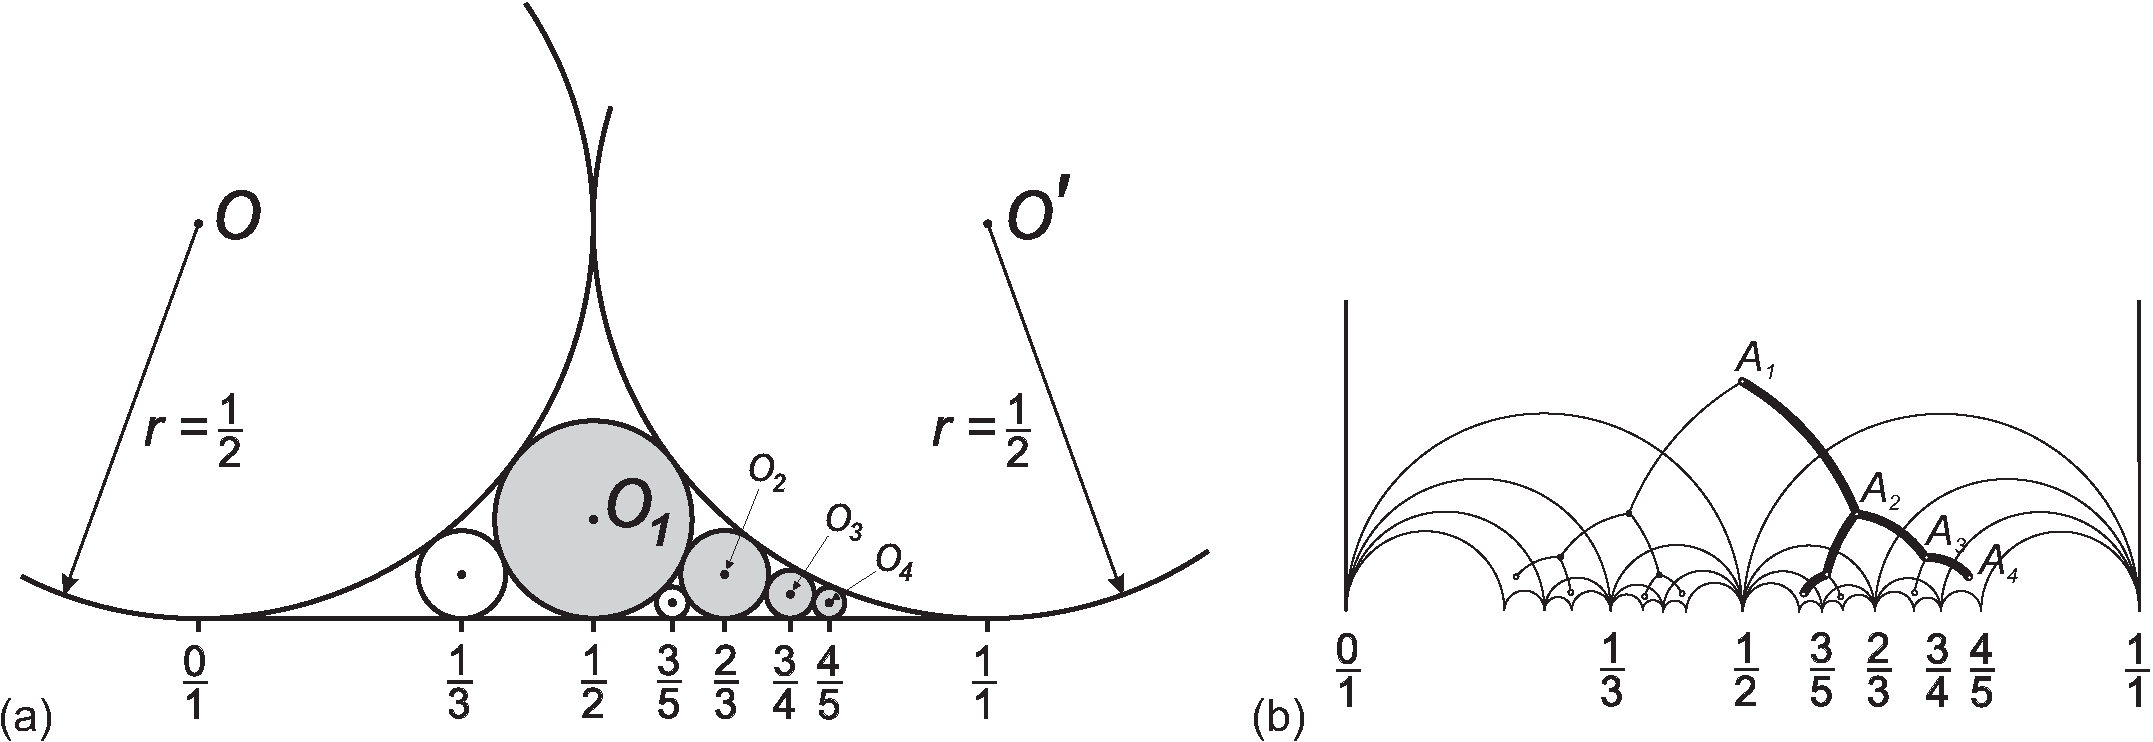
The sequences of coprime fractions constructed via the addition are known as Farey sequences. A simple geometric model behind the Farey sequence, known as Ford circles [56, 57], is depicted in Fig. 16a. In brief, the construction goes as follows. Take the segment and draw two circles and both of radius , which touch each other, and the segment at the points 0 and 1. Now inscribe a new circle touching , and . Where is the position of the new circle along the segment? The generic recursive algorithm constitutes the Farey sequence construction. Note that the same Farey sequence can be sequentially generated by fractional-linear transformations (reflections with respect to the arcs) of the fundamental domain of the modular group – the triangle lying in the upper halfplane of the complex plane (see Fig. 16b).
Consider the main peaks series, 1–2–3–4–5–…. The explicit expression for their positions reads as:
| (34) |
One can straightforwardly investigate the asymptotic behavior of the popcorn function in the limit . From (32) one has for arbitrary the set of parametric equations:
| (35) |
From the second equation of (35), we get . Substituting this expression into the first one of (35), we end up with the following asymptotic behavior of the spectral density near the spectral edge :
| (36) |
The behavior (35) is the signature of the Lifshitz tail typical for the 1D Anderson localization:
| (37) |
where and .
3 From popkorn to Dedekind -function
The popcorn function has discontinuous maxima at rational points and continuous valleys at irrationals. We show in this section, that the popcorn function can be regularized on the basis of the everywhere continuous Dedekind function in the asymptotic limit .
The famous Dedekind -function is defined as follows (this function has appeared already in (14)):
| (38) |
The argument is called the modular parameter and is defined for only. The Dedekind -function is invariant with respect to the action of the modular group :
| (39) |
And, in general,
| (40) |
where and is some root of 24th degree of unity [58].
It is convenient to introduce the following ”normalized” function
| (41) |
The real analytic Eisenstein series is defined in the upper half-plane, for as follows:
| (42) |
This function can be analytically continued to all -plane with one simple pole at . Notably it shares the same invariance properties on as the Dedekind -function. Moreover, , as function of , is the –automorphic solution of the hyperbolic Laplace equation:
The Eisenstein series is closely related to the Epstein -function, , namely:
| (43) |
where is a positive definite quadratic form, , and . Eventually, the logarithm of the Dedekind -function is known to enter in the Laurent expansion of the Epstein -function. Its residue at has been calculated by Dirichlet and is known as the first Kronecker limit formula [59, 60, 61]. Explicitly, it reads at :
| (44) |
Equation (44) establishes the important connection between the Dedekind -function and the respective series, that we substantially exploit below.
Consider an arbitrary quadratic form with unit determinant. Since , it can be written in new parameters as follows:
| (45) |
Applying the first Kronecker limit formula to the Epstein function with (45) and , where , but finite one gets:
| (46) |
On the other hand, one can make use of the -continuation of the Kronecker -function, (29), and assess for small as follows:
| (47) |
where and the factor 2 reflects the presence of two quadrants on the -lattice that contribute jointly to the sum at every rational points, while assigns 0 to all irrationals. At rational points can be calculated straightforwardly:
| (48) |
Comparing (48) with the definition of the popcorn function, , one ends up with the following relation at the peaks:
| (49) |
Eventually, collecting (46) and (49), we may write down the regularization of the popcorn function by the Dedekind in the interval :
| (50) |
or
| (51) |
Note, that the asymptotic behavior of the Dedekind -function can be independently derived through the duality relation, [11, 48]. However, such approach leaves in the dark the underlying structural equivalence of the popcorn and functions and their series representation on the lattice . In the Fig. 17 we show two discrete plots of the left and the right-hand sides of (51).
Thus, the spectral density of ensemble of linear chains, (32), in the regime is expressed through the Dedekind -function as follows:
| (52) |
4 Ultrametricity in physical systems
1 Modular geometry and phyllotaxis
We have discussed the number-theoretic properties of distributions appearing in physical systems when an observable is a quotient of two independent exponentially weighted integers. The spectral density of ensemble of linear polymer chains distributed with the law (), where is the chain length, serves as a particular example. At , the spectral density can be expressed through the discontinuous and non-differentiable at all rational points, Thomae (”popcorn”) function. We suggest a continuous approximation of the popcorn function, based on the Dedekind -function near the real axis.
Analysis of the spectrum at the edges reveals the Lifshitz tails, typical for the 1D Anderson localization. The non-trivial feature, related to the asymptotic behavior of the shape of the spectral density of the adjacency matrix, is as follows. The main, enveloping, sequence of peaks in the Fig. 15 has the asymptotic behavior (at ) typical for the 1D Anderson localization, however any internal subsequence of peaks, like , has the behavior (at ) which is reminiscent of the Anderson localization in 2D.
We would like to emphasize that the ultrametric structure of the spectral density is ultimately related to number-theoretic properties of modular functions. We also pay attention to the connection of the Dedekind -function near the real axis to the invariant measures of some continued fractions studied by Borwein and Borwein in 1993 in Ref. [62]. The notion of ultrametricity deals with the concept of hierarchical organization of energy landscapes [63, 54]. A complex system is assumed to have a large number of metastable states corresponding to local minima in the potential energy landscape. With respect to the transition rates, the minima are suggested to be clustered in hierarchically nested basins, i.e. larger basins consist of smaller basins, each of these consists of even smaller ones, etc. The basins of local energy minima are separated by a hierarchically arranged set of barriers: large basins are separated by high barriers, and smaller basins within each larger one are separated by lower barriers. Ultrametric geometry fixes taxonomic (i.e. hierarchical) tree-like relationships between elements and, speaking figuratively, is closer to Lobachevsky geometry, rather to the Euclidean one.
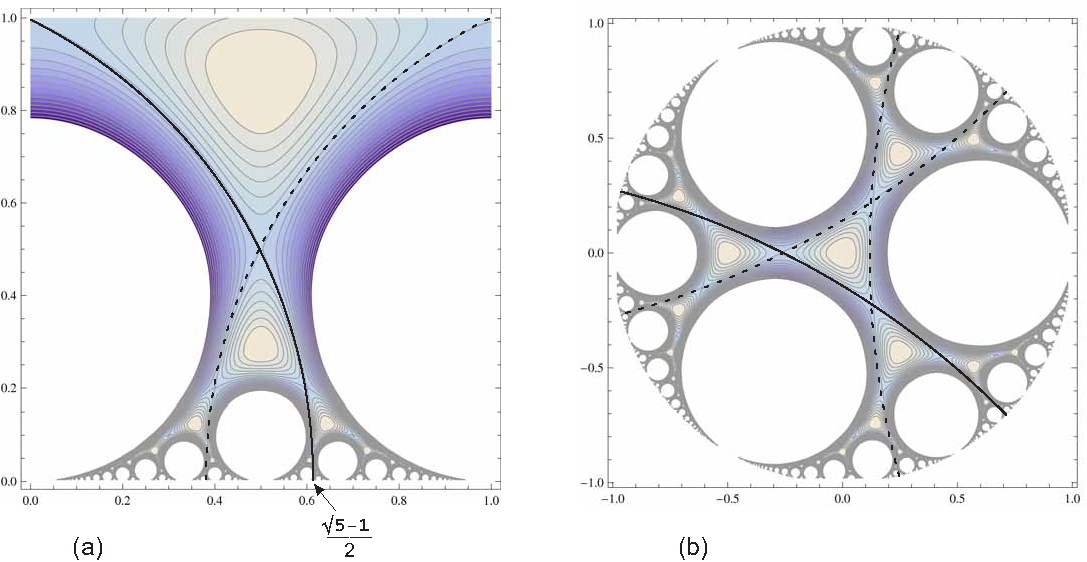
Let us remind that in the Section 2 we argued that buckling of a leaf of some plants (like lettuce or spinach) is related with isometric embedding of hyperbolic graphs (Cayley trees) into the 3D Euclidean space. The buckling is described by a function, , the Jacobian of the conformal transformation. For a regular 3-branching Cayley tree, the function can be expressed via the Dedekind -function [10, 11]. It has been noted in Ref. [11] that properly normalized function , namely, , defined in Eq.(41), can be regarded as a continuous tree isometrically embedded into the half-plane . The cut of the function is shown in Fig. 18a, while in Fig. 18b the same function is replotted in polar coordinates, obtained via the conformal mapping of the upper half-plane to the unit disc. Note the striking similarity of Fig. 18a with the set of touching Ford circles (Fig. 17). In fact, the -coordinates of centers of all lacunas in Fig. 18a obey the Farey construction.
Another well-known manifestation of number theory in natural science arises in the context of phyllotaxis [64]. The connection of the cell packing with the Farey sequences has been observed long time ago. It was not clear, however, why nature selects the Fibonacci sequence among other possible Farey sequences. A tantalizing answer to this question has been given by L. Levitov, see Ref. [36]. He proposed an “energetic” approach to the phyllotaxis, suggesting that the development of a plant is connected with an effective motion along the geodesics on the surface associated with the energetic relief of growing plant.
Intriguingly, the energetic relief considered in Ref. [36] coincides with the relief of the function depicted in Fig. 18 (to the best of our knowledge, the Dedekind function has newer been discussed in this context). The black arcs drawn in Fig. 18a,b are parts of semicircles orthogonal to the boundaries and represent the geodesics of the surface , which are open level lines (by the symmetry, there are only two such level lines in Fig. 18a and three in Fig. 18b). The relief of the function shown in the Fig. 18a emerged previously in course of investigation of metric properties of ultrametric spaces [11]. The best rational approximation of the boundary point, , at which the solid geodesics in Fig. 18a terminates, is given by the continued fraction expansion
| (53) |
cut at some level . Cutting (53) at sequential , we get the set of fractions constituting the interlacing Fibonacci sequences, , in nominators and denominators:
Thus, the normalized -function, , plays a role of the energy relief of a growing plant.
The Fibonacci numbers are the benchmarks, which fix the connection between ultrametric and hyperbolic geometry, since, on one hand they appear as discrete symmetries of the hyperbolic space, and on the other hand, being a subset of -adic numbers, they uniquely parameterize the distances in the ultrametric space [48].
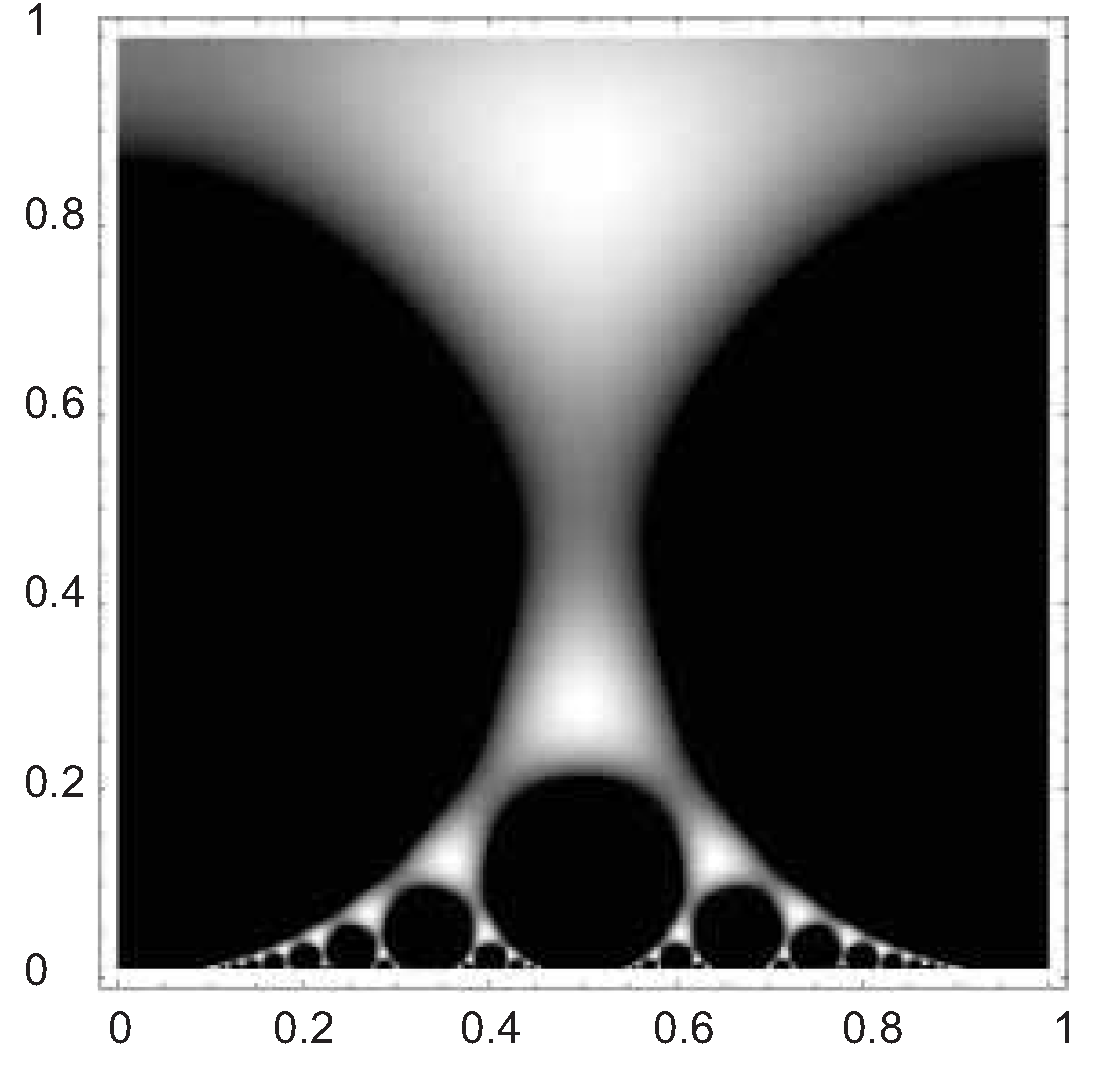
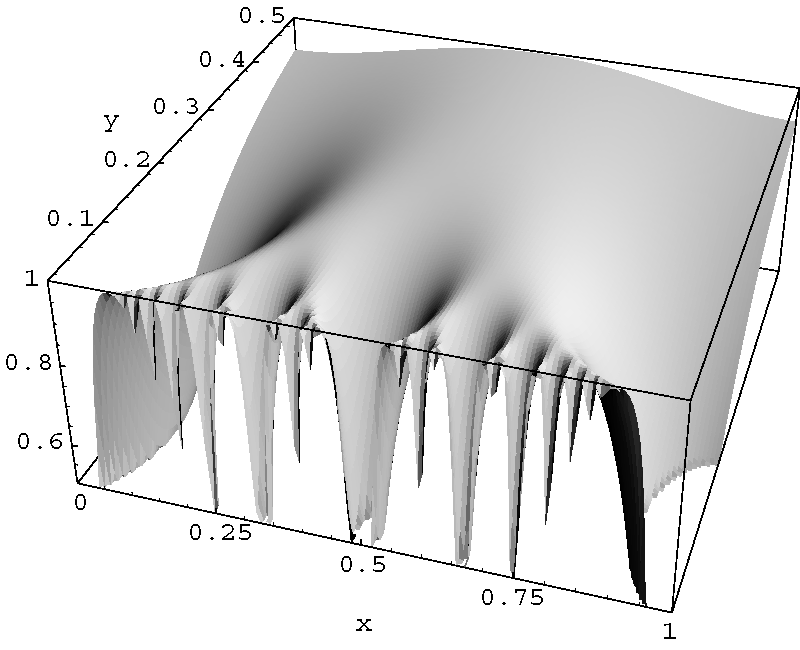
In Ref. [11] we have constructed the ”continuous” analog of the standard 3-branching Cayley tree by means of modular functions and have analyzed the structure of the barriers separating the neighboring valleys. In particular, we have shown that these barriers are ultrametrically organized. The main ingredient of our construction is the function defined in (41). The normalization constant is chosen to fix the maximal value of equal to 1: for any in the upper half-plane . The function has the following property: all the solutions of the equation define all the coordinates of the 3-branching Cayley tree isometrically embedded into the upper half-plane with hyperbolic metric. The density plot of the function in the region and its 3D relief are shown in the Fig. 19a,b. The Fig. 19b clearly displays the ”continuous” tree-like structure of hills separated by the valleys. Consider now the function
| (54) |
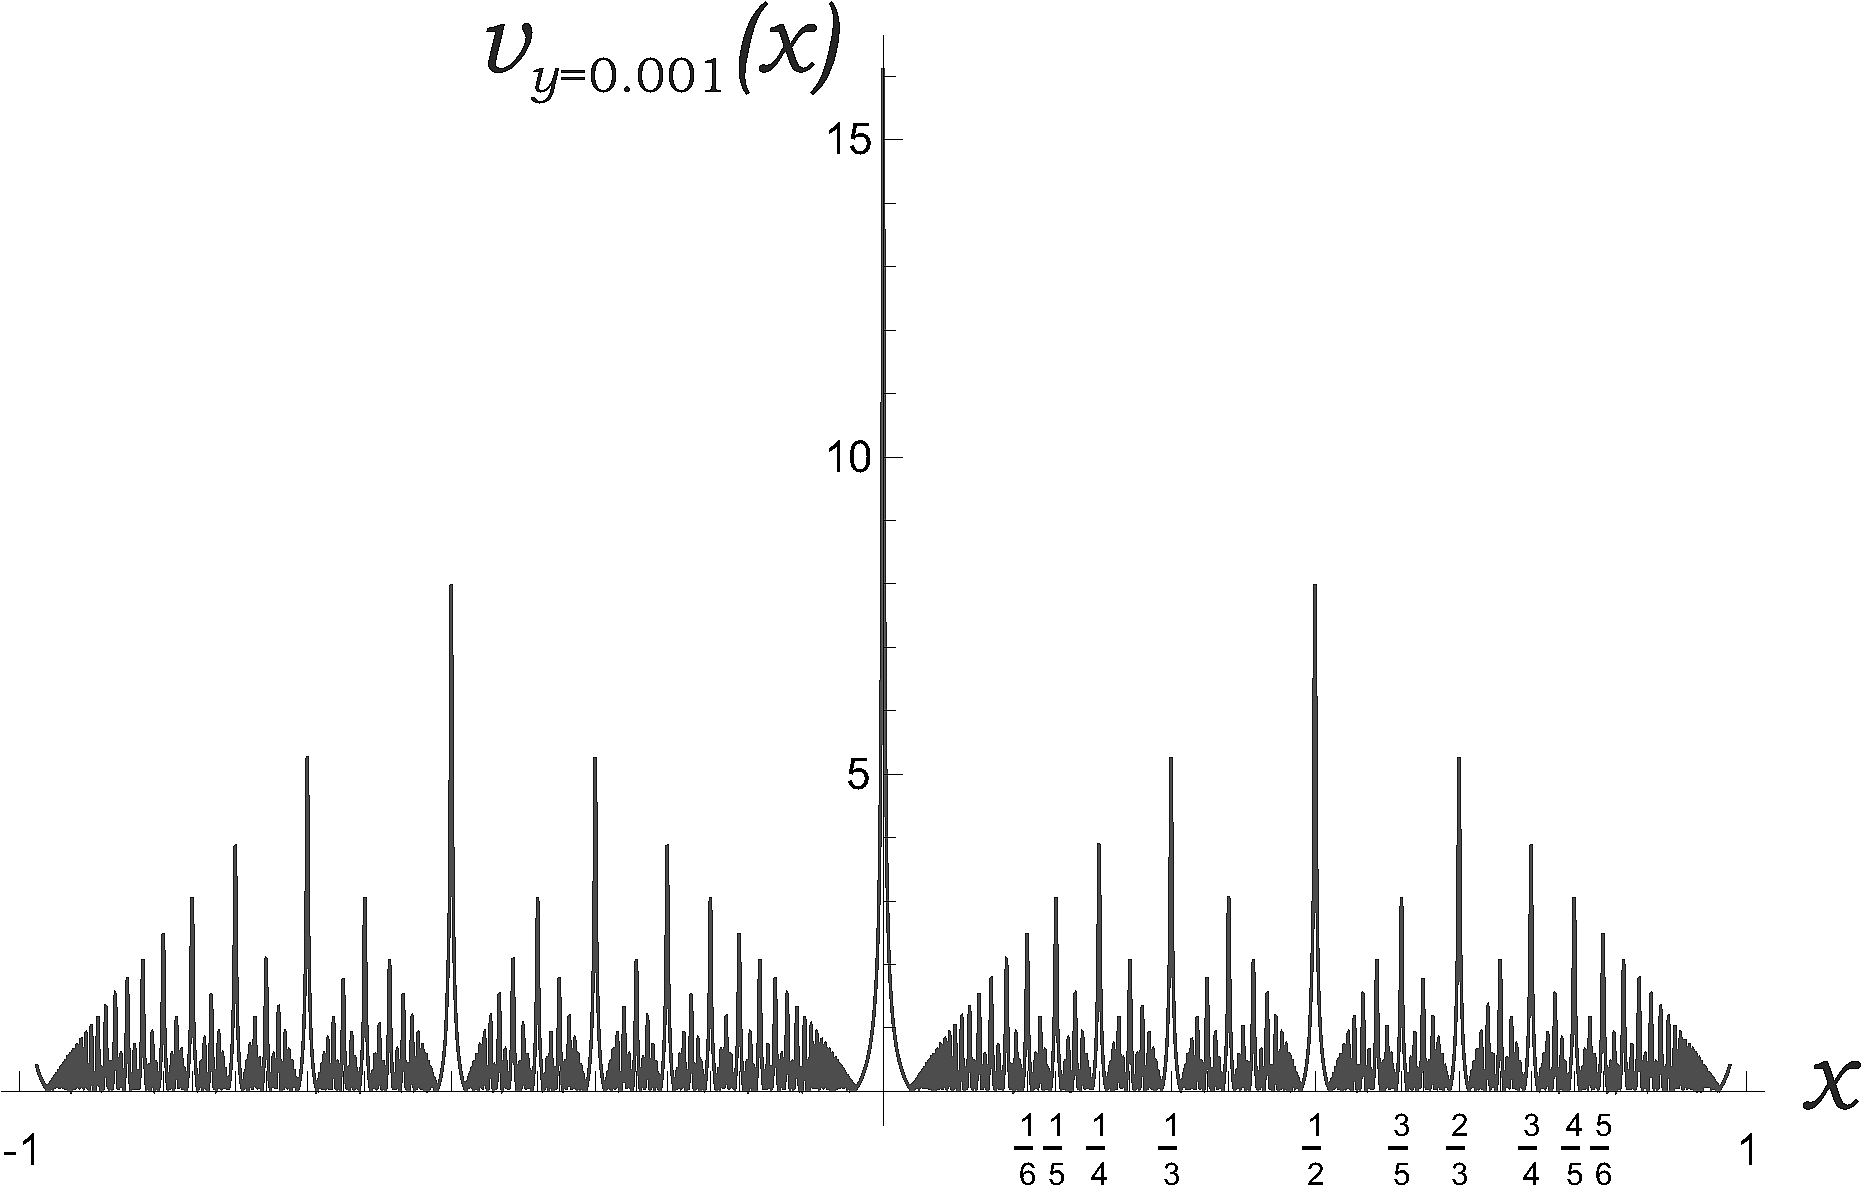
The typical shape of is shown in the figure Fig. 19c for . The function at any fixed obeys the strong triangle inequality condition and hence possesses the ultrametric organization of barriers separating the valleys. At the function exhibits the ”linearity” in sequentially increasing and decreasing barriers similar to the well-known Thomae (”popcorn”) function [65].
Using the function we can construct the modular analog of the ”Parisi matrix”, (the typical object in the spin glass theory [63]), which for first 3 hierarchical levels can be written in the form shown in figure Fig. 20(left). Corresponding tree-like structure with hierarchical (ultrametric) organization of barriers, separating transitions form different states represented by black dots, is depicted in the Fig. 20(right).
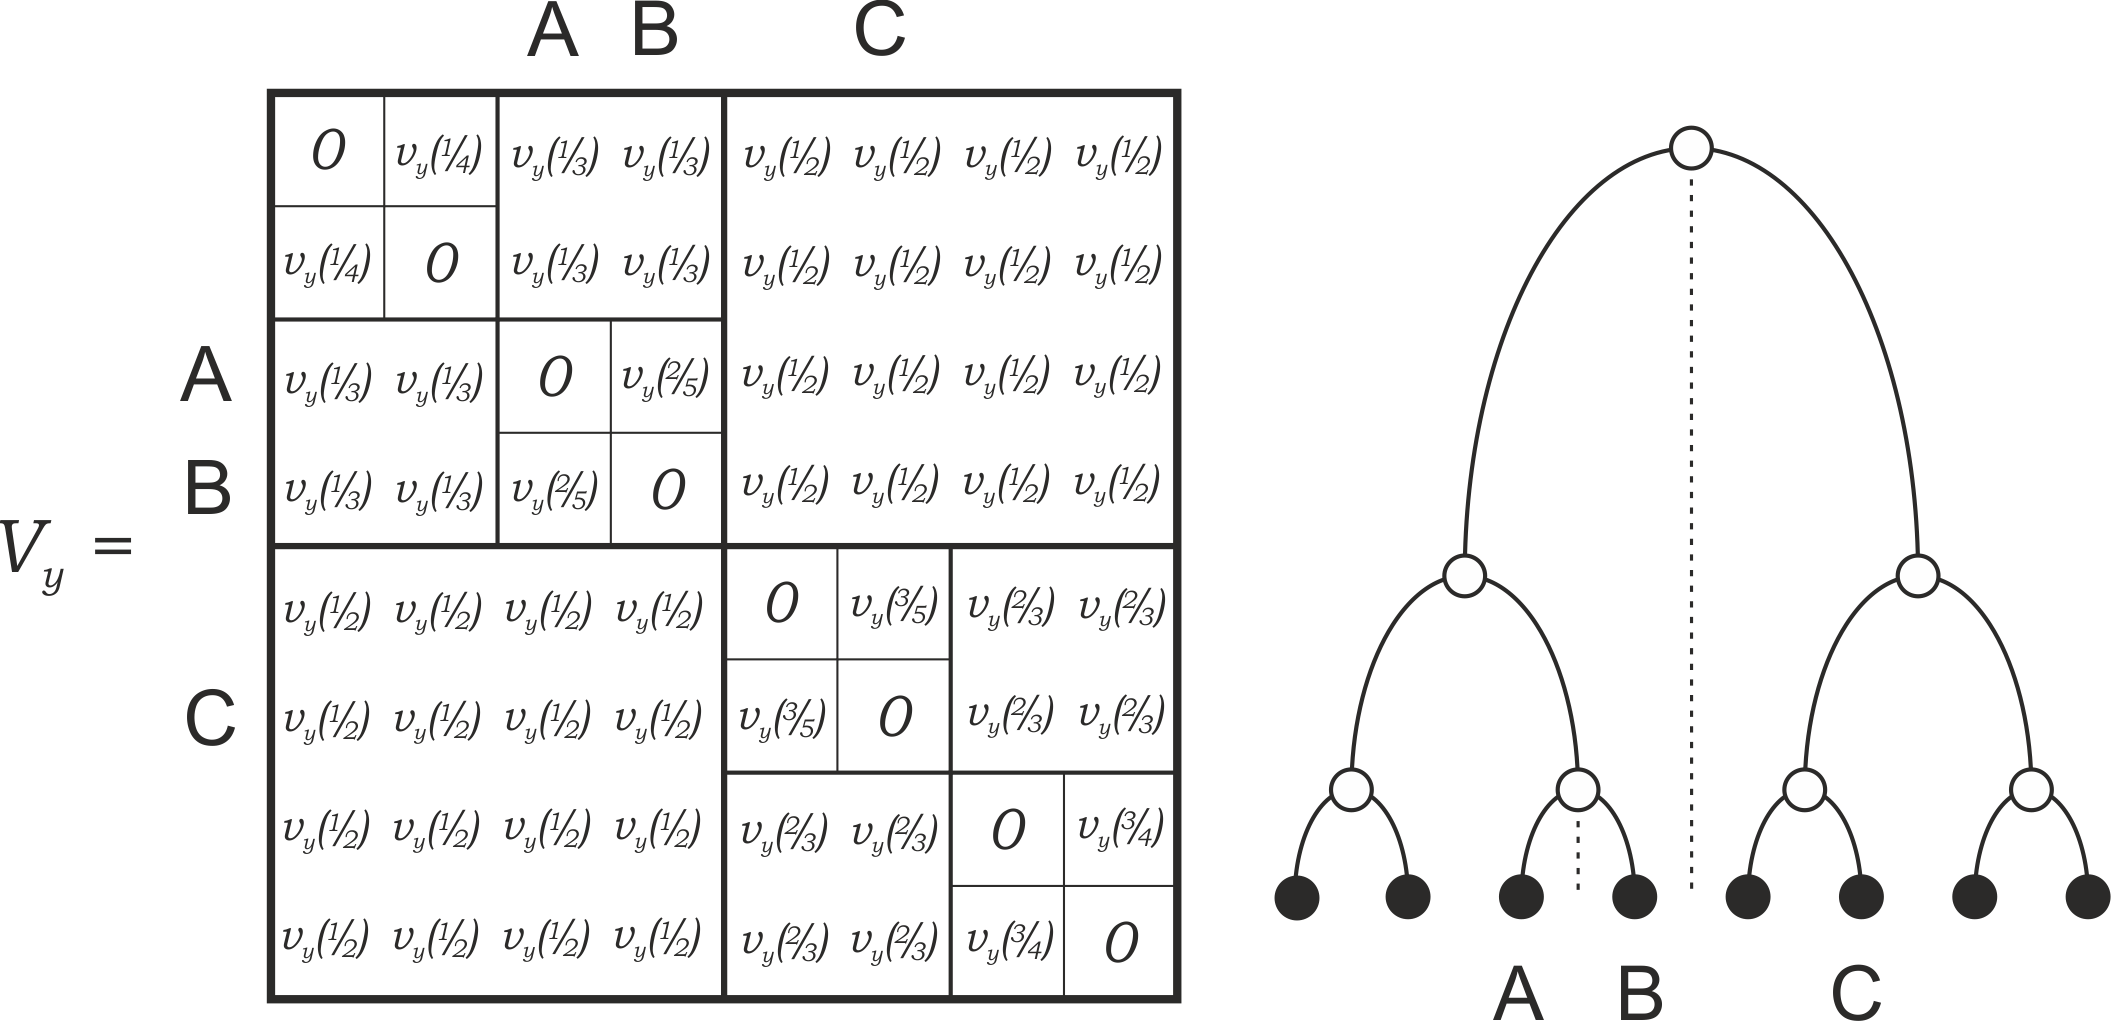
The function , defined on the interval , has the properties borrowed from the structure of the underlying modular group acting in the half–plane [66, 67]. In particular: (i) the local maxima of are located at the rational points; (ii) the highest barrier on a given interval is located at a rational point with the lowest denominator . On a given interval there is only one such point. Locations of barriers with consecutive heights on the interval are organized according to the group operation , constituting the Farey sequence discussed in the main text of the paper. For example, the height of the barrier separating points and is , while the height of barriers separating points and , or and is .
The array shown in the Fig. 20 can be considered as a ”continous” analog of the Parisi matrix and could play a role in problems where the ultrametricity should be consistent with metric structure of the target space.
2 Spectral statistics of ensembles of trees and star-like graphs
One can gain the information about topological and statistical properties of polymers in solutions by measuring their relaxation spectra [69]. A rough model of an individual polymer molecule of any topology is a set of monomers (atoms) connected by elastic strings. If deformations of strings are small, the response of the molecule on external excitation is harmonic according to the Hooke’s law. The relaxation modes are basically determined by the so-called Laplacian matrix (defined below) of the molecule.
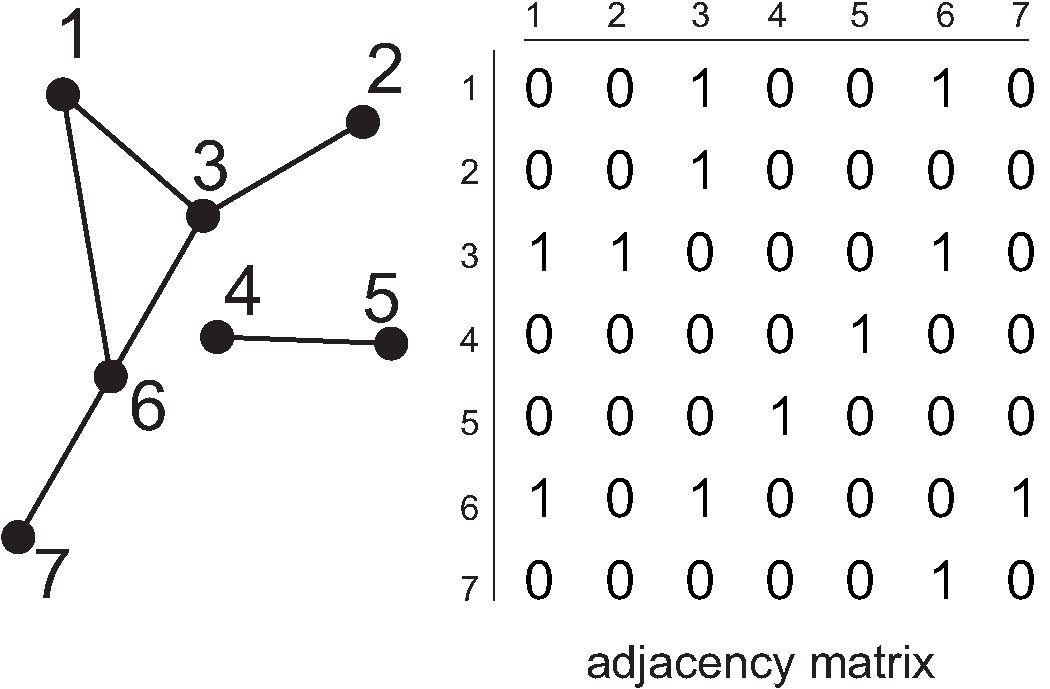
Consider the polymer network as a graph or a collection of graphs, see Fig. 21a. Enumerate the monomers of the -atomic macromolecule by the index . The adjacency matrix describing the topology (connectivity) of a polymer molecule is symmetric (). Its matrix elements take binary values, 0 and 1, such that the diagonal elements vanish, i.e. , and for off-diagonal elements, , one has , if the monomers and are connected, and otherwise. The Laplacian matrix is by definition as follows: for , and , as shown in Fig. 21b, i.e. , where is the vector of vertex degrees of the graph and is the identity matrix. The eigenvalues () of the symmetric matrix are real. For regular graphs (i.e for graphs with constant vertex degrees) the spectra of the adjacency and Laplacian matrices are uniquely connected to each other.
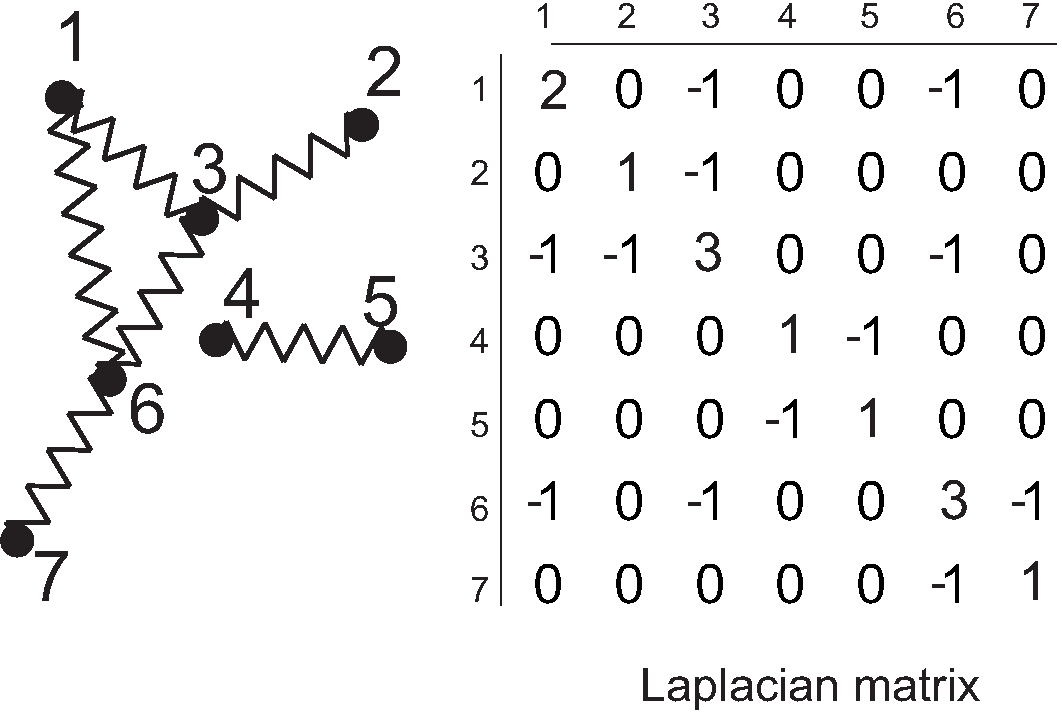
In physical literature the spectrum of adjacency matrix is interpreted as the set of resonance frequencies, while the Laplacian spectrum defines the relaxation of the system. Thus, measuring the response of the diluted solution of noninteracting polymer molecules on external excitations with continuously changing wavelength, we expect to see the signature of eigenmodes in the spectral density as peaks at some specific frequencies. Some other applications of adjacency and Laplacian matrices in graph theory and optimization are thoroughly described in [70] and [71].
In the Ref. [68] we investigate the eigenvalue statistics of exponentially weighted ensembles of full binary trees (known as “dendrimers” in macromolecular physics) and -branching star graphs. We show that spectral densities of corresponding adjacency matrices demonstrate peculiar ultrametric structure inherent to sparse systems and ensembles of linear chains exponentially weighted in their lengths. In particular, the tails of the distribution for binary trees again share the Lifshitz singularity discussed througout the text, while the spectral statistics of -branching star-like graphs is less universal, being strongly dependent on .
The hierarchical structure of spectra of adjacency matrices is interpreted as sets of resonance frequencies, that emerge in ensembles of dendrimers. However, the this spectrum is not determined by the cluster topology, but rather has the number-theoretic origin, reflecting the peculiarities of the rare-event statistics typical for one-dimensional systems with a quenched structural disorder. The similarity of spectral densities of an individual dendrimer and of ensemble of linear chains with exponential distribution in lengths, demonstrates that dendrimers could be served as simple disorder-less toy models of one-dimensional systems with quenched disorder.
3 Ultrametricity and chaotic Hamiltonian systems
At the end of this review, I would like to mention the estimation of the survival probability in the chaotic Hamiltonian systems [72]. We considered the dynamical system described by the area-preserving standard mapping
| (55) |
It is known that for the phase space of the system described by (55) has disjoined islands of integrability which is destroyed as approaches from below, where (see Ref. [73]). Above the critical value the behavior of the system is less universal: many invariant Kolmogorov-Arnold-Moser (KAM) tori disappear, but still some islands of metastability survive around the biggest resonances.
It is known for this system that , the normalized number of recurrences staying in some given domain of the phase space at time (so-called “survival probability”) has the power-law asymptotics, . In the Ref. [72] we have presented semi-phenomenological arguments which enable us to map the dynamical system (55) near the chaos border onto the effective “ultrametric diffusion” on the boundary of a tree-like space with hierarchically organized transition rates. Our consideration is based only on measurable “macroscopic” characteristics acquired in course of the iteration of the map (55). To be precise, we relied on the following well-established and confirmed facts: i) the number of principal resonances follows the Fibonacci sequence when [74, 75]; ii) the generic behavior of phase trajectories is as follows: the phase trajectory stays in the vicinity of some resonance (low-flux “cantori”) and then rapidly crosses the chaotic sea until another metastable low-flux cantori is reached [74, 76]; iii) the phase space of the standard mapping is self-similar being usually represented by a binary (i.e. 3-branching) Cayley tree [74, 77, 78]; iv) the survival probability has power-law asymptotic behavior, (for the first time this has been shown in Ref. [79, 80]).
In Ref. [72] we have estimated the exponent as
| (56) |
where is the critical rotation number. The survival probability, , is the normalized number of recurrences (55) which stay in some given domain of the phase space at time . Different research groups present different arguments for estimates of , typically . The most intriguing contradiction concerns the discrepancy in reported values of . The numerical simulations [80, 81] demonstrate , while almost all known analytic constructions give essentially larger exponents: in Ref. [77] and in Ref. [78]. The scaling analysis [75] valid just near the chaos boundary gives . The special attention should be paid to the recent works [82, 83, 84]. In Ref. [82] the authors demonstrate that by an appropriate randomization of the “Markov tree model” proposed in Ref. [77, 78] one can arrive at the value . The works [83, 84] claim for sticking of trajectories near in agreement with [75] and for trapping of chaotic trajectories in the vicinity of cantori for (where is a nonzero integer). The similar exponent, , was also obtained for a standard map in the work [85]. There is a point of view that the value corresponds to an intermediate behavior of the system which is not yet reached the stationary regime – see the corresponding discussion in Ref. [75, 86, 87, 88]. In Ref. [72] we have presented some simple arguments in favor of the statement that the value could be the actual decay exponent of the survival probability for related to the diffusion in the ultrametric landscape.
I would like to conclude by saying that the conjectured approach offers a possibility to rise some interesting questions concerning the internal structure of the standard mapping (55). For example, it would be desirable to check numerically the existence of the “secondary” Fibonacci sequences in addition to the standard ones (see Ref. [72] for details). In case of their existence, one would be intriguing to think about the phyllotaxis in chaotic dynamical systems. By this conjecture we would like to attract the attention of researchers working in nonlinear dynamical and chaotic systems to the language developed for the description of stochastic processes in ultrametric spaces.
Acknowledgements.
I want to express my sincere gratitude to my collaborators and colleagues with whom I have worked and/or discussed over years the topics reflected in this review: Vladik Avetisov, Alexander Gorsky, Alexander Grosberg, Yan Fyodorov, Pavel Krapivsky, Leonid Pastur, Kirill Polovnikov, Michael Tamm, Olga Valba, and Raphael Voituriez. I highly appreciate fruitful comments received in different years from Arezki Bodaoud, John Gemmer, Yuri Manin, Michael Marder, Leonid Mirny, Lev Truskinovsky, and Dima Shepelyansky. The supports of RFBR grant 16-02-00252 and of EU-Horizon 2020 IRSES project DIONICOS (612707) are highly acknowledged. I would cordially thank Yurij Holovatch for his kind proposal to write this Chapter.References
- 1. S.K. Nechaev, Concepts of statistical topology, ArXiv:1608.06529 [Lectures at the SERC School on Topology and Condensed Matter Physics, S.N. Bose National Center for Basic Sciences, Calcutta, India)]
- 2. A.Yu. Grosberg, S.K. Nechaev, and E.I. Shakhnovich, J. Phys. (Paris), 49 2095 (1988)
- 3. A. Grosberg, Y. Rabin, S. Havlin, and A. Neer, Europhys. Lett., 23 373 (1993)
- 4. E. Lieberman-Aiden, N.L. van Berkum, L. Williams, M. Imakaev, T. Ragoczy, A. Telling, I. Amit, B.R. Lajoie, P.J. Sabo, M.O. Dorschner, et al, Science, 326 289 (2009)
- 5. L.A. Mirny, Cromosome Res., 19 37 (2011)
- 6. G.J. Filion, J.G. van Bemmel, U. Braunschweig, W. Talhout, J. Kind, L.D. Ward, W. Brugman, I. de Castro Genebra de Jesus, R.M. Kerkhoven, H.J. Bussemaker, and B. van Steensel, Cell, 143 212 (2010)
- 7. L.I. Nazarov, M.V. Tamm, V.A. Avetisov, and S.K. Nechaev, Soft Matter, 11 1019 (2015)
- 8. M. A. R. Koehl, W.K. Silk, H. Liang, and L. Mahadevan, 48 834 (2008)
- 9. E. Sharon, B. Roman, and H. L. Swinney, Phys. Rev. E, 75 046211 (2007)
- 10. S.Nechaev, R.Voituriez, J.Phys. A: Math. Gen., 34 11069 (2001)
- 11. S. Nechaev and O. Vasilyev, J. Phys. A: Math. Gen. 37 3783 (2004)
- 12. V. Borrelli, S. Jabrane, F, Lazarus, and B. Thibert, PNAS, 109 7218 (2012)
- 13. S. Nechaev and K Polovnikov, Soft Matter, 13 1420 (2017)
- 14. E. Efrati, E. Sharon, and R. Kupferman, ArXiv:0810.2411
- 15. M. Lewicka, L. Mahadevan, and M.R. Pakzad, Proc. Royal Soc. A, 467 402 (2011)
- 16. J. Gemmer, E. Sharon, and S. Venkataramani, ArXiv:1504.00738
- 17. E. Sharon, B. Roman, and M. Marder, G.-S. Shin, and H. L. Swinney, Nature 419 579 (2002)
- 18. B. Audoly and S. Neukirch, Phys. Rev. Lett., 95 095505 (2005)
- 19. P.L. Tchebychef, On the cut of clothes, talk at l’Association française pour l’avancement des sciences, 7th session, Paris, Meeting of 28 August 1878
- 20. L. Bowers, Michigan Math. J., 45 31 (1998)
- 21. S. Duval and M. Tajine, Trees formalism for fractal description (poster), Fractal’97, in Fractals in the natural and Applied Sciences, Denver, Colorado, USA, p. 474 (1997)
- 22. D.W. Henderson and D. Taimina, The Mathematical Intelligencer, 23 17 (2001)
- 23. M.H. Amsler, Mathematische Annalen, 130, 234 (1955)
- 24. R. Rammal, G. Toulouse, and M. Virasoro, Rev. Mod. Phys. 58 765 (1986)
- 25. H. Frauenfelder, The Connection Between Low-Temperature Kinetics and Life, in Protein Structure: Molecular and Electronic Reactivity, Ed. by R. Austin et al. (New York: Springer, 1987), pp. 245
- 26. H. Frauenfelder, Nat. Struct. Biol., 2 821 (1995)
- 27. V. A. Avetisov, A. Kh. Bikulov, and A. P. Zubarev, Proc. Steklov Inst. Math. 285 3 (2014)
- 28. A. P. Zubarev, Ultrametric Anal. Appl., 6 150 (2014)
- 29. G. J. Rodgers and A. J. Bray, Phys. Rev. B, 37 3557 (1988)
- 30. T. Rogers, I. P. Castillo, R. Kühn, and K. Takeda, Phys. Rev. E, 78 031116 (2008)
- 31. Y. V. Fyodorov and A. D. Mirlin, J. Phys. A: Math. Gen., 24 2219 (1991)
- 32. S. N. Evangelou and E. N. Economou, Phys. Rev. Lett., 68 361 (1992)
- 33. M. Bauer and O. Golinelli, J. Stat. Phys., 103 301 (2001)
- 34. G. Semerjian and L. F. Cugliandolo, J. Phys. A: Math. Gen., 35 4837 (2002)
- 35. R. Kühn, J. Phys. A: Math. Theor., 41 295002 (2008)
- 36. L.S. Levitov, Europhys. Lett., 14 533 (1991)
- 37. L.S. Levitov, Phys. Rev. Lett., 66 22 (1991)
- 38. B. Audoly, A. Boudaoud, Phys. Rev. Lett, 91, 086105 (2003)
- 39. C. Nisoli, N.M. Gabor, P.E. Lammert, J.D. Maynard, and V.H. Crespi, Phys. Rev. Lett. 102 186103 (2009)
- 40. F. Klein, Jahresbericht der Deutschen Mathematiker-Vereinigung, 1, 35 (1890)
- 41. Y.B. Rumer, Soviet Mathematics Uspekhi, 8 55 (1953)
- 42. D. Hilbert, Trans. Am. Math. Soc., 2 87 (1901)
- 43. G.M. Fihtengolc, Kurs Diferencialnovo i Integralnovo Iscislenia I, Nauka: Moscow (1966)
- 44. K. Chandrassekharan, Elliptic Functions, Springer: Berlin (1985)
- 45. E. Cerda, K. Ravi-Chandar, and L. Mahadevan, Nature, 419 579 (2002)
- 46. S. Janson, T.Łuczak, and A. Rucinski, Random Graphs, New York: John Wiley & Sons (2000)
- 47. P. L. Krapivsky, S. Redner and E. Ben-Naim, A Kinetic View of Statistical Physics (Cambridge: Cambridge University Press, 2010)
- 48. V. Avetisov, P. Krapivsky, and S. Nechaev, J. Physics A: Math. Theor. 49 035101 (2015)
- 49. K. Beanland, J.W. Roberts, and C. Stevenson, Am. Math. Monthly, 116 531 (2009)
- 50. V. Trifonov, L. Pasqualucci, R. Dalla-Favera, and R. Rabadan, Scientific reports, 1 191 (2011)
- 51. M. Planat and C. Eckert, IEEE transactions on ultrasonics, ferroelectrics, and frequency control, 47 1173 (2000)
- 52. D. Lundholm, ArXiv:1608.05067
- 53. M. Middendorf, E. Ziv, C.H. Wiggins, PNAS, 102 3192 (2005)
- 54. V. A. Avetisov, A. Kh. Bikulov, S. V. Kozyrev, and V. A. Osipov, J. Phys. A: Math. Gen., 35 177 (2002); S. Kozyrev, V. Osipov, and V. Avetisov, J. Math. Phys. 46 063302 (2005)
- 55. G.H. Hardy, and E.M. Wright, An introduction to the theory of numbers, Oxford University Press (1979)
- 56. L.R. Ford, Am. Math. Monthly, 45 586 (1938)
- 57. H.S.M. Coxeter, Am. Math. Monthly, 75 5 (1968)
- 58. K. Chandrassekharan, Elliptic Functions, Berlin: Springer, (1985)
- 59. P. Epstein, Mathematische Annalen, 56 615 (1903)
- 60. C.L. Siegel, Lectures on advanced analytic number theory, Tata Inst. of Fund. Res., Bombay, (1961)
- 61. Y. Motohashi, Proceedings of the Japan Academy, 44 614 (1968)
- 62. J.M. Borwein and P.B. Borwein, Journal of Number Theory, 43 293 (1993)
- 63. Mezard, M., Parisi, G., Virasoro, M., Spin glass theory and beyond: An Introduction to the Replica Method and Its Applications, WSPC (1987)
- 64. I. Adler, Solving the Riddle of Phyllotaxis: Why the Fibonacci Numbers and the Golden Ratio Occur On Plants (Singapore: World Scientific, 2012)
- 65. K. Beanland, J.W. Roberts, and C. Stevenson, American Mathematical Monthly, 116 531 (2009)
- 66. W. Magnus Noneuclidean Tesselations and their Groups, London: Acad.Press, (1974)
- 67. A.F. Beardon The Geometry of Discrete Groups, Berlin: Springer-Verlag, (1983)
- 68. V. Kovaleva, Yu. Maximov, S. Nechaev, and O. Valba, to appear in J. Stat. Mech. (2017), [ArXiv:1612.01002]
- 69. A.E. Brouwer and W.H. Haemers, Spectra of graphs, Springer Science & Business Media (2011)
- 70. B. Mohar, Some applications of Laplace eigenvalues of graphs, Springer (1997)
- 71. F.R. Chung, Spectral graph theory, American Math. Soc. (1997)
- 72. V. A. Avetisov and S. K. Nechaev, Phys. Rev. E, 81 046211 (2010)
- 73. R.S. MacKay, Physica D, 7 283 (1983)
- 74. J.D. Hanson, J.R. Cary, and J.D. Meiss, J. Stat. Phys., 39 327 (1985)
- 75. B.V. Chirikov and D.L. Shepelyansky, Phys. Rev. Lett., 82 528 (1999)
- 76. R.S. MacKay, J.D. Meiss, and J.C. Percival, Physica D, 13 55 (1984)
- 77. J.D. Meiss and E. Ott, Phys. Rev. Lett., 55 2741 (1985)
- 78. J.D. Meiss and E. Ott, Physica D, 20 387 (1986)
- 79. C.F.F. Karney, Physica D, 8 360 (1983)
- 80. B.V. Chirikov and D.L. Shepelyansky, Physica D, 13 395 (1984)
- 81. B.V. Chirikov and D.L. Shepelyansky, in Proceedings of the IXth International Conference on Monlinear Oscillations, Kiev, 1982 [Naukova Dumka 2 420 (1984)] (English translation: Princeton University Report No. PPPL-TRANS-133, 1983)
- 82. G. Cristodoro and R. Ketzmerick, Phys. Rev. Lett. 100, 184101 (2008)
- 83. R. Venegeroles, Phys. Rev. Lett., 101 054102 (2008)
- 84. R. Venegeroles, Phys. Rev. Lett., 102 064101 (2009)
- 85. A. Morbidelli and M. Vergassola, J. Stat. Phys., 89, 549 (1997)
- 86. M. Weiss, L. Hufnagel, and R. Ketzmerick, Phys. Rev. Lett., 89 239401 (2002)
- 87. B.V. Chirikov and D.L. Shepelyansky, Phys. Rev. Lett., 89 239402 (2002)
- 88. R. Artuso and C. Manchein, Phys. Rev. E, 80, 036210 (2009)