Probing dark matter with star clusters: a dark matter core in the ultra-faint dwarf Eridanus II
Abstract
We present a new technique to probe the central dark matter (DM) density profile of galaxies that harnesses both the survival and observed properties of star clusters. As a first application, we apply our method to the ‘ultra-faint’ dwarf Eridanus II (Eri II) that has a lone star cluster pc from its centre. Using a grid of collisional -body simulations, incorporating the effects of stellar evolution, external tides and dynamical friction, we show that a DM core for Eri II naturally reproduces the size and the projected position of its star cluster. By contrast, a dense cusped galaxy requires the cluster to lie implausibly far from the centre of Eri II (), with a high inclination orbit that must be observed at a particular orbital phase. Our results, therefore, favour a dark matter core. This implies that either a cold DM cusp was ‘heated up’ at the centre of Eri II by bursty star formation, or we are seeing an evidence for physics beyond cold DM.
keywords:
stars: kinematics and dynamics – galaxies: dwarf – galaxies: haloes – galaxies: individual: Eridanus II – galaxies: star clusters: general – galaxies: structure.1 Introduction
The ‘Cold Dark Matter’ (CDM) model gives a remarkable match to the growth of structure on large scales in the Universe (e.g. Tegmark & Zaldarriaga, 2002; Planck Collaboration et al., 2014). Yet on smaller scales, inside galaxy groups and galaxies, there have been long-standing tensions (e.g. Klypin et al., 1999; Moore et al., 1999). Key amongst these is the ‘cusp-core’ problem. Pure dark matter (DM) simulations of structure formation in a CDM cosmology predict that galaxies should reside within dense central DM cusps with density (e.g. Dubinski & Carlberg, 1991; Navarro, Frenk, & White, 1996b) whereas observations of the rotation curves of dwarf galaxies have long favoured constant density cores (e.g. Flores & Primack, 1994; Moore, 1994; Read et al., 2017). This may owe to physics beyond CDM, for example self-interacting DM (SIDM; e.g. Spergel & Steinhardt 2000; Kaplinghat et al. 2016), wave-like DM (e.g. Schive et al., 2014) or ultra-light axions (e.g. González-Morales et al., 2017). However, all of these small-scale tensions with CDM arise when comparing models devoid of ‘baryons’ (stars and gas) with real galaxies in the Universe. There is mounting evidence that bursty star formation during galaxy formation can ‘heat-up’ DM, transforming a DM cusp to a core (e.g. Navarro, Eke, & Frenk 1996a; Read & Gilmore 2005; Pontzen & Governato 2012, 2014; Pontzen et al. 2015). The latest simulations, that reach a mass and spatial resolution sufficient to resolve the multiphase interstellar medium, find that DM cores, of approximately the half stellar mass radius in size (), form slowly over a Hubble time (Mashchenko et al., 2008; Governato et al., 2010; Pontzen & Governato, 2012; Teyssier et al., 2013; Madau et al., 2014; Di Cintio et al., 2014; Oñorbe et al., 2015; Tollet et al., 2016; Read et al., 2016; Munshi et al., 2017).
Although the above simulations agree on the size and formation timescale of DM cores, there remains some disagreement over the DM halo mass at which cusp-core transformations become inefficient, 111 is the virial mass. For satellite galaxies, we define this pre-infall.. As pointed out by Peñarrubia et al. (2012), for a fixed if too few stars form then there will no longer be enough integrated supernova energy to unbind the DM cusp. Depending on the numerical scheme employed, has been reported to be as high as M⊙ (e.g. Chan et al., 2015; Tollet et al., 2016) and as low M⊙ (Read et al., 2016, hearafter R16), where the spread owes primarily to different star formation efficiencies in low mass halos (see §2.2 and Fig. 1).
The above motivates measuring the central DM density of the very faintest galaxies in the Universe. With little star formation, these may be expected to retain their ‘pristine’ DM cusps (e.g. R16). There is no shortage of such faint dwarf galaxies orbiting the Milky Way, Andromeda and nearby systems (e.g. Belokurov et al., 2007; Collins et al., 2014; Bechtol et al., 2015; Sand et al., 2015). However, most of these are devoid of gas and so the kinematics of their stars must be used to probe their DM halos. This is challenging because of a strong degeneracy between their DM density profiles and the orbit distribution of their stars (e.g. Merrifield & Kent, 1990; Evans et al., 2009; Read & Steger, 2017). For the brighter Milky Way dwarfs, this degeneracy can be broken by using metallicity or colour to split the stars into distinct components with different scale lengths (e.g. Battaglia et al. 2008; Walker & Peñarrubia 2011 and Agnello & Evans 2012, but see Breddels & Helmi 2013 and Richardson & Fairbairn 2014). However, for the fainter dwarfs there are too few stars to obtain strong constraints (Read & Steger, 2017).
An alternative method for probing the central density of dwarf galaxies was proposed by Hernandez & Gilmore (1998), Goerdt et al. (2006) and Sánchez-Salcedo et al. (2006). They showed that the globular clusters (GCs) in the dwarf spheroidal galaxy Fornax would rapidly sink to the centre by dynamical friction if Fornax has a steep DM cusp. By contrast, in a constant density core, dynamical friction is suppressed (Read et al., 2006a; Inoue, 2009, 2011; Petts et al., 2015, 2016), allowing Fornax’s GCs to survive through to the present day. This ‘timing argument’ was refined by Cole et al. (2012) who used 2800 -body simulations of Fornax’s GC system to show that a core is favoured over a cusp, in excellent agreement with split-population modelling of Fornax’s stars (e.g. Walker & Peñarrubia, 2011). (Such survival arguments were extended by Peñarrubia et al. (2009) to the GCs associated with the Sagittarius dwarf.) Although it is likely that Fornax has a DM core, its stellar mass ( M⊙; de Boer et al. 2012) is large enough for bursty star formation to drive complete cusp-core transformations (Peñarrubia et al. 2012; R16). Thus, Fornax’s core yields inconclusive constraints on the nature of DM.
In this paper, we develop a new method for probing the central DM density of dwarf galaxies that harnesses both the survival and present-day properties of star clusters. Star clusters are dense stellar systems that slowly expand due to two-body relaxation (Hénon, 1965; Gieles et al., 2010). In a tidal field, high-energy stars are pushed over the cluster’s tidal boundary, slowing down the expansion. Eventually, the cluster’s half stellar mass radius becomes a constant fraction of the tidal radius and, from that moment on, the cluster evolves approximately at a constant density set by the tidal field (Hénon, 1961; Gieles, Heggie, & Zhao, 2011). Thus, the observed surface density of low-mass GCs (i.e. those that have undergone sufficient relaxation) can be used as probes of the host galaxy’s tidal field and, therefore, its density distribution (Innanen et al., 1983). This allows us to probe the DM distribution in any dwarf galaxy with low-mass star clusters, including those with a much lower stellar mass than Fornax. This is the key idea that we exploit in this work222Note that the cluster’s stellar kinematics are also affected by tides, making them additional probes of the properties of the galactic tidal field (e.g. Küpper et al., 2010; Claydon et al., 2017)..
To model star clusters sinking in the potential of a host dwarf galaxy, we make use of the semi-analytic dynamical friction model from Petts et al. (2016) (hereafter P16), implemented in the direct-summation code nbody6 (Aarseth, 2003). This allows us to model the survival of star clusters, similarly to Cole et al. (2012), but with a complete -body model of the star cluster itself, including two-body effects, binary formation and evolution and stellar evolution. By comparing a large grid of such models with observational data, we are able to constrain the DM density of dwarf galaxies that host low mass GCs, independently of timing arguments or stellar kinematic measurements.
As a first application, we apply our method to the ultra-faint dwarf galaxy Eridanus II (Eri II) that was recently discovered by the Dark Energy Survey (DES; Bechtol et al. 2015; Koposov et al. 2015). Eri II is situated from the Sun, at the edge of the MW, with , a half-light radius of , and an ellipticity of . Eri II appears to show an extended star formation history, but follow-up observations are needed to confirm this. Koposov et al. (2015) and Crnojević et al. (2016) found that Eri II has a lone star cluster at a projected distance from Eri II’s centre, with and a half-light radius of (see Crnojević et al., 2016, Table 1). Compared to the MW’s star clusters (Harris, 1996, 2010 edition), Eri II’s star cluster appears faint and extended, contributing just of Eri II’s total luminosity.
This paper is organised as follows. In §2, we describe our method for probing the central DM density of dwarf galaxies using star clusters, and we motivate our priors for modelling Eri II. In §3, we present our main findings. In §4, we discuss the implications of our results for galaxy formation and the nature of DM. Finally, in §5, we present our conclusions.
2 Method
2.1 A new method for measuring the inner DM density of dwarf galaxies
We model the evolution of star clusters orbiting within a host dwarf galaxy using nbody6df (P16). This is a publicly available333 http://github.com/JamesAPetts/NBODY6df. adaptation of nbody6, which is a fourth-order Hermite integrator with an Ahmad & Cohen (1973) neighbour scheme (Makino & Aarseth, 1992; Aarseth, 1999, 2003), and force calculations that are accelerated by Graphics Processing Units (GPUs, Nitadori & Aarseth, 2012). nbody6 contains metallicity dependent prescriptions for the evolution of individual stars and binary stars (Hurley et al., 2000, 2002) which we use in our simulations here.
In nbody6df, we model the host dwarf galaxy as a static, analytic potential. Dynamical friction is then applied to star cluster members using the semi-analytic model described in P16 (see also Petts et al., 2015). The P16 model has been extensively tested against full -body simulations of dynamical friction in both cored and cusped background potentials, giving an excellent description of the orbital decay in both cases. In particular, it is able to reproduce the ‘core-stalling’ behaviour, whereby dynamical friction is suppressed inside constant density cores (Goerdt et al. 2006; Read et al. 2006a; Inoue 2009, 2011 and see P16 for further details).
We set up a grid of 200 nbody6df simulations, varying the density profile (cusped or cored) and the initial orbit and properties of the star cluster. Comparing this grid with observations, we determine the most likely mass distribution for Eri II, and the initial properties of its star cluster. (Eri II is dominated at all radii by its dark matter halo (see §2.2) and so its total mass distribution directly provides us with its DM density profile.) In addition, we run a further 26 simulations to determine how our results depend on the mass, concentration and inner logarithmic slope of Eri II’s dark matter halo (§3.4). We also test whether Eri II’s cluster could form and survive in the very centre of Eri II (§3.5).
2.2 The DM halo of Eri II
We model the DM halo of Eri II using the coreNFW profile from R16. This is described by a mass and concentration parameter , identical to those used for the cusped Navarro-Frenk-White (NFW) profile (Navarro, Frenk, & White, 1996b). However, it allows also for a central DM core. By default, this has a size set by the projected half light radius of the stars , which for Eri II is kpc444 The latest estimates of are slightly lower than the value we have assumed here, pc (Denija Crnojević, private communication), though within the uncertainties. However, as we show in §3.4, we are not very sensitive to , or the DM core size. As such, the newer value for will not affect our results. (Crnojević et al., 2016). The power-law slope of the core is set by , where produces a flat dark matter core, whereas returns the fully cusped NFW profile555In R16, was parameterised by the total star formation time. However, since this is poorly determined for Eri II, we consider here just a range of values for . We discuss this further in §4..
Eri II’s stellar population may be expected to be like other similar stellar mass dwarf galaxies (e.g. Bootes I and Ursa Major I; see McConnachie 2012) which have predominantly old-age stars. Santana et al. (2013) showed that the apparent intermediate-age population in these galaxies is likely due to the presence of blue straggler stars. However, they could not rule out the presence of an intermediate-age population of up to 3 Gyr old. Recent HST data (propID 14234; subject of a future publication), has confirmed that Eri II’s stellar population is similar to those studied by Santana et al. (2013), hence favoring an older population. In this work, we choose to be conservative and assume that the cluster is older than Gyr.
To obtain an estimate of the (pre-infall) halo mass, , for Eri II we use the recent measurement of its mass within the 3D half light radius , derived from stellar kinematics by Li et al. (2017). We turn this into an by fitting an NFW profile to using the relation from Macciò et al. (2007), finding .
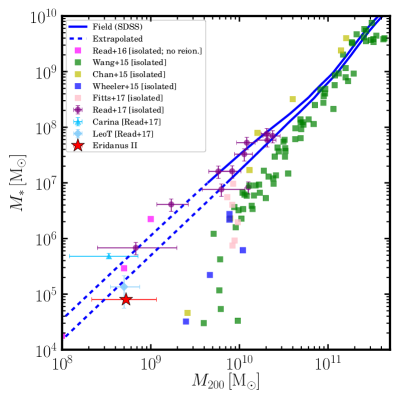
To test if the above value for is reasonable, in Fig. 1 we compare the stellar mass (; Bechtol et al. 2015) and for Eri II with measurements for other nearby dwarfs; Eri II is marked by the red star. The purple circles show the relation for isolated gas-rich dwarfs from Read et al. (2017). The dark cyan triangle shows a measurement for the Carina dwarf spheroidal galaxy from Ural et al. (2015). The light cyan diamond shows an estimate for the isolated dIrr Leo T from Read et al. (2017). The blue solid and dashed lines show the relation derived by Read et al. (2017) from abundance matching in CDM using the SDSS field stellar mass function (the dashed lines show where this is extrapolated). The remaining data points show the latest results from a range of simulations of isolated dwarfs taken from the literature: R16 (magenta); Wang et al. (2015) (green); Chan et al. (2015) (yellow); Wheeler et al. (2015) (blue); and Fitts et al. (2017) (pink). As can be seen, there is a clear discrepancy between most simulations and the data below M⊙ that remains to be understood (Jethwa et al., 2018). For our paper here, however, this plot demonstrates that our derived for Eri II is in good agreement with estimates for other galaxies of a similar stellar mass. Eri II is consistent with a ‘failed’ Leo T, inhabiting a similar DM halo but having its star formation shut down earlier, lowering its for the same pre-infall . This is further evidenced by the lack of detected HI gas, or recent star formation, in Eri II (Crnojević et al., 2016).
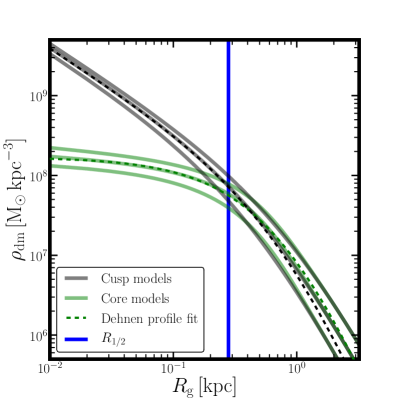
In Fig. 2, we show the cumulative mass profiles (left panel) and DM density profiles (right panel) for Eri II that we assume in our fiducial grid of simulations (we explore different halo masses, concentrations and logarithmic cusp slopes in §3.4). The grey lines show the cusped model, the green lines show the cored model. The middle of the three lines shows that we assume from here on. The top and bottom lines show the upper and lower boundary of estimated from the kinematic measurements (Li et al., 2017). The projected half light radius of the stars, , is marked by the vertical blue line. On the left panel, the measurement of for Eri II from Li et al. (2017) is marked by the red data point. As can be seen, due to the relation, changing produces only a small effect on the DM density within . Thus, our method will not be very sensitive to (we will verify this expectation in §3.4). However, cusped and cored models look very different within and this is what we aim to probe in this work.
Finally, the latest version of nbody6df only supports a background DM density profile modelled by Dehnen spheres (Dehnen, 1993):
| (1) |
where and are the mass and scale length, respectively, and is the logarithmic slope of the inner density profile.
Thus, to obtain DM profiles suitable for nbody6df, we fit the above Dehnen profile to our coreNFW density profiles. These fits are shown by the dashed lines in the right panel of Fig. 2. As can be seen, inside (our region of interest), these fits are excellent. Our best-fit parameters for the cored (, which corresponds to for our coreNFW profile) and cusped (, which corresponds to ) models were: and kpc and and kpc, respectively.
2.3 Eri II’s star cluster
We model the initial conditions of Eri II’s star cluster as a Plummer sphere (Plummer, 1911) with a Kroupa IMF (Kroupa, 2001), sampling stars with masses between and and assuming a metallicity of (corresponding to ). We assumed a range of initial masses and half-mass radii for the cluster to explore how its initial properties impact its final state.
2.4 Exploring parameter space
To explore the parameter space, we ran 200 simulations, 100 for each galaxy model (core and cusp). We varied , and the initial galactocentric distance () of the cluster. We allowed the cluster to have a of 1, 5, 10, 15 and 20; a of approximately 13,000, 19,000, 25,000 and 32,000; and of 0.14, 0.28, 0.56, 1.12 and . The range is based on what is found for young massive clusters (Portegies Zwart et al., 2010). The minimum is chosen such that after stellar mass loss the mass is always above the mass of the cluster. The maximum mass was chosen such that less than of all stars in the entire galaxy originated from the star cluster, which is a reasonable upper limit (Larsen et al., 2012, 2014).
For all clusters we adopted circular orbits. This favours the survival of clusters in cusped profiles because eccentric orbits reach closer to the centre of the galaxy where clusters are less likely to survive. (Our assumption that the host dwarf galaxy has a spherical potential similarly favours a cusped profile because in triaxial models there are no circular orbits and only the more damaging radial orbits are allowed.)
Contenta et al. (2017) show how the observations of faint star clusters – like Eri II’s star cluster – can be affected by primordial binaries and the retention fraction of black holes, together with observational biases. In our simulations we did not vary these aspects, which could be degenerate with the initial conditions of the clusters, nor did we vary the initial density profile of the clusters.
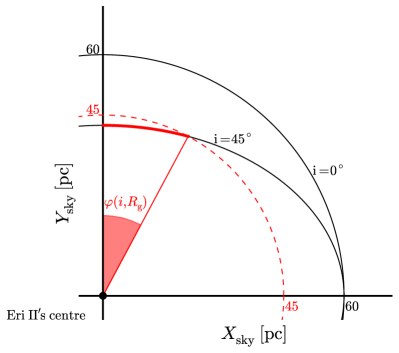
Eri II’s star cluster is observed at a projected distance from the centre of Eri II. Thus, we also need to take into account the probability for the cluster to be observed at that radius in the total likelihood. We estimate the probability to observe a cluster (on a circular orbit) within for a given , assuming a random inclination of the orbital plane with respect to the observer. To compute , firstly we estimate the angle , which defines the angle in which the cluster is observed to be within during 1/4 of an orbit (see Fig. 3), where is the angle between the pole of the orbit and the line of sight. For circular orbits, the angle is given by
| (2) |
Secondly, we integrate with respect to , because for random inclinations of the orbital plane, is uniformly distributed. We then divide by a normalization angle, , because considers only 1/4 of an orbit, see Fig. 3 and we obtain
| (3) |
By definition, .
To compare the -body simulations with the observational data, we assumed a stellar mass-to-light ratio of , appropriate for old, metal-poor stellar populations (e.g. McLaughlin & van der Marel, 2005), obtaining . We multiply the observed half-light radius () by to correct for projection effects (Spitzer, 1987), to get an estimate for the 3D half-mass radius 666Assuming that light traces mass, which is not necessarily true if the cluster is mass segregated. of Eri II’s star cluster. To find the model that best fit the observational data, we maximise the likelihood for the fitting parameters (, , and ). The log-likelihood function is:
| (4) |
where and 777 is the uncertainty on the 3D half-mass radius; whereas is estimated assuming . are the uncertainties derived from the observation (Crnojević et al., 2016). The last term in the equation above is given by equation (3) and acts as a prior to our likelihood given that it penalises models that are less likely to be observed simply due to geometrical constraints. Additional free parameters, such as the time when the cluster appears at pc, could be included, however the age and the orbit of the cluster are unknown. Whereas, the time span when the cluster reproduce the observations would favour the clusters in the cored galaxy (see § 3.2), without changing the main results. Therefore we took the simplest approach including only the geometric effects.
By computing , (defined as the sum of the mass of all stars within the tidal radius of the cluster) and , we calculate the likelihood (equation 4) for each output time of the simulation.
2.5 Estimation of the number density profile
To study the structural properties of the clusters in the -body simulations, we used a maximum likelihood fit following the procedure described in Martin et al. (2008). We model the stellar distribution of the clusters using 2D elliptical Plummer and spherical, single-component, King models (King, 1966). We fit the models with a Monte Carlo Markov Chain (MCMC) method (emcee code, Foreman-Mackey et al., 2013) to optimize the following parameters: projected half-number radius, ellipticity, position angle, and surface density background for the Plummer models; and half-number radius, central dimensionless potential and background surface density for the King models888We used the limepy code (Gieles & Zocchi, 2015) to compute the projected density profiles of King models (https://github.com/mgieles/limepy)..
2.6 Qualitative estimation of the size of Eri II’s star cluster
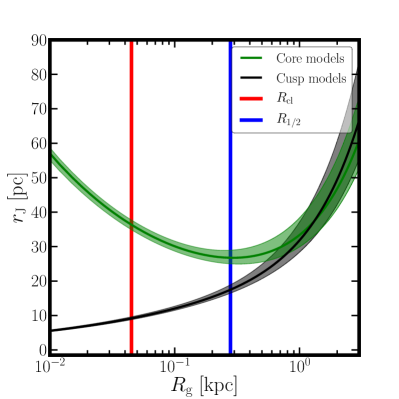
We can estimate the maximum radius that a star cluster can have, which corresponds to the situation in which the cluster fills the Roche volume. As described by Hénon (1961), a star cluster in a tidal field, evolves at a constant mean density once it fills the Roche volume, which means that the ratio between the and the Jacobi radius () is constant: . The Jacobi radius is defined in King (1962) as:
| (5) |
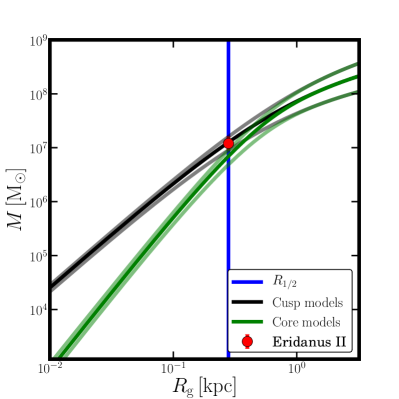
where is the angular velocity of the cluster around the Galaxy centre, is the potential of the Galaxy and is the gravitational constant. In Fig. 4, we show that if we use the Dehnen models chosen in Fig. 2 and , we can estimate the tidal radius of the cluster as a function of , assuming that the cluster is on a circular orbit. From this Figure, using the ratio , we find that in a cusped galaxy at pc (red line), a cluster can be at most as large as pc, whereas in a cored galaxy it can be substantially larger ( pc).
In practice, however, the ratio depends on the galactic potential and the number of stars in the cluster. Giersz & Heggie (1997) found that depending on these, it can be as high as . For this reason, we require full -body simulations to obtain quantitative constraints on the central dark matter density slope in Eri II. Nonetheless, Figure 4 does give us the correct intuition that clusters will be larger in cored rather than cusped galaxies.
3 Results
3.1 Cusp vs. core
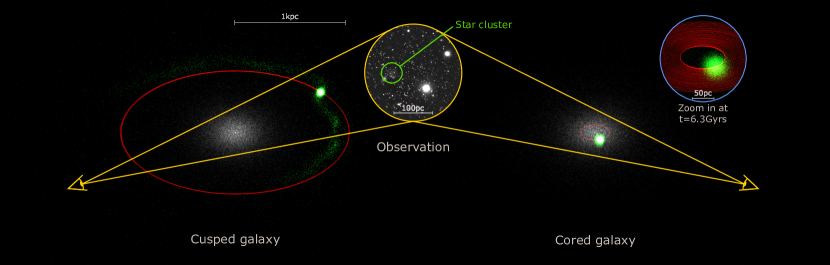
The main result of our investigation is that the presence of a cored DM profile in Eri II allows a star cluster to not only survive in the centre of the galaxy, but also to expand up to (i.e. ), in excellent agreement with observations of Eri II’s lone star cluster. By contrast, a cusped DM profile gives a poorer fit overall and requires special conditions that have to be satisfied. In Fig. 5, we show a schematic representation of a simulated cluster in a cusped galaxy (on the left) and a cored galaxy (on the right) at times when they best reproduce the observations (shown in the middle). As can be seen, in the cored galaxy (right), the star cluster (green) stalls at a radius pc from Eri II’s centre (see the zoomed image in the blue circle that shows its orbital decay and stalling in red). In this case, no special inclination or time are required to reproduce Eri II’s star cluster. Notice also that the cluster appears visibly extended, similarly to Eri II’s cluster, and that it shows little to no tidal tails, as expected for a cluster orbiting in a constant density core (e.g. Petts et al., 2016). By contrast, in the cusped case (left), the cluster must orbit much farther () from Eri II’s centre in order to survive. Now its orbit will only be close enough to Eri II in projection when the red circle lies inside the two solid yellow lines. This happens when the cluster orbits with a high inclination () of the orbital plane, and is in a particular orbital phase (that occurs for <3% of the total orbit time). In the cusped galaxy, the cluster is denser than in the cored case and less consistent with the data for Eri II’s cluster. There are also now two visible tidal tails, as expected for a cluster orbiting in a cusped background.
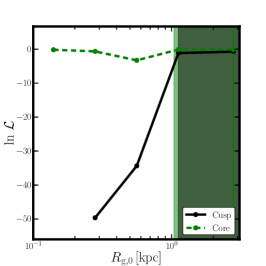
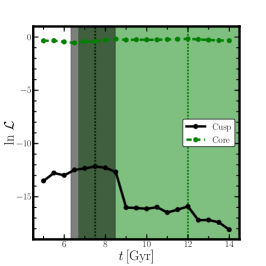
In Fig. 6, we show the maximum likelihood of our models as a function of , varying all the other parameters (, , and ), without (left) and with (middle) in the likelihood; and as a function of time, (varying all the other parameters and including , right). The shaded grey and green regions show the 68% confidence intervals for the parameters and for the cusped (grey) and cored (green) galaxy, respectively. (Assuming that the Wilks’ theorem is valid, we used the likelihood ratio to estimate the confidence intervals (Wilks, 1938); we do not allow our reported confidence interval to be smaller than the distance between two data points.)
For the clusters in the cored galaxy, the likelihood is bimodal because it is possible to fit the data if the cluster is either in the inner or outer region of the galaxy (see the left panel). For , the tidal radius of the cluster is close to its minimum and there it is more difficult to increase the cluster’s up to the observed . This leads to the dip in the likelihood at this point. However, including the probability of observing the cluster at the right position (middle panel) breaks this bimodality, favouring the orbits near the centre with lower .
For the clusters evolving in the cusped galaxy, no star cluster can survive in the inner galaxy for more than 5 Gyrs and the likelihood is, therefore, zero for all clusters in that region of parameter space chosen in this study. Considering more massive clusters initially does not necessarily lead to a higher probability of survival, because of the increased importance of dynamical friction. Clusters that orbit outside the scale radius () have comparable likelihoods in the cusped and cored models (see left and middle panels) because they are similar by construction at large radii (compare the green and black dashed lines in the right panel of Fig. 2). (A measurement of the 3D position of the cluster in Eri II would allow us to completely rule out cusped models. However, to measure a offset from Eri II, an accuracy of mag is needed. Even with RR Lyrae, it is only possible at present to reach an accuracy of mag.)
The right panel of Fig. 6 shows the maximum likelihood at different times. The black line is for clusters in a cusped galaxy, for which the best fits are the models between and old. The green dashed line is for the cored DM profile, for which the best fits are all models with . In the cored galaxy, the best fit models are those that survive in the inner part of the galaxy where they can easily expand up to and survive for . For the cusped galaxy, we can only reproduce the observed properties of Eri II star cluster for a small amount of time and for a small range of and . To reproduce Eri II’s star cluster in a cusped galaxy, it must therefore have an age of . This provides another testable prediction that could fully rule out cusped models.
Finally, even if we accept a high inclination of the orbital plane and the required orbital phase for the cusped case, its star clusters give a poorer fit to the observations than the cored case, because the clusters are not able to expand enough to match the data. We discuss this in more detail, next.
3.2 Best-fit star cluster models
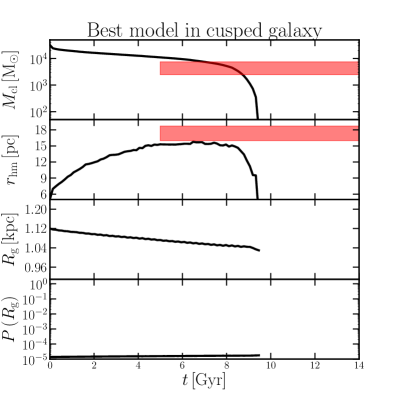
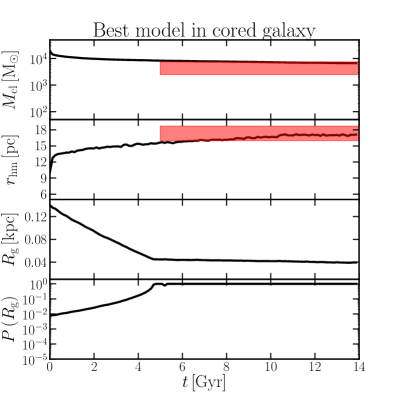
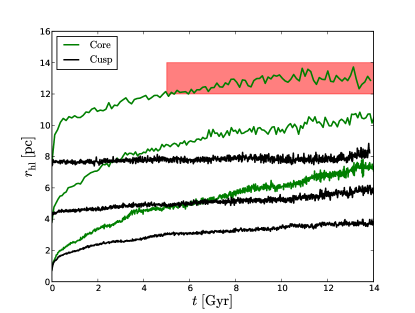
The best-fit model in the cusped galaxy has , , and . The best-fit model in the cored galaxy has , , and . Fig. 7 shows the evolution of , , and for these two models. The red shaded areas show the 68% confidence intervals of the data. (We only have a lower limit for the age of the cluster, because stars younger than have not been observed; see §1.) In Fig. 7, we show that the properties of the star cluster in a cored DM profile reproduce the properties of the observed star cluster for all times Gyr, whereas in the cusped case the cluster has to be observed at a specific time. Notice, however, that the cusped model is always at tension with the data, with its size, , never quite reaching high enough to match Eri II’s star cluster.
As discussed in §1, we expect the density of the star cluster to reach an equilibrium due to relaxation-driven expansion and the tidal pruning of high-energy escaper stars. In the left panel of Fig. 7, we see this process happening between and for the cusped model. Over this period, the cluster evolves at an approximately constant (Hénon, 1961), where is the ‘Jacobi’ or tidal radius. As a result, the cluster shrinks as while it loses mass, and it only has a large for a limited time (few Gyr). The cluster in the cored galaxy also expands, but Gyr the star cluster evolves at roughly constant and constant . This is because the escape rate is very small in compressive tides, and the cluster evolves towards a near isothermal equilibrium configuration, in which the cluster is in virial equilibrium with the tides (Yoon, Lee, & Hong 2011; Bianchini et al. 2015; Webb, Patel, & Vesperini 2017). This implies that it is more likely to find a cluster in this phase, because it can be in this quasi-equilibrium configuration for a long time (Gyr). The asymptotic value of of the cluster in the cored galaxy is in excellent agreement with the data for Eri II’s star cluster (red shaded region). We note that in our -body model the cluster density within evolves to approximately the same value as the (uniform) DM density, hence the cluster density is literally probing the DM density.
3.3 Predicted cluster number density profiles
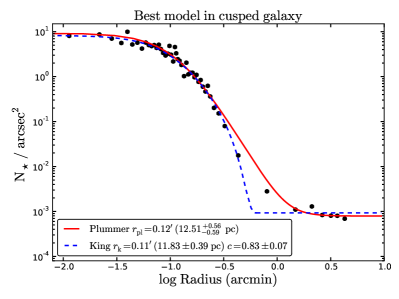

Fig. 8 shows the stellar number density profiles of the best-fit models in the cusped (left) and cored (right) case. Crnojević et al. (2016) find the structural parameters of Eri II’s star cluster by fitting a Sersic profile to its surface brightness as measured from integrated photometry. It is possible to similarly derive a surface brightness profile from the -body simulations, however it proved challenging to directly compare the models to the data. Analysing the image from (Crnojević et al., 2016), we found that the result is very sensitive to the number of bins used, the subtraction of background sources and which bright stars are masked – all of which can change the result of the fitting. Therefore, for our analysis we used a different approach in which the data from the -body models are not binned. We used only bright stars (massive stars) that are observable. In our case, we chose only stars that are more massive than 999This mass limit was derived from the observational limit reported in Crnojević et al. (2016) using parsec’s isochrones v1.2S (Bressan et al., 2012).. Furthermore, we included the background stars using the number density profile of Eri II reported in (Bechtol et al., 2015), assuming that the stars are uniformly distributed in our simulated field of view.
As can be seen in Fig. 8, a star cluster that evolves in a DM cusp has a different density profile than a star cluster that evolves in a DM core. In the cored galaxy, clusters have a lower concentration parameter, , compared to the cluster in the cusped galaxy (). Here , where is the truncation radius and is the King/core radius. This means that the core of the cluster is larger (for a given ) if it evolves in a DM core. From deeper imaging, it may be possible to derive the projected density profile of the cluster, allowing for a better comparison with our -body simulations.
3.4 The effect of varying the mass, concentration and central logarithmic cusp slope of Eri II’s DM halo
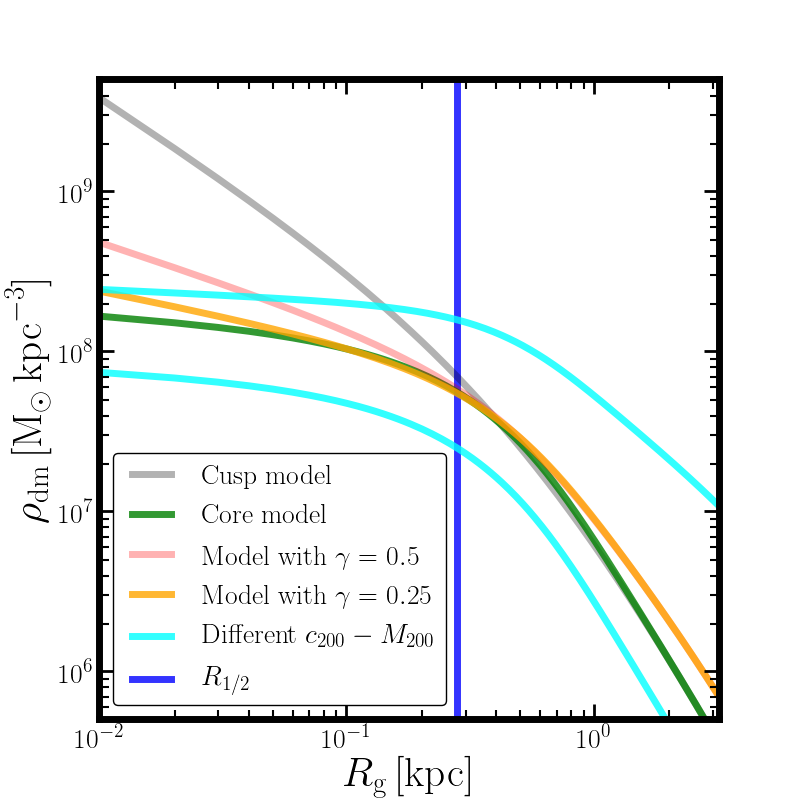
In §2.2, we showed that for dark matter halos that lie on the relation, large changes in produce only a small change in their inner dark matter density. Here, we test whether we are able to detect such small changes to obtain a constraint on from the survival and properties of Eri II’s star cluster alone. To test this, we performed an additional ten simulations varying over the range . (The upper limit of this range is already ruled out by the stellar kinematic measurements for Eri II (Li et al., 2017), but serves to test our sensitivity to .) These models are shown by the cyan lines in Figure 9.
As anticipated in §2.2, we found that we are not sensitive to even large changes in and so long as our Eri II DM halo has a central DM core. By selecting an appropriate , and , we were able in all cases to reproduce the observations within , similarly to the right panel of Fig. 7.
We then tested our sensitivity to the inner logarithmic DM density slope at a fixed DM halo mass of , with a concentration set by the relation from Dutton & Macciò (2014). We explored two coreNFW models with and , corresponding to Dehnen models (see equation 1) with and , respectively. These models are shown by the orange and pink lines in Figure 9. We found that, with an inner density slope of , we were still able to find star clusters that survive for longer than and reproduce the observations within , in good agreement with recent results from Amorisco (2017). For the galaxy with , only one cluster (with kpc, pc and ) survived for more than . However, this cluster gave a poor match to Eri II’s star cluster since its expanded up to pc and then shrank as the cluster’s orbit decayed to the centre of the galaxy. A larger inner density profile slope means a smaller tidal radius for the star cluster and, thus – all other parameters being equal – a shorter dissolution time.
3.5 A nuclear star cluster in Eri II?
Eri II’s star cluster is offset from the photometric centre of Eri II by pc (Crnojević et al., 2016). However, given the uncertainties on the photometric centre of Eri II, we consider here the possibility that Eri II’s star cluster is in fact a nuclear star cluster, defining the centre of the galaxy. A star cluster at the centre of a galactic potential will expand due to two-body relaxation, but without the limiting tidal field. Thus, in a cusped galaxy, a cluster that is tidally destroyed close to the centre of the galaxy (for example, the clusters in the cusped models with kpc; see §3.2) may still survive if placed at kpc. As pointed out by Amorisco (2017), this could provide a route to Eri II having a DM cusp without destroying its low density star cluster. To test this, we run six additional simulations of a star cluster with 25,000 and pc, set up to lie at the centre101010We set up these star clusters as Plummer spheres embedded self-consistently in their host Dehnen dark matter halos, using the mkspherical program from the agama framework (https://github.com/GalacticDynamics-Oxford/Agama; Vasilev, in prep.; see Vasiliev, 2017, for another application of th4541241is method). of the cored and cusped Eri II DM halos described in §2.2.
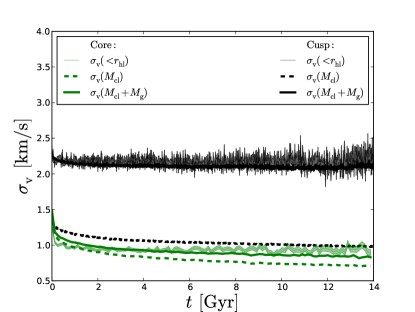
In Fig. 10, we show the evolution of 111111This is derived by multiplying of the observable stars (defined as being only those stars more massive than and excluding any dark remnants) by to correct for projection effects. for these simulations in a cored (green lines) and a cusped (black lines) DM halo. In the cusped case, for , does not expand because the cluster is mainly dark matter dominated and so the cluster stars trace the underlying dark matter potential. If Eri II’s star cluster formed in the centre of Eri II, it must have formed with a size similar to that observed today, but with almost double its current mass121212A cluster in the centre of a cusped galaxy loses mass mainly due to stellar evolution.. In Fig. 11, we show the velocity dispersion , estimated for observable stars within , for the simulations with in a cusped (black lines) and cored (green lines) galaxy. In the -body simulations, both and the mass of the galaxy () within are known. Thus, using the ‘Jeans estimator’ formula from Walker et al. (2009), we can estimate the due to (; dashed lines), and due to the combined mass of the cluster and the galaxy (; solid lines). From this, we conclude that if Eri II has a DM cusp and hosts a nuclear star cluster, then its star cluster will be DM dominated, with a velocity dispersion131313Note that none of the clusters in our cusped simulations have a large enough to be consistent with observations (see Fig. 10). However, in a DM cusp, the enclosed mass goes as and so . Thus, increasing the size of the cluster will increase , which is why our results provide a lower bound on the dispersion. . By contrast, if Eri II has a DM core, its star cluster will have a much lower dispersion of . These results are in good agreement with Amorisco (2017).
Although we have found viable models where Eri II’s star cluster sits at the very centre of a dense DM cusp, we emphasise that – even without a measurement of – we disfavour these. Firstly, Eri II’s star cluster is observed to be clearly offset from the photometric light centre of Eri II. Secondly, our cored model in §3.1 naturally reproduces Eri II’s star cluster properties without any fine tuning. If Eri II’s star cluster sits at the centre of a dense DM cusp, then its properties must be set by its birth properties, requiring more fine tuning than for the cored case.
4 Discussion
Our key result is that we favour a DM core over a cusp in the ultra-faint dwarf galaxy Eri II. In models with a DM cusp, Eri II’s star cluster is rapidly destroyed by tides, whereas in cored models the star cluster survives for more than a Hubble time, naturally reaching an asymptotic size and mass consistent with observations. We found that this occurs for logarithmic DM cusp slopes shallower than , where is the central exponent in the Dehnen profile (equation 1), independently of large changes in the assumed DM halo mass or concentration. The only hope for retaining a DM cusp in Eri II is if its star cluster lies at the very centre of the cusp. We found that such a model can work, but is disfavoured by the observed offset between Eri II’s photometric light peak and the projected position of its star cluster. Such a model could be completely ruled out if the velocity dispersion of Eri II’s star cluster is observed to be . These results are in excellent agreement with a recent study by Amorisco (2017).
Our mass model for Eri II has a DM core size set by the projected half light radius of the stars kpc (see Fig. 2). However, the data only require that there is a dark matter core where we see Eri II’s star cluster today, at a projected distance of 45 pc from the photometric centre of Eri II. Dynamical friction stalling occurs when the tidal radius of the star cluster approximately matches its galactocentric distance (Read et al., 2006a; Goerdt et al., 2010; Petts et al., 2015, 2016). From this, we can derive a minimum DM core size for Eri II of pc. In this section, we explore what such a dark matter core means for galaxy formation and the nature of DM.
4.1 Dark matter heating
The size and density of the DM core we find in Eri II is in excellent agreement with predictions from the ‘DM heating’ model of R16. However, in the R16 model such a complete DM core would require several Gyrs of star formation that may be inconsistent with Eri II’s stellar population (see §1). However, core formation can be made more efficient if it occurs at high redshift when Eri II’s DM halo was less massive (Madau et al., 2014), or if it owes primarily to angular momentum transfer from cold gas clumps sinking by dynamical friction to the centre of the dwarf (El-Zant et al., 2001; Nipoti & Binney, 2015). Given these complications, following Peñarrubia et al. (2012), R16 and Read et al. (2017), we focus here on the energy required to unbind Eri II’s dark matter cusp:
| (6) |
where is the total integrated supernova energy, is the energy required to unbind the dark matter cusp, is the stellar mass, is the mean stellar mass, is the fraction of mass in stars that go supernova (i.e. those with mass ), and is the coupling efficiency of the SNe energy to the dark matter. We assume a Chabrier initial stellar mass function over the stellar mass range (Chabrier, 2003). We assume a coreNFW profile when calculating and we take from the simulations in R16. As such, our results are only useful in assessing, at an order-of-magnitude level, whether there is sufficient supernova energy in Eri II’s stellar population to form its apparent central DM core (e.g. Maxwell et al., 2015).
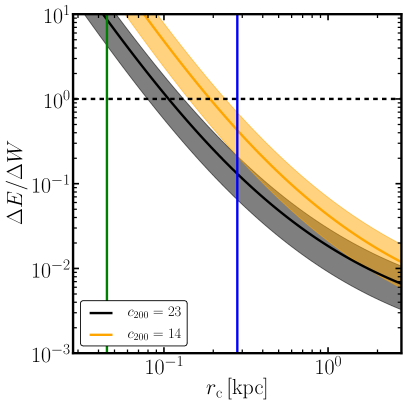
In Fig. 12, we plot as a function of the DM core size . The horizontal dashed line marks . Above this line, there is enough integrated supernova energy to unbind the cusp; below there is insufficient energy. The vertical green line marks the minimum core size, pc set by the current projected position of Eri II’s star cluster. The vertical blue line marks the core size assumed in this work, kpc. The black and orange shaded regions assume a DM halo mass of with a stellar mass (Bechtol et al., 2015, assuming three times their uncertainties), and a concentration parameter of and , respectively. These are the upper and lower 68% confidence intervals of in CDM (Dutton & Macciò, 2014). (Note that the R16 simulations assume the upper envelope of this range and so make core formation maximally difficult.)
As can be seen in Fig. 12, there is plenty of energy to produce the minimum core size pc independently of the assumed or . However, for the assumed DM halo mass and supernova energy coupling efficiency that we assume here, a low and high for Eri II are required to produce a core as large as kpc.
Although the R16 models are able to produce a DM core in Eri II, most other simulations in the literature to date do not find DM cores in halos below (e.g. Oñorbe et al. 2015; Chan et al. 2015; Tollet et al. 2016, but see Madau et al. 2014). We can understand the origin of this discrepancy from Fig. 1. As can be seen, the R16 simulations (magenta squares) produce a similar total stellar mass to the Chan et al. (2015) (yellow squares) and Wang et al. (2015) (green squares) simulations but in halos an order of magnitude lower in mass. (Note that the Wang et al. (2015) simulations are the same as those discussed in Tollet et al. (2016).) This is why cusp-core transformations in the R16 simulations are energetically feasible. The simulations that find no cores below form almost no stars below this mass scale and so do not have enough integrated supernova energy to unbind the dark matter cusp (see also the discussion in Read et al. 2017). Understanding this apparent discrepancy between the data and simulations in Fig. 1, and the differences between numerical models, remains an open and important problem.
If Eri II is found to have a purely old stellar population, with too few supernovae to provide the energy required to unbind its cusp, then we may be forced to move to models beyond CDM. We consider some of these, next.
4.2 Beyond CDM
The small scale puzzles in CDM (see §1) have motivated the community to consider alternative models. Some of these can solve the cusp-core problem without recourse to baryonic ‘DM heating’. The most popular of these to date is Self-Interacting Dark Matter (SIDM; Spergel & Steinhardt 2000). The latest SIDM models have a velocity-dependent interaction cross section , where is the dark matter interaction cross section, is the mass of the dark matter particle and is a velocity scale (e.g. Kaplinghat et al., 2016; Schneider et al., 2017). This is required for the models to be consistent with constraints from weak lensing on galaxy cluster scales that favour (e.g. Harvey et al., 2015), while maintaining a much higher required to produce large DM cores in nearby gas rich dwarf galaxies (e.g. Kaplinghat et al., 2016).
Since our focus here is on one low-mass dwarf, we consider instead a simple velocity independent SIDM model. Following Schneider et al. (2017), the velocity independent interaction cross section can be written as:
| (7) |
where is the coreNFW DM core size (R16), is the initial DM density at , Gyr-1 is the SIDM interaction rate (taken from coreNFW fits to numerical simulations in SIDM; Schneider et al. 2017) and:
| (8) |
is the velocity dispersion of the DM at (assuming that this model is isotropic). Using pc, we find which is consistent with all known SIDM constraints to date.
Another model that could explain Eri II is ultra-light axions (e.g. González-Morales et al. (2017) and references therein). Assuming an ultra-light axion mass of , we obtain for our Eri II halo model, which is consistent with our minimum core size pc.
Therefore, alternative DM models such as SIDM and ultra-light axions can produce a core in the ultra-faint Eri II dwarf galaxy.
4.3 Implications of the initial cluster properties
The initial mass of the star cluster in the cored galaxy () suggests that this star cluster resembled a young massive cluster, similar to those we see in the disc of the Milky Way (e.g. Arches, Westerlund 1, NGC 3603). The initial radius () is relatively large compared to these low redshift analogues, which have typical radii of a few pc (Portegies Zwart et al., 2010). We note that the model with pc expands up to and fits the data reasonably well. Our models did not include primordial mass segregation in the cluster initial conditions. If we had assumed that the massive stars formed more towards the centre of the cluster, it would have expanded more as a result of stellar mass loss (e.g. Zonoozi et al., 2017), allowing for more compact initial conditions. The present day mass of stars and stellar remnants that once belonged to the cluster is , or of the total stellar mass in Eri II. Such a high cluster formation efficiency has been reported in other dwarf galaxies when considering metal-poor stars only (Larsen et al., 2014).
4.4 Comparison with other work in the literature
Concurrent with our work, Amorisco (2017) have recently modelled Eri II’s central star cluster sinking under dynamical friction, finding that it cannot survive long in a cusped potential, in good agreement with our results here (They also report similar results for the star cluster in Andromeda XXV.) The key difference between our studies is that we model the internal structure of Eri II’s star cluster, accounting for two-body relaxation and stellar evolution, for the first time. Amorisco (2017) used a collisionless -body code which cannot capture two-body relaxation effects that drive the expansion of the cluster over time141414Amorisco (2017) argue that collisional effects can be ignored in extended and faint star clusters. However, this depends on the assumed initial conditions for the cluster. The initial half-mass relaxation time (Spitzer, 1987) of our best-fit cluster model is Gyr, computed assuming (Giersz & Heggie, 1996). Since the cluster is older than this, two-body relaxation was important during the evolution of this cluster.. The key advantage of modelling the collisional effects in Eri II’s star cluster is that its final mass and size then depend on the local tidal field and, therefore, on the mass distribution at the centre of Eri II. This gives us an additional probe of the central dark matter density profile in Eri II that goes beyond a survival argument.
5 Conclusions
We have presented a new method for probing the central dark matter density in dwarf galaxies using star clusters. Low-mass star clusters orbiting in the tidal field of a larger host galaxy are expected to reach an equilibrium size due to relaxation-driven expansion and the tidal pruning of high-energy escaper stars. We have used the nbody6df collisional -body code, which includes stellar evolution and dynamical friction, to show that this is indeed the case. As a first application, we have applied our method to the recently discovered ultra-faint dwarf, Eri II. This has a lone star cluster that lies some pc from its centre in projection. Using a suite of 226 full -body simulations of the star cluster, we showed that models with a central dark matter core (with an inner logarithmic density slope of ) are favoured over those with a dark matter cusp. A DM core naturally reproduces the size and the projected position of Eri II’s star cluster. By contrast, dense cusped galaxy models require the cluster to lie implausibly far from the centre of Eri II (), with a high inclination orbit () that must be observed at a special orbital phase (<3 per cent of the orbital period).
Our models make several clear predictions that can be tested with deeper observations. If Eri II is cored, then:
-
•
the cluster can have any age older than (as compared to a narrow age range of Gyr in the cusped case);
-
•
there are no tidal tails associated with the cluster;
-
•
the cluster has a low concentration ( as compared to in the cusped case).
We also considered the possibility that Eri II’s star cluster lies at the very centre of a DM cusp, allowing it to survive tidal disruption. This is already disfavoured by the observed offset between Eri II’s photometric light peak and the projected position of its star cluster. However, such a model could be completely ruled out if the velocity dispersion of Eri II’s star cluster is found to be .
We have shown that extended faint star clusters can survive at the centres of dwarf galaxies with DM cores. Such faint star clusters could be liberated from their host dwarf galaxy by Galactic tides that act more efficiently on cored dwarfs (e.g. Read et al., 2006b; Peñarrubia et al., 2010), providing an explanation for some of the recently discovered ultra-faint objects found in the Milky Way (for a discussion see Contenta et al., 2017).
The presence of a DM core in the ultra-faint dwarf galaxy Eri II implies that either its CDM cusp was ‘heated up’ by bursty star formation, or we are seeing an evidence for physics beyond CDM.
Acknowledgments
Support for this work was provided by the European Research Council (ERC-StG-335936, CLUSTERS). MG acknowledges financial support from the Royal Society in the form of a University Research Fellowship (URF) and an equipment grant used for the GPU cluster in Surrey. JIR would like to acknowledge support from STFC consolidated grant ST/M000990/1 and the MERAC foundation. We thank Josh D. Simon for the insightful discussions about the interpretation of the HST photometry, Denija Crnojevic for the image of Eri II, and the referee for comments and suggestions. We are grateful to Sverre Aarseth and Keigo Nitadori for making nbody6 publicly available, and to Dan Foreman-Mackey for providing the emcee software and for maintaining the online documentation; we also thank Mr David Munro of the University of Surrey for hardware and software support. The analyses done for this paper made use of scipy (Jones et al., 2001), numpy (van der Walt et al., 2011) and matplotlib (Hunter, 2007).
References
- Aarseth (1999) Aarseth S. J., 1999, PASP, 111, 1333
- Aarseth (2003) Aarseth S. J., 2003, Gravitational N-Body Simulations. Cambridge University Press, November 2003.
- Agnello & Evans (2012) Agnello A., Evans N. W., 2012, ApJ, 754, L39
- Ahmad & Cohen (1973) Ahmad A., Cohen L., 1973, Journal of Computational Physics, 12, 389
- Amorisco (2017) Amorisco N. C., 2017, ApJ, 844, 64
- Battaglia et al. (2008) Battaglia G., Helmi A., Tolstoy E., Irwin M., Hill V., Jablonka P., 2008, ApJ, 681, L13
- Bechtol et al. (2015) Bechtol K., Drlica-Wagner A., Balbinot E., Pieres A., Simon J. D., Yanny B., Santiago B., The DES Collaboration, 2015, ApJ, 807, 50
- Belokurov et al. (2007) Belokurov V. et al., 2007, ApJ, 654, 897
- Bianchini et al. (2015) Bianchini P., Renaud F., Gieles M., Varri A. L., 2015, MNRAS, 447, L40
- Breddels & Helmi (2013) Breddels M. A., Helmi A., 2013, A&A, 558, A35
- Bressan et al. (2012) Bressan A., Marigo P., Girardi L., Salasnich B., Dal Cero C., Rubele S., Nanni A., 2012, MNRAS, 427, 127
- Chabrier (2003) Chabrier G., 2003, ApJ, 586, L133
- Chan et al. (2015) Chan T. K., Kereš D., Oñorbe J., Hopkins P. F., Muratov A. L., Faucher-Giguère C.-A., Quataert E., 2015, MNRAS, 454, 2981
- Claydon et al. (2017) Claydon I., Gieles M., Zocchi A., 2017, MNRAS, 466, 3937
- Cole et al. (2012) Cole D. R., Dehnen W., Read J. I., Wilkinson M. I., 2012, MNRAS, 426, 601
- Collins et al. (2014) Collins M. L. M. et al., 2014, ApJ, 783, 7
- Contenta et al. (2017) Contenta F., Gieles M., Balbinot E., Collins M. L. M., 2017, MNRAS, 466, 1741
- Crnojević et al. (2016) Crnojević D., Sand D. J., Zaritsky D., Spekkens K., Willman B., Hargis J. R., 2016, ApJ, 824, L14
- de Boer et al. (2012) de Boer T. J. L. et al., 2012, A&A, 544, A73
- Dehnen (1993) Dehnen W., 1993, MNRAS, 265, 250
- Di Cintio et al. (2014) Di Cintio A., Brook C. B., Dutton A. A., Macciò A. V., Stinson G. S., Knebe A., 2014, MNRAS, 441, 2986
- Dubinski & Carlberg (1991) Dubinski J., Carlberg R. G., 1991, ApJ, 378, 496
- Dutton & Macciò (2014) Dutton A. A., Macciò A. V., 2014, MNRAS, 441, 3359
- El-Zant et al. (2001) El-Zant A., Shlosman I., Hoffman Y., 2001, ApJ, 560, 636
- Evans et al. (2009) Evans N. W., An J., Walker M. G., 2009, MNRAS, 393, L50
- Fitts et al. (2017) Fitts A. et al., 2017, MNRAS, 471, 3547
- Flores & Primack (1994) Flores R. A., Primack J. R., 1994, ApJ, 427, L1
- Foreman-Mackey et al. (2013) Foreman-Mackey D., Hogg D. W., Lang D., Goodman J., 2013, PASP, 125, 306
- Gieles et al. (2010) Gieles M., Baumgardt H., Heggie D. C., Lamers H. J. G. L. M., 2010, MNRAS, 408, L16
- Gieles et al. (2011) Gieles M., Heggie D. C., Zhao H., 2011, MNRAS, 413, 2509
- Gieles & Zocchi (2015) Gieles M., Zocchi A., 2015, MNRAS, 454, 576
- Giersz & Heggie (1996) Giersz M., Heggie D. C., 1996, MNRAS, 279, 1037
- Giersz & Heggie (1997) Giersz M., Heggie D. C., 1997, MNRAS, 286, 709
- Goerdt et al. (2010) Goerdt T., Moore B., Read J. I., Stadel J., 2010, APJ, 725, 1707
- Goerdt et al. (2006) Goerdt T., Moore B., Read J. I., Stadel J., Zemp M., 2006, MNRAS, 368, 1073
- González-Morales et al. (2017) González-Morales A. X., Marsh D. J. E., Peñarrubia J., Ureña-López L. A., 2017, MNRAS, 472, 1346
- Governato et al. (2010) Governato F. et al., 2010, Nature, 463, 203
- Harris (1996) Harris W. E., 1996, AJ, 112, 1487
- Harvey et al. (2015) Harvey D., Massey R., Kitching T., Taylor A., Tittley E., 2015, Science, 347, 1462
- Hénon (1961) Hénon M., 1961, Annales d’Astrophysique, 24, 369; English translation: ArXiv:1103.3499
- Hénon (1965) Hénon M., 1965, Ann. Astrophys, 28, 62; translation: ArXiv:1103.3498 (H65)
- Hernandez & Gilmore (1998) Hernandez X., Gilmore G., 1998, MNRAS, 297, 517
- Hunter (2007) Hunter J. D., 2007, Matplotlib: A 2D Graphics Environment. [Online; accessed 2016-07-21]
- Hurley et al. (2000) Hurley J. R., Pols O. R., Tout C. A., 2000, MNRAS, 315, 543
- Hurley et al. (2002) Hurley J. R., Tout C. A., Pols O. R., 2002, MNRAS, 329, 897
- Innanen et al. (1983) Innanen K. A., Harris W. E., Webbink R. F., 1983, AJ, 88, 338
- Inoue (2009) Inoue S., 2009, MNRAS, 397, 709
- Inoue (2011) Inoue S., 2011, MNRAS, 416, 1181
- Jethwa et al. (2018) Jethwa P., Erkal D., Belokurov V., 2018, MNRAS, 473, 2060
- Jones et al. (2001) Jones E., Oliphant T., Peterson P., et al., 2001, SciPy: Open source scientific tools for Python. [Online; accessed 2016-07-21]
- Kaplinghat et al. (2016) Kaplinghat M., Tulin S., Yu H.-B., 2016, Physical Review Letters, 116, 041302
- King (1962) King I., 1962, AJ, 67, 471
- King (1966) King I. R., 1966, AJ, 71, 64
- Klypin et al. (1999) Klypin A., Kravtsov A. V., Valenzuela O., Prada F., 1999, ApJ, 522, 82
- Koposov et al. (2015) Koposov S. E., Belokurov V., Torrealba G., Evans N. W., 2015, ApJ, 805, 130
- Kroupa (2001) Kroupa P., 2001, MNRAS, 322, 231
- Küpper et al. (2010) Küpper A. H. W., Kroupa P., Baumgardt H., Heggie D. C., 2010, MNRAS, 407, 2241
- Larsen et al. (2014) Larsen S. S., Brodie J. P., Forbes D. A., Strader J., 2014, A&A, 565, A98
- Larsen et al. (2012) Larsen S. S., Strader J., Brodie J. P., 2012, A&A, 544, L14
- Li et al. (2017) Li T. S. et al., 2017, ApJ, 838, 8
- Macciò et al. (2007) Macciò A. V., Dutton A. A., van den Bosch F. C., Moore B., Potter D., Stadel J., 2007, MNRAS, 378, 55
- Madau et al. (2014) Madau P., Shen S., Governato F., 2014, ApJ, 789, L17
- Makino & Aarseth (1992) Makino J., Aarseth S. J., 1992, PASJ, 44, 141
- Martin et al. (2008) Martin N. F., de Jong J. T. A., Rix H.-W., 2008, ApJ, 684, 1075
- Mashchenko et al. (2008) Mashchenko S., Wadsley J., Couchman H. M. P., 2008, Science, 319, 174
- Maxwell et al. (2015) Maxwell A. J., Wadsley J., Couchman H. M. P., 2015, ApJ, 806, 229
- McConnachie (2012) McConnachie A. W., 2012, AJ, 144, 4
- McLaughlin & van der Marel (2005) McLaughlin D. E., van der Marel R. P., 2005, ApJS, 161, 304
- Merrifield & Kent (1990) Merrifield M. R., Kent S. M., 1990, AJ, 99, 1548
- Moore (1994) Moore B., 1994, Nature, 370, 629
- Moore et al. (1999) Moore B., Ghigna S., Governato F., Lake G., Quinn T., Stadel J., Tozzi P., 1999, ApJ, 524, L19
- Munshi et al. (2017) Munshi F., Brooks A. M., Applebaum E., Weisz D. R., Governato F., Quinn T. R., 2017, ArXiv e-prints
- Navarro et al. (1996a) Navarro J. F., Eke V. R., Frenk C. S., 1996a, MNRAS, 283, L72
- Navarro et al. (1996b) Navarro J. F., Frenk C. S., White S. D. M., 1996b, ApJ, 462, 563
- Nipoti & Binney (2015) Nipoti C., Binney J., 2015, MNRAS, 446, 1820
- Nitadori & Aarseth (2012) Nitadori K., Aarseth S. J., 2012, MNRAS, 424, 545
- Oñorbe et al. (2015) Oñorbe J., Boylan-Kolchin M., Bullock J. S., Hopkins P. F., Kereš D., Faucher-Giguère C.-A., Quataert E., Murray N., 2015, MNRAS, 454, 2092
- Peñarrubia et al. (2010) Peñarrubia J., Benson A. J., Walker M. G., Gilmore G., McConnachie A. W., Mayer L., 2010, MNRAS, 406, 1290
- Peñarrubia et al. (2012) Peñarrubia J., Pontzen A., Walker M. G., Koposov S. E., 2012, ApJ, 759, L42
- Peñarrubia et al. (2009) Peñarrubia J., Walker M. G., Gilmore G., 2009, MNRAS, 399, 1275
- Petts et al. (2015) Petts J. A., Gualandris A., Read J. I., 2015, MNRAS, 454, 3778
- Petts et al. (2016) Petts J. A., Read J. I., Gualandris A., 2016, MNRAS, 463, 858
- Planck Collaboration et al. (2014) Planck Collaboration et al., 2014, A&A, 571, A16
- Plummer (1911) Plummer H. C., 1911, MNRAS, 71, 460
- Pontzen & Governato (2012) Pontzen A., Governato F., 2012, MNRAS, 421, 3464
- Pontzen & Governato (2014) Pontzen A., Governato F., 2014, Nature, 506, 171
- Pontzen et al. (2015) Pontzen A., Read J. I., Teyssier R., Governato F., Gualandris A., Roth N., Devriendt J., 2015, MNRAS, 451, 1366
- Portegies Zwart et al. (2010) Portegies Zwart S. F., McMillan S. L. W., Gieles M., 2010, ARA&A, 48, 431
- Read et al. (2016) Read J. I., Agertz O., Collins M. L. M., 2016, MNRAS, 459, 2573
- Read & Gilmore (2005) Read J. I., Gilmore G., 2005, MNRAS, 356, 107
- Read et al. (2006a) Read J. I., Goerdt T., Moore B., Pontzen A. P., Stadel J., Lake G., 2006a, MNRAS, 373, 1451
- Read et al. (2017) Read J. I., Iorio G., Agertz O., Fraternali F., 2017, MNRAS
- Read & Steger (2017) Read J. I., Steger P., 2017, MNRAS, 471, 4541
- Read et al. (2006b) Read J. I., Wilkinson M. I., Evans N. W., Gilmore G., Kleyna J. T., 2006b, MNRAS, 367, 387
- Richardson & Fairbairn (2014) Richardson T., Fairbairn M., 2014, MNRAS, 441, 1584
- Sánchez-Salcedo et al. (2006) Sánchez-Salcedo F. J., Reyes-Iturbide J., Hernandez X., 2006, MNRAS, 370, 1829
- Sand et al. (2015) Sand D. J., Spekkens K., Crnojević D., Hargis J. R., Willman B., Strader J., Grillmair C. J., 2015, ApJ, 812, L13
- Santana et al. (2013) Santana F. A., Muñoz R. R., Geha M., Côté P., Stetson P., Simon J. D., Djorgovski S. G., 2013, ApJ, 774, 106
- Schive et al. (2014) Schive H.-Y., Liao M.-H., Woo T.-P., Wong S.-K., Chiueh T., Broadhurst T., Hwang W.-Y. P., 2014, Physical Review Letters, 113, 261302
- Schneider et al. (2017) Schneider A., Trujillo-Gomez S., Papastergis E., Reed D. S., Lake G., 2017, MNRAS, 470, 1542
- Spergel & Steinhardt (2000) Spergel D. N., Steinhardt P. J., 2000, Physical Review Letters, 84, 3760
- Spitzer (1987) Spitzer L., 1987, Dynamical evolution of globular clusters. Princeton Univ. Press, Princeton, NJ
- Tegmark & Zaldarriaga (2002) Tegmark M., Zaldarriaga M., 2002, Phys. Rev. D, 66, 103508
- Teyssier et al. (2013) Teyssier R., Pontzen A., Dubois Y., Read J. I., 2013, MNRAS, 429, 3068
- Tollet et al. (2016) Tollet E. et al., 2016, MNRAS, 456, 3542
- Ural et al. (2015) Ural U., Wilkinson M. I., Read J. I., Walker M. G., 2015, Nature Communications, 6, 7599
- van der Walt et al. (2011) van der Walt S., Colbert C. S., Varoquaux G., 2011, The NumPy Array: A Structure for Efficient Numerical Computation. [Online; accessed 2016-07-21]
- Vasiliev (2017) Vasiliev E., 2017, ApJ, 848, 10
- Walker et al. (2009) Walker M. G., Mateo M., Olszewski E. W., Peñarrubia J., Wyn Evans N., Gilmore G., 2009, ApJ, 704, 1274
- Walker & Peñarrubia (2011) Walker M. G., Peñarrubia J., 2011, ApJ, 742, 20
- Wang et al. (2015) Wang L., Dutton A. A., Stinson G. S., Macciò A. V., Penzo C., Kang X., Keller B. W., Wadsley J., 2015, MNRAS, 454, 83
- Webb et al. (2017) Webb J. J., Patel S. S., Vesperini E., 2017, MNRAS, 468, L92
- Wheeler et al. (2015) Wheeler C., Oñorbe J., Bullock J. S., Boylan-Kolchin M., Elbert O. D., Garrison-Kimmel S., Hopkins P. F., Kereš D., 2015, MNRAS, 453, 1305
- Wilks (1938) Wilks S. S., 1938, Ann. Math. Statist., 9, 60
- Yoon et al. (2011) Yoon I., Lee H. M., Hong J., 2011, MNRAS, 414, 2728
- Zonoozi et al. (2017) Zonoozi A. H., Haghi H., Kroupa P., Küpper A. H. W., Baumgardt H., 2017, MNRAS, 467, 758