Experimental study of the convection in a rotating tangent cylinder
Abstract
This paper experimentally investigates the convection in a rapidly rotating Tangent Cylinder (TC), for Ekman numbers down to . The apparatus consists of a hemispherical fluid vessel heated in its centre by a protruding heating element of cylindrical shape. The resulting convection that develops above the heater, i.e. within the TC, is shown to set in for critical Rayleigh numbers and wavenumbers respectively scaling as and with the Ekman number . Although exhibiting the same exponents as for plane rotating convection, these laws reflect much larger convective plumes at onset. The structure and dynamics of supercritical plumes are in fact closer to those found in solid rotating cylinders heated from below, suggesting that the confinement within the TC induced by the Taylor-Proudman constraint influences convection in a similar way as solid walls would do. There is a further similarity in that the critical modes in the TC all exhibit a slow retrograde precession at onset. In supercritical regimes, the precession evolves into a thermal wind with a complex structure featuring retrograde rotation at high latitude and either prograde or retrograde rotation at low latitude (close to the heater), depending on the criticality and the Ekman number. The intensity of the thermal wind measured by the Rossby number scales as with the Rayleigh number based on the heat flux . This scaling is in agreement with heuristic predictions and previous experiments where the thermal wind is determined by the azimuthal curl of the balance between the Coriolis force and buoyancy. Within the range which we explored, we also observe a transition in the heat transfer through the TC from a diffusivity-free regime where to a rotation-independent regime where .
keywords:
Rapidly rotating convection, Earth’s liquid core, Tangent Cylinder, Proudman-Taylor constraint, quasi-geostrophic flows.1 Introduction
This paper is concerned with convective flows confined in a cylindrical region by the action of the Taylor-Proudman (TP) constraint due to background rotation. Our prime motivation comes from the study of liquid planetary cores such as the Earth’s. The Earth’s interior is structured in layers around a solid inner core mostly made of iron (radius 1200 km), surrounded by a liquid core (external radius 3500 km) where iron dominates too. A rocky mantle occupies the region surrounding the liquid core up to the thin crust where tectonic plates assemble (see the sketch in Fig. 1). Because of the rapid rotation of the Earth (Ekman numbers down to ), the Taylor-Proudman (TP) constraint creates an imaginary boundary within the liquid core in the shape of a cylinder tangent to the solid inner core and extending up to the core–mantle boundary (CMB), which opposes exchange of fluid between regions inside and outside it. Consequently, the region inside the TC is subject to intense convection but also to an important effect of confinement of a different nature to that imposed by solid walls.
Until now, convection in TCs has been tackled from three different angles: linear stability, numerical simulations and experiments. Linear stability analyses mostly focused on the interplay between convection and rotation in plane geometries, where the TP constraint is absent. Early results presented in the monograph of Chandrasekhar (1961) showed that under the effect of increasing rotation, the critical Rayleigh number for the onset of convection increased as while convective cells became thinner, with their wavenumber increasing as (Here the Ekman number is based on the background speed of rotation , fluid viscosity and the height of the fluid layer ). A notable feature of plane rotating convection is that for a Prandtl number above a threshold value (0.677 for free-slip boundaries), the unstable mode at onset is stationary (see, e.g. Clune & Knoblauch, 1993). Other theoretical approaches treated spherical shell geometries, following the early study of Busse (1970) but since convection outside the TC sets in at much lower Rayleigh numbers than inside the TC (Jones, 2007), these studies mostly focused on that part of the core rather than the TC.

Numerical simulations in spherical shells provided key insights into
the global dynamics of the liquid core including the effect of the TP constraint,
even though none was specifically dedicated to the TC.
Aubert (2005) and
Christensen & Aubert (2006) showed that the heat flux
from the inner core boundary (ICB) to the CMB obeyed a somewhat universal scaling
of the form
when expressed in terms of the heat flux-based Rayleigh number and
rotation-normalised Nusselt number (see exact definitions in equations
(14,15)).
A similar result was obtained for the azimuthal thermal wind, which is driven by
latitudinal variations in the temperature perturbation
between regions inside and outside the
TC: its intensity measured by a Rossby number built on the root
mean square (rms) velocity scaled as
. This scaling is consistent with
the hypothesis of potential vorticity conservation in a geostrophic regime
(Cardin & Olson, 1994) which
translates into the very similar scaling of . These
scalings were obtained in dynamo simulations incorporating the full coupling
between buoyancy, rotation and electromagnetic effects. Nevertheless,
numerical simulations (Aubert, 2005)
showed that they remained valid with or without magnetic
field. This suggests that both the heat flux and the thermal wind are mostly
controlled by the amount of available buoyancy. While this amount may be
altered by electromagnetic effects, their influence becomes transparent when the
Rayleigh and Nusselt numbers are expressed in terms of the buoyancy itself.
These scalings mostly concern regimes where rotation is dominant, and depend
strongly on the level of supercriticality of convection, which controls the
level of inertia acting on the flow, as well as the relative importance of
rotation: where rotation does not dominate, the heat flux is expected to
scale as in classical convection as in the range
, depending on the values of and on whether
the thermal or kinetic boundary layer is thickest (Grossmann & Lohse, 2000).
According to Julien et al. (2012) and
Gastine et al. (2016), when rotation dominates, convection near the onset
is governed by a balance between viscous forces, buoyancy and Coriolis forces,
whereas in strongly supercritical regimes with fast rotation,
the diffusivity-free regime leads to a much steeper dependence of
, with a transition between these regimes
controlled by parameter .
The transition parameters between these regimes is not specific to the TC and the question
remains open as to whether they still stand when considering the dynamics of
the TC only.
Aurnou et al. (2003) used dye visualisation to analyse convection in
the only experiment dedicated to the TC to date. The authors identified
convective structures, labelled ”rim instabilities” that differ from those
expected in plane rotating convection. Despite some data scattering, the
authors suggest that the associated thermal wind was consistent with a scaling
of the form , where is the buoyancy flux.
Unlike the model of Cardin & Olson (1994), this scaling reflects
a balance between the Coriolis force and buoyancy
outside the geostrophic regime, where the excess buoyancy and the Rossby deformation radius
are set by the balance between Coriolis and buoyancy forces (Maxworthy & Narimousa, 1994).
Experiments
and numerical simulations in a configuration similar to the TC show that
this scaling is achieved in the steady state that follows the development of a
baroclinic instability at the rim of the cylinder (Jacobs & Ivey, 1998; Cui & Street, 2001).
However, a characterisation of the onset of rotating convection within the
TC is currently lacking and it is not clear how
convection is affected by the confinement induced by the TC.
Goldstein et al. (1993) and Zhong et al. (1993) provide an insight into the question of the confinement, in the configuration of a rotating cylinder bounded by solid walls. Linear stability analysis distinguishes slow and fast convective modes respectively localised near the centre and the lateral wall. Their occurrence depends on the aspect ratio of the cylinder, the rotation and the level of supercriticality. A precise prediction for the onset of the wall modes was later derived analytically by Zhang & Liao (2009). Importantly, in breaking translational symmetry, the presence of solid walls is shown to give rise to a retrograde (westward) precession at onset that always precludes the occurrence of the steady modes observed in plane geometry. Nevertheless, the precession frequencies at onset are much lower than those of oscillatory convection and the associated precessing motion resembles more the retrograde thermal wind found in planetary cores than the travelling waves found at low Prandtl number in plane rotating convection (Chandrasekhar (1961); Clune & Knoblauch (1993)). Indeed, in more supercritical regimes (typically 10 times critical), experiments by Zhong et al. (1993) showed that the precession progressively led to a large retrograde structure centred in the middle of the cylinder. More recent studies of convection in a rotating cylinder focused on the turbulent regime (Kunnen et al., 2010), the influence of the boundary layers (Kunnen et al., 2011), of temperature-dependent fluid properties (Horn & Shishkina, 2014). However, it is not clear to which extent the virtual boundaries of the TC influence the convection in the same way as the rigid boundaries of a real cylinder do; nor is it clear whether the findings of Goldstein et al. (1993) and Zhong et al. (1993), obtained for Ekman numbers of the order of extend to the much lower Ekman numbers.
The purpose of this paper is to experimentally analyse convection in a Tangent Cylinder at low but experimentally accessible Ekman numbers, in view of addressing the following questions:
-
1.
What are the critical conditions for the onset of convection?
-
2.
Do the critical modes follow the phenomenology observed in plane or cylindrical geometries? In particular, are these modes steady?
-
3.
What do these patterns evolve to in supercritical regimes?
-
4.
How are heat transfer across the TC and the thermal wind affected by the combined influence of rotation and confinement within the TC?
Our experiments rely on the Little Earth Experiment (LEE) facility which we designed to reproduce rotating magnetoconvection in a tangent cylinder configuration as relevant to Earth as possible (Aujogue et al., 2016). Nevertheless, all experiments reported in this paper were conducted in the absence of magnetic field. The layout of the paper is as follows: in section 2, we briefly describe LEE and the measurement techniques implemented in it. In section 3, we analyse convective patterns in order to answer questions (a), (b) and (c). Section 4 is dedicated to the characterisation of the heat flux and the thermal wind while section 5 seeks to assess the confinement effect induced by the TC.
2 Experimental set-up
Our experimental apparatus is discussed in detail in Aujogue et al. (2016). Its main features are summarised in figure 2. We used a hemispherical dome of inner diameter mm filled with water or sulphuric acid. At the centre of the dome, a cylindrical heater of height 18 mm and diameter mm protrudes into the dome. The cylindrical shape, with a horizontal heating surface, was chosen to ensure that the isothermal boundary follows an isobar when the fluid is at rest, as failure to observe this condition leads to spurious local baroclinic instabilities (Aurnou et al., 2003)’s. is the ratio of heater to dome radii. Hence the thickness of the liquid corresponds to the height of fluid above the heater at the centre of the dome mm. The heater provides an isothermal boundary condition at temperature on its upper surface and ensures an adiabatic boundary condition at its lateral boundary. These conditions are guaranteed by the materials the heater is made of: ceramic for the upper surface and polytetrafluoroethylene (PTFE) for the lateral boundary. Indeed, considering the heat flux through these materials ( and respectively), we obtained a ratio of
| (1) |
Therefore the flux through the lateral boundary can be neglected
with respect to the flux through the upper surface. The heater operates as a heat
exchanger fed at a constant flow rate by a heat-carrying fluid
(Ethylene-Glycol) whose temperature is controlled in the static frame,
so the heat flux delivered to the working fluid inside the dome
is obtained by measuring the temperature difference between the inlet
and the outlet of the heater. The ceramic the upper surface of the heater
is made of is SHAPAL, which has a thermal conductivity of W m-1 K-1.
The corresponding Biot number, as defined by Aurnou & Olson (2001) is
, which ensures a spatial temperature inhomogeneity of less
than 0.1% (see Aujogue et al. (2016)). The temperature is monitored during
each experimental run and exhibits no variations greater than the measuring
uncertainty. As a consequence, the boundary
condition can be considered as isothermal. Effectively, convection lowers the thermal resistance of the fluid layer by a factor , so that when , the homogeneity of the thermal boundary condition at the heating plate is better assessed by means of a modified Biot number . The maximum value of , we measured in all cases discussed in this paper was , so that never exceeded . This ensures that even with the most intense convection, the inhomogeneity in temperature distribution at the heater surface remained small.
The temperature at the outer surface of the dome is held constant
by immersing the whole system in a large volume of water. Overall, the temperature
difference driving convection is controlled to within
C and spans values within C.
The corresponding relative error on the Rayleigh number lies in the range
. Indeed, as the absolute error is constant the higher the temperature, the
lower is the relative error.
The entire set-up including, all PIV elements is rotated about the
vertical axis at angular velocity
rad s-1, by means of an electric
motor located approximately m below the floor of the
hemispherical fluid domain. Even though we shall focus on rotating convection
only in this paper, it must be kept in mind that the set-up was designed
to study both convection and magnetoconvection. Hence, this choice of
mechanical design, which allows us to operate the setup within the bore of
large resistive magnets whilst keeping the motor away from regions of high
magnetic fields.
This way we aim to reproduce a geometry relevant to the
Earth’s Tangent Cylinder.
The layout of the experiment is shown in figure 2.
The working fluids were either water or sulfuric acid ()
of mass concentration and
of respective densities and kg/m3,
viscosities and
m2/s, thermal diffusivities
and m2/s
at 20 ∘C. Water was chosen for ease of use, whereas sulfuric acid was chosen
as the transparent fluid with a high electric conductivity, for experiments in
high magnetic fields, which were conducted at the same time.
The range of parameters in which we operated the set-up is reported in
table 1. The dimensionless parameters controlling the flow
in the experiment are the Rayleigh number
(ratio of the buoyancy force to the viscous force),
the Ekman number (ratio of the viscous force to the Coriolis force),
the Prandtl number (ratio of viscous to thermal diffusivities).
We measure the flow velocity with a bespoke particle image velocimetry (PIV)
system in three distinct planes: one vertical plane aligned with a
dome’s diameter, and two horizontal planes positioned at m and
m above the surface of the heater (see figure 2).
In the former, we measure radial and axial velocities and
, where and are respectively the radial and axial
coordinates, whereas we measure radial and azimuthal velocities and in the latter two planes (Here and for the remainder of the paper,
we use cylindrical coordinates with the origin at the centre
of the heater’s upper circular surface). We used silver-coated particles of diameter m.
A 500 mW continuous LASER diode generates planes of mm
thickness and the images were acquired at frame per second with a
camera of resolution pixels. The corresponding spatial and temporal
resolutions are respectively seconds and mm. This system enabled us to measure velocities
within a range of m/s, with a relative error of on both velocity
components.
Temperatures are monitored in real time using 4 K-type thermocouples:
one is placed on the outer surface of the dome, one is embedded within
the top surface of the heater, and two respectively measure temperature
of the heat-carrying fluid at the heater’s inlet and outlet, thus
providing accurate monitoring of (with a precision of W/m2).
The rotating velocity is also monitored by means
of an optical sensor. The technological details of the set-up
and validation tests are available in Aujogue et al. (2016).
The experimental protocol consists of
first setting a rotation rate and waiting until the flow reaches a
solid body rotation (typically 30 min, verified by means
of PIV measurements with the heater off).
We then heat the heat-carrying fluid at a prescribed temperature,
until reaches a constant value. Only when the entire system has reached a
statistically steady thermal and mechanical state are the output of the
thermocouples and PIV data recorded.


| Control parameters | Water/ | Aurnou et al. (2003) | Earth core |
|---|---|---|---|
| – | – | ||
| – | – | ||
| 0.01–0.27 | 0.002–0.27 | ||
| [∘C] | [0.7-25] | ||
| [rad/s] | [-] | [-] | |
| [m] | 0.1 | 0.1 |
When rotating small devices, a centrifugal acceleration can arise. If it is large enough to compete with gravitational acceleration, the combined acceleration is not vertical anymore and the resulting convection patterns can be significantly altered. The Froude number represents the ratio of the centrifugal acceleration to gravitational acceleration. For , convection in a solid cylinder of aspect ratio 1 at and , (close to our configuration) is not significantly different to convection at : it sets in via a pitchfork bifurcation leading to the appearance of wall modes. then acts as a small imperfection parameter softening the bifurcation and slightly increases the critical Rayleigh number of every wall mode (Marques et al., 2007). These observations were confirmed in a cylinder of larger aspect ratio of 4 (Curbelo et al., 2014). For larger values of , there is no base conduction state anymore and a large axisymmetric circulation driven by the centrifugal force exists, that is stable to three-dimensional perturbations. Whilst is very small for planets, it is in the range in LEE. In this range, the convection is not expected to be structurally altered, and the centrifugal force may have a small stabilising influence on the onset of wall modes. In all experiments, we observed a steady base state without any evidence of the axisymmetric recirculation that would occur at higher Froude numbers, which confirms that the influence of centrifugal acceleration remained weak.
3 Structure of the convective patterns
3.1 Onset of convection
In this section, we focus on the flow near the onset of convection.
The combined effect of buoyancy and rotation generates a flow structured in
columns at the onset. This is illustrated by the contours of vertical velocity
obtained for different values of on Fig. 4. Note that the columns
are exclusively confined within the TC. This can be inferred
from the sharp drop of vertical velocity visible all along the TC boundary. It can also be
seen from the radial profiles of velocity in Figs. 12a and 12c.
It is noteworthy that the configuration of our experiment favours confinement within
the TC because (i) the heat flux is generated along the whole horizontal section of the TC and nowhere
outside it and (ii) gravity is always parallel to the TC boundary, unlike in the Earth
where they intersect. Hence, the buoyancy force never directly acts as to break the TP
constraint in LEE, unlike in the Earth. However, the small residual flow
outside the TC is further attenuated by an increase in background rotation (see fig
12a-12d). Conversely, qualitative experiments conducted without
rotation show very different picture where plumes take the entire space above the heater,
for the flow to return entirely outside of the would-be TC.
Considering the sharpness of the velocity
jump across the TC boundary, these elements give a good evidence that the confinement we
observe mainly results from TP contraint.
Columns become thinner at lower values of , a tendency that has been
previously observed both in spherical and plane
geometries
(Sreenivasan & Jones, 2006; Chandrasekhar, 1961; Aujogue et al., 2015).
On figure 3, we show that variations of the critical Rayleigh
number with follow a scaling of .
Despite a very different geometry, this scaling is in
good agreement with the theoretical prediction of for
rotating convection in an infinitely extended plane layer
(Chandrasekhar, 1961).
This result suggests that the critical Rayleigh number is not
measurably affected by the geometry differences between a plane and our TC
and reflects a very robust feature of plane rotating convection.
We shall now analyse the horizontal size of the convective structures present
at the onset. Since translational invariance in the horizontal plane is lost in
our geometry, we extract the horizontal size of convective structures
by seeking the separation corresponding to the first zero of the spatial
correlation function built from , and averaged over time and :
| (2) |
where represents the intersection of the meridional plane lit by the PIV laser and the region inside the TC. At the onset, the associated wavenumber can be compared to the critical wavenumber predicted for the onset of rotating convection in an infinite plane layer (Fig. 3). In the TC geometry, we find a scaling of
| (3) |
when the plane layer theory predicts (Aujogue et al., 2015). Although both structure sizes exhibit the same scaling exponent, critical wave numbers are significantly lower in the TC geometry than for the infinite plane layer. We shall see in section 3.2 that the reason for this discrepancy originates in the topological structure of the critical modes.
Lastly, a remarkable feature of the onset of rotating convection in plane
layers is that for the values of considered in this paper, linear stability
predicts a steady critical mode (Clune & Knoblauch, 1993). By contrast, in all our
measurements, we found a time-dependent flow at the onset. Inspection of the flow in horizontal
planes reveals that the convective plumes are subject to a slow retrograde
precession. The variations of the corresponding frequency derived
from the maximum velocity along in the horizontal plane
and normalised by the background angular frequency
are reported in figure 7.
The precession at the onset of convection and beyond has been studied
theoretically and experimentally in Goldstein et al. (1993) and
Zhong et al. (1993) in rigid rotating cylinders of various aspect ratios.
In these studies, the authors showed that the loss of translational
symmetry in the radial direction necessarily induced a precession in the
critical mode and that the corresponding frequency normalised by the
background rotation , obeyed a
scaling of the form .
Experiments by Ecke et al. (1992) determined a value of
for a radius-to-height aspect ratio of .
Our measurements produce a value of .
This value is close to that found by Ecke et al. (1992),
despite a lower aspect ratio
(measured at the centre of the heater) of .
The precession of convective structures at the onset in a cylindrical geometries is
normally associated with the onset of modes that are localised either at the centre of
the cylinder or near the wall, respectively centre modes and wall modes (Goldstein et al., 1993).
The values of the precessing frequencies and of we find point to wall modes rather than centre
modes (Ecke et al., 1992).
Nevertheless, in cylinders bounded by solid walls, the onset of wall modes normally takes places
at a lower Rayleigh number (denoted ) than the steady modes that ignites plane convection
for the same value of . Zhang & Liao (2009) provide an estimate for and the corresponding
azimuthal wavenumber , which are reported on Fig. 3 and expressed in our
notations and for the present configuration as
| (4) | |||||
| (5) |
The fact that in the TC, follows the scaling for plane convection rather than that
of wall modes is perhaps explained by the fact that unlike a solid wall,
the Taylor-Proudman constraint is absent when the fluid is at rest.
Wall modes would be expected to occur at a lower critical Rayleigh number than the onset of
plane convection. Since, however, no confinement exists at such Rayleigh numbers, the mechanism for
their onset is absent. On the other hand, as soon as convection starts, i.e. for Rayleigh
numbers close to those for which the plane layer would be unstable, the TP constraint becomes
active and selects modes that are closer to those observed in a cylinder than those observed between infinite planes.
Hence, the TP constraint may
not influence the flow right at the onset, but only once unstable structure have sufficiently
developped.
In summary, the study of critical Rayleigh, plume size, and precession
frequency shows that the onset of convection in a TC corresponds
to a hybrid behaviour between those of convection in an infinite plane layer
and in a rotating cylinder. Certainly, the scaling for the critical Rayleigh
number from the plane layer theory is reproduced in the TC but
size and time-dependence of the flow are to some extent more accurately described by the
phenomenology of convection in rigid rotating cylinders.


3.2 Supercritical flow patterns
We shall now explore the evolution of the patterns from the onset of convection
into the supercritical regime, focusing on two values of the Ekman number
and , for critical parameters
in the range –.
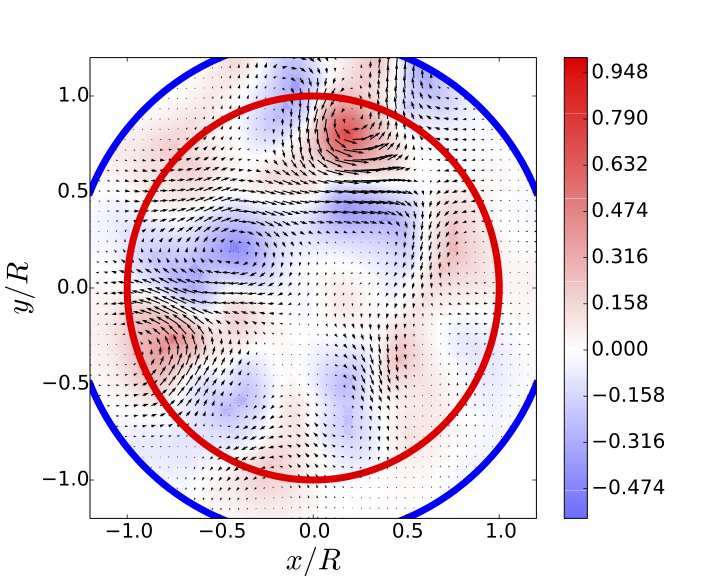
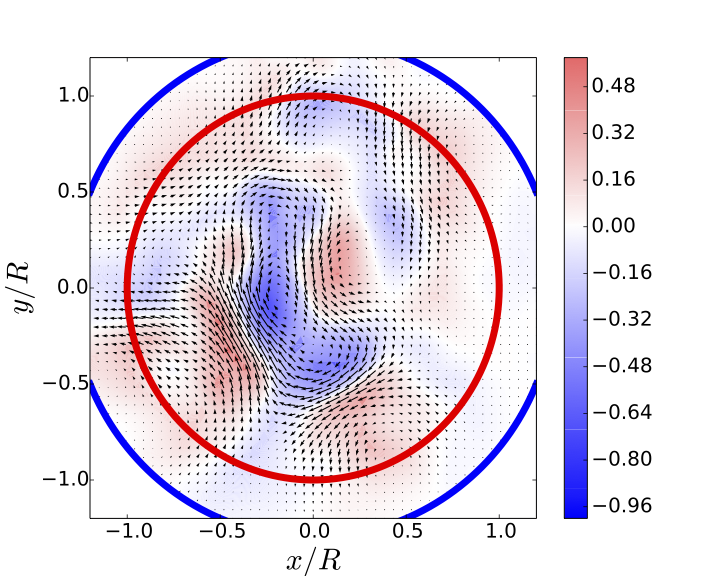
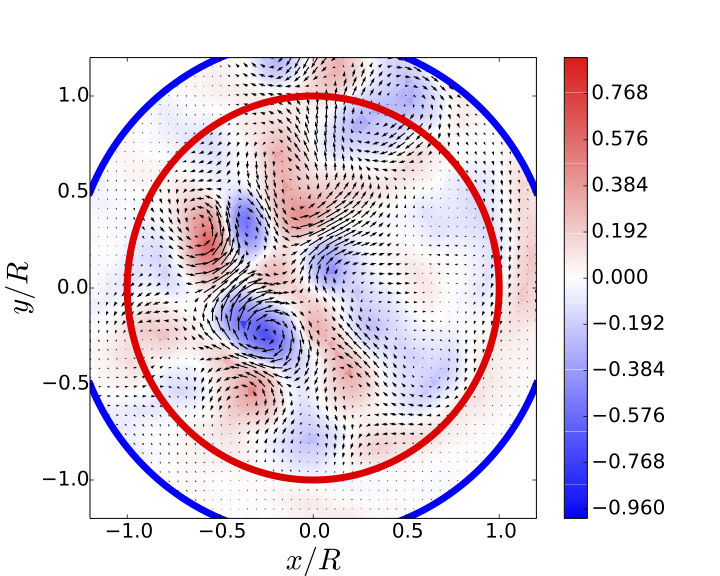
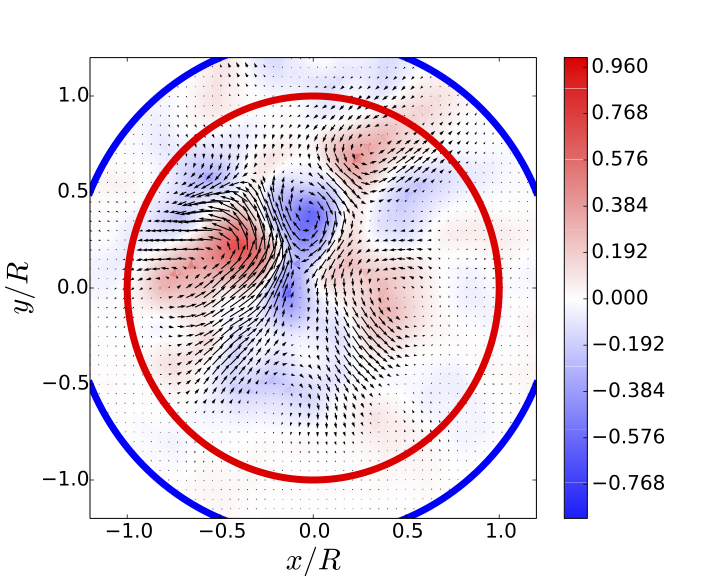
Figures 5a to 5f illustrate the
development of convective patterns for a criticality in the range
and .
Near the onset of convection (, figure 5a)
we observe a
behaviour found in the linear stability analysis performed by Goldstein et al. (1993) on a rapidly rotating
cylinder with non-slip boundary conditions at the top and bottom and adiabatic
boundary conditions on the side walls. In this study, the authors characterised
two different types of convective mode at onset, labelled fast and slow. The
fast modes correspond to motion at the edge of the cylinder. The slow modes
describe convective patterns localised at the centre of the cylinder.
Goldstein et al. (1993) also showed that the changeover between fast
and slow modes is strongly dependent on the aspect ratio of the cylinder. On
figure 5a, we observe a structure similar to a fast mode of
azimuthal wavenumber . For this wavenumber,
Goldstein et al. (1993) predicted that the fast
mode was the most unstable below an aspect ratio of
, a condition satisfied in the TC geometry of our experiment. Note, however that
the fast/wall mode structure is not as sharp as for higher levels of criticality. This is
in part due to the technical difficulty is accurately resolving the small velocity differences
near the onset. It may also reflect that the TC boundary exerts a somewhat weaker influence
near the onset than the solid walls of Goldstein et al. (1993)’s cylinder.
For (Fig. 5b), several columns are gathered around
the centre of the TC. These are reminiscent of structures which
Aurnou et al. (2003) call quasi-geostrophic modes, with the
difference that in their experiment, dye visualisations suggested that
they were forming on the outside of the TC.
When further increasing (; figure 5c),
we see an interaction between these centre modes
and ”wall modes” forming near the side boundary.
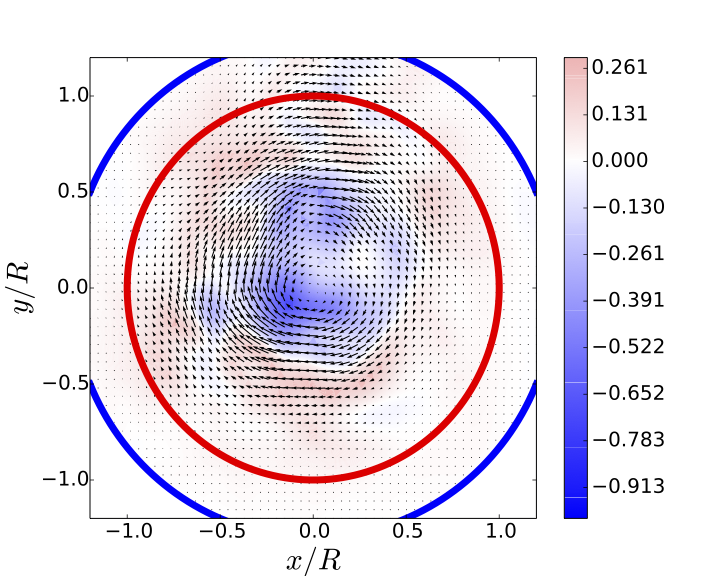
On figures 5d and 5e, we observe that for
the centre modes are merging into one larger structure, which
evolves into a large central, retrograde vortex in the last stage of the
convection observed in the experiment (figure 5f, ).
The evolution towards a central retrograde vortex for critical parameters
exceeding was also found by Zhong et al. (1993) in experiments
on convection in a rotating cylinder of aspect ratio (i.e. wider
than in the present case).
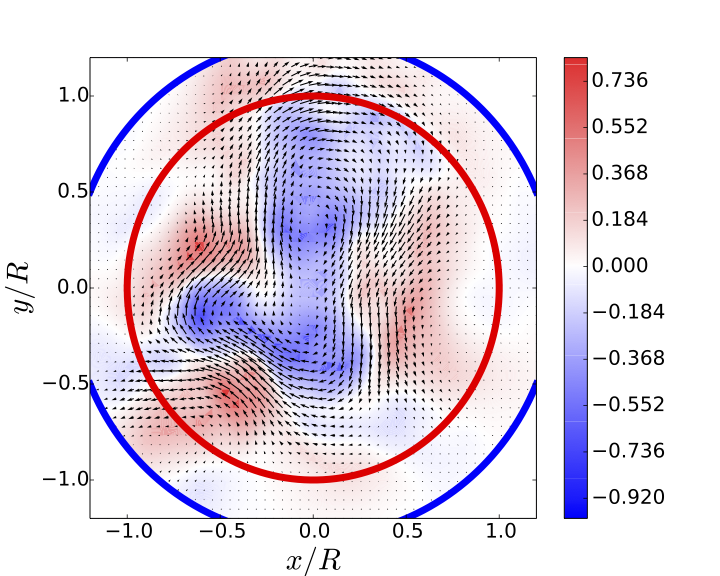
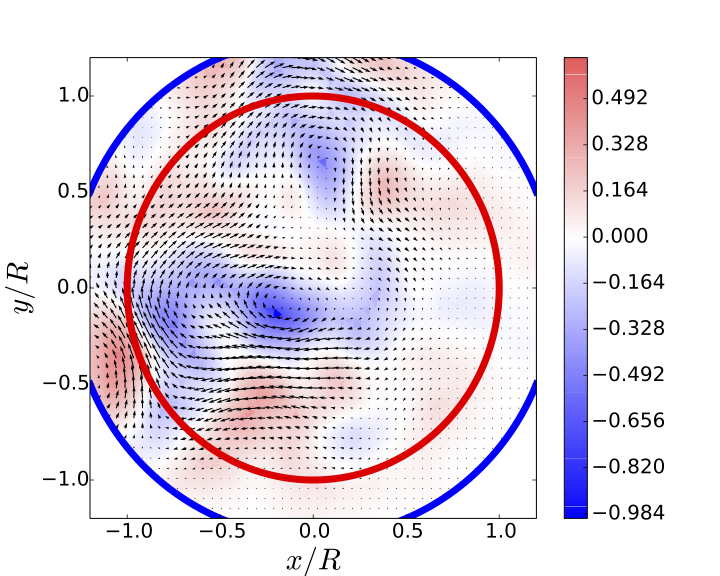
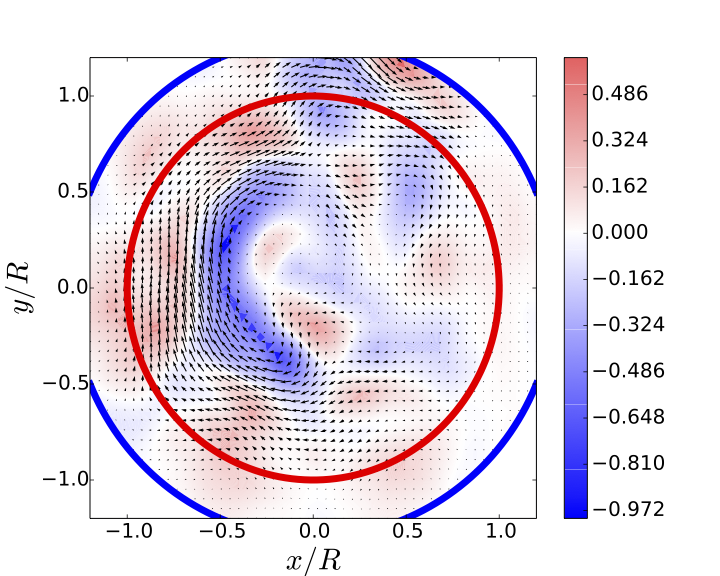
Figures 6a to 6f show the flow at a smaller Ekman number,
, for .
Near onset (, figure 6a),
the convective patterns are much smaller than for a comparable criticality at
. When the criticality increases, we observe modes that
correspond to the modulated modes described by Goldstein et al. (1993).
These feature spiralling arms (Fig. 6b) and were also observed
experimentally by Zhong et al. (1993)
for a comparable level of criticality (). Zhong et al. (1993)
showed that these spiralling patterns arise from the outer wall of the cylinder
as azimuthal mode. In the TC, we observe such an azimuthal mode with a
corresponding wavenumber .
Such large differences between supercritical patterns at different Ekman numbers
were theoretically predicted by Goldstein et al. (1993), whose analysis
shows that when is varied, the lowest critical Rayleigh number is
alternatively achieved by either a fast or a slow precessing
mode. At higher criticality, convective patterns reflect a combination of wall modes
and centre modes (at
on figures 6c, 6d and 6e), as
for . Similarly to the more slowly rotating case,
convective patterns converge towards a central retrograde structure at the
highest levels of supercriticality explored here (Fig. 6f).
For both values of , the main features of the flow patterns (alternative presence of fast
and slow modes near the onset of convection depending on , evolution towards a large
retrograde vortex for ) support the view that the
convection in the TC behaves as convection in a solid cylinder
rather than in an infinite plane layer. It is also interesting to note that
the flow patterns discovered by Goldstein et al. (1993) and
Zhong et al. (1993) at relatively high values of () remain dominant at
the much lower values explored in our experiment (). Such robustness may indicate
that convection is in an asymptotic regime of rotation as far as flow
structures are concerned and that similar structures might also be found in
regimes of even more rapid rotation, such as the Earth’s.
It should also be mentioned that other authors mention the existence of instabilities
at the rim of the TC (see Cui & Street (2001); Aurnou et al. (2003)). While it is difficult to distinguish such
instabilities from convective instabilities within the cylinder form visualisations only,
Maxworthy & Narimousa (1994) found that such instabilities occur for a Rossby number based on
vertical motion greater than 0.28. This parameter remains one or two orders of magnitude below this value in most of our experiments, and below 0.1 in the most supercritical cases (for ). This is a good indication that the structures we observe are convective patterns, rather than rim instabilities.




3.3 Evolution of the plume size and precession frequencies in supercritical regimes
The succession of supercritical patterns is reflected in the evolution of the dominating wavelengths and precession frequencies with criticality gathered on Fig. 7. We find that beyond the onset of convection the dominating wavenumber follows a scaling of the form
| (6) |
This scaling extends the scaling for found at the onset of convection to supercritical regimes. It implies that as convection becomes more intense, the flow rearranges itself with fewer larger structures that are more efficient to carry the heat flux across the TC up to the point where only one structure is left for .
The precession frequency first sharply increases in the weakly supercritical regime and subsequently saturates. It is nevertheless difficult to tell whether an asymptotic value is reached in the limit . Using a Landau model for the bifurcation, Goldstein et al. (1993) showed that in weakly supercritical regime, the precession normalised by should vary as:
| (7) |
where the values of constants and depend on the aspect ratio of the cylinder (with in the limit of large aspect ratio to recover the stationary onset of convection in an infinitely extended plane layer, see Chandrasekhar (1961)). The values of and were obtained experimentally by Zhong et al. (1993) and Ecke et al. (1992) for a cylinder of aspect ratio and values of greater than . The variations of extracted from experiments at several Ekman numbers for are reported in Fig. 7. They are best fitted over the widest measured range of values by an exponential law of the form:
| (8) |


The value of is consistent with the findings of Ecke et al. (1992), but the precession frequency appears to vary significantly less in the supercritical regime in the present case than in the case of a solid rotating cylinder. It is, however, difficult to attribute this difference to any of the factors that differ between the two problems: the difference in shape of the upper domain boundary, a different aspect ratio, a three-order of magnitude difference in the Ekman number, different mechanical and thermal boundary conditions at the lateral boundary of the cylinder. Nevertheless, the precessing motion at onset and in supercritical regimes adds further support to the view that the phenomenology of convection in the tangent cylinder obeys the same mechanisms as in a solid rotating cylinder, both at the onset and in supercritical regimes.
4 Heat flux and thermal wind
4.1 Heat Flux through the Tangent Cylinder
The efficiency of convection is best measured by its ability to transport heat through a fluid layer. Here we characterise the variations of the heat flux with and by means of the Nusselt number which represents the ratio of the heat flux in the fluid to the purely conductive heat flux:
| (9) |
where we recall that is the heat flux through the top surface of the heater, obtained from the difference between the temperature of the heat-carrying fluid at the inlet and outlet of the heater and is the height of fluid above the heater. The variations of with are reported in Fig. 9 for several values of . Since is measured at the heater, it reflects the total heat transferred across the entire dome. As all of the flux transits through the TC, is an upper bound for the total heat flux through the upper surface of the TC because thermal losses occur at the lateral boundary of the heater. Given the low values of the velocity near that boundary, these losses are mostly likely predominantly of conductive nature, especially at low criticality. Two regions of parameters clearly appear. In the large Ra limit, the heat transfer becomes independent of the rotation and follow a scaling of the form (see top graph):
| (10) |
This suggests that in these strongly supercritical regimes, heat transfer are not influenced by the Coriolis force anymore. Indeed, in the range of Rayleigh and Prandtl numbers we considered, similarly low exponents of in the range 1/4-3/7 are expected for plane non-rotating Rayleigh-Benard convection (Grossmann & Lohse, 2000) and in spherical shells with radial gravity (Gastine et al., 2015). At moderate Rayleigh numbers, by contrast, ( for , for and for , see bottom graph), exhibits a strong dependence on as well as , of the form:
| (11) |
This law is very close to the theoretical scaling of put forward by Julien et al. (2012) (see also Gastine et al. (2016)) as a signature of the diffusivity free-regime. These authors found that this scaling was verified in rotating convection in a spherical shell with radial gravity for a range of values of and that is essentially the same as its range of validity in LEE. Their theoretical scaling argument, however, does not invoke geometry nor the orientation of the buoyancy force. It relies on the assumptions that (i) the largest contribution or the temperature gradient originates in the bulk and not in boundary layers, (ii) in the limit of no rotation, the ultimate regime of classical Rayleigh-Benard convection is recovered (Kraichnan, 1962), (iii) in the limit where rotation dominates inertia, the heat flux solely depends on King et al. (2012). Hence, this scaling can be reasonably interpreted as the signature of the diffusivity-free regime of rotationally-dominant convection in the TC configuration too. Experiments and numerical simulations on convection in a rotating cylinder filled with water (Cheng et al., 2015; King et al., 2012) also exhibit a similar transition between steep variations of in the weakly supercritical regime and a more a strongly supercritical regime where that is very close to (10). On the other hand, the scaling law at low , was found to strongly depend on , with an exponent varying from at low Ekman numbers to (for ).


An alternative but equivalent way to analyse the variations of the heat flux consists of seeking how flux normalised by rotation varies with the Rayleigh number based on the heat flux itself. One advantage of this approach is to quantify convection in terms of the available buoyancy. Buoyancy may indeed result from a heat flux at the boundary but also from a solute mass flux, as in the core of the Earth and other planets. On this basis, we follow Aubert et al. (2001); Aubert (2005); Christensen & Aubert (2006) and introduce the modified Nusselt number, Rayleigh number and a modified diffusionless Rayleigh number based on the heat flux, respectively defined as
| (12) |
| (13) |
| (14) |
Cheng & Aurnou (2016) stresses that scalings of the form and satisfied . Here , and . Hence, these scalings offer an alternative way of representing the data from figure 9, rather than new data.
Christensen (2002) found that these quantities obeyed a scaling law of the form
.
This result was obtained with numerical simulations in a spherical shell geometry for . Aurnou (2007) identified this scaling as indicative of a rapidly rotating regime. Further, using the data of Sumita & Olson (2003), it was shown that for low values of the relation between and was better fitted with a power law of the form . In the present configuration, varies between and and therefore falls within a similar range to the experiments of Sumita & Olson (2003). Collapsed data reported in Fig. 9 show that points in the regime following the law obey a scaling close to that found by these authors:
| (15) |
The exponent being closer to 0.29 than 5/9 confirms that this regime is one the flow is outside the quasi-geostrophic regime, where convection-driven inertia plays an important role.

4.2 Thermal wind
In axisymmetric geometry, the balance between buoyancy and Coriolis forces gives rise to azimuthal motion, seen through the balance between the curl of these forces:
| (16) |
where is the coefficient of thermal expansion and is the temperature perturbation. The strongest retrograde motion is found at the higher latitude, such as those of our PIV planes represented in figures 5 and 6, located at a latitude of (or, equivalently at above the heater).
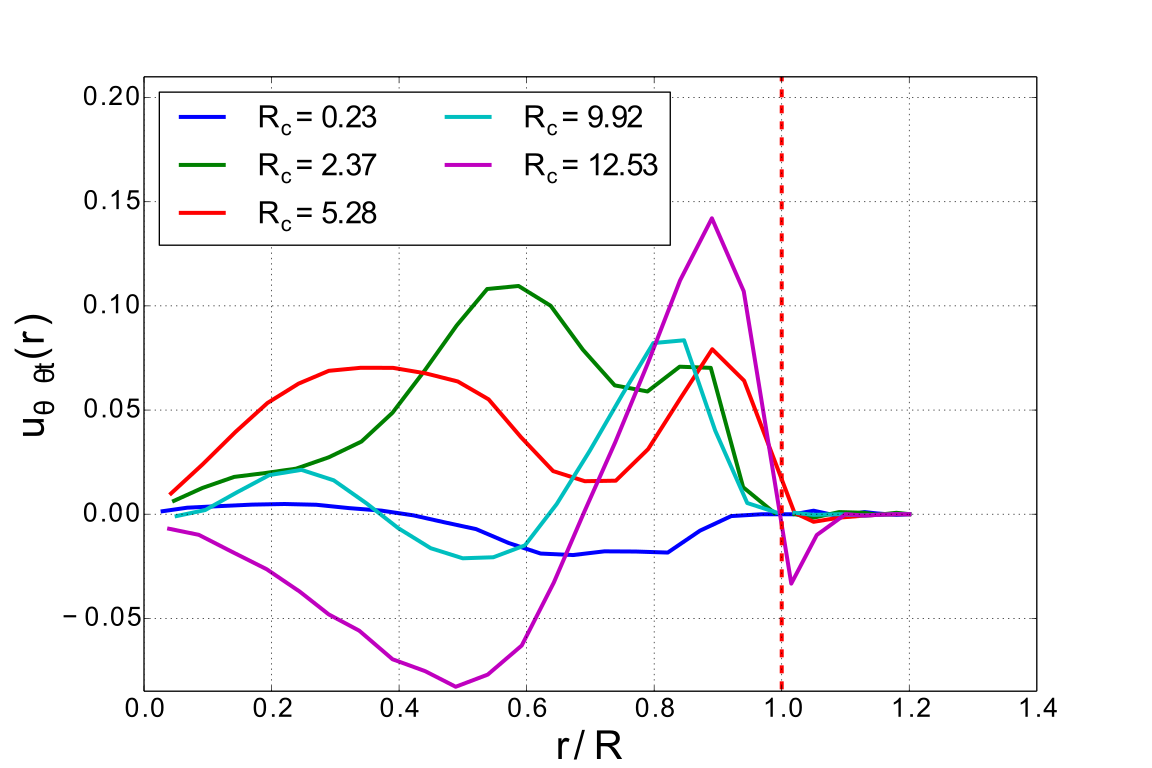
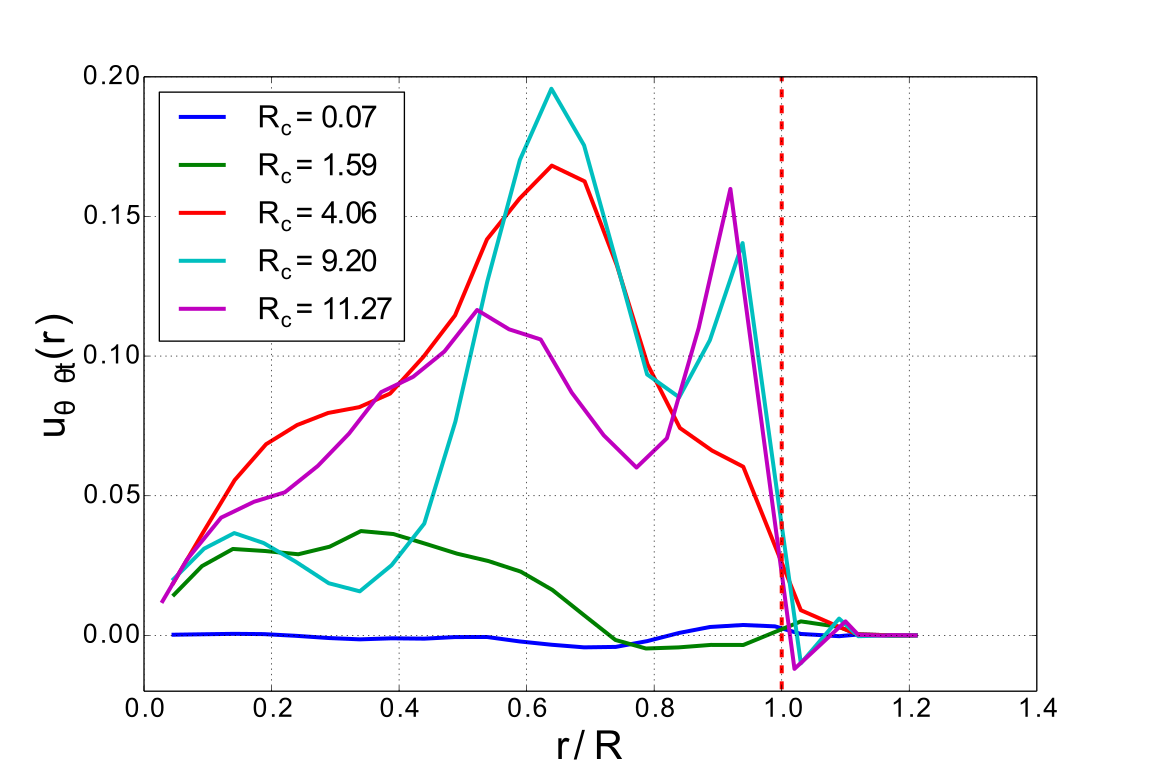
On the other hand, the direction of the thermal wind may reverse at low latitude. Hence, we extract from these measurements a radial profile of the azimuthal wind at two different latitudes (see figure 2) by means of an azimuthal and time average of the azimuthal velocity : additionally to the high latitude,
the second latitude we consider corresponds to a plane close to the heater surface (, or, equivalently at above the heater).
Results are plotted on figures 10a to
10d.
At high latitude (figures 10a and 10b), the profiles
exhibit a strong negative maximum followed by slightly positive
values at larger radii, corresponding to a strong retrograde motion surrounded
by a slightly prograde motion. Near the onset of convection, some prograde
motion exists near the centre, that disappears as the flow becomes more
supercritical. Despite the succession of different patterns observed in the
supercritical regime, the
intensity of the retrograde motion steadily increases with criticality.
For strongly supercritical flows (), velocity patterns show a
single structure slightly outgrowing the TC
(we shall see in section 5 that motion outside the TC does
not necessarily imply that the Taylor-Proudman constraint is broken). This
phenomenon appears for
slightly higher criticality at higher values of
( at and
at ). In both cases,
this confirms that in the most supercritical regimes, retrograde
motion progressively invades the high-latitude region of the TC, where
the flow becomes dominated by a large central retrograde vortex.
Profiles at low latitude, nearer the solid inner core provide a better picture
of the three-dimensional structure of the thermal wind (Figures 10c
and 10d). In both cases, a prograde wind first develops near the
solid core at low levels of criticality and increases in intensity with .
At , the prograde wind starts weakening at the centre
from and starts becoming retrograde around .
At higher rotation, weakening of the prograde wind near the solid core occurs
only for and we did not reach a regime where it reversed.
This difference in levels of criticality for the weakening and reversal of
the thermal wind near the solid core can be understood from the scaling for the
critical Rayleigh number and (16) which imply that
. From this scaling, thermal wind
with a given vertical gradient of is expected to occur at increasingly high levels of criticality when is decreased. Hence, the larger velocity
gradients corresponding to a thermal wind flowing in opposite directions at high and low latitudes survive at higher levels of criticality when decreases.
Interestingly, a clear azimuthal prograde jet is present at the edge of the
tangent cylinder on the inside. The jet is thinner at faster rotation.
It appears for at and
at , and its intensity slightly increases
with criticality.
One cannot but notice the similarity between this structure and the
non-axisymmetric azimuthal jets near the TC inferred by
Livermore et al. (2017) from satellite measurements of
time variation of the Earth’s magnetic
field. Although the forces driving the
jet remain unknown, the authors suggest that they are most likely of magnetic
origin, an effect that is absent in the present study. Azimuthal jets were also noticed
in measurements in the flow patterns inferred from measurements of the Earth magnetic field (Hulot et al., 2002).


To conclude the characterisation of the thermal wind, we shall quantify its intensity in terms of the Rossby number , and its variations with the flux-based Rayleigh number, . The Rossby number, defined as
| (17) |
measures the ratio of inertia to the Coriolis force, where is chosen as the maximum retrograde velocity in the averaged profiles of the thermal wind measured in the high latitude plane (reported in figures 10a and 10b). Our results, reported in figure 11, obey the scaling
| (18) |
This scaling is very close to the scaling relating the azimuthal velocity scale and buoyancy , (here, ) first derived theoretically by Maxworthy & Narimousa (1994) for the thermal wind in oceanic convective plumes. It is derived from the azimuthal curl of a local balance between Coriolis force and buoyancy outside the geostrophic regime, where the excess buoyancy and the Rossby deformation radius are set by the balance between Coriolis and buoyancy forces (Maxworthy & Narimousa, 1994). Both Aurnou et al. (2003) and Aubert (2005) report the same scaling when thermal wind is present respectively in experiments in a TC geometry and in numerical simulations in full spherical shell. Hence (18) provides further evidence that the azimuthal motion we are detecting is thermal wind. the vertical gradients of azimuthal velocity induce a departure to geostrophy or order , which is significantly smaller than the vertical velocities associated with the plumes. Hence the thermal wind may not be the main source of the ageostrophy suggested by the variations of heat flux.

5 Effect of the confinement
The structure of convection, the scalings for the heat flux
and the thermal wind present a picture of convection within the TC at low
Ekman numbers that resembles convection in a cylinder confined by solid walls:
the steep rise heat transfer at low criticality, where the flow is dominated by rotation
is followed by a rotation-independent regime at higher criticality.
The similarity with rotating convection in a solid cylinder reflects a prominent role of
background rotation through the TP constraint it imposes on the flow. Based on these
observations, we shall conclude this study by measuring the degree of confinement within the TC.
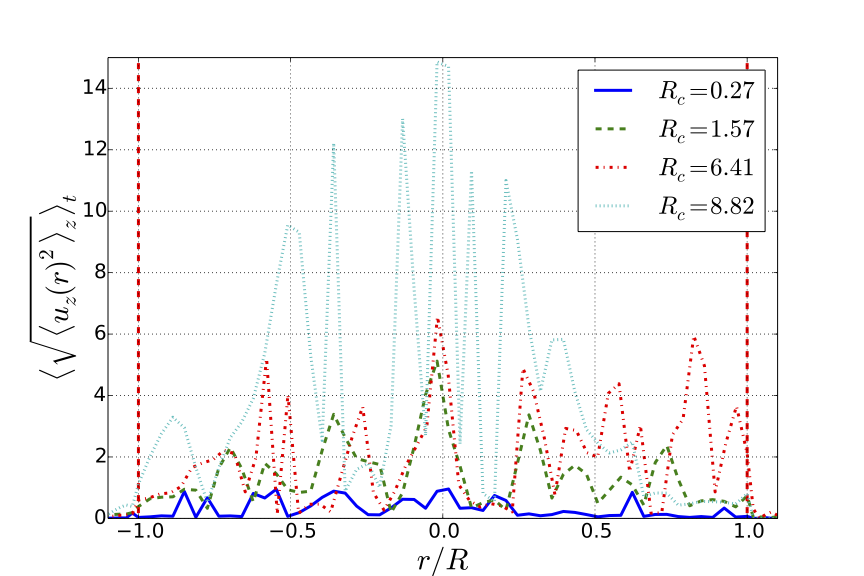
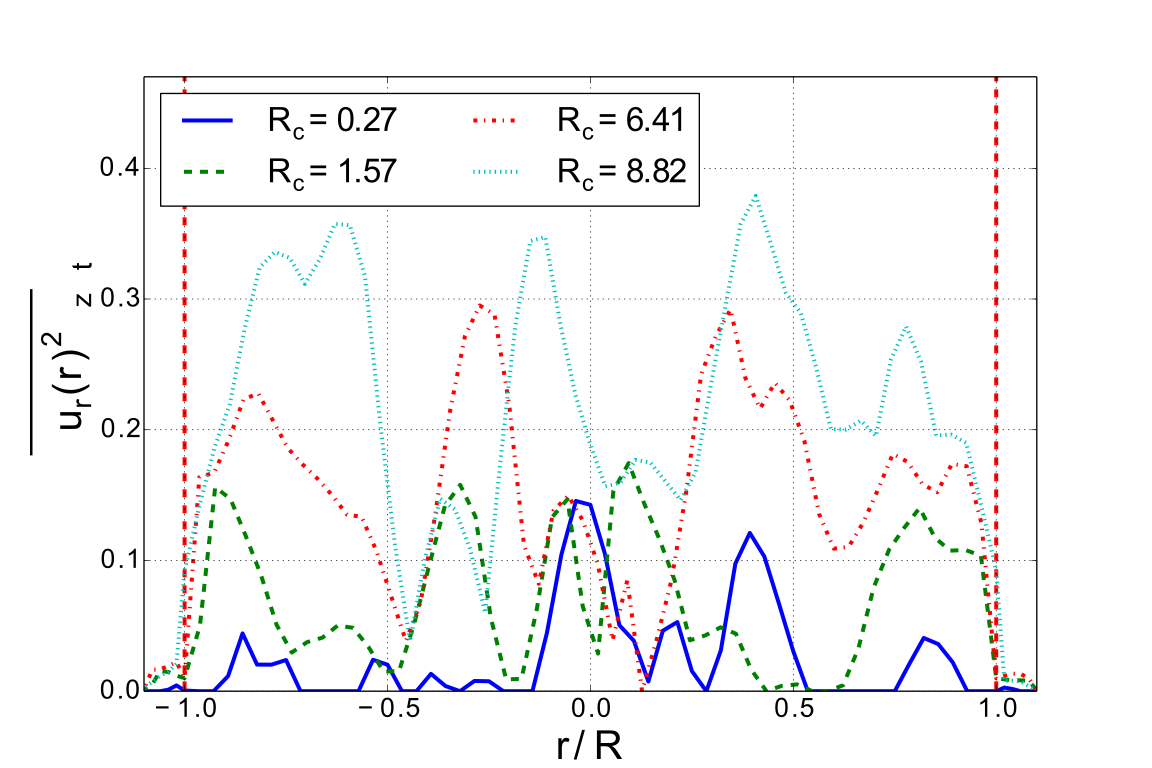
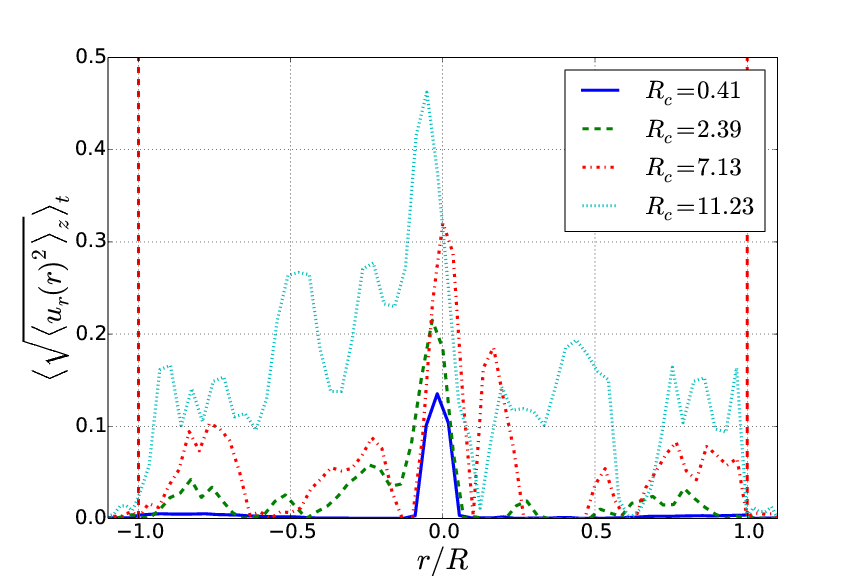
Figures 12a and 12c respectively show the -rms
profiles of vertical and radial velocities for .
The radial velocity right across the side boundary of the TC never exceeds a few percent
of its typical value within the TC so the TP constraint can be seen as
enforcing a near-impermeable condition there. For low criticality, vertical
fluid motion is entirely contained within the
radius of the TC. However, for , a slight motion appears
outside the TC, that remains at approximately the same level as is
increased. The same is true for the azimuthal wind, which extends slightly
beyond the TC at moderate to high levels of criticality
(figures 10a and 10c).
Vertical and azimuthal motions do not, however, directly break
the TP constraint. Momentum inside the TC is indeed transported across the
TC boundary by viscous friction. Friction is all the more effective there
as a free Stewartson layer is expected to develop there, with an
inner thickness scaling as and an outer thickness scaling
as (Stewartson, 1957).
Such layers are too thin to be reasonably detected
in our measurements. Nevertheless, the radial profiles of azimuthal velocities
in figure 10a- 10d show hint of a variation in slope
across the TC boundary. This local slope is also considerably steeper at
than . This suggests that
the mechanical condition across the TC boundary is probably closer to
one of imposed tangential stress of a value determined by the rotation,
rather than the no-slip condition of a rigid boundary.
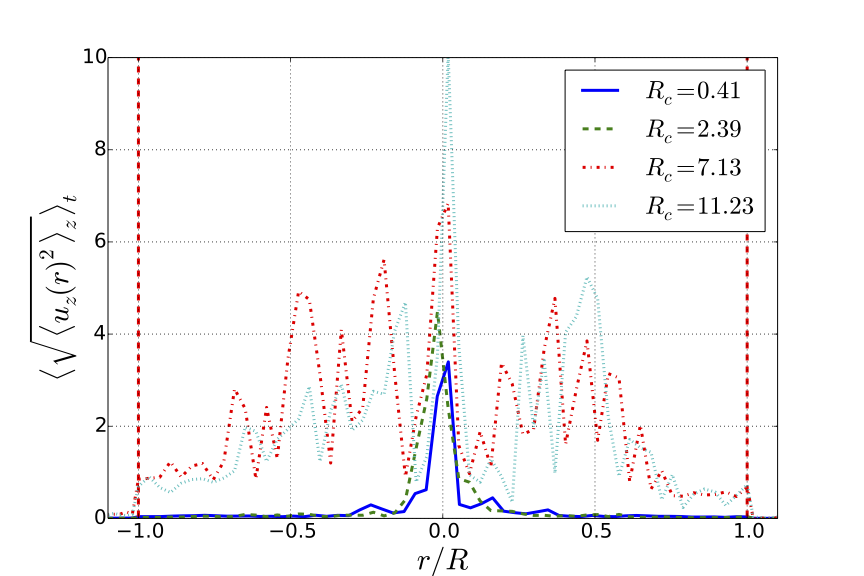
This tendency is confirmed by the -rms profiles of vertical and radial
velocities for . For this faster rotation, the radial
velocity is found to be exactly zero at the boundary of
the TC at all levels of criticality, within the precision of our measurements.
Vertical velocity is also practically zero. The convection even seems
extinct on the last 20% of the TC’s outer region. Clearly, this behaviour is
promoted by the fact that the hot boundary of the domain is itself confined
within the domain. However, the intense convection that ensues would not remain
confined within the higher latitudes of the TC without a strong influence of
the TP constraint. Overall, the behaviour is similar to that found at
, except that the TP constraint is more strictly
enforced at equivalent levels of criticality.
Note that the curvature of the dome may have an influence on the confinement effect. The height under the dome varies by 7.8% between the centre and the edge of the TC. This geometry has two consequences: first, the onset of convection is determined by , which dependents on the local height under the dome as . This, however, implies that only varies by 2.5% across the heater which is unlikely to decide where the first convective cells appear. The limited influence of the curvature is further confirmed by the fact that the critical Rayleigh number follows practically the same scaling as for plane convection.
Second, the associated TP constraint opposes radial motion which slightly reinforces confinement. In planetary cores, the spherical shape of the solid core reverses the radial variation of height compared to our experiment but it similarly opposes radial motion, thus reinforcing confinement. In both cases, however, the confinement associated to the curvature of the dome is expected to be of significantly less influence than the TP constraint incurred at the outside edge of the TC.
6 Conclusions and discussion
The experimental study we conducted was focused on convection in a Tangent
Cylinder for Ekman numbers in the range to
, and brought several answers to the four questions set in
the introduction:
First, the critical scalings for the onset of convection in a TC are similar
to those known for plane convection, albeit with different constants:
the critical Rayleigh number
is marginally higher,
but the critical wavenumber
is significantly higher than for plane convection.
Second, this discrepancy has origins in the structure of the critical
convective plumes, which resemble those found in rotating cylinders, rather
than the periodic cell pattern of plane rotating convection. As in the former,
the critical mode is either one of the slow or one of the fast modes identified by
Goldstein et al. (1993), depending on the Ekman number and the aspect
ratio of the cylinder.
In a solid cylinder, the onset of wall modes takes place at a significantly
lower critical Rayleigh number than the unstable modes of convection in a plane layer. In
a Tangent Cylinder, however the Taylor-Proudman constraint does not exist in the still base flow, so the confinement that is responsible for the onset of wall modes is absent at such low values
of . Without it, the base flow retains a configuration that is stable up to values of
for which plane modes are unstable. When these are ignited, however, the TP constraint becomes
active and favours eigenmodes of the cylindrical geometry.
Nevertheless, the influence of the virtual TC
boundary being weaker than that of a solid wall, the plumes at onset retain some
of the features of that of a plane configuration, with in particular, a size that is
intermediate between those of plane and cylindrical geometries.
Third, the loss of translational symmetry in the
horizontal plane excludes an onset of convection through steady modes, even at
the moderate values of for which one would expect steady
rather than oscillatory onset in a
plane configuration. However, the time-dependence takes the form of
a very slow retrograde precession, instead of waves expected at oscillatory onsets.
Fourth, the supercritical regimes exhibit a complex sequence of
convective patterns, leading to a single, large vortex centred on the cylinder axis when
the Rayleigh number exceeds approximately 10 times the critical value. At
relatively high latitude, this vortex translates into a coherent,
retrograde thermal wind. For the Ekman numbers we considered,
the intensity of the thermal wind,
measured in terms of the Rossby number obeys a scaling of
identical to the scaling found in previous studies
(Aurnou et al., 2003) for thermal wind resulting from the
interplay between Coriolis, buoyancy force.
This phenomenology is supported by the scaling for the heat flux
, which is also found in
this regime.
Fifth, the geometry of the flow in the vicinity of the TC lateral boundary
confirms that the Taylor-Proudman constraint is practically not broken there.
On the other hand, for intense enough convection, the likely Stewartson layers
that develop along this boundary diffuse a small part of the momentum
generated inside the TC towards regions outside it.
Since our work has been largely motivated by the study of planetary
cores, it is tempting to try and gain insight into their dynamics from these
conclusions. This endeavour, however, meets several important obstacles.
The first is the difference in the properties of the
working fluids. Recently revised estimates
of outer core thermal conductivity (de Koker et al., 2012; Pozzo et al., 2012)
suggest that the Prandtl number
could have a low value . The onset of rotating convection
at such would be oscillatory even in the plane configuration.
Nevertheless, it is still
reasonable to expect that confinement within the TC induced by the virtual
boundaries raised by the TP constraint reshapes convection in a similar way
as it does at the moderate Prandtl numbers considered in this paper.
This view is supported by the linear stability
analysis of convection in a rotating cylinder at low Prandtl numbers by
Goldstein et al. (1994), which shows that the critical modes are subject to
both precession and oscillations.
Furthermore, convection in the Earth core is also compositional in nature,
rather than only thermal. The corresponding Schmidt numbers are in a range
comparable to the thermal Prandtl numbers of water and acid,
for which the onset of convection would not be oscillatory.
Still, a deeper understanding of
convection in a TC at low Prandtl number would require liquid metal experiments
in a configuration similar to the present paper. This would clarify
the question of whether the oscillatory modes at the onset of low- convection are
as robust to a change of boundary condition at the lateral boundary of the cylinder
as we found the modes of moderate- convection to be.
Secondly, several examples of nonmagnetic spherical shell convection driven by
moderately supercritical
convection of thermal (Sreenivasan & Jones, 2006) or double-diffusive
(e.g. (Trümper et al., 2012)) origin within the TC show an
ensemble of thin viscously
controlled plumes with no indication of any coherent -vorticity.
By contrast, coherent anticyclonic vorticity within the TC
has been noted in rotating dynamo
simulations (Glatzmaiers & Roberts, 1995; Sreenivasan & Jones, 2006; Schaeffer et al., 2017),
which points to a possible role of the TC magnetic field in generating
strong polar vortices in moderately supercritical convection.
That said, the central retrograde vortex noted in our experimental TC occurs
at , which might correspond to values of
– outside the
spherical shell TC, given that convection inside
the TC sets in at a Rayleigh number much higher than outside
it (Jones, 2007). This strongly driven regime has not been
adequately explored, at least in the
computationally demanding regime of low . Since
the criticality of convection within Earth’s TC is not
well constrained, a comparison of
the convection pattern at
within our experimental TC with that in
the spherical shell TC would help ascertain whether the
two patterns bear any resemblance to each other.
Finally, understanding the role of the Lorentz forces within
the Earth’s TC
is not as straightforward as one might imagine.
With a uniform magnetic field, it is known that the Lorentz forces
favour large-scale magnetically controlled plumes in a plane layer
(e.g. Aujogue et al., 2015). However,
geodynamo simulations suggest that the mean field within the TC has
severe lateral and axial inhomogeneities, whose effect on the
width of convection plumes needs to be understood. Further,
the nature of the free shear layers at the cylinder boundary may change
as a consequence of the constraints that the Lorentz force has to
satisfy to ensure sufficient smoothness of the velocity
field (Livermore & Hollerbach, 2012; Hollerbach, 1994).
It is hoped that magnetoconvection experiments
in a TC configuration at moderate Prandtl number
(which our apparatus is
designed to perform) could provide us with a
somewhat more realistic picture of
convection within the TC than rotating convection alone.
K.A., A.P., and B.S. acknowledge support from the Leverhulme Trust for this project (Research Grant No. RPG- 2012-456), and A.P. acknowledges support from the Royal Society under the Wolfson Research Merit Award scheme. K.A. acknowledges the support of the Royal Astronomical Society. The authors are indebted to the LNCMI and its technical and academic staff for the quality and effectiveness of their support. Finally, the authors are indebted to the anonymous referees for their constructive remarks.
References
- Aubert (2005) Aubert, J. 2005 Steady zonal flows in spherical shell dynamos. Journal of Fluid Mechanics 542, 53–67.
- Aubert et al. (2001) Aubert, J., Brito, D., Nataf, H.-C., Cardin, P. & Masson, J.-P. 2001 A systematic experimental study of rapidly rotating spherical convection in water and liquid gallium. Physics of the Earth and Planetary Interiors 128 (1), 51–74.
- Aujogue et al. (2016) Aujogue, K., Pothérat, A., Bates, I., Debray, F. & Sreenivasan, B. 2016 Little earth experiment: An instrument to model planetary cores. Review of Scientific Instruments 87 (8), 084502.
- Aujogue et al. (2015) Aujogue, K., Pothérat, A. & Sreenivasan, B. 2015 Onset of plane layer magnetoconvection at low ekman number. Physics of Fluids 27 (10), 106602.
- Aurnou (2007) Aurnou, J. 2007 Planetary core dynamics and convective heat transfer scaling. Geophysical and Astrophysical Fluid Dynamics 101 (5-6), 327–345.
- Aurnou et al. (2003) Aurnou, J., Andreadis, S., Zhu, L. & Olson, P. 2003 Experiments on convection in Earth’s core tangent cylinder. Earth Planet. Sci. Lett. 212 (1), 119–134.
- Aurnou & Olson (2001) Aurnou, J. M. & Olson, P. 2001 Experiments on Rayleigh–Bénard convection, magnetoconvection and rotating magnetoconvection in liquid gallium. J. Fluid Mech. 430, 283–307.
- Busse (1970) Busse, F. H. 1970 Thermal instabilities in rapidly rotating systems. J. Fluid Mech. 44 (03), 441–460.
- Cardin & Olson (1994) Cardin, P. & Olson, P. 1994 Chaotic thermal convection in a rapidly rotating spherical shell: consequences for flow in the outer core. Physics of the earth and planetary interiors 82 (3-4), 235–259.
- Chandrasekhar (1961) Chandrasekhar, S. 1961 Hydrodynamic and hydromagnetic stability. Clarendon Press, Oxford.
- Cheng & Aurnou (2016) Cheng, J.S. & Aurnou, J.M. 2016 Tests of diffusion-free scaling behaviors in numerical dynamo datasets. Earth and Planetary Science Letters 436, 121 – 129.
- Cheng et al. (2015) Cheng, JS, Stellmach, S, Ribeiro, A, Grannan, A, King, EM & Aurnou, JM 2015 Laboratory-numerical models of rapidly rotating convection in planetary cores. Geophysical Journal International 201 (1), 1–17.
- Christensen (2002) Christensen, U.R. 2002 Zonal flow driven by strongly supercritical convection in rotating spherical shells. Journal of Fluid Mechanics 470, 115–133.
- Christensen & Aubert (2006) Christensen, U.R. & Aubert, J. 2006 Scaling properties of convection-driven dynamos in rotating spherical shells and application to planetary magnetic fields. Geophysical Journal International 166 (1), 97–114.
- Clune & Knoblauch (1993) Clune, T. & Knoblauch, E. 1993 Pattern selection in rotating convection with experimental boundary conditions. Phys. Rev. E 47 (4), 2536–2540.
- Cui & Street (2001) Cui, Anquing & Street, Robert L. 2001 Large-eddy simulation of turbulent rotating convective flow development. Journal of Fluid Mechanics 447, 53 84.
- Curbelo et al. (2014) Curbelo, Jezabel, Lopez, Juan M., Mancho, Ana M. & Marques, Francisco 2014 Confined rotating convection with large prandtl number: Centrifugal effects on wall modes. Phys. Rev. E 89, 013019.
- Ecke et al. (1992) Ecke, R.E., Zhong, F. & Knobloch, E. 1992 Hopf bifurcation with broken reflection symmetry in rotating rayleigh-bénard convection. EPL (Europhysics Letters) 19 (3), 177.
- Gastine et al. (2016) Gastine, Thomas, Wicht, Johannes & Aubert, Julien 2016 Scaling regimes in spherical shell rotating convection. Journal of Fluid Mechanics 808, 690–732.
- Gastine et al. (2015) Gastine, Thomas, Wicht, Johannes & Aurnou, Jonathan M. 2015 Turbulent rayleigh b nard convection in spherical shells. Journal of Fluid Mechanics 778, 721–764.
- Glatzmaiers & Roberts (1995) Glatzmaiers, G.A. & Roberts, P.H. 1995 A three-dimensional self-consistent computer simulation of a geomagnetic field reversal. Nature 377, 203 – 209.
- Goldstein et al. (1994) Goldstein, H.F., Knoblauch, E., Mercader, I. & Net, M. 1994 Convection in a rotating cylinder. part 2. linear theory for low prandtl numbers. Journal of Fluid Mechanics 262, 293–324.
- Goldstein et al. (1993) Goldstein, H.F., Knobloch, E., Mercader, I. & Net, M. 1993 Convection in a rotating cylinder. part 1 linear theory for moderate prandtl numbers. Journal of Fluid Mechanics 248, 583–604.
- Grossmann & Lohse (2000) Grossmann, S. & Lohse, D. 2000 Scaling in thermal convection: a unifying theory. Journal of Fluid Mechanics 407, 27 56.
- Hollerbach (1994) Hollerbach, Rainer 1994 Imposing a magnetic field across a nonaxisymmetric shear layer in a rotating spherical shell. Physics of Fluids 6 (7), 2540–2544.
- Horn & Shishkina (2014) Horn, S. & Shishkina, O. 2014 Rotating non-oberbeck boussinesq rayleigh bénard convection in water. Phys. Fluids. 26, 055111.
- Hulot et al. (2002) Hulot, Gauthier, Eymin, Céline, Langlais, Benoît, Mandea, Mioara & Olsen, Nils 2002 Small-scale structure of the geodynamo inferred from oersted and magsat satellite data. Nature 416 (6881), 620–623.
- Jacobs & Ivey (1998) Jacobs, P. & Ivey, G. N. 1998 The influence of rotation on shelf convection. Journal of Fluid Mechanics 369, 23 48.
- Jones (2007) Jones, C.A. 2007 Thermal and compositional convection in the outer core. Treatise in Geophysics, Core Dynamics 8, 131–185.
- Julien et al. (2012) Julien, Keith, Knobloch, Edgar, Rubio, Antonio M & Vasil, Geoffrey M 2012 Heat transport in low-rossby-number rayleigh-bénard convection. Physical review letters 109 (25), 254503.
- King et al. (2012) King, E. M., Stellmach, S. & Aurnou, J. M. 2012 Heat transfer by rapidly rotating rayleigh b nard convection. Journal of Fluid Mechanics 691, 568 582.
- de Koker et al. (2012) de Koker, N., Steinle-Neumann, G. & Vlček, V. 2012 Electrical resistivity and thermal conductivity of liquid fe alloys at high p and t, and heat flux in earth s core. Proceedings of the National Academy of Sciences 109 (11), 4070–4073.
- Kraichnan (1962) Kraichnan, R. H. 1962 Turbulent thermal convection at arbitrary prandtl number. Phys. Fluids 5 p. 1374 1389.
- Kunnen et al. (2010) Kunnen, R. P. J., Geurts, B. J. & Clerx, H. J. H. 2010 Experimental and numerical investigation of turbulent convection in a rotating cylinder. Journal of Fluid Mechanics 642, 445 476.
- Kunnen et al. (2011) Kunnen, Rudie P. J., Stevens, Richard J. A. M., Overkamp, Jim, Sun, Chao, van Heijst, GertJan F. & Clercx, Herman J. H. 2011 The role of stewartson and ekman layers in turbulent rotating rayleigh b nard convection. Journal of Fluid Mechanics 688, 422 442.
- Livermore et al. (2017) Livermore, P.W., Hollerbach, R. & Finlay, C. 2017 An accelerating high-latitude jet in earth’s core. Nat. Geo. 10, 62–69.
- Livermore & Hollerbach (2012) Livermore, Philip W. & Hollerbach, Rainer 2012 Successive elimination of shear layers by a hierarchy of constraints in inviscid spherical-shell flows. Journal of Mathematical Physics 53 (7), 073104.
- Marques et al. (2007) Marques, F., Mercader, I, Batiste, O. & Lopez, J. M. 2007 Centrifugal effects in rotating convection: axisymmetric states and three-dimensional instabilities. Journal of Fluid Mechanics 580, 303 318.
- Maxworthy & Narimousa (1994) Maxworthy, T. & Narimousa, S. 1994 Unsteady turbulent convection into a homogeneous rotating fluid with oceanic applications. J. Phys. Ocean. 24, 865–887.
- Pozzo et al. (2012) Pozzo, M., Davies, C., Gubbins, D. & Alfe, D. 2012 Thermal and electrical conductivity of iron at earth’s core conditions. Nature 485 (7398), 355–358.
- Schaeffer et al. (2017) Schaeffer, N., Jault, D., Nataf, H.-C. & Fournier, A. 2017 Turbulent geodynamo simulations: a leap towards earth s core. Geophys. J. Int. p. in press.
- Schubert & Soderlund (2011) Schubert, G. & Soderlund, K.M. 2011 Planetary magnetic fields: Observations and models. Physics of the Earth and Planetary Interiors 187 (3), 92–108.
- Sreenivasan & Jones (2006) Sreenivasan, B. & Jones, C. A. 2006 Azimuthal winds, convection and dynamo action in the polar regions of planetary cores. Geophys. Astrophys. Fluid Dyn. 100 (4-5), 319–339.
- Stewartson (1957) Stewartson, K 1957 On almost rigid rotations. Journal of Fluid Mechanics 3 (1), 17–26.
- Sumita & Olson (2003) Sumita, I. & Olson, P. 2003 Experiments on highly supercritical thermal convection in a rapidly rotating hemispherical shell. Journal of Fluid Mechanics 492, 271–287.
- Trümper et al. (2012) Trümper, T., Breuer, M. & Hansen, U. 2012 Numerical study on double-diffusive convection in the earth s core. Physics of the Earth and Planetary Interiors 194, 55–63.
- Zhang & Liao (2009) Zhang, K. & Liao, X. 2009 The onset of convection in rotating circular cylinders with experimental boundary conditions. J. Fluid Mech. 622, 63 73.
- Zhong et al. (1993) Zhong, F., Ecke, R.E. & Steinberg, V. 1993 Rotating rayleigh–bénard convection: asymmetric modes and vortex states. Journal of Fluid Mechanics 249, 135–159.