Spatially-Varying Blur Detection Based on Multiscale Fused and Sorted Transform Coefficients of Gradient Magnitudes
Abstract
The detection of spatially-varying blur without having any information about the blur type is a challenging task. In this paper, we propose a novel effective approach to address this blur detection problem from a single image without requiring any knowledge about the blur type, level, or camera settings. Our approach computes blur detection maps based on a novel High-frequency multiscale Fusion and Sort Transform (HiFST) of gradient magnitudes. The evaluations of the proposed approach on a diverse set of blurry images with different blur types, levels, and contents demonstrate that the proposed algorithm performs favorably against the state-of-the-art methods qualitatively and quantitatively.
1 Introduction
Many images contain blurred regions. Blur can be caused by different factors such as defocus, camera/object motion, or camera shake. While it is common in photography to deliberately use a shallow focus technique to give prominence to foreground objects based on defocus, unintentional blur due to degradation factors can decrease the image quality. Blur detection plays an important role in many computer vision and computer graphics applications including but not limited to image segmentation, depth estimation, image deblurring and refocusing, and background blur magnification.
In recent years, a variety of methods have been proposed to address the issue of deblurring by estimating blur kernels and performing a deconvolution [2, 5, 6, 13, 14, 16, 19, 23, 22, 34, 38, 37]. In this work, we do not aim to do kernel estimation and deconvolution. Instead, the objective of this work is to propose an effective blur detection method from a single image without having any information about the blur type, level, or the camera settings. Figure 1 shows sample results of our proposed method.
Despite the success of existing spatially-varying blur detection methods, there are only few methods focusing on spatially-varying blur detection regardless of the blur type [3, 20, 26, 27, 28, 32], and the rest perform well only on defocus blur or motion blur. Moreover, the performance of most of the existing methods degrades drastically when taking into account the effects of camera noise and distortion. Therefore, noise-free and artifact-free assumptions could be unsuitable when dealing with real-word images.

The contributions of this work are summarized as follows. We propose a robust spatially-varying blur detection method from a single image based on a novel high-frequency multiscale fusion and sort transform (HiFST) of gradient magnitudes to determine the level of blur at each location in an image. We evaluate our proposed algorithm on both defocus and motion blur types to demonstrate the effectiveness of our method. We also test the robustness of our method by adding different levels of noise as well as different types and levels of distortions to the input image. We compare our method with state-of-the-art algorithms using their provided implementations and demonstrate that our proposed method outperforms existing state-of-the-art methods quantitatively and qualitatively. Finally, we provide a few applications of our method including camera focus points estimation, blur magnification, depth of field estimation, depth from focus, and deblurring.
1.1 Related work
Blur detection methods can be divided into two categories: 1) methods that make use of multiple images [8, 9, 24, 33, 39, 40], and 2) methods that require only a single image [1, 3, 4, 7, 10, 15, 20, 21, 24, 26, 27, 28, 30, 31, 32, 36, 41, 42, 43]. In the first category, a set of images of the same scene are captured using multiple focus settings. Then the blur map is estimated during an implicit or explicit process. Different factors such as occlusion and requiring the scene to be static cause the application of these methods to be limited in practice. In recent years, several methods have been proposed to recover a blur map from a single image without having any information about the camera settings.
In general, blur detection algorithms from a single image can be divided into gradient-based, intensity-based and transform-based algorithms. In [3], Chakrabarti et al. propose a sub-band decomposition based approach. They estimate the likelihood function of a given candidate point spread function (PSF) based on local frequency component analysis. Liu et al. [20] propose a method which employs features such as image color, gradient, and spectrum information to classify blurred images. Shi et al. [26] propose a method based on different features such as gradient histogram span, kurtosis, and data-driven local filters to differentiate between blurred and unblurred image regions. Shi et al. [27] propose a method based on utilizing a sparse representation of image patches using a learned dictionary for the detection of slight perceivable blur. In [28], Su et al. propose a method based on examining singular value information to measure blurriness. The blur type (motion blur or defocus blur) is then determined based on certain alpha channel constraints. In [32], Tang et al. employ the image spectrum residual [12], and then they use an iterative updating mechanism to refine the blur map from coarse to fine by exploiting the intrinsic relevance of similar neighboring image regions.
In [7], Elder and Zucker propose a method that makes use of the first- and second-order gradient information for local blur estimation. Bae and Durand [1] estimate the size of the blur kernel at edges, building on the method by [7], and then propagate this defocus measure over the image with a non-homogeneous optimization. In their propagation, they assume that blurriness is smooth where intensity and color are similar. Tai and Brown [30] propose a method for estimating a defocus blur map based on the relationship between the image contrast and the image gradient in a local image region, namely local contrast prior. They use the local contrast prior to measure the defocus at each pixel and then apply Markov Random Field propagation to refine the defocus map. In [31], Tang et al. use the relationship between the amount of spatially-varying defocus blur and spectrum contrast at edge locations to estimate the blur amount at the edge locations. Then a defocus map is obtained by propagating the blur amount at edge locations over the image using a non-homogeneous optimization procedure. Yi and Eramian [36] propose a local binary patterns (LBP) based method for defocus blur segmentation by using the distribution of uniform LBP patterns in blurred and unblurred image regions. Zhang and Hirakawa [38] propose a method for estimating a defocus blur map from a single image via local frequency component analysis similar to [3]; they also incorporate smoothness and color edge information into consideration to generate a blur map indicating the amount of blur at each pixel. Zhuo and Sim [43] compute the defocus blur from the ratio between the gradients of input and re-blurred images. Then they propagate the blur amount at edge locations to the entire image via matting interpolation to obtain the full defocus map.
In comparison to these methods, we introduce a new method to estimate spatially-varying blur from a single image. Our work is based on a multiscale transform decomposition followed by the fusion and sorting of the high-frequency coefficients of gradient magnitudes. The proposed method is not limited by the type of blur and does not require information about the blur type, level, or camera settings. Experimental results demonstrate the effectiveness and robustness of our method in providing a reliable blur detection map for different types and levels of blur.

2 Proposed algorithm
To motivate our work, we first describe our proposed High-frequency multiscale Fusion and Sort Transform (HiFST), and then its role in image blur detection.
2.1 High-frequency multiscale fusion and sort transform
The Discrete Cosine Transform (DCT) has emerged as one of the most popular transformations for many computer vision and image compression applications. The DCT transforms a signal from a spatial representation into a frequency representation. DCT coefficients can represent different frequencies, and therefore can be informative about the image structure, energy, and bluriness. It is well known that blur would cause a reduction in the high frequencies of the image. Here we divide the DCT coefficients into low-, middle-, and high-frequency bands and consider the high-frequency DCT coefficients.
The proposed High-frequency multiscale Fusion and Sort Transform (HiFST) is based on computing locally at each pixel a patch-based multi-resolution (computed for different patch sizes around each pixel) DCT. For each pixel, the high-frequency DCT coefficients are extracted for each resolution (size of patch surrounding the considered pixel). The high-frequency coefficients from all resolutions are then combined together in a vector and sorted in the order of increasing absolute values. In this way, a vector of multiscale-fused and sorted high-frequency transform coefficients is generated for each image pixel.
Figure 2 shows the semi-log plot of a sharp and blurry patch to illustrate the effectiveness of the sorted absolute values of the high-frequency DCT coefficients in differentiating between a sharp and blurry region. As shown in Figure 2, after sorting the absolute values of the high-frequency coefficients in increasing order, obtained using the grayscale versions of patches (a) and (b), there is a clear visual difference between the sorted coefficients of the blurred and unblurred patches. In other words, as shown in Figure 2, we can see that the values of the sorted coefficients in the blurry block (red block) are correspondingly smaller than the sorted coefficients values in the sharp block (blue block). We aim to model this property for blur detection purposes.
Let denote the -pixel input image. We first compute the DCT of the input image in a patch-wise manner. Let denote a patch of size centered at pixel , with , and , where denotes floor of . Let , , denote the DCT of .
In our proposed method, we divide the computed DCT coefficients for each patch into three frequency bands, namely low, middle, and high-frequency bands [17], and consider the high-frequency components. Figure 3 illustrates the three defined frequency bands for a block.
Let denote a vector consisting of the absolute values of the high-frequency DCT coefficients of . is given by:
| (1) |
We define the increasingly sorted vector of the absolute values of high-frequency DCT coefficients as:
| (2) |
where is a vector. Let be the element in vector and let be the layer that is obtained by grouping all the elements for all positions . can be represented as an matrix given by:
| (3) |
The proposed HiFST consists of the normalized layers , where is given by:
| (4) |

By normalizing each layer between , each layer can better differentiate between the blurred and unblurred regions in the image and measure locally the level of blur. In Eqs. (2)-(3), we differentiate between the blurred and unblurred regions in a local adaptive manner by extracting the high-frequency DCT coefficients in a block-wise manner and then grouping and normalizing sorted DCT coefficients belonging to the same position.
In Figure 4 for illustration purposes, we employ a normalized sorted high-frequency DCT decomposition on each block with one block located at each pixel, which leads to 28 layers. The first layer contains the normalized smallest high frequency values, which yields to differentiating between the sharp and blurry regions. As we move toward the higher layers which consist of larger high-frequency coefficients, we can see more structures and edges appear for both the sharp and blurred regions while the discrimination between blurred and unblurred regions is still noticeable.

Considering only one resolution may not accurately indicate whether an image or patch is blurred or not. The scale ambiguity has been studied in various applications [26, 35]. Therefore, here we take into account a multiscale model to fuse information from different scales. With our multiscale analysis, our method is able to deal with blur in either small-scale or large-scale structures, so that blurred and unblurred regions are detected more effectively. We utilize a multiscale HiFST decomposition as follows:
| (5) |
where if even and if odd, denotes the union of all the high-frequency DCT coefficients computed in different scales with different resolutions, and is a vector. Then and can be computed as described in Eqs. (3) and (4).
2.2 Proposed spatially-varying blur detection
In the following, we present in details our spatially-varying blur detection approach which is based on the fusion, sorting, and normalization of multiscale high-frequency DCT coefficients of gradient magnitudes to detect blurred and unblurred regions from a single image without having any information about the camera settings or the blur type. The flowchart of our proposed algorithm is provided in Figure 5. A blurred image, , can be modeled as follows:
| (6) |
where is a sharp latent image, is the blur kernel, is the convolution operator, and is the camera noise. Our goal is to estimate the blur map from the observed blurry image . Given the image , we first apply a Gaussian filter with a small kernel to remove the high-frequency noise. The Gaussian filter is given by:
| (7) |
where is set to 0.5 in our experiment. Let denote the Gaussian filtered image of the input blurry image . The gradient magnitudes of an image can effectively capture image local structures, to which the human visual system is highly sensitive. By computing the gradient magnitudes, most of the spatial redundancy is removed, and the image structure and shape components are preserved. The gradient magnitude image of the Gaussian filtered image, , is computed by:

| (8) |
where , and .
Next we apply the HiFST (Section 2.1) decomposition on the computed gradient image, , in a multiscale manner. As shown in Figure 6, blur can be perceived differently in different scales. Given an image , we compute its multiscale HiFST as described in Section 2.1 where the image is now replaced with the gradient magnitude image . We compute and as described in Section 2.1, where . To compute our proposed blur detection map, we consider only the first layers. Based on our experiment and observation, using the first layers1 of the HiFST provides sufficient information to compute the blur map. Our proposed blur detection map, , is computed as follows:
| (9a) | |||
| where denotes the Hadamard product of matrices and whose elements are given by: | |||
| (9b) | |||
| (9c) | |||
where denotes a patch centered at pixel , and denotes a probability function. From Eqs. (9b) and (9c), it can be seen that is obtained by max pooling, and is obtained by computing the local entropy map of , using a neighborhood around the corresponding pixel in (in our implementation, we use )111 The selection of this value is not critical. The results are very close when the value is chosen within a range.. The entropy map () is used as a weighting factor to give more weight to the salient regions in the image. The final blur map is smoothed using edge-preserving filters [11] to suppress the influence of outliers and preserve boundaries.

We further extend our proposed algorithm to estimate the camera focus points map. The camera focus points map shows the focus points of the camera while taking a photo. Intuitively, this region should have the highest intensity in the blur detection map. We compute the camera focus points map by as follows:
| (10) |
where denotes the camera focus points map and is a Gaussian smoothed version of , normalized between [0,1]. In our experiment, we set the threshod value, , to 0.98.1
3 Results
In this section we evaluate the performance of our proposed method, HiFST, quantitatively and qualitatively. Here we show that our proposed method outperforms the existing algorithms in terms of both quantitative and qualitative results regardless of the blur type. Moreover, we evaluate the robustness of our method to different types and levels of distortions.

For quantitative comparison, we evaluate our method on a variety of images with different types and amount of blur provided in dataset [26] and compare our results with state-of-the-art algorithms [1, 3, 20, 26, 27, 28, 31, 32, 36, 43]. Figure 7 shows the precision-recall curve for the blur dataset [26], which consists of 296 images with motion blur and 704 images with defocus blur. In our experiment, we binarized the blur detection map by varying the threshold within the range [0, 255]. Our proposed method achieves the highest precision within the entire recall range [0, 1], which conveys its potential for different levels and types of blur.
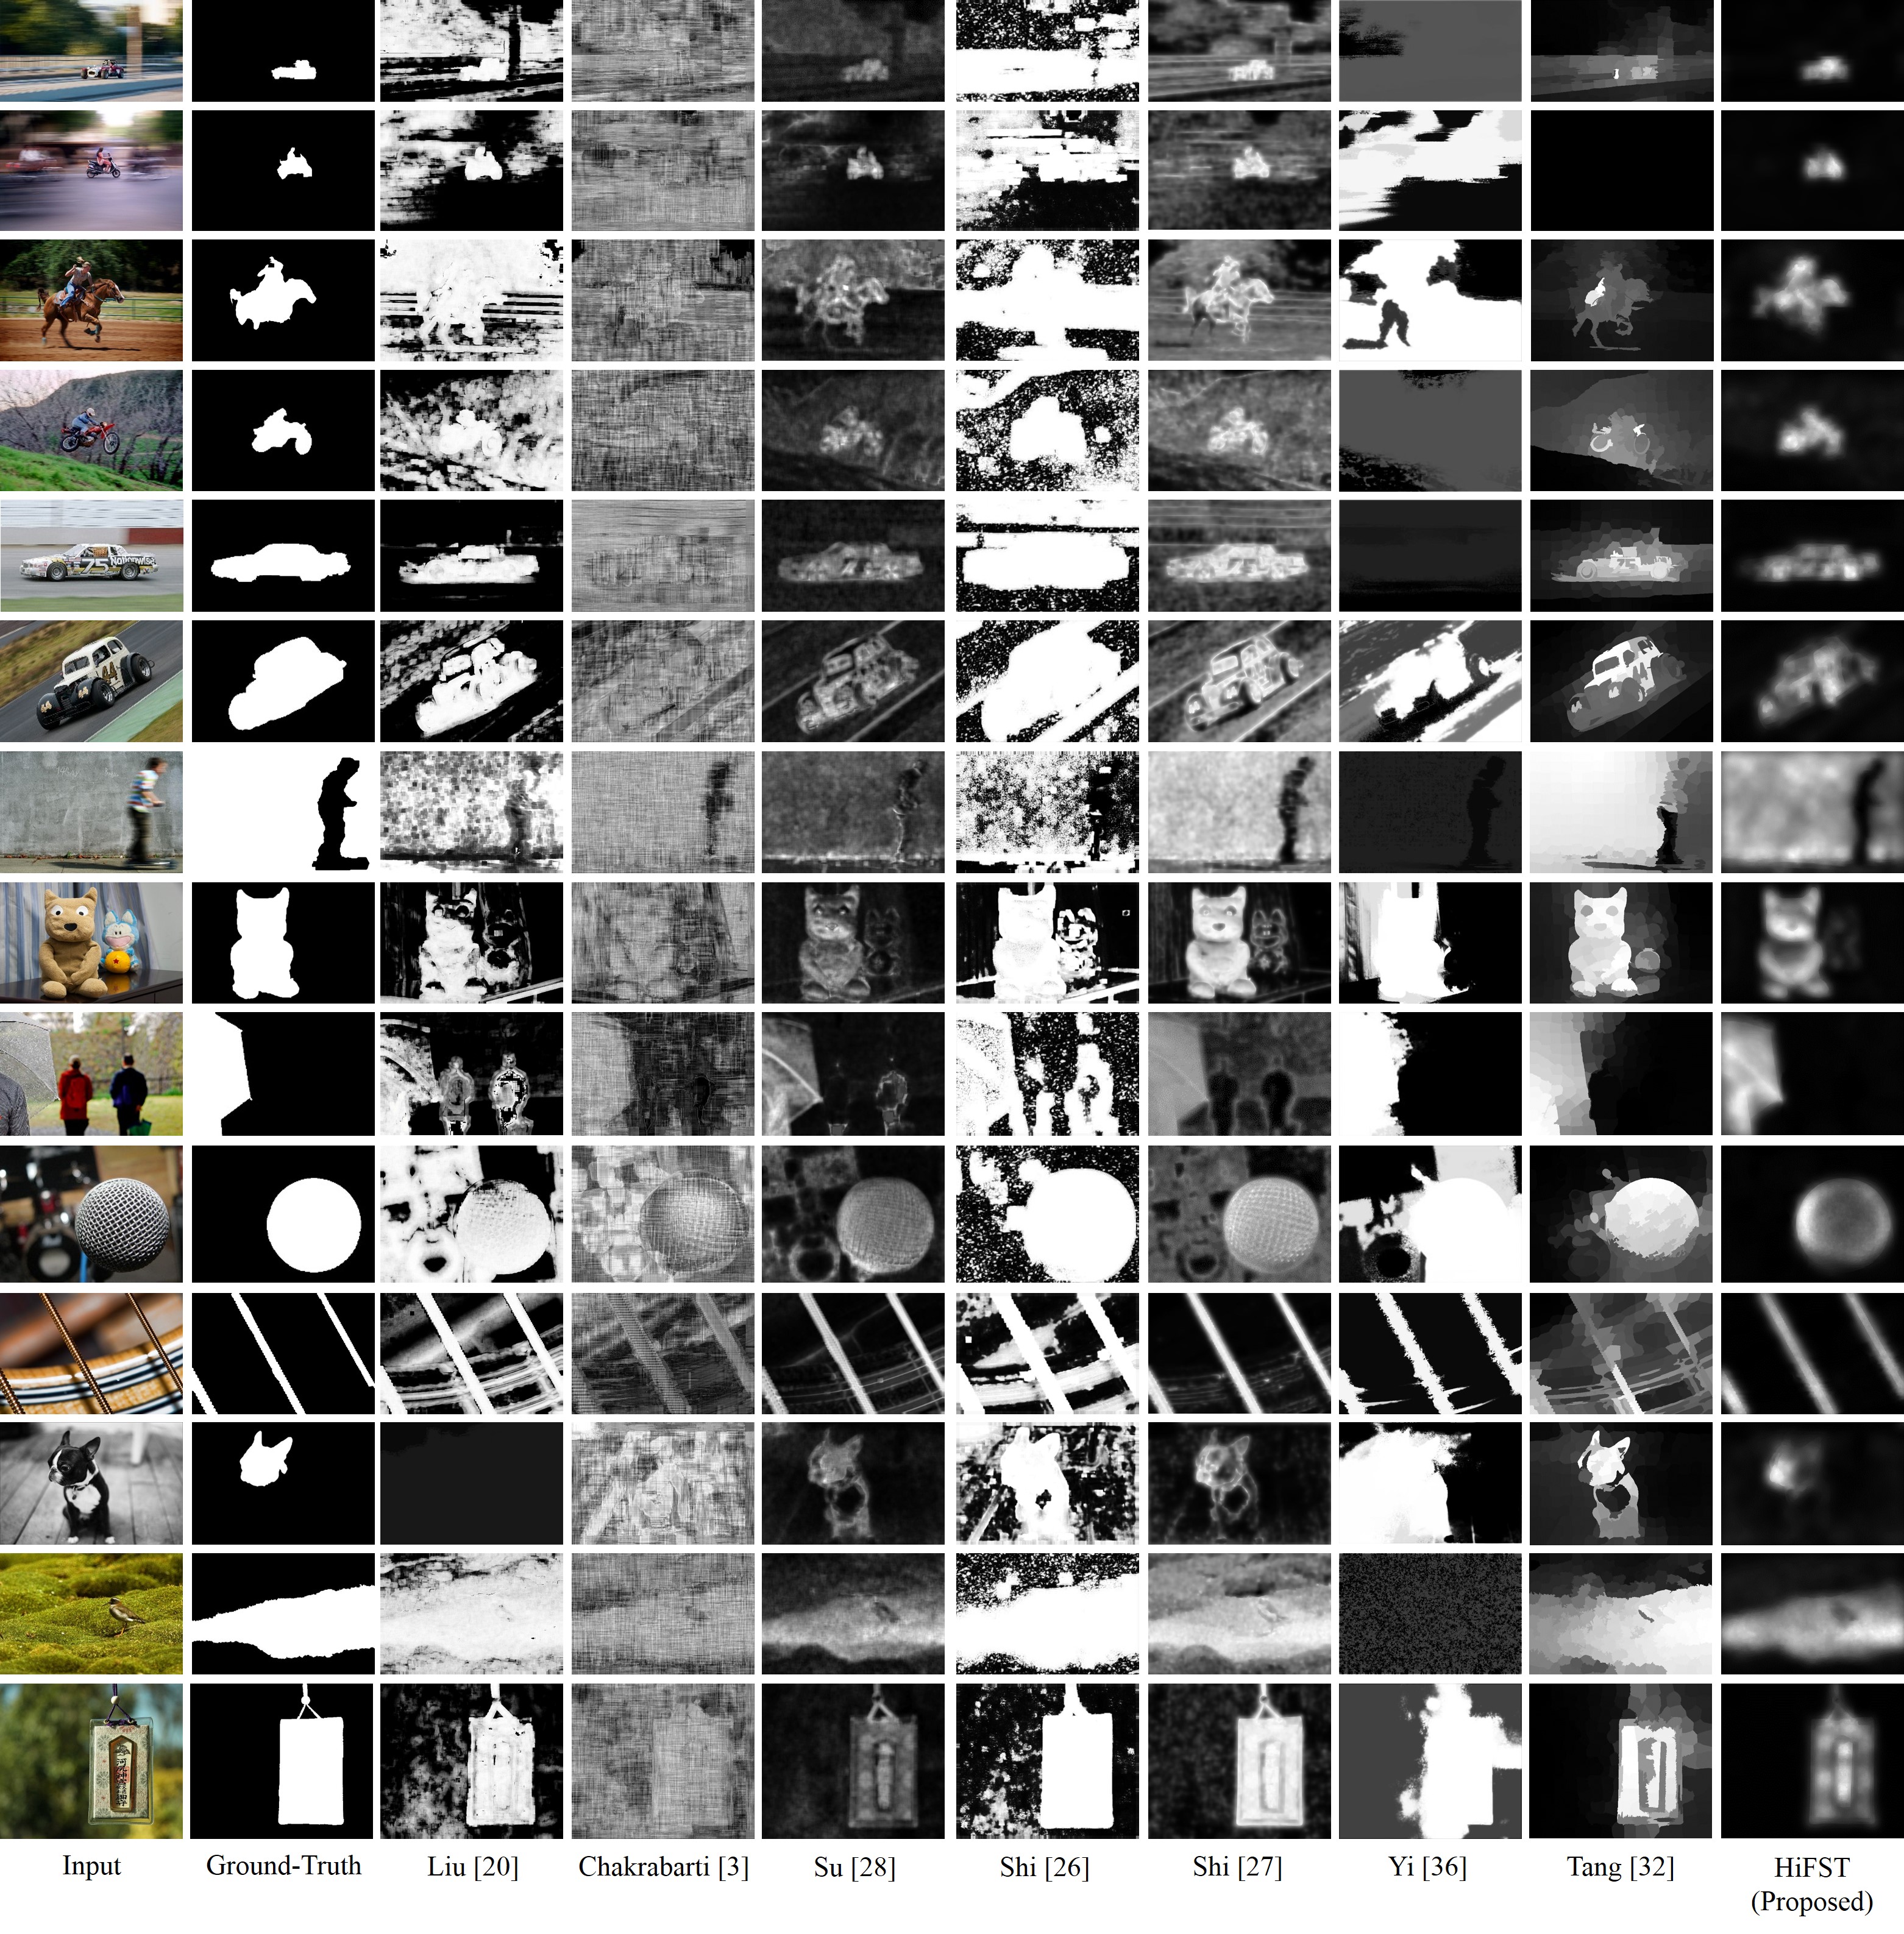
In Figure 8, we evaluate the performance of our method qualitatively on images provided in [26, 27] with different contents as well as different types and levels of blur, in which we added zero-mean Gaussian noise with to take into account the camera noise. Although the amount of noise is not easily noticeable by human eyes, it simulates the practical camera noise case. We evaluate the performance of the proposed algorithm against the state-of-the-art methods [3, 20, 26, 27, 28, 32, 36]222More visual results as well as our MATLAB code are available at: http://ivulab.asu.edu/software.. In the provided maps, the unblurred regions have higher intensities than the blurred ones. As shown in Figure 8, our proposed method can handle different types of blur and can distinguish between the blurred and unblurred regions effectively. Algorithms [3, 36] dramatically failed due to their sensitivity to the noise or type of blur. Moreover, although algorithms [20, 26, 27, 28, 32] can detect the blur map for some of the images, their detected maps include incorrectly labeled regions compared to the ground-truth. In contrast, our proposed method can distinguish between the blurred and unblurred regions with high accuracy regardless of the blur type.

Furthermore, Figure 9 (a) demonstrates the effectiveness of our multiscale approach by comparing it to just using one single scale. We evaluate the precision-recall curves resulting from our method when it just uses one scale at a time () and compare it to our final multiscale method. As shown in Figure 9 (a) employing all the scales leads to the best results. Furthermore, to validate the robustness of our method qualitatively and quantitatively, we test our method on dataset [26] while adding zero-mean Gaussian noise with different densities to the input images. In our experiment the variance () of the noise is varied between zero to . As shown in Figure 9(b), the resulting precision-recall curves in the presence of noise with are almost the same. By adding noise with larger variances, and , the precision-recall curves show only a slight drop in performance as compared to the noise-free case and show that the proposed method still achieves competitive results.
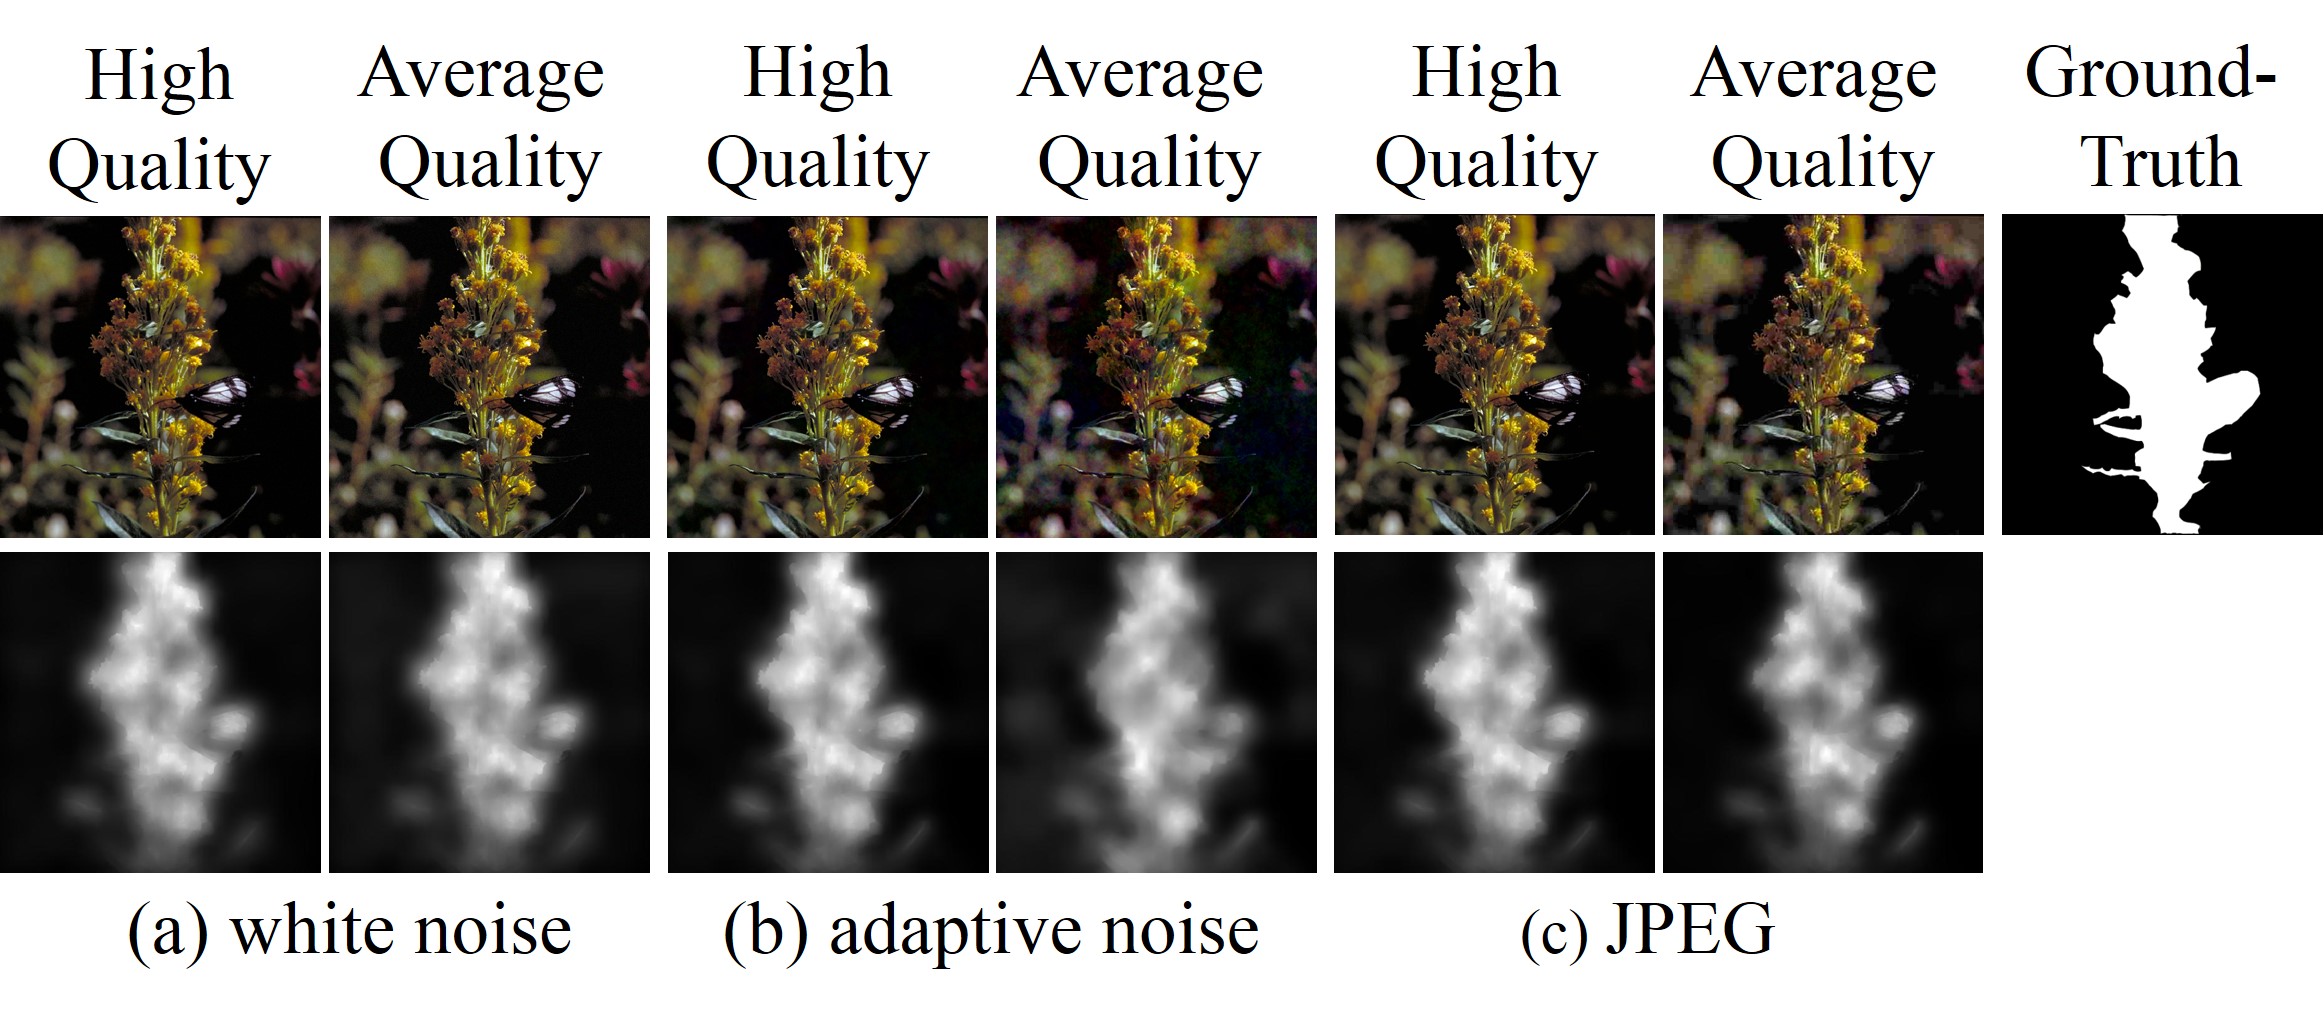
In Figure 10, we evaluate the robustness of our method qualitatively on images from the Categorical Image Quality (CSIQ) database[18] with different types and levels of distortions, such as zero-mean Gaussian noise, adaptive noise, and JPEG. As shown in Figure 10, our proposed method has the capability of estimating the blur map for distorted images.
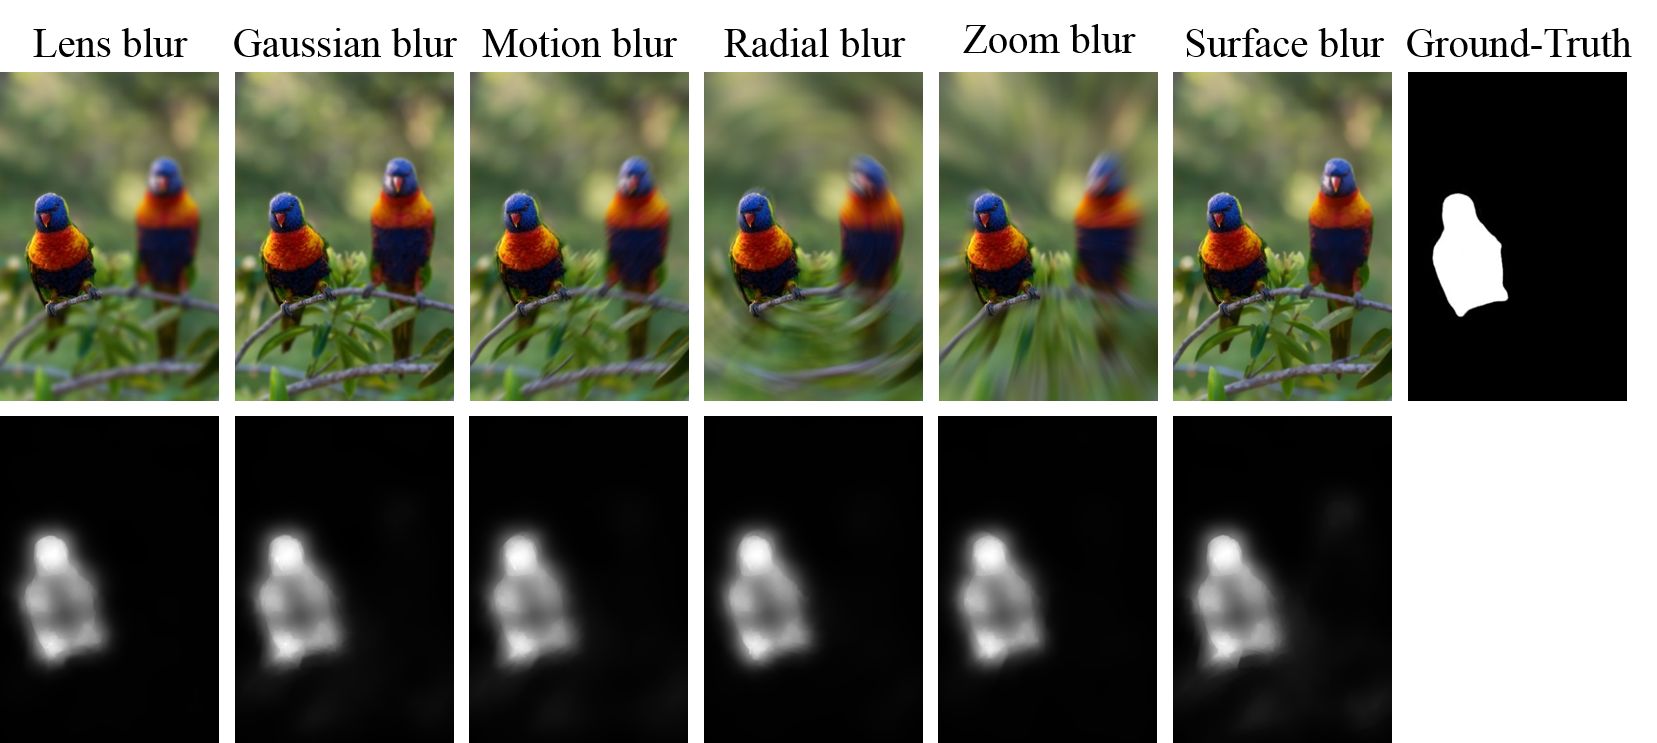
Finally, to further demonstrate the performance of our proposed method for different blur types, we test our algorithms on 6 synthetic examples of an image with different types of blur on the background region, such as lens, Gaussian, motion, radial, zoom, and surface blur. As shown in Figure 11, our proposed method can handle all these blur types accurately compared to the ground-truth.
4 Applications
In this section, we demonstrate the use of our proposed blur detection map in a few applications, such as blur magnification, deblurring, depth of field (DOF), depth from focus (DFF), and camera focus points estimation.
4.1 Blur Magnification
Given the estimated blur map, we can perform blur magnification [1]. Blur magnification increases the level of blur in out-of-focus areas and makes the image have a shallower DOF. Therefore, the in-focus object would be highlighted more. Figure 12 shows examples of blur magnification by using our detected blur map.
4.2 Deblurring
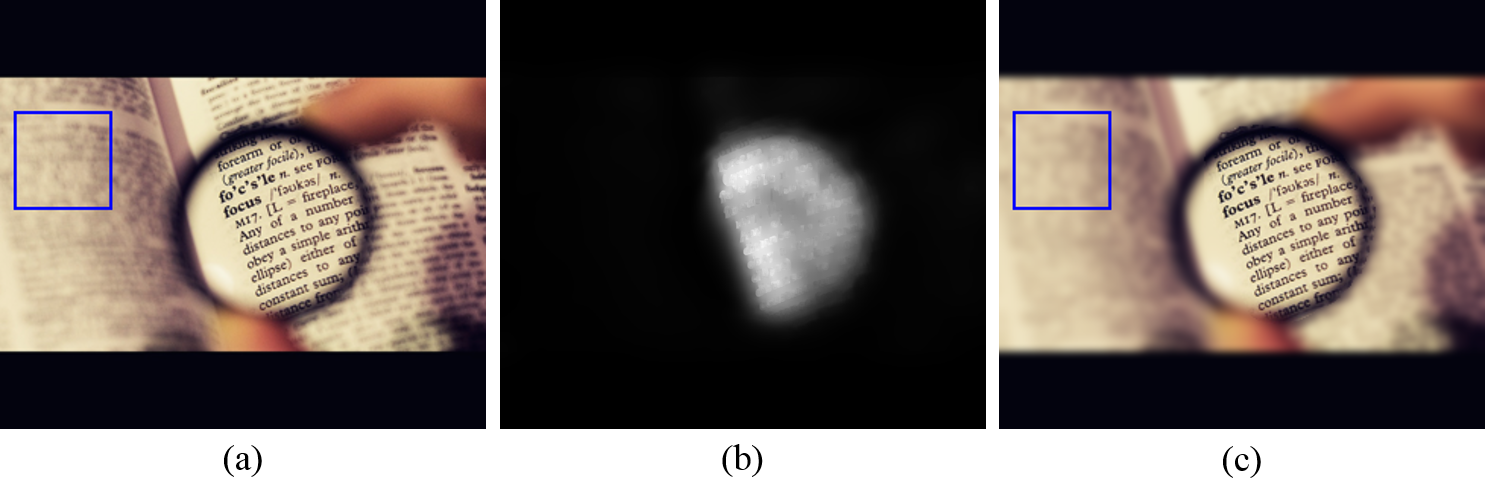
In Figure 13, we use our estimated blur map (Figure 13(b)) in the deblurring algorithm described in [25] and recover the clear image; Figure 13(c) represents the deblurring result.

4.3 Depth of field estimation
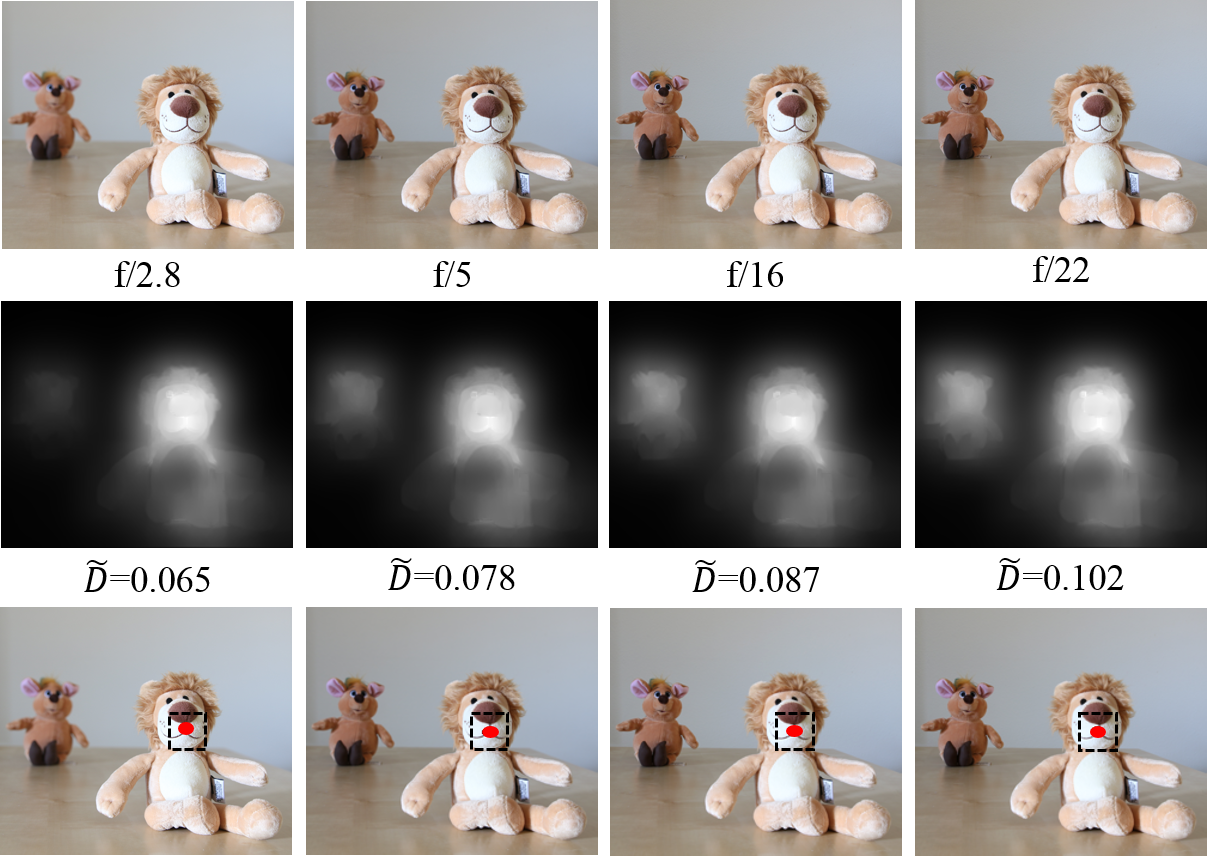
Depth of Field (DOF) refers to the area of the picture that is in-focus in an image. It is determined by three factors, including aperture size, distance from the lens, and the focal length of the lens. Let denote the median of the normalized blur map , and be used as an estimation for the DOF. In Figure 14, we provide four images which are taken with the same camera and distance from the objects. In our experiment, the camera focus is set to be on the face of the front object and the aperture size changes by choosing different f-stop, such as f/2.8, f/5, f/16, and f/22. As shown in Figure 14, by decreasing the aperture size (increasing the f-stop) the DOF increases and our blur map as well as change in a consistent way. Also as shown in the third row of Figure 14, the camera focus points map (red spot inside the square) for all the images stay consistent.
4.4 Depth from focus
In Figure 15, we provide the application of our proposed method for depth from focus (DFF). As shown in Figure 15, by changing the camera focus, our estimated blur maps change in a consistent way.

5 Conclusion
In this paper we have addressed the challenging problem of blur detection from a single image without having any information about the blur type or the camera settings. We proposed an effective blur detection method based on a high-frequency multiscale fusion and sort transform, which makes use of high-frequency DCT coefficients of the gradient magnitudes from multiple resolutions. Our algorithm achieves state-of-the-art results on blurred images with different blur types and blur levels. To analyze the potential of our method, we also evaluated it on images with different types of blur as well as different levels and types of distortions. Furthermore, we showed that the proposed method can benefit different computer vision applications including camera focus points map estimation, blur magnification, depth of field estimation, depth from focus, and deblurring.
References
- [1] S. Bae and F. Durand. Defocus magnification. In Computer Graphics Forum, volume 26, pages 571–579. Wiley Online Library, 2007.
- [2] A. Chakrabarti and T. Zickler. Depth and deblurring from a spectrally-varying depth-of-field. In European Conference on Computer Vision (ECCV), pages 648–661. Springer, 2012.
- [3] A. Chakrabarti, T. Zickler, and W. T. Freeman. Analyzing spatially-varying blur. In IEEE Conference on Computer Vision and Pattern Recognition (CVPR), pages 2512–2519, 2010.
- [4] D.-J. Chen, H.-T. Chen, and L.-W. Chang. Fast defocus map estimation. In IEEE International Conference on Image Processing (ICIP), pages 3962–3966, 2016.
- [5] F. Couzinie-Devy, J. Sun, K. Alahari, and J. Ponce. Learning to estimate and remove non-uniform image blur. In IEEE Conference on Computer Vision and Pattern Recognition (CVPR), pages 1075–1082, 2013.
- [6] S. Dai and Y. Wu. Removing partial blur in a single image. In IEEE Conference on Computer Vision and Pattern Recognition (CVPR), pages 2544–2551, 2009.
- [7] J. H. Elder and S. W. Zucker. Local scale control for edge detection and blur estimation. IEEE Transactions on Pattern Analysis and Machine Intelligence, 20(7):699–716, 1998.
- [8] P. Favaro and S. Soatto. A geometric approach to shape from defocus. IEEE Transactions on Pattern Analysis and Machine Intelligence, 27(3):406–417, 2005.
- [9] P. Favaro, S. Soatto, M. Burger, and S. J. Osher. Shape from defocus via diffusion. IEEE Transactions on Pattern Analysis and Machine Intelligence, 30(3):518–531, 2008.
- [10] J. Gast, A. Sellent, and S. Roth. Parametric object motion from blur. arXiv preprint arXiv:1604.05933, 2016.
- [11] E. S. Gastal and M. M. Oliveira. Domain transform for edge-aware image and video processing. 30(4):69–82, 2011.
- [12] X. Hou and L. Zhang. Saliency detection: A spectral residual approach. In IEEE Conference on Computer Vision and Pattern Recognition (CVPR), pages 1–8, 2007.
- [13] Z. Hu, L. Yuan, S. Lin, and M.-H. Yang. Image deblurring using smartphone inertial sensors. In IEEE Conference on Computer Vision and Pattern Recognition (CVPR), pages 1516–15125, 2016.
- [14] N. Joshi, R. Szeliski, and D. J. Kriegman. PSF estimation using sharp edge prediction. In IEEE Conference on Computer Vision and Pattern Recognition (CVPR), pages 1–8, 2008.
- [15] E. Kalalembang, K. Usman, and I. P. Gunawan. DCT-based local motion blur detection. In International Conference on Instrumentation, Communications, Information Technology, and Biomedical Engineering (ICICI-BME),, pages 1–6, 2009.
- [16] W.-S. Lai, J.-B. Huang, Z. Hu, N. Ahuja, and M.-H. Yang. A comparative study for single image blind deblurring. In IEEE Conference on Computer Vision and Pattern Recognition (CVPR), pages 1514–1523. IEEE, 2016.
- [17] G. C. Langelaar, I. Setyawan, and R. L. Lagendijk. Watermarking digital image and video data. a state-of-the-art overview. IEEE Signal Processing Magazine, 17 (5), 2000.
- [18] E. C. Larson and D. M. Chandler. Most apparent distortion: full-reference image quality assessment and the role of strategy. Journal of Electronic Imaging, 19(1):011006–011006, 2010.
- [19] A. Levin, Y. Weiss, F. Durand, and W. T. Freeman. Understanding and evaluating blind deconvolution algorithms. In IEEE Conference on Computer Vision and Pattern Recognition (CVPR), pages 1964–1971, 2009.
- [20] R. Liu, Z. Li, and J. Jia. Image partial blur detection and classification. In IEEE Conference on Computer Vision and Pattern Recognition (CVPR), pages 1–8, 2008.
- [21] X. Marichal, W.-Y. Ma, and H. Zhang. Blur determination in the compressed domain using DCT information. In International Conference on Image Processing (ICIP), volume 2, pages 386–390. IEEE, 1999.
- [22] J. Pan, Z. Hu, Z. Su, H.-Y. Lee, and M.-H. Yang. Soft-segmentation guided object motion deblurring. In IEEE Conference on Computer Vision and Pattern Recognition (CVPR), pages 1306–1313, 2016.
- [23] J. Pan, D. Sun, H. Pfister, and M.-H. Yang. Blind image deblurring using dark channel prior. In IEEE Conference on Computer Vision and Pattern Recognition (CVPR), pages 1306–1313, 2016.
- [24] A. P. Pentland. A new sense for depth of field. IEEE Transactions on Pattern Analysis and Machine Intelligence, (4):523–531, 1987.
- [25] C.-T. Shen, W.-L. Hwang, and S.-C. Pei. Spatially-varying out-of-focus image deblurring with L1-2 optimization and a guided blur map. In 2012 IEEE International Conference on Acoustics, Speech and Signal Processing (ICASSP), pages 1069–1072, 2012.
- [26] J. Shi, L. Xu, and J. Jia. Discriminative blur detection features. In IEEE Conference on Computer Vision and Pattern Recognition (CVPR), pages 2965–2972, 2014.
- [27] J. Shi, L. Xu, and J. Jia. Just noticeable defocus blur detection and estimation. In IEEE Conference on Computer Vision and Pattern Recognition (CVPR), pages 657–665, 2015.
- [28] B. Su, S. Lu, and C. L. Tan. Blurred image region detection and classification. In 19th ACM international conference on Multimedia, pages 1397–1400, 2011.
- [29] S. Suwajanakorn, C. Hernandez, and S. M. Seitz. Depth from focus with your mobile phone. In IEEE Conference on Computer Vision and Pattern Recognition (CVPR), pages 3497–3506, 2015.
- [30] Y.-W. Tai and M. S. Brown. Single image defocus map estimation using local contrast prior. In 2009 16th IEEE International Conference on Image Processing (ICIP), pages 1797–1800, 2009.
- [31] C. Tang, C. Hou, and Z. Song. Defocus map estimation from a single image via spectrum contrast. Optics letters, 38(10):1706–1708, 2013.
- [32] C. Tang, J. Wu, Y. Hou, P. Wang, and W. Li. A spectral and spatial approach of coarse-to-fine blurred image region detection. IEEE Signal Processing Letters, 23(11):1652 – 1656, 2016.
- [33] J. Z. Wang, J. Li, R. M. Gray, and G. Wiederhold. Unsupervised multiresolution segmentation for images with low depth of field. IEEE Transactions on Pattern Analysis and Machine Intelligence, 23(1):85–90, 2001.
- [34] L. Xu and J. Jia. Two-phase kernel estimation for robust motion deblurring. In European Conference on Computer Vision (ECCV), pages 157–170. Springer, 2010.
- [35] Q. Yan, L. Xu, J. Shi, and J. Jia. Hierarchical saliency detection. In IEEE Conference on Computer Vision and Pattern Recognition (CVPR), pages 1155–1162, 2013.
- [36] X. Yi and M. Eramian. LBP-based segmentation of defocus blur. IEEE Transactions on Image Processing, 25(4):1626–1638, 2016.
- [37] X. Zhang, R. Wang, X. Jiang, W. Wang, and W. Gao. Spatially variant defocus blur map estimation and deblurring from a single image. Journal of Visual Communication and Image Representation, 35:257–264, 2016.
- [38] Y. Zhang and K. Hirakawa. Blur processing using double discrete wavelet transform. In IEEE Conference on Computer Vision and Pattern Recognition (CVPR), pages 1091–1098, 2013.
- [39] C. Zhou, O. Cossairt, and S. Nayar. Depth from diffusion. In IEEE Conference on Computer Vision and Pattern Recognition (CVPR), pages 1110–1117, 2010.
- [40] C. Zhou, S. Lin, and S. Nayar. Coded aperture pairs for depth from defocus. In IEEE 12th International Conference on Computer Vision (ICCV), pages 325–332, 2009.
- [41] T. Zhu and L. J. Karam. Efficient perceptual-based spatially varying out-of-focus blur detection. In IEEE International Conference on Image Processing (ICIP), pages 2673–2677, 2016.
- [42] X. Zhu, S. Cohen, S. Schiller, and P. Milanfar. Estimating spatially varying defocus blur from a single image. IEEE Transactions on Image Processing, 22(12):4879–4891, 2013.
- [43] S. Zhuo and T. Sim. Defocus map estimation from a single image. Pattern Recognition, 44(9):1852–1858, 2011.