Bond patterns and charge order amplitude in -filled charge-transfer solids
Abstract
Metal-insulator transition accompanied by charge-ordering has been widely investigated in quasi-one-dimensional conductors, including in particular organic charge-transfer solids. Among such materials the -filled band charge-transfer solids are of strong interest, because of the commensurate nature of the charge-ordering in these systems. The period-four charge-order pattern 1100 here is accompanied by two distinct bond distortion patterns, giving rise to bond-charge-density waves (BCDW) of types 1 and 2. Using quantum Monte Carlo methods, we determine the phase diagram within the extended Hubbard Hamiltonian that gives both types 1 and 2 BCDW in the thermodynamic limit. We further investigate the effect of electron-electron and electron-phonon interactions on the amount of charge disproportionation. Our results show that between these two bond patterns, one (BCDW2) in general coexists with a large magnitude charge order, which is highly sensitive to electron-phonon interactions, while the other (BCDW1) is characterized by weak charge order. We discuss the relevance of our work to experiments on several -filled conductors, focusing in particular on the materials (EDO-TTF)2X and (DMEDO-TTF)2X with large amplitude charge-order.
pacs:
71.10.Fd, 71.45.Lr, 74.70.KnI Introduction
Molecular charge transfer solids (CTS) are widely studied because of their many complex electronic states. Small structural changes can lead to very different electronic behaviors. These effects have been studied extensively in the quasi-one dimensional CTS, in particularly for the -filled (with density holes per molecule) materials (TMTSF)2X and (TMTTF)2X, which become superconducting under the application of pressure.
The ground state of a one dimensional (1D) system of electrons with coupled lattice degrees of freedom is an insulating Peierls state. Quite generally at the ground state is a bond-charge density wave (BCDW) with coexisting charge order (CO) and bond distortion and can be described by a Hamiltonian with electron-electron (e-e) and electron-phonon (e-p) interactions Ung et al. (1994); Clay et al. (2003); Mazumdar et al. (2000). Experimentally, the properties of BCDWs in quasi-1D CTS are observed to vary widely. In systems with type 1 BCDW, hereafter BCDW1, there occur two distinct transitions, a high temperature (100 K) metal-insulator (MI) transition followed by a low temperature (T 20 K) magnetic transition to a spin-gapped or antiferromagnetic state that coexists with CO with weak amplitude (we define the amplitude of the CO as the difference in charge densities between the charge-rich and charge-poor molecular sites.) The most well known examples of BCDW1 systems are in the (TMTTF)2X family. Systems with type 2 BCDW, hereafter BCDW2, are less widely known. There occurs a single MI transition in these systems which is accompanied by both a charge gap and a spin gap. Experimentally determined CO amplitudes in these cases are rather large Clay et al. (2012). One member of the BCDW2 family is (EDO-TTF)2PF6, where the MI transition temperature is 280 K and the CO amplitude is known to be approximately 0.9:0.1
Ota et al. (2002); Drozdova et al. (2004); Aoyagi et al. (2004). The large CO amplitude has led to suggestions that interactions beyond e-e and e-p, such as molecular bending Tsuchiizu and Suzumura (2008) or electronic polarization effects Iwano and Shimoi (2008) are the driving forces behind the MI transition. Yet another system that belongs to this class is (DMEDO-TTF)2X, X = ClO4 and BF4, where also there occurs a single MI transition that opens both a charge and spin gap simultaneously. It has been suggested that anion ordering drives the transition here Kumeta et al. (2016). The CO amplitude is currently unknown. One goal of our work is to show that both BCDW1 with small CO amplitude and BCDW2 with large CO amplitude can be understood within the same one-dimensional fundamental theoretical model, albeit within different parameter regions. The observed molecular bending Tsuchiizu and Suzumura (2008) as well as cation-anion interactions Kumeta et al. (2016) are consequences and not the driving forces behind the co-operative transitions.
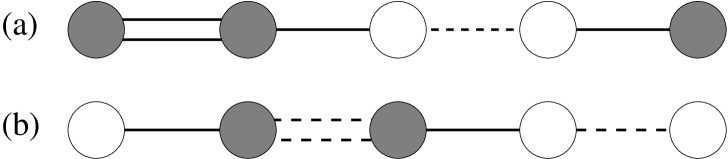
The bond distortion patterns corresponding to BCDW1 and BCDW2 are shown in Fig. 1. In both the charge density follows the pattern 1100, where 1 (0) indicates a molecule with charge density 0.5+ (0.5-). In BCDW2 (Fig. 1(a)) the strongest bond is between the two large charge densities (within the dimer), and the hopping integrals follow the pattern strong-medium-weak-medium (SMWM). In BCDW1 (Fig. 1(b)), the pattern of hopping integrals in the ground state is instead strong-weak-strong-weak′ (SWSW′) in Fig. 1(b)), where the W′ bond is slightly weaker than the W bond.
In this paper we perform a systematic numerical study of these two states, with a goal of fully determining the phase diagram as well as BCDW order parameters (amplitude of the CO and bond distortion) in the thermodynamic limit. We show that larger charge disproportionation coexists with BCDW2, with magnitudes that are consistent with experimental results. On the other hand, for BCDW1, we show that the CO amplitude is significantly smaller.
II Results
A well established minimal model for the 1D CTS is the 1D Peierls-extended Hubbard model,
| (1) | |||||
In Eq. 1, () creates (annihilates) an electron of spin on site , =, and =. is the deviation of the bond between sites and from its equilibrium length and is the inter-site e-p coupling with spring constant . Intra-molecular distortions on each molecule are parameterized by the phonon coordinate ; is the intra-site e-p coupling with its corresponding spring constant. and are the onsite and nearest-neighbor Coulomb interactions respectively. We give energies in units of .
At -filling (), charge- and bond-ordering at 2kF (period four) or 4kF (period two) dominate. The occurrence of 4kF CO requires , where the critical valueMila and Zotos (1993) in the limit but is larger than for finite (see Fig. 3). In applying Eq. 1 to the 1D CTS, it is also expected that , based on comparison to 1D CTS Clay et al. (2007). Here we restrict our analysis to regions of the phase diagram with and . Throughout this region bond ordering is in general a mixture of period four and period two distortions. A general form for can be written as Ung et al. (1994)
| (2) |
where is the overall amplitude of the bond distortion, and are the amplitude of 2kF and 4kF components respectively, and and their phases.
Exact diagonalization solutions of Eq. 1 have found several possible BCDW states Ung et al. (1994); Clay et al. (2003). In the region of phase space we consider two different BCDW solutions are found, shown schematically in Fig. 1(a) and (b) and labeled BCDW2 and BCDW1 below. Note that a second 2kF charge pattern, 2000 is also possible, but only in the limit of very weak e-e interactionsUng et al. (1994); we will not consider it here.
.
II.1 Phase diagram
While several previous works have demonstrated the presence of BCDW2 and BCDW1 in small-lattice exact diagonalization calculations, the parameter regions of these two phases have not been mapped out in the thermodynamic limit. Here we determine the phase boundary between the BCDW2 and BCDW1 in the limit of e-p coupling, i.e. the phase boundaries that occur unconditionally for a given and in the thermodynamic limit.
In Eq. 2 the phase angles for both BCDW states areUng et al. (1994) and . While BCDW2 is nearly a pure 2kF bond distortion, BCDW1 requires a significant 4kF component. The minimum in Eq. 2 for the BCDW1 pattern occurs when the ‘S’ and ‘W′’ bonds are of equal strength. From this one can derive the condition that in the BCDW1 phase Ung et al. (1994); not . Further assuming the normalization , this implies for BCDW1.
The tendency to bond distortion at a wavevector is measured by the bond susceptibility Hirsch and Scalapino (1984), , defined as
| (3) |
In Eq. 3, where and . is the inverse temperature and the number of sites. The BCDW2/BCDW1 phase boundary corresponds to a specific ratio of 4kF to 2kF bond distortion and may therefore in the limit of e-p phonon coupling be determined by comparing and . The discrete Fourier transform of with respect to is at and at . Therefore, in the limit of e-p coupling and the BCDW1 phase will occur when . The bond distortion changes smoothly between the two phases without any discontinuity in the bond distortion or other observables.
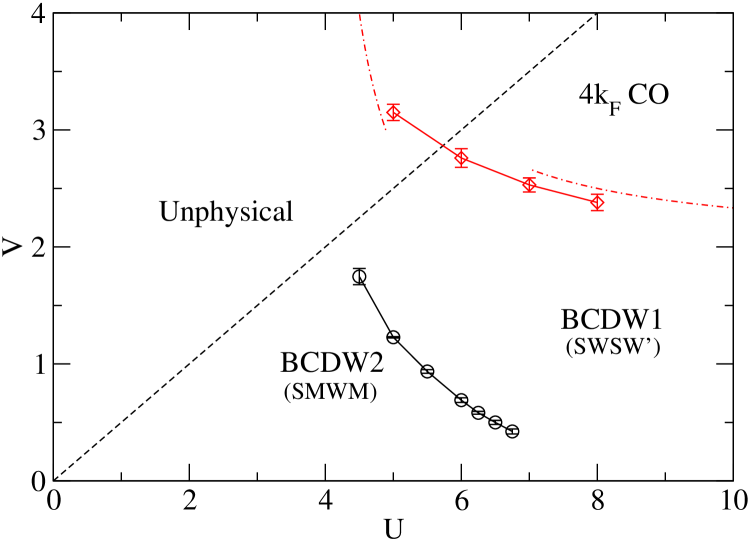
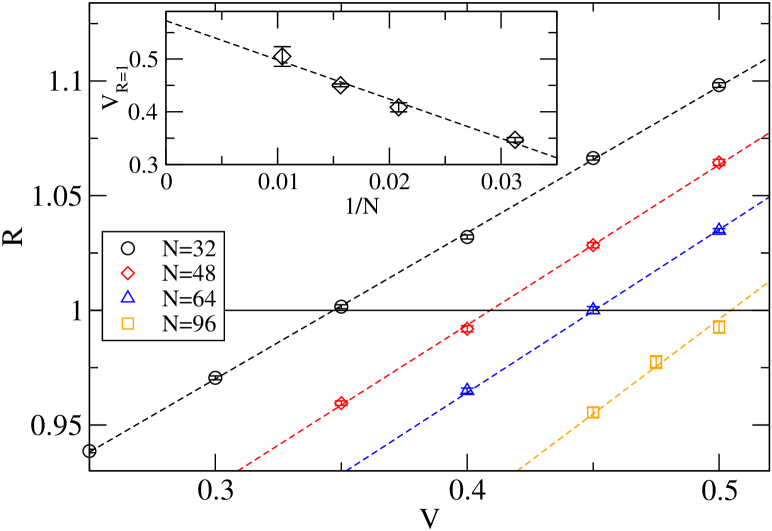
We use the Stochastic Series Expansion (SSE) quantum Monte Carlo method with directed loop updates to calculate Sandvik (1992); Syljuasen and Sandvik (2002). SSE is free from the Fermion sign problem in 1D and provides exact (within statistical errors) results at finite temperatures. We calculated the ratio for periodic systems of 32, 48, 64, and 96 sites with an inverse temperature of , which is a low enough temperature to give essentially ground state results. increases with increasing ; for each system size, the where was determined keeping fixed, as shown in Fig. 2. We then performed a finite-size scaling using a linear fit of the transition points to ; a typical fit is shown in the inset of Fig. 2. Fig. 3 shows the complete phase diagram in the (,) plane. In Fig. 3 we also include the boundary for the 4kF CO phaseMila and Zotos (1993) from Reference Clay et al., 2003, which are determined from the condition that the Luttinger Liquid exponent , indicating dominant 4kF charge fluctuations Voit (1995). The dot-dashed lines in Fig. 3 are the result of second order perturbation theory about the and limits Mila and Zotos (1993); Lin et al. (2000). In the rest of the paper we focus on the regions of the phase diagram occupied by BCDW1 and BCDW2. The phase boundary between 4kF CO and BCDW1 has been discussed extensively in our previous work Clay et al. (2003, 2007).
II.2 Charge order amplitude

We define the amplitude of the CO as n = - , where and are the charge densities on the charge-rich and charge-poor molecules. n is of great experimental interest and can be measured optically Dressel et al. (2012) and by NMR Zamborszky et al. (2002). Theoretically, n is difficult to predict from Eq. 1, as it depends on the precise values of the e-p coupling constants and which are difficult to estimate.
In the limit of , the 2kF charge susceptibility () is defined as in Eq. 3 with replaced by ) decreases with increasing Hirsch and Scalapino (1983), implying that is smaller in BCDW1 compared to BCDW2. In Fig. 4 we show as a function of calculated along the line which crosses the BCDW2/BCDW1 boundary. Fig. 4 shows that differences in e-e correlation alone can account for approximately a factor of four in the magnitude of between the most weakly-correlated CTS salts compared to those with strong e-e correlations, assuming equal e-p coupling strengths.
To calculate n in Eq. 1 with e-p interactions, we use a zero temperature variational quantum Monte Carlo using a matrix-product state basis (MPS-QMC) Sandvik (2008); Clay et al. (2012). Matrix-product states are extremely efficient for representing the wavefunctions of interacting 1D quantum systems. The MPS-QMC method variationally optimizes the MPS matrices from random starting values using stochastic optimization Sandvik (2008). One advantage of MPS-QMC is that periodic systems can be easily treated. Further details of the method are given in Reference Clay et al., 2012. To handle the e-p degrees of freedom self-consistently, in Eq. 1 is taken to be of the form of Eq. 2 with fixed and . Fixing the bond distortion to this form is reasonable provided and are restricted to the BCDW2/BCDW1 region of the phase diagram—i.e. not too close to the 4kF CO region. are taken with a constant magnitude and a fixed pattern giving 1100 CO. Self-consistency equations for , , and are determined from Clay et al. (2003)
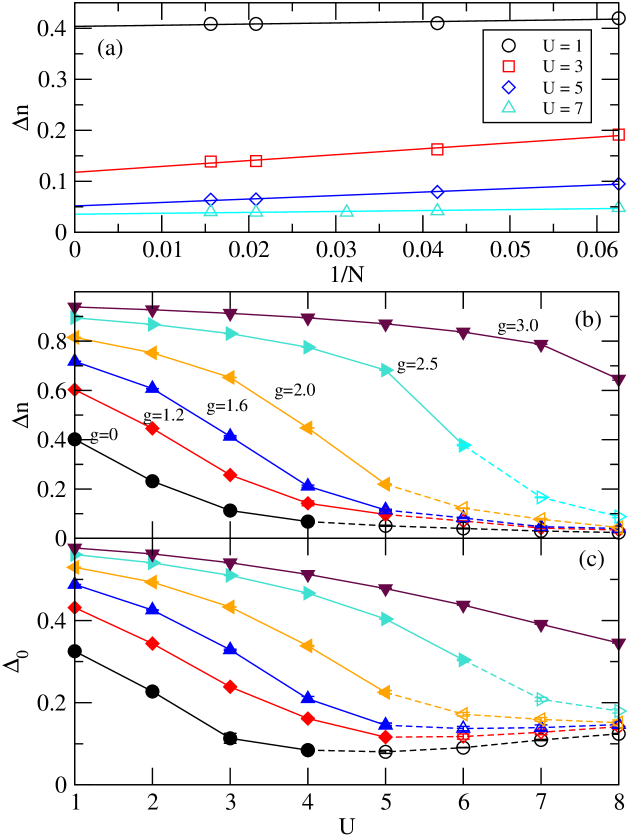
For the results presented here, matrix dimensions of up to 32 were used (see Reference Clay et al., 2012). We used chain lengths from 16 up to 64 sites and finite-size scaled the results using linear extrapolation in ; Fig. 5(a) shows typical finite-size extrapolations for the case and .
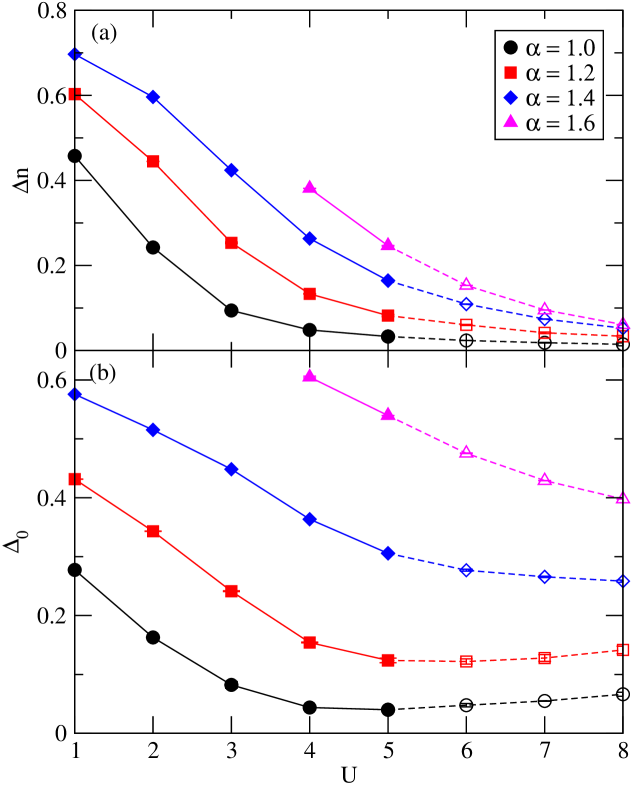
The intra-site e-p interaction couples directly to the charge density and affects strongly. We first choose a fixed and vary in Eq. 1. Figs. 5(b) and (c) summarize the results of these calculations. For , versus has a very similar functional shape as the 2kF charge susceptibility in Fig. 4, confirming that e-e interactions strongly affect . The maximum for is at small . As seen in Figs. 5(b) and (c), the bond pattern switches to BCDW1 at , which is consistent with the phase diagram in Fig. 3.
As shown in Fig. 5(b), in the BCDW2 phase, is strongly enhanced by up to nearly complete charge transfers of . BCDW1 however is characterized by small for all , which for most parameters choices is . While in general weaker e-e correlations coincide with larger , Fig. 5 shows that as increases the phase boundary between BCDW2 and BCDW1 moves to larger and (i.e. the BCDW2/BCDW1 phase boundary in Fig. 3 moves towards the 4kF CO phase with increasing ). Fig. 5 also shows that large enough suppresses the BCDW1 phase altogether. It is also possible that large in combination with and near the 4kF CO phase results in 1010 CO Clay et al. (2003).
Importantly, at large , the strength of the bond distortion behaves differently from . While the amplitude of the CO decreases continuously as the strength of e-e interactions increases, Fig. 5(c) shows that for weaker e-p interactions, the overall bond distortion strength first reaches a minimum at and then increases again for larger . The reason for this apparently counter-intuitive behavior is that while the 2kF bond distortion decreases with increasing , the 4kF distortion increases with (and ), causing the increase in .
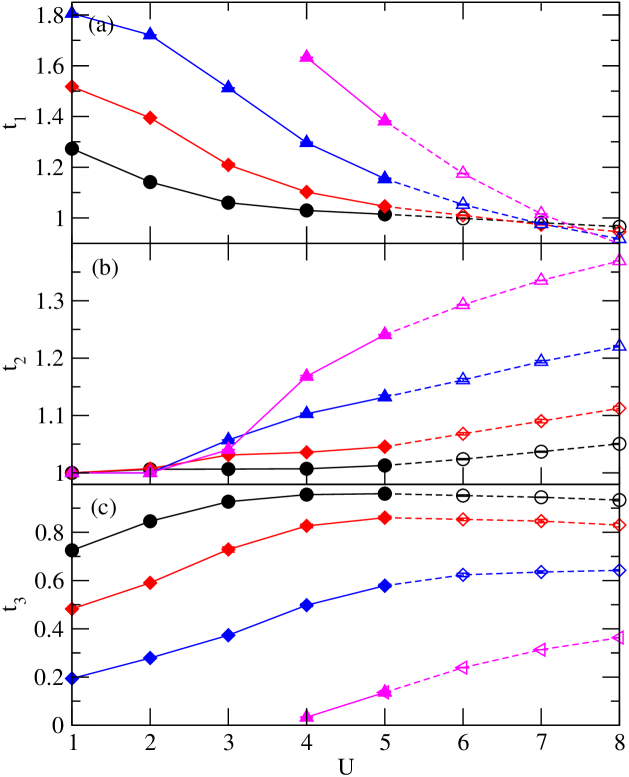
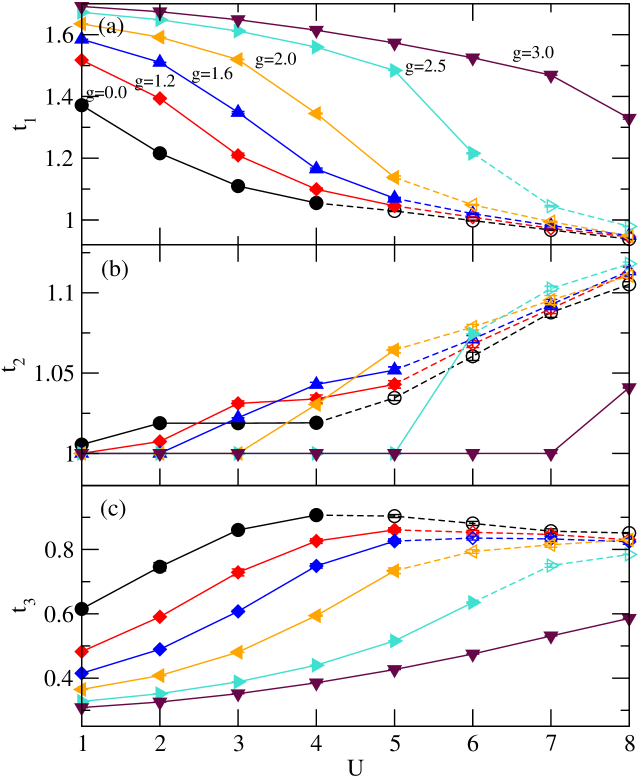
In the interest of comparing with experimental data, in Fig. 6 we show the actual hopping integrals. Corresponding to the charge order pattern we define the ‘11’ bond as , the ‘10’ and ‘01’ bonds as and the ‘00’ bond as , respectively. In the BCDW2 pattern SMWM, is the strong S bond, the M bond, and the W bond. In the BCDW1 pattern SWSW′, is the W′ bond, the S bond, and the W bond. The decrease in in Fig. 6(a) and the simultaneous increase in in Fig. 6(b) are signatures of the crossover from BCDW2 to BCDW1 with increasing .
In Fig. 7 we show the result of varying the inter-site e-p coupling . Unlike , can only be varied over a relatively small range. For finite systems a minimum value of is required for the lattice distortion to occur. For too large the linear e-p coupling in Eq. 1 leads to a negative bond order for the weakest bonds indicating a failure of the linear coupling assumption (this occurs for and in Fig. 7) Clay et al. (2003). Fig. 7 shows that varying has a similar effect to varying : stronger e-p coupling can enhance strongly in the BCDW2 region, and at the same time moves the system towards the BCDW2 phase. Fig. 8 further shows the hopping integrals in this case. Increasing can strongly increase the amplitude of the bond distortion in BCDW1 (see strong increase in Fig. 8(b)), however remains small.
Summarizing our data, in the BCDW2 region can have any value up to depending on the e-e and e-p interaction strengths. However, regardless of the choice of e-e interactions and e-p coupling strength, in the BCDW1 region is always small—the maximum in all of our calculations was . More typically in the BCDW1 region is in the range 0.05 0.1.
III Discussion
III.1 BCDW2
Below we discuss two families of CTS whose low-temperature insulating states show the BCDW2 bond pattern, (EDO-TTF)2X (X = PF6 and AsF6) and (DMEDO-TTF)2X (X = ClO4 and BF4). In each of these materials the MI transition has been attributed to different effects, such as e-p and coupled molecular bending Tsuchiizu and Suzumura (2008) or electrical potential bias Iwano and Shimoi (2008) in (EDO-TTF)2X, and anion ordering in (DMEDO-TTF)2X Kumeta et al. (2016). We argue that these are instead cooperative effects, which are particularly obvious due to the large magnitude of and bond distortion found in BCDW2. We expect that other 1D CTS with the BCDW2 distortion will show similarly strong effects at the MI transition. While these secondary effects will enhance the amplitude of the BCDW, they are not the principal driver of the transition, which is instead the underlying tendency to distortion of the quasi-1D electron system. The features common to BCDW2 are clearly seen by comparing (EDO-TTF)2X and (DMEDO-TTF)2X, which show the same molecular stack distortion but quite different secondary effects.
(EDO-TTF)2X: In (EDO-TTF)2X the MI transition is first order and occurs at 280 K and 268 K for X=PF6 and AsF6, respectively Ota et al. (2002). A third salt, X=ClO4, has an even higher transition temperature, greater than 337 K Ota et al. (2003). In (EDO-TTF)2PF6 the experimentally estimated CO amplitude is rather large, with estimates of from optical measurements of 0.92 (=6 K) Drozdova et al. (2004) or from X-ray measurements of 0.6 (260 K) Aoyagi et al. (2004). Above the transition, the molecular overlaps along the EDO-TTF stacks are nearly uniform with only a slight dimerization Ota et al. (2002). Below the transition the overlap integrals follow the pattern SMWM Ota et al. (2002).
Several observations indicate that intra-site e-p interactions are strongly involved in the MI transition. At the transition, the EDO-TTF molecules bend significantly Ota et al. (2002), with the dihedral angles changing by more than 5∘. The position of the anions also shift, with a periodic modulation that matches that of the EDO-TTF stacks Ota et al. (2002). Optical studies of (EDO-TTF)2X have suggested that the observed high sensitivity to photoexcitation is likely due to strong electron-lattice coupling Chollet et al. (2005).
(DMEDO-TTF)2X: Here the MI transition is at 190 K and 210 K for X=ClO4 and BF4, respectively Fabre et al. (1995); Kumeta et al. (2016). Above the MI transition the organic molecules are stacked uniformly, and like (EDO-TTF)2X the low temperature overlap integrals are in the SMWM pattern Kumeta et al. (2016). Simultaneously with the stack distortion, the anion positions shift, moving closer (further) towards molecules with large (smaller) hole density. The authors of Reference Kumeta et al., 2016 ascribe the MI transition to anion ordering, as in (TMTSF)2ClO4. Note, however, that in contrast to (TMTSF)2ClO4 there is no simple rotational ordering of the ClO4 anion in (DMEDO-TTF)2ClO4. Rather the Cl atom of the ClO4 group moves towards and away from charge-rich and charge-poor molecules, which is a simple electrostatic effect. While estimated from carbon-carbon bond lengths appears to be small (this method of estimating CO amplitude however has large errors) Kumeta et al. (2016), we predict that optical measurements will find large in this material.
To obtain the large found in (EDO-TTF)2X, our results of Section II show that large intra-site e-p coupling (and moderate or small e-e correlations) are required. The strong coupling to molecular bending in (EDO-TTF)2X shows that intra-molecular modes are coupled strongly in this case. Similarly, the large will lead to large potential energy differences Iwano and Shimoi (2008). In both (EDO-TTF)2X and (DMEDO-TTF)2X, electrostatic effects will shift the position of the anions.
III.2 BCDW1
As we have considered the thermodynamics of materials with the BCDW1 distortion in previous works Clay et al. (2003, 2007), we will not discuss them in detail here. The BCDW1 state can be visualized as a second dimerization of a dimer lattice. In this case two thermodynamic transitions are expected, with the intermediate temperature state having either dimerization or 4kF CO Clay et al. (2003, 2007). What the present calculations show is that in the ground state, the expected CO amplitude in BCDW1 is quite small and may be difficult to detect experimentally. This should also be taken into consideration in searches for CO in two dimensional CTS Sedlmeier et al. (2012). To detect the presence of BCDW1, it may be easier to focus on the pattern of bond distortion rather than the amount of CO.
Empirically, CTS showing the BCDW1 distortion are more likely to show superconductivity (SC) under pressure Clay et al. (2012). We have suggested that unconventional SC in materials arises from the delocalization of the (‘11’) singlet pairs formed in the insulating Paired Electron Crystal (PEC), which has the same CO pattern as BCDW1 and BCDW2 Mazumdar and Clay (2014); Gomes et al. (2016); De Silva et al. (2016). Within such a model, the effective mass of the singlet is smaller in the BCDW1 because of the weaker binding, and hence the mobility of inter-dimer pairs here would be expected to be large, allowing a transition to a paired liquid state under the application of pressure Gomes et al. (2016). On the other hand, the intra-dimer pairs with large found in BCDW2 materials would tend to remain in an insulating state.
IV Acknowledgments
This work was supported by the Department of Energy grant DE-FG02-06ER46315. Part of the calculations were performed using resources of the National Energy Research Scientific Computing Center (NERSC), which is supported by the Office of Science of the U.S. Department of Energy under Contract No. DE-AC02-05CH11231.
References
- Ung et al. (1994) K. C. Ung, S. Mazumdar, and D. Toussaint, Phys. Rev. Lett. 73, 2603 (1994).
- Clay et al. (2003) R. T. Clay, S. Mazumdar, and D. K. Campbell, Phys. Rev. B 67, 115121 (2003).
- Mazumdar et al. (2000) S. Mazumdar, R. T. Clay, and D. K. Campbell, Phys. Rev. B 62, 13400 (2000).
- Clay et al. (2012) R. T. Clay, J. P. Song, S. Dayal, and S. Mazumdar, J. Phys. Soc. Jpn. 81, 074707 (2012).
- Ota et al. (2002) A. Ota, H. Yamochi, and G. Saito, J. Mater. Chem. 12, 2600 (2002).
- Drozdova et al. (2004) O. Drozdova, K. Yakushi, K. Yamamoto, A. Ota, H. Yamochi, G. Saito, H. Tashiro, and D. B. Tanner, Phys. Rev. B 70, 075107 (2004).
- Aoyagi et al. (2004) S. Aoyagi, K. Kato, A. Ota, H. Yamochi, G. Saito, H. Suematsu, M. Sakata, and M. Takata, Angew. Chem. Int. Ed. 43, 3670 (2004).
- Tsuchiizu and Suzumura (2008) M. Tsuchiizu and Y. Suzumura, Phys. Rev. B 77, 195128 (2008).
- Iwano and Shimoi (2008) K. Iwano and Y. Shimoi, Phys. Rev. B 77, 075120 (2008).
- Kumeta et al. (2016) S. Kumeta, T. Kawamoto, T. Shirahata, Y. Misaki, and T. Mori, J. Phys. Soc. Jpn. 85, 094701 (2016).
- Mila and Zotos (1993) F. Mila and X. Zotos, Europhys. Lett. 24, 133 (1993).
- Clay et al. (2007) R. T. Clay, R. P. Hardikar, and S. Mazumdar, Phys. Rev. B 76, 205118 (2007).
- (13) In References Ung et al., 1994 and Clay et al., 2012 the bond distortion pattern is written in terms of , the displacement of the th site from equilibrium, with 2kF and 4kF weights and . In the present notation . The ratio of 4kF to 2kF components required for the BCDW1 phase was quoted incorrectly in these references–rather than 0.41, for the BCDW1 pattern.
- Hirsch and Scalapino (1984) J. E. Hirsch and D. J. Scalapino, Phys. Rev. B 29, 5554 (1984).
- Sandvik (1992) A. W. Sandvik, J. Phys. A 25, 3667 (1992).
- Syljuasen and Sandvik (2002) O. F. Syljuasen and A. W. Sandvik, Phys. Rev. E 66, 046701 (2002).
- Voit (1995) J. Voit, Rep. Prog. Phys. 58, 977 (1995).
- Lin et al. (2000) H. Q. Lin, D. K. Campbell, and R. T. Clay, Chinese J. Phys. 11, 1 (2000).
- Dressel et al. (2012) M. Dressel, M. Dumm, T. Knoblauch, and M. Masino, Crystals 2, 528 (2012).
- Zamborszky et al. (2002) F. Zamborszky, W. Yu, W. Raas, S. E. Brown, B. Alavi, C. A. Merlic, and A. Baur, Phys. Rev. B 66, 081103 (2002).
- Hirsch and Scalapino (1983) J. E. Hirsch and D. J. Scalapino, Phys. Rev. B 27, 7169 (1983).
- Sandvik (2008) A. W. Sandvik, Phys. Rev. Lett. 101, 140603 (2008).
- Ota et al. (2003) A. Ota, H. Yamochi, and G. Saito, Synth. Metals 133-134, 463 (2003).
- Chollet et al. (2005) M. Chollet, L. Guerin, N. Uchida, S. Fukaya, H. Shimoda, T. Ishikawa, K. Matsuda, T. Hasegawa, A. Ota, H. Yamochi, et al., Science 307, 86 (2005).
- Fabre et al. (1995) J. M. Fabre, S. Chakroune, A. Javidan, L. Zanik, L. Ouahab, S. Golhen, and P. Delhaes, Synth. Metals 70, 1127 (1995).
- Sedlmeier et al. (2012) K. Sedlmeier, S. Elsässer, D. Neubauer, R. Beyer, D. Wu, T. Ivek, S. Tomic, J. A. Schlueter, and M. Dressel, Phys. Rev. B 86, 245103 (2012).
- Mazumdar and Clay (2014) S. Mazumdar and R. T. Clay, Int. J. Quant. Chem. 2014, 1053 (2014).
- Gomes et al. (2016) N. Gomes, W. W. De Silva, T. Dutta, R. T. Clay, and S. Mazumdar, Phys. Rev. B 93, 165110 (2016).
- De Silva et al. (2016) W. W. De Silva, N. Gomes, S. Mazumdar, and R. T. Clay, Phys. Rev. B 93, 205111 (2016).