Must Starforming Galaxies Rapidly Get Denser Before They Quench?
Abstract
Using the deepest data yet obtained, we find no evidence preferring compaction-triggered quenching—where rapid increases in galaxy density truncate star formation—over a null hypothesis in which galaxies age at constant surface density (). Results from two fully empirical analyses and one quenching-free model calculation support this claim at all : (1) Qualitatively, galaxies’ mean colors at have reddened at rates/times correlated with , implying that there is no density threshold at which galaxies turn red but that sets the pace of maturation; (2) Quantitatively, the abundance of red galaxies never exceeds that of the total population a quenching time earlier at any , implying that galaxies need not transit from low to high densities before quenching; (3) Applying to a suite of lognormal star formation histories reproduces the evolution of the size–mass relation at . All results are consistent with evolutionary rates being set ab initio by global densities, with denser objects evolving faster than less-dense ones towards a terminal quiescence induced by gas depletion or other Hubble-timescale phenomena. Unless stellar ages demand otherwise, observed thresholds need not bear any physical relation to quenching beyond this intrinsic density–formation epoch correlation, adding to Lilly & Carollo’s arguments to that effect.
Subject headings:
galaxies: evolution — galaxies: structure1. Context
Why some galaxies form stars while others do not is a central puzzle in astronomy. Quiescence correlates with mass, environment, kinematics, and structure, but whether/how these factors cause the cessation of star formation (“quenching”) is unknown. The same holds for stellar mass density.
For at least half a century, non-starforming galaxies have been known to be denser than contemporaneous, equal-mass starforming ones (Holmberg, 1965). Recent studies amplify/extend this finding (Fang et al., 2013; Barro et al., 2013, 2015; Whitaker et al., 2017), but do not clarify its meaning. As Lilly & Carollo (2016, “LC16”) discuss, there are causal and corollary interpretations.
The causal scenario is that starforming galaxies experience dramatic (gas) density increases due to mergers/instabilities—“compaction.” This leads to strong, concentrated starbursts whose outflows/subsequent black hole activity stifle further star formation, leaving small, passive stellar cores (Barro et al., 2015; Zolotov et al., 2015). Violent density increases beyond some stability threshold thus trigger quenching.
The corollary scenario is that ab initio denser galaxies form stars faster than less-dense ones (Schmidt, 1959; Kennicutt, 1998). This accelerated evolution leads them to quiescence—galaxies’ natural end-state—first, via gas exhaustion or other Hubble-timescale processes (which are by definition rapid at high-). With no pre-quenching increases at all, passive systems would be denser than starforming ones, and denser systems would be more passive—as the size–mass plane shows (Holmberg 1965; Dressler 1980; van der Wel et al. 2014; Abramson et al. 2016; LC16; Morishita et al. 2017).
The question for quenching physics is whether the data require something beyond an intrinsic density–formation time covariance (akin to assembly bias; Wechsler et al., 2006; Feldmann et al., 2016). Based on their analysis of a model in which galaxies grow via scaling laws in mass, (), and time until quenched by a mass- or environment-sensitive mechanism, LC16 suggest “no”—data do not favor causality (compaction) over correlation (denser things die first). Here, we present complementary, concurring arguments based on a more extreme null hypothesis: From both fully empirical and independent model analyses, we find no compelling reason to dismiss a scenario wherein pre-quenching galaxy surface densities never evolve. Hence, either the size–mass relation is a poor test of physical models, or is a plausibly conserved quantity for blue galaxies.
Below, Section 2 describes the data, 3 analyzes them in isolation, and 4 provides separate supportive modeling. Section 5 discusses counterarguments, and Appendices A–C present cross-checks. Please see 3.1 before interpreting any results.
We assume .
2. Data
Our empirical analysis uses public Hubble Space Telescope (HST) data from the eXtreme Deep Field (XDF; Illingworth et al., 2013),111https://archive.stsci.edu/prepds/xdf Hubble Legacy Fields (HLF; Illingworth et al., 2016),222https://archive.stsci.edu/prepds/hlf Hubble Frontier Fields (HFF; Lotz et al., 2017),333https://archive.stsci.edu/prepds/frontier and the Grism Lens-Amplified Survey from Space (GLASS; Treu et al., 2015).444https://archive.stsci.edu/prepds/glass This imaging and spectroscopy represents the deepest data yet obtained, probing hitherto inaccessible stellar mass and redshift regimes ( at ).
We take the 7-band (F435/606/814/105/125/140/160W) imaging covering the six HFF cluster and parallel pointings, and the 9-band imaging (HFF + F775W + F850LP) from the XDF and two HLF fields with comparable F160W data (used for structural fitting). To ensure environmental and structural effects are not confused, we exclude HFF/GLASS cluster members (see Morishita et al., 2017, “M17”).
Source detection, and photometric redshift (), rest-frame color, and stellar mass estimation follow M17: EAZY (Brammer et al., 2008) determines using M17’s modified prior to identify cluster members; FAST (Kriek et al., 2009) yields stellar masses based on or GLASS (if available) assuming a Chabrier (2003) IMF, Calzetti et al. (2000) dust law, and exponential star formation history (SFH).
GALFIT (Peng et al., 2002) provides galaxy sizes—circularized F160W effective radii; , where is the axis ratio and is the major-axis half-light radius—assuming a Sérsic (1963) profile. We study systems with , which are well-resolved (Morishita et al., 2014). Bright stars serve as point spread functions.
We identify blue/starforming and red/non-starforming galaxies using the UVJ color-color criteria of Williams et al. (2009, see their Equation 4), cutting the sample at AB where structural fits are reliable (M17). This is 1.5 mag deeper than van der Wel et al. (2014, “vdW14”)’s CANDELS data. Scaling their mass completeness limit— for red galaxies—our data reach at . Results are robust to this limit (Appendix A).
The sample contains 1491 (233 red + 1258 blue) galaxies.
2.1. A Note on
Though some authors favor or —the surface or 3D stellar mass density at kpc (Fang et al., 2013; Barro et al., 2015; Whitaker et al., 2017)—we adopt because: (1) it is less sensitive to fitting errors; (2) we lack spatially resolved colors (using a global is likely the dominant systematic; Szomoru et al., 2013; Morishita et al., 2015); (3) it avoids additional assumptions needed to infer or from 2D profiles; (4) we wish to test a null scenario where galaxies evolve at constant surface density but obviously not constant mass. As star formation is often uniformly distributed (Nelson et al., 2016), this precludes fixed-aperture density definitions, where effectively becomes . As a penalty, we must account for differential size/mass effects (Sections 4, 5), and verify that is consistent for -matched progenitors/descendants (Section 3.3).
3. Empirical Results: Colors, Abundances
3.1. Clarification of Intent
Before discussing our results, we wish to emphasize their meaning. We seek to assess whether galaxy sizes, masses, and colors imply rapid, quenching-related increases. We claim they do not, and argue by showing that a null hypothesis of constant- evolution also fits the facts. We do not claim that galaxies, in reality, should grow at constant .
This section’s empirical analyses satisfy our aim: no data suggest anything beyond constant- aging. One can view this as evidence for the physicality of that scenario, or a measure of the data’s constraining power. We are agnostic.
Section 4’s modeling is different. It can only affirm that all galaxies might actually grow at constant . To uniquely test that much stronger statement—which is not our intent—the external SFHs and boundary conditions must be correct. Of course, in general, they will not be. As such, the test is unidirectional: consistency with data suggests constant- growth is not wrong, but inconsistency does not suggest it is—the issues could lie with the SFHs or boundary conditions.
3.2. Colors
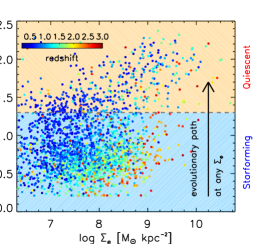
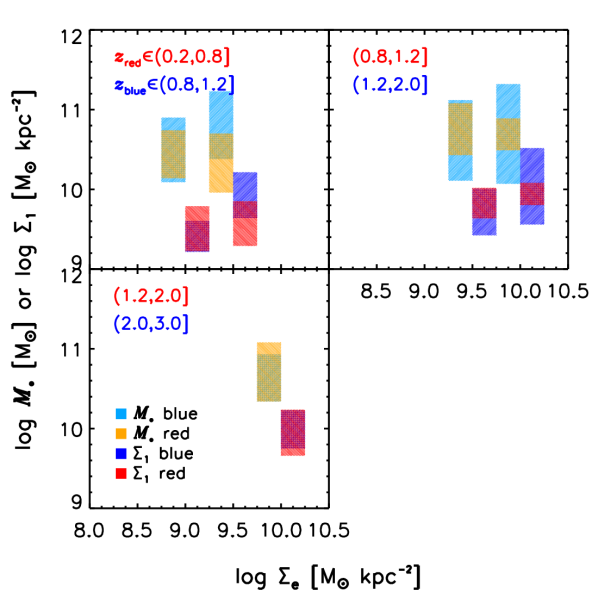
Figure 1, left, shows the data: galaxy colors as a function of stellar mass surface density——and redshift. Starforming galaxies occupy the entire range at high-, but systematically vacate the high-density end as . Conversely, high- red galaxies lie almost exclusively at the highest , but appear later at lower density. These statements are not inconsistent with galaxies evolving in an L-shaped track (Barro et al., 2015; Zolotov et al., 2015), increasing in density (moving right “blue nuggets”) before reaching a redshift-dependent, monotonically decreasing threshold and quenching (moving up “red nuggets”).
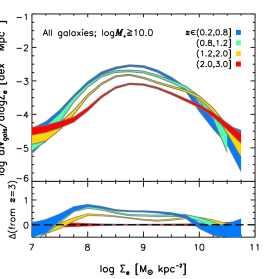
Yet, these facts are also consistent with blue galaxies providing a source population spanning all that is systematically emptied as they age into red systems at relatively fixed surface density; i.e., (Holmberg, 1965, Figure 6). If, reasonably, such evolution was fastest for the densest systems—i.e., the earliest, assuming galaxies encode global densities at some formative epoch (Section 4)—then this “peeling” scenario would appear as -threshold-dependent quenching but entail no mechanism beyond dense gas supporting higher SFRs than rarefied gas (Dressler 1980; Kennicutt 1998; Poggianti et al. 2013b; Abramson et al. 2016, LC16, Kelson et al. 2016; M17). Irrespective of its ultimate accuracy, we see this as a null scenario requiring falsification.
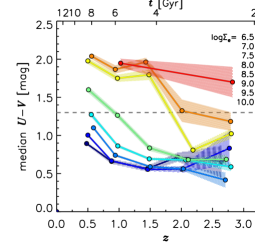
Figure 1, right, summarizes: galaxies at all have reddened with time. This process is merely delayed or retarded for lower- compared to higher-density objects. A mass dependence is embedded in these results in that lower- galaxies are more massive than higher- systems of equal , but this is the point—galaxies might grow in mass at constant .
Figure 1 is thus qualitatively consistent with evolutionary rates being set by an initial density, then remaining fixed: Denser galaxies born earlier might experience the same physical processes as less-dense galaxies born later, just sooner/at accelerated rates with no additional -dependent process required (Gladders et al. 2013; Kelson 2014; Papovich et al. 2015; Abramson et al. 2016; LC16; Section 4). In such a universe, a sharp, evolving “threshold” could still separate blue and red galaxies (LC16; Whitaker et al. 2017). Yet, rather than a quenching mechanism, the signal would reflect the fact that all higher- galaxies have “aged-out” of the starforming population and are thus not present in lower- blue samples to support the measurement.
Since no is preferred for the reddening process—which can take many Gyr—a plain interpretation of Figure 1 is that there is no threshold-triggered quenching. Of course, the data also admit an evolving quenching threshold.
3.3. Abundances
The above results favor neither the corollary density-accelerated scenario, nor the causal compaction/density-quenched model. Here, we perform a test that increases the burden of proof on the latter. Appendix A verifies all results in this section using the wider-but-shallower vdW14 sample.
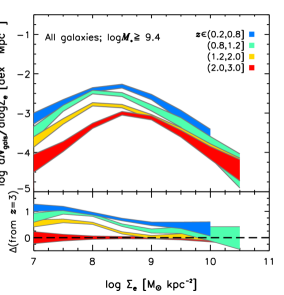
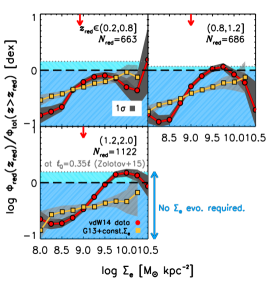
Figure 2, left, shows the evolution of the function—the absolute abundance of galaxies at a given surface density—over for all systems with , the completeness limit. Uncertainties are the quadrature sum of Poisson error and 100 random perturbations by error-bars.
In agreement with Poggianti et al. (2013a, b), at 2 , nearly all galaxies appear by . Below that, abundances grow faster with decreasing . This is attributable to the evolution of the blue galaxy mass function (e.g., Ilbert et al., 2010) and size–mass relation; i.e., more and larger systems crossing the mass—not —completeness limit as (e.g., vdW14; LC16). Indeed, the slope and dispersion of the size–mass relation allow equal- (-) galaxies to span 30 (10) in (Barro et al., 2015, M17; Figures 3, 6). Section 4 illustrates the far-reaching consequences of this fact.
With colors, we can interpret these abundances to constrain the need for compaction-triggered quenching:
-
•
If galaxies age at constant , then red systems are the memory of once-blue ones in the same density bin. Hence, the function of red galaxies should never exceed that of all galaxies a quenching time ago. (There cannot be more descendants than progenitors.)
-
•
If galaxies evolve strongly in , then the above need not be true: previously low- blue galaxies can compactify to end-up as high- red ones. Hence, the function of red galaxies can exceed that of all earlier galaxies: the red population may draw progenitors from their bin and the large reservoir of lower- systems.
Modulo mergers (Section 5), sizable overabundances of lower- red galaxies compared to all higher-, equal- galaxies would therefore indicate compaction-triggered quenching.
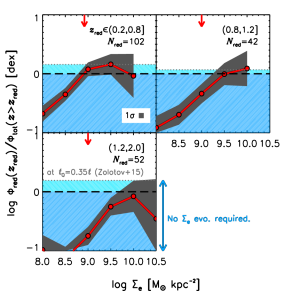
We search for these following Wild et al. (2016). Figure 2, right, compares the red galaxy functions at to the total functions at . Zero is the expectation if all galaxies in a bin at quenched by with no systems added between intervals. Hence, in an infinitely complete sample (explained momentarily), under strict constant- evolution, the red lines cannot lie significantly above the black dashes.
At all densities and times except potentially one bin, this is precisely what is seen: Red galaxy counts never exceed the those of all older equal- galaxies, consistent with constant expectations.
Varying -intervals and bin sizes, we can create 2.5 tension at . Yet, even ignoring that compaction is thought to be subdominant at these epochs for spectrophotometric reasons (Yano et al. 2016; but cf. Wild et al. 2016), this elevation with respect to zero need not imply variable- growth. This is because the sample is not infinitely complete, and there is a source term of blue galaxies at many (Figure 1). Hence, if -intervals are longer than a quenching time—–2.0 Gyr (Zolotov et al., 2015)—excesses could indicate those galaxies crossing the survey’s mass limit, entering the sample, and quenching between measurements.555Shorter/longer will increase/decrease this leeway. Abramson et al. (2016) find . Indeed, the total abundance of passive galaxies only exceeds that of all galaxies at , providing an ample 3.5 Gyr for such an influx given typical mass doubling times at those epochs (–1 Gyr; Noeske et al., 2007; Daddi et al., 2007). Accounting for the extra time removes all tension (grey dotted lines).
An implication of the above is that the evolution in Figure 2, left, purely reflects mass incompleteness. As such, JWST should provide strong tests: the undetected progenitors we posit will appear in its surveys. Under constant- growth, the function at all epochs should then resemble data (at least in regimes where dry merging is rare). If not, our strictest null scenario would be ruled out. Current data may already permit testing in this vein (e.g., Bouwens et al., 2017).
Of course, mild evolution could also occur. Though it violates the strictest null scenario, a process where seems distinct from compaction-triggered quenching (cf. Zolotov et al., 2015, Figures 2, 3). Since red galaxy abundances are within a factor of 2 of all galaxies’ (), -bin crossing rates of Gyr-1 could explain the excess. This is slow compared to (Poggianti et al., 2013b), except at , where, again, compaction is thought to be a weak channel. Further, progenitors of (e.g.) Milky Way-mass objects may grow by 10 in over this interval (Leitner, 2012; Abramson et al., 2015), emphasizing mass- over -driven quenching (LC16).
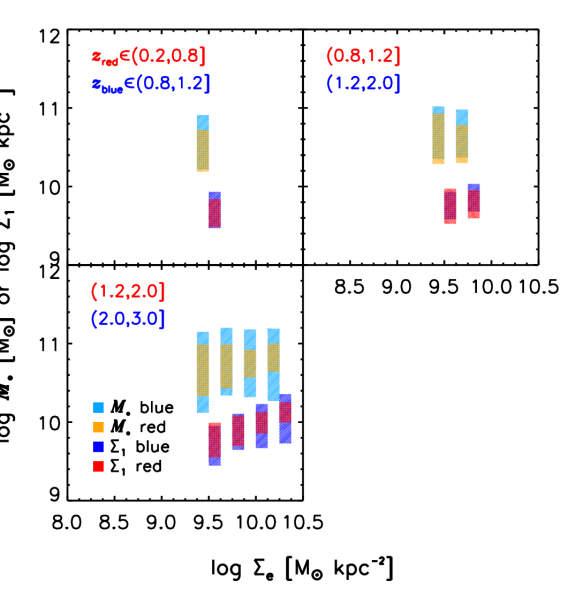
Although abundances match, more detailed properties of equal- galaxies at various times—e.g., , —might not, ruling out (quasi-)fixed- evolution. Yet, when is inferred from 1D projections of the GALFIT models (Bezanson et al., 2009), Figure 3 (and 6) shows significant overlap between these quantities for earlier blue and later red galaxies at fixed . Hence, no strong tension emerges at the galaxy level.
4. Numerical Results: the Size–Mass Relation
The empirical tests above (and in Appendix A) self-consistently show that the data are explainable by constant- evolution and do not require compaction. Yet, they do not show that, given realistic SFHs, constant- growth generates the data. Here, we provide support for this using a basic forward-model of the size–mass relation based on Gladders et al. (2013, “G13”)’s well-tested SFHs. As we seek only to assess whether constant- growth is acceptable—not prove it is uniquely good or rigorously constrain the “true” scaling (Section 3.1)—we leave probing SFH-dependence to future work. Nevertheless, a basic G13+constant- model explains the data well (Appendix B), and Appendix C shows how it might readily be improved. Section 3’s results stand independent of any modeling.
4.1. The Model
Two features of the size–mass relation appear challenging. First, the locus for starforming galaxies follows –0.3 (Shen et al. 2003; van der Wel et al. 2014; van Dokkum et al. 2015; M17), shallower than the 0.5 dex/dex slope constant- growth implies. Second, compaction posits that small, high-mass (passive) objects come from once-larger, lower-mass systems (Barro et al., 2015). The constant- scenario demands smaller progenitors, which, depending on the epoch, may correspond to unphysical sizes.
To check the above, we require a set of SFHs and initial sizes: the former provide with which to update the latter by to create constant- size trajectories. We adopt G13’s lognormal SFHs. These reproduce many properties of the galaxy population, including the total stellar mass function at , those of starforming and passive galaxies at , and the – relation at (G13; Abramson et al. 2015, 2016). They also well-approximate simulated and observationally inferred SFHs (Diemer et al., 2017b; Dressler et al., 2016; Abramson et al., 2017). As G13 employs no global scaling laws, this analysis represents a meaningful, independent complement to LC16’s.
We generate initial galaxy sizes, , by picking a stellar mass, , at which galaxies “learn” about the density of the Universe, and assigning each galaxy:
| (1) |
where is 200 the critical density at the redshift when a galaxy reaches []. is a constant encoding the mean, e.g., stellar-to-halo mass ratio, offset between halo and the quantity to which stellar structures are actually sensitive (Diemer et al., 2017a; Baxter et al., 2017), and angular momentum and dissipation effects. To account for some diversity in the above, we randomly perturb using a gaussian with dex—roughly the scatter in angular momenta at fixed halo mass (Mo et al., 1998; Burkert et al., 2016). This was derived independently from, but concurs with LC16.
We set once at , thus (deliberately) ignoring any time dependence in the above phenomena. We do so by matching the modeled and measured starforming galaxy sizes at (Figure 4, top left), calibrating to the mean of vdW14’s “late-type,”666http://www.mpia.de/homes/vdwel/3dhstcandels.html (all fields), with masses/colors from http://3dhst.research.yale.edu/Data.php (Brammer et al., 2012; Skelton et al., 2014; Momcheva et al., 2016). and Mosleh et al. (2013)’s relations (see their Tables 1). The latter is decurcularized using vdW14’s . More sophisticated analyses could probe ellipticity effects, but we assume below.
We adopt ; model sizes are undefined below this mass. While free, this choice is not quite arbitrary. It is (1) G13’s limit (G13); (2) near where the SFR– relation’s slope breaks below unity (Salim et al., 2007; Whitaker et al., 2014); (3) the mass above which galaxies have bulges/dense central structures (e.g., Lang et al., 2014; Abramson et al., 2014); (4) the mass below which galaxy sizes are indeed largely (though not entirely) mass-independent (vdW14; M17). There is room to argue about (Section 5), but given our aim and the model’s deliberate over-simplicity, these facts suggest is reasonable.
This model differs from LC16’s in several key ways. Foremost, it applies knowledge of global conditions at only one epoch——linking size growth “ballistically” to mass at all other times via a different scaling— vs. . It can do this because it relies on SFHs with unique geometries, not a universal mean law. Consequently, the model requires no explicit quenching: SFHs simply fall absent any mechanistic prescription (LC16 use mass- and environment-dependent quenching probabilities; a penalty is that we cannot separate centrals and satellites). Also, we make no explicit assumptions about mass profiles (LC16 assume exponentials). We do not claim that our model is “better,” only that it represents a meaningful, independent test whose results bear at least on the data’s discriminating power.
Finally, though addressed in Section 5, we are explicitly not interested in post-quenching density evolution; i.e., the size growth of individual passive galaxies over time. We thus neglect mergers, which probably drive this phase (e.g., Newman et al., 2012; Morishita & Ichikawa, 2016; Belli et al., 2017). We comment on the effects of this choice where necessary.
4.2. Results
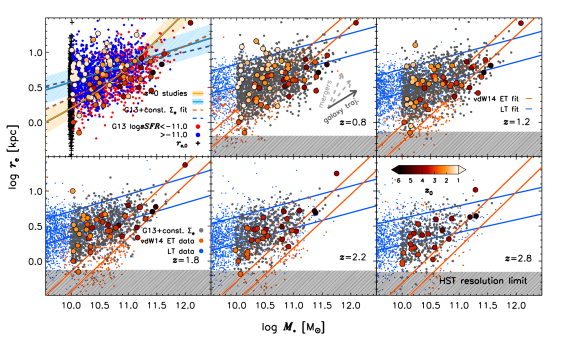
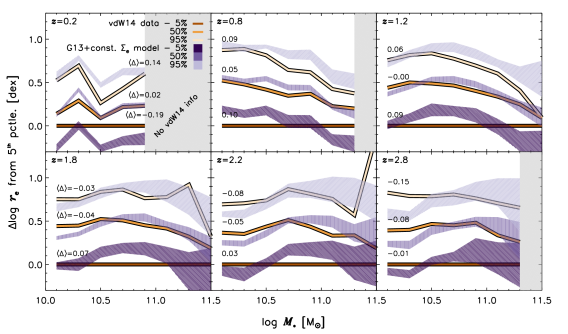
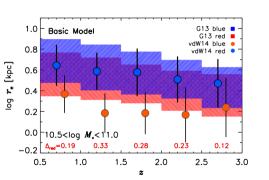
Figure 4’s top panels show the G13 + constant- predictions for the plane at overlaid on vdW14’s data. Bottom panels show size quantiles at fixed mass and time relative to the smallest observed sources (5th pctle.). Qualitatively and quantitatively, the model reproduces the data well.
At , when split at into starforming and passive galaxies, blue model galaxies are larger at fixed-mass and exhibit a shallower mass-dependence than their red counterparts ( vs. ; results are robust to reasonable choices). Meanwhile, red model galaxies avoid small sizes at high-masses in fair agreement with data descriptions. Indeed, the model blue locus’ slope precisely matches the data’s (vdW14 find ), as does its median and upper-limb at . While the model red locus’ slope is slightly too shallow, including dry merging would steepen this trend by moving galaxies along lines of –2 (Bezanson et al. 2009; Hopkins et al. 2009; Naab et al. 2009).
This finding addresses the first question posed in Section 4.2: The size–mass relation can be shallower than the constant- slope of 0.5 along which individual galaxies evolve because it is a convolution of tracks launching with larger mean -intercepts (lower-) at later times. When projected at any epoch, this stretches the locus horizontally relative to any of its constituents’ paths. Hence the discrepancy between galaxy trajectories and loci slopes is superficial.
The large dots in Figure 4, top—colored by for a random subset of SFHs—illustrate the age–size covariance. As expected, and bearing a strong resemblance to spectroscopic and photometric age estimates (Valentinuzzi et al. 2010; M17), small systems are redder because they are older, hence further from their peak star formation. Conversely, larger galaxies are bluer because they are younger (Carollo et al., 2013). All trends might reflect only the fact that earlier-forming galaxies had their SFHs sped by globally higher densities (Figure 1; Fagioli et al. 2016; Williams et al. 2017).
The model’s general fidelity extends to all other redshifts where vdW14 data exist to test it. As Figure 4, bottom, shows, basic G13 + constant- growth predicts quantiles to within dex, with mean offsets typically less than 0.1. As neither G13 nor constant- growth was conceptualized to describe these data at all quantitatively, we find this agreement striking. It also addresses Section 4.2’s second question.
As revealed by the panels, constant- growth can populate the compact galaxy regime—. Indeed, it does so with some passive systems when defined by a 0.6 dex or 2 cut below (not shown; see below). These systems have kpc, near recent high- estimates (Bouwens et al., 2017, who find for sources, similar to our scenario). Hence, no compaction is needed to create such small, passive, high- objects (concurring with van Dokkum et al., 2015). That said, the bottom row of Figure 4, bottom, shows that the model does underproduce them: predicted 5th pctle. sizes are 0.2 dex larger than the data suggest. Indeed, model passive systems are largely responsible for this offset, being up to 2 too large at (Figure 9, left).
While compaction could resolve this tension, so could two compaction-free alternatives.
Principally, we have not correlated the scatter in (i.e., angular momentum) with SFH properties (half-mass time, width). Beyond modulating the number of super high- galaxies, this over mixes the population and ensures we will get wrong. (This is why we do not plot the model split by at ; it would illustrate assignment, not constant- growth.) In reality, scatter in almost certainly is correlated with SFH properties (e.g., Cortese et al., 2016), and so . Studying such correlations is beyond our aims, but—given assembly bias—it is likely such that the fastest-forming, earliest-quenching galaxies arose in overdensities, and so were smaller than equal-mass field galaxies (Poggianti et al. 2013a; M17). This would “purify” the compact galaxy population into more mature (redder) objects. Appendix C simulates this correlation, which removes any tension in the sizes of red galaxies at (Figure 9, right).
Another satisfactory, compaction-free solution is to allow some model systems to grow at constant (; van Dokkum et al., 2015), thereby remaining smaller at any . Since the densest systems comprise 5% of all galaxies and our basic model accounts for a third to half of them (Figure 7), adding even a small number of these tracks might resolve all tension. While quantitatively different from our null hypothesis, it is obviously similar in spirit, and seems reasonable given the more spheroidal nature of red galaxies. Again, our central claim is not that all galaxies truly evolve at fixed , but that the data do not imply compaction.
Section 5 presents other remedial modifications. Regardless, G13+constant growth as modeled accounts for the evolution of 90% of objects at at least (Appendix B).
While there is ample room for further exploration, and we encourage others to test any of the above statements, we take the test above as numerical support for the plausibility of Section 3’s main points: Absent mergers, compaction, or even explicit quenching, and with no tuning beyond and random scatter in , once the size–mass relation is reinterpreted as a size–time relation, the need for rapid pre-quenching density increases largely (if not entirely) disappears. We could thus posit that fixed- growth actually describes most galaxies (at least before quenching), or that the data studied here—numbers, sizes, and colors of galaxies as functions of , mass, and time over the past 11 Gyr—are not very constraining. Either way, though it may happen, these data do not imply that red galaxies descend from blue galaxies leaping away from their peers towards anomalously high densities. Support for that scenario must be found elsewhere.
5. Discussion
Amplifying Poggianti et al. (2013a, b)—whose spectroscopy demonstrates the slow evolution of the high- population—and LC16—whose model also suggests trends reflect fundamentally mass- and time-dependent physics—our results highlight the challenge of inferring quenching mechanisms from correlations between galaxy density and quiescence, especially as a null hypothesis of constant- aging also fits the facts.
Of course, absence of evidence is not evidence of absence. We do not contend that galaxies truly evolve only at fixed : just that this predictive null scenario ought to be falsified and its failures identified before invoking compaction quenching. The caveats of our analysis may provide ways forward.
First, the small areal coverage of the data (70 arcmin2) may be a concern. Yet, repeating the analysis in Section 3.3 using the full suite of vdW14 CANDELS data—900 arcmin2 but complete to only —changes none of our conclusions: As shown in Appendix A, Figures 5 and 6, growth of the total function is never more rapid at high- relative to low-, and the number of lower- red galaxies at fixed- never exceeds that of all older galaxies, accounting for quenching times. Hence, there is no empirical evidence of high- (red) systems being drawn from a low- reservoir.
Another concern could be that accurately assessing rest-frame colors at may require longer-wavelength photometry than we have used. This could affect the inferred abundance of quiescent galaxies at those epochs. Yet, CANDELS used such data (Skelton et al., 2014) and, as just discussed, results derived therefrom agree with our assessments. Further, tests show that M17’s SED fitting (upon which we rely) tends to overestimate UVJ-quiescent galaxy counts by perhaps 50% relative to assessments using supplementary or 3.6 coverage (Castellano et al., 2016), and only at . Thus, if anything, our conclusions are conservative.
In terms of physical counterarguments, principally, minor mergers, adiabatic expansion, and stellar mass loss could dilute the number of high-density red galaxies by pushing some compaction-quenched systems back to lower (Bezanson et al., 2009; Newman et al., 2012; Poggianti et al., 2013b). Simulations suggest these phenomena can lower by 10 (Naab et al., 2009; Ceverino et al., 2015). Relatedly, red galaxies are reported to grow by factors of 3–5 in at fixed mass over the interval probed (Trujillo et al., 2007, but see below), which would also lead to large declines in .
Yet, for these effects to hide compaction quenching and preserve the signal in Figure 2, right, the timescales must match: The flow of red galaxies out of high- bins must balance that of blue galaxies into them. Indeed, since there are many more blue galaxies to move right than red ones to move left, the rates of -reducing phenomena should be faster than (or tuned to) the quenching timescale. So, progenitors cannot just be dense, but must grow rapidly once quenched, perhaps tripling in size—but not mass—in the 2.5 Gyr between and (Yano et al., 2016).
The general size growth of red galaxies is measured across the entire redshift interval probed, so, in the mean, this process is too slow. Moreover, our null scenario of density-accelerated aging and the LC16 model naturally explain this as “progenitor bias”—the addition of lower-density red galaxies descending at later times from lower-density blue progenitors quenched by -independent phenomena. Supporting this, Poggianti et al. (2013a) find red galaxies at fixed mass to grow by once stellar age is accounted for. Given the 0.5 dex bins used here, cohorts of simultaneously quenched red galaxies might thus shift one bin left, leaving our conclusions intact unless migration was a strong function of .
On an individual galaxy basis, since quenching times are shorter at high- ( Gyr at , e.g.; Zolotov et al., 2015), mergers and adiabatic expansion seem unlikely to drive large density reductions: there are too few of the former and they both take too long (Newman et al., 2012; Nipoti et al., 2012; Sonnenfeld et al., 2014; Barro et al., 2015, Figure 3). To compensate, could be raised, but at Gyr it becomes difficult to disentangle -quenching from strangulation or gas exhaustion (e.g., Larson et al., 1980; Peng et al., 2015). If not the aging “agents” in the null, fixed- hypothesis, these processes may be more sensitive, e.g., to environment than (Wetzel et al., 2013). Indeed, clusters host about triple the number of dense, galaxies as the field (Poggianti et al. 2013a; M17), so environmental effects are likely non-negligible for many high- dense objects.
Now, in fairness, in its current form, the G13 + constant model will not produce the absolute smallest red galaxies , assuming the under-resolved measurements in Figure 4, top, are accurate. This is likely due to model SFHs reaching at the wrong time to later alight in the correct part of space given their SFRs. Beyond the moves discussed in Section 4.2, making a function of time might alleviate this issue. Simply lowering will not work: While it leads to smaller galaxies, it also produces a size–mass relation with a slope close to 0.5: though clocks start earlier, such that drops due to globally higher densities, the SFHs are also further from their terminal masses. Hence, is integrated over a larger domain, stretching the constant- tracks into parallel lines.
To maintain the correct shape while generating kpc massive galaxies at , must be bent toward higher masses at earlier times, causing objects to start nearer their destination at epochs when their SFHs are also closer to completion. While beyond the scope of this work, such a treatment is consistent with the evolution of the break in the – relation (Whitaker et al., 2012; Schreiber et al., 2015) and so might be meaningful; we encourage others to see if the above can account for the small number/overabundance of hyper-dense systems our first attempt did not produce.
In sum, rapid secular expansion seems the best out for compaction/density-triggered quenching. Since at , timescales would accommodate it, and simulations suggest it is possible if star formation ends in a large burst (El-Badry et al., 2016). The mechanism seems most active at —about a dex below most high- red galaxies—but there is some evidence at and that the largest red systems are also the oldest (Yano et al., 2016) or the youngest red systems are the smallest (Almaini et al., 2017). If confirmed using larger spectroscopic samples and shown not to reflect, e.g., merger-driven rejuvenations of previously red galaxies (perhaps if the poststarbursts are not too dusty), this would be a “smoking gun” of compaction-triggered quenching, ruling out exclusively constant- evolution (but see LC16). If simulations support rapid expansion, non-structural predictions such as ages, metallicities, or -abundances would aid observers in testing such hypotheses.
6. Summary
Using the deepest HST data obtained, we show that galaxy colors, stellar mass surface densities (), sizes, and abundances at and are consistent with a scenario in which all systems evolve from blue to red at roughly fixed at rates correlated with that quantity. Though it may occur, there is no requirement that blue galaxies quench by compaction, evolving dramatically in (beyond some critical threshold). Specifically:
-
1.
There is no preferred density at which blue galaxies turn red (Figure 1). Rather, this process occurs at all , with denser systems reddening earlier/faster than less-dense ones.
-
2.
The number of red galaxies never exceeds that of all equal- galaxies at earlier times (Figures 2, 5, right), which also have consistent masses and central-kiloparsec densities (Figures 3, 6). There is no suggestion of a large influx of once-lower-density blue galaxies into the high-density red population.
- 3.
While we can neither prove that compaction quenching never occurs, nor rule out all scenarios that might mask it (e.g., rapid secular expansion), the most straightforward (minor mergers) seem unlikely given timescale requirements. Thus, a null scenario in which, pre-quenching, galaxies evolve at roughly constant —with denser galaxies aging more rapidly from blue to red via gas exhaustion or other Hubble-timescale processes, which are by definition rapid at high-—seems equally plausible. Future investigators should falsify this and predict non-structural characteristics of galaxies undergoing compaction quenching (e.g., ages, -enhancements) to aid observers in testing the implied mechanism(s).
We thank T. Treu, B. Poggianti, B. Vulcani, O. Almaini, D. Masters, M. Kriek, A. Wetzel, Galpath2016 attendees, and our anonymous referee for helpful insights. TM acknowledges a Japanese Ministry of Education, Culture, Sports, Science and Technology Grant-in-Aid for Scientific Research (26-3871), and a Japan Society for the Promotion of Science research fellowship for young scientists. GLASS (HST GO-13459) is supported by NASA through a grant from STScI operated by AURA under contract NAS 5-26555.
Appendix A A: Sample Size
Figures 5, 6 reproduce Figures 2, 3, respectively, based on wider and shallower data from CANDELS (vdW14). As discussed in Section 3.3, Figure 5, left, shows that, while galaxy abundances have increased at most since , the growth at high- is never faster than that at low-. If anything, the trend goes in the opposite sense. Thus, there is no evidence in this larger sample for an anomalous number of high- galaxies drawn from a reservoir of previously low- galaxies via rapid shrinking/compaction events. (Negative growth at the highest- probably reflect post-quenching dry mergers, which are too slow to mask compaction; see Section 5.)
Figures 5, right, and 6 show that all statements hold once these data are split into starforming/quiescent galaxies using UVJ criteria: At no redshift does the function of quiescent galaxies (red lines) exceed that of all older equal- galaxies, accounting for (dotted horizontal lines), and and are consistent in bins with substantial inter-interval quenching. Indeed, quiescent galaxies never exceed all galaxies in the previous redshift bin—typically separated by more than a quenching time—except at at –2 (descending from galaxies at –3; note that this is well above the threshold identified by Whitaker et al. (2017)). Hence, using a much wider dataset, we still find no evidence for rapidly shrinking blue galaxies to be a meaningful production channel for the quiescent population.
Finally, the yellow trends in Figure 5, right, show G13 + const. model predictions assuming passive galaxies have dex (2 low-side outliers; e.g., Speagle et al. 2014). This quantitatively captures the data at low- and high-, though not the shape of the trend at . To some extent, this reflects a combination of the passive definition and the randomization of initial sizes, which should likely be correlated with SFH features (Section 4; Appendices B, C). To prove it a reflects failing of the constant- assumption, one must marginalize over all plausible SFH models and boundary conditions. We leave such exploration to future work.
Appendix B B: Further quantitative tests of the Basic G13 + constant- growth model
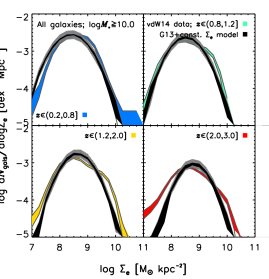
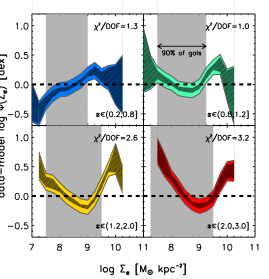
Figure 7, left, shows Figure 5’s vdW14 functions split by redshift and recast using for consistency with the comparison in Figure 4. G13 + constant model predictions are overplotted as black/grey shaded bands. Band widths reflect 20 re-realizations of Section 4.1’s procedure with errors in volume normalization—performed only at —added in quadrature. Figure 7, right, shows the datamodel residuals with the interval containing 90% of galaxies highlighted.
At all , the model-predicted abundances are consistent with the data at describing the vast majority of galaxies. Indeed, with a -axis offset determined only at the lowest-, formal values are reasonable at all epochs. At –3, the model does significantly underproduce the densest 5% of galaxies by a factor of 3 (true at 2 to a factor of 2 in one or two bins at ). Of course, it does produce such galaxies, so it is possible these discrepancies could be mediated by tweaks to the model boundary conditions (Appendix C), which were agnostic to these data (Section 4.2). If not—and the purely empirical counterarguments in Section 3 or Appendix A are unpersuasive—these excesses imply an unmodeled source for the densest objects; perhaps compaction. Regardless, the largest discrepancies in Figure 7 are in fact at the lowest- at . While perhaps a meaningful model shortcoming, this seems unrelated to compaction, which is invoked to explain the opposite end of the spectrum.
Appendix C C: Effects of a simple boundary modification
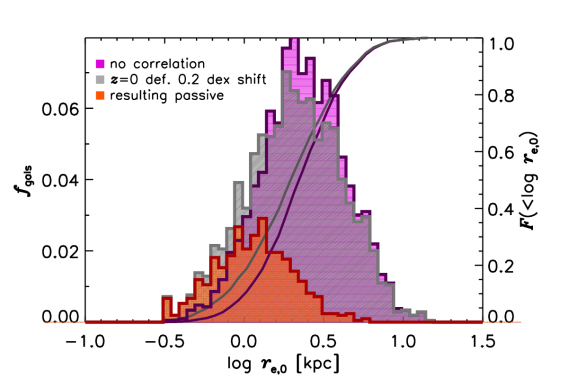
As discussed in the text, the boundary conditions of the basic G13+constant- model in Section 4.1 can be modified to ensure that sufficiently small, passive, high- galaxies are produced without invoking compaction. Principally, instead of being random, the scatter in can be correlated with SFH parameters, biasing smaller objects towards faster-aging systems. This is is akin to linking red galaxies to dispersion-support/low net-angular momentum, as is observed (e.g., Fall & Romanowsky, 2013; Cortese et al., 2016).
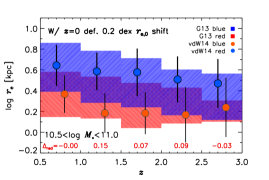
A full analysis of such correlations is beyond the scope of this paper, but we provide a reasonable simulation here by simply shifting by 0.2 dex (1 ) for all G13 galaxies that are passive today. As Figure 8 shows, the resulting distribution is hardly modified from that of the original model. Yet, as Figure 9 shows, all tension in the sizes of, e.g., G13 passive model galaxies at —defined by at the epoch of observation—is removed. Such systems are 0.3 dex larger than vdW14’s measurements using the basic model (for well-resolved systems; left panel), but the simply modified version gets them just right (right panel). This is accomplished assuming only constant- growth; we even ensure no galaxies have smaller initial sizes than the minimum produced in the original version. Also, it was not a guaranteed outcome: If all galaxies quenched at in G13, for example, we would still get Figure 9, right, wrong. Hence, this simple modification correctly links quenching epochs to sizes. Surely, a more sophisticated treatment would also succeed.
References
- Abramson et al. (2015) Abramson, L. E., Gladders, M. D., Dressler, A., et al. 2015, ApJ, 801, L12
- Abramson et al. (2016) —. 2016, ApJ, 832, 7
- Abramson et al. (2014) Abramson, L. E., Kelson, D. D., Dressler, A., et al. 2014, ApJ, 785, L36
- Abramson et al. (2017) Abramson, L. E., Newman, A. B., Treu, T., et al. 2017, ArXiv e-prints, arXiv:1710.00843
- Almaini et al. (2017) Almaini, O., Wild, V., Maltby, D. T., et al. 2017, MNRAS, 472, 1401
- Barro et al. (2013) Barro, G., Faber, S. M., Pérez-González, P. G., et al. 2013, ApJ, 765, 104
- Barro et al. (2015) Barro, G., Faber, S. M., Koo, D. C., et al. 2015, ArXiv e-prints, arXiv:1509.00469
- Baxter et al. (2017) Baxter, E., Chang, C., Jain, B., et al. 2017, ApJ, 841, 18
- Belli et al. (2017) Belli, S., Newman, A. B., & Ellis, R. S. 2017, ApJ, 834, 18
- Bezanson et al. (2009) Bezanson, R., van Dokkum, P. G., Tal, T., et al. 2009, ApJ, 697, 1290
- Bouwens et al. (2017) Bouwens, R. J., van Dokkum, P. G., Illingworth, G. D., et al. 2017, ArXiv e-prints, arXiv:1711.02090
- Brammer et al. (2008) Brammer, G. B., van Dokkum, P. G., & Coppi, P. 2008, ApJ, 686, 1503
- Brammer et al. (2012) Brammer, G. B., van Dokkum, P. G., Franx, M., et al. 2012, ApJS, 200, 13
- Burkert et al. (2016) Burkert, A., Förster Schreiber, N. M., Genzel, R., et al. 2016, ApJ, 826, 214
- Calzetti et al. (2000) Calzetti, D., Armus, L., Bohlin, R. C., et al. 2000, ApJ, 533, 682
- Carollo et al. (2013) Carollo, C. M., Bschorr, T. J., Renzini, A., et al. 2013, ApJ, 773, 112
- Castellano et al. (2016) Castellano, M., Amorín, R., Merlin, E., et al. 2016, A&A, 590, A31
- Ceverino et al. (2015) Ceverino, D., Dekel, A., Tweed, D., & Primack, J. 2015, MNRAS, 447, 3291
- Chabrier (2003) Chabrier, G. 2003, PASP, 115, 763
- Cortese et al. (2016) Cortese, L., Fogarty, L. M. R., Bekki, K., et al. 2016, MNRAS, 463, 170
- Daddi et al. (2007) Daddi, E., Dickinson, M., Morrison, G., et al. 2007, ApJ, 670, 156
- Diemer et al. (2017a) Diemer, B., Mansfield, P., Kravtsov, A. V., & More, S. 2017a, ApJ, 843, 140
- Diemer et al. (2017b) Diemer, B., Sparre, M., Abramson, L. E., & Torrey, P. 2017b, ApJ, 839, 26
- Dressler (1980) Dressler, A. 1980, ApJ, 236, 351
- Dressler et al. (2016) Dressler, A., Kelson, D. D., Abramson, L. E., et al. 2016, ApJ, 833, 251
- El-Badry et al. (2016) El-Badry, K., Wetzel, A., Geha, M., et al. 2016, ApJ, 820, 131
- Fagioli et al. (2016) Fagioli, M., Carollo, C. M., Renzini, A., et al. 2016, ApJ, 831, 173
- Fall & Romanowsky (2013) Fall, S. M., & Romanowsky, A. J. 2013, ApJ, 769, L26
- Fang et al. (2013) Fang, J. J., Faber, S. M., Koo, D. C., & Dekel, A. 2013, ApJ, 776, 63
- Feldmann et al. (2016) Feldmann, R., Hopkins, P. F., Quataert, E., Faucher-Giguère, C.-A., & Kereš, D. 2016, MNRAS, 458, L14
- Franx et al. (2008) Franx, M., van Dokkum, P. G., Schreiber, N. M. F., et al. 2008, ApJ, 688, 770
- Gladders et al. (2013) Gladders, M. D., Oemler, A., Dressler, A., et al. 2013, ApJ, 770, 64
- Holmberg (1965) Holmberg, E. 1965, Arkiv for Astronomi, 3, 387
- Hopkins et al. (2009) Hopkins, P. F., Hernquist, L., Cox, T. J., Keres, D., & Wuyts, S. 2009, ApJ, 691, 1424
- Ilbert et al. (2010) Ilbert, O., Salvato, M., Le Floc’h, E., et al. 2010, ApJ, 709, 644
- Illingworth et al. (2016) Illingworth, G., Magee, D., Bouwens, R., et al. 2016, ArXiv e-prints, arXiv:1606.00841
- Illingworth et al. (2013) Illingworth, G. D., Magee, D., Oesch, P. A., et al. 2013, ApJS, 209, 6
- Kelson (2014) Kelson, D. D. 2014, ArXiv e-prints, arXiv:1406.5191
- Kelson et al. (2016) Kelson, D. D., Benson, A. J., & Abramson, L. E. 2016, ArXiv e-prints, arXiv:1610.06566
- Kennicutt (1998) Kennicutt, Jr., R. C. 1998, ApJ, 498, 541
- Kriek et al. (2009) Kriek, M., van Dokkum, P. G., Labbé, I., et al. 2009, ApJ, 700, 221
- Lang et al. (2014) Lang, P., Wuyts, S., Somerville, R. S., et al. 2014, ApJ, 788, 11
- Larson et al. (1980) Larson, R. B., Tinsley, B. M., & Caldwell, C. N. 1980, ApJ, 237, 692
- Leitner (2012) Leitner, S. N. 2012, ApJ, 745, 149
- Lilly & Carollo (2016) Lilly, S. J., & Carollo, C. M. 2016, ApJ, 833, 1
- Lotz et al. (2017) Lotz, J. M., Koekemoer, A., Coe, D., et al. 2017, ApJ, 837, 97
- Mo et al. (1998) Mo, H. J., Mao, S., & White, S. D. M. 1998, MNRAS, 295, 319
- Momcheva et al. (2016) Momcheva, I. G., Brammer, G. B., van Dokkum, P. G., et al. 2016, ApJS, 225, 27
- Morishita & Ichikawa (2016) Morishita, T., & Ichikawa, T. 2016, ApJ, 816, 87
- Morishita et al. (2014) Morishita, T., Ichikawa, T., & Kajisawa, M. 2014, ApJ, 785, 18
- Morishita et al. (2015) Morishita, T., Ichikawa, T., Noguchi, M., et al. 2015, ApJ, 805, 34
- Morishita et al. (2017) Morishita, T., Abramson, L. E., Treu, T., et al. 2017, ApJ, 835, 254
- Mosleh et al. (2013) Mosleh, M., Williams, R. J., & Franx, M. 2013, ApJ, 777, 117
- Naab et al. (2009) Naab, T., Johansson, P. H., & Ostriker, J. P. 2009, ApJ, 699, L178
- Nelson et al. (2016) Nelson, E. J., van Dokkum, P. G., Förster Schreiber, N. M., et al. 2016, ApJ, 828, 27
- Newman et al. (2012) Newman, A. B., Ellis, R. S., Bundy, K., & Treu, T. 2012, ApJ, 746, 162
- Nipoti et al. (2012) Nipoti, C., Treu, T., Leauthaud, A., et al. 2012, MNRAS, 422, 1714
- Noeske et al. (2007) Noeske, K. G., Weiner, B. J., Faber, S. M., et al. 2007, ApJ, 660, L43
- Papovich et al. (2015) Papovich, C., Labbé, I., Quadri, R., et al. 2015, ApJ, 803, 26
- Peng et al. (2002) Peng, C. Y., Ho, L. C., Impey, C. D., & Rix, H.-W. 2002, AJ, 124, 266
- Peng et al. (2015) Peng, Y., Maiolino, R., & Cochrane, R. 2015, Nature, 521, 192
- Poggianti et al. (2013a) Poggianti, B. M., Moretti, A., Calvi, R., et al. 2013a, ApJ, 777, 125
- Poggianti et al. (2013b) Poggianti, B. M., Calvi, R., Bindoni, D., et al. 2013b, ApJ, 762, 77
- Salim et al. (2007) Salim, S., Rich, R. M., Charlot, S., et al. 2007, ApJS, 173, 267
- Schmidt (1959) Schmidt, M. 1959, ApJ, 129, 243
- Schreiber et al. (2015) Schreiber, C., Pannella, M., Elbaz, D., et al. 2015, A&A, 575, A74
- Sérsic (1963) Sérsic, J. L. 1963, Boletin de la Asociacion Argentina de Astronomia La Plata Argentina, 6, 99
- Shen et al. (2003) Shen, S., Mo, H. J., White, S. D. M., et al. 2003, MNRAS, 343, 978
- Skelton et al. (2014) Skelton, R. E., Whitaker, K. E., Momcheva, I. G., et al. 2014, ApJS, 214, 24
- Sonnenfeld et al. (2014) Sonnenfeld, A., Nipoti, C., & Treu, T. 2014, ApJ, 786, 89
- Speagle et al. (2014) Speagle, J. S., Steinhardt, C. L., Capak, P. L., & Silverman, J. D. 2014, ApJS, 214, 15
- Szomoru et al. (2013) Szomoru, D., Franx, M., van Dokkum, P. G., et al. 2013, ApJ, 763, 73
- Treu et al. (2015) Treu, T., Schmidt, K. B., Brammer, G. B., et al. 2015, ApJ, 812, 114
- Trujillo et al. (2007) Trujillo, I., Conselice, C. J., Bundy, K., et al. 2007, MNRAS, 382, 109
- Valentinuzzi et al. (2010) Valentinuzzi, T., Fritz, J., Poggianti, B. M., et al. 2010, ApJ, 712, 226
- van der Wel et al. (2014) van der Wel, A., Franx, M., van Dokkum, P. G., et al. 2014, ApJ, 788, 28
- van Dokkum et al. (2015) van Dokkum, P. G., Nelson, E. J., Franx, M., et al. 2015, ApJ, 813, 23
- Wechsler et al. (2006) Wechsler, R. H., Zentner, A. R., Bullock, J. S., Kravtsov, A. V., & Allgood, B. 2006, ApJ, 652, 71
- Wetzel et al. (2013) Wetzel, A. R., Tinker, J. L., Conroy, C., & van den Bosch, F. C. 2013, MNRAS, 432, 336
- Whitaker et al. (2012) Whitaker, K. E., van Dokkum, P. G., Brammer, G., & Franx, M. 2012, ApJ, 754, L29
- Whitaker et al. (2014) Whitaker, K. E., Franx, M., Leja, J., et al. 2014, ApJ, 795, 104
- Whitaker et al. (2017) Whitaker, K. E., Bezanson, R., van Dokkum, P. G., et al. 2017, ApJ, 838, 19
- Wild et al. (2016) Wild, V., Almaini, O., Dunlop, J., et al. 2016, ArXiv e-prints, arXiv:1608.00588
- Williams et al. (2017) Williams, C. C., Giavalisco, M., Bezanson, R., et al. 2017, ApJ, 838, 94
- Williams et al. (2009) Williams, R. J., Quadri, R. F., Franx, M., van Dokkum, P., & Labbé, I. 2009, ApJ, 691, 1879
- Yano et al. (2016) Yano, M., Kriek, M., van der Wel, A., & Whitaker, K. E. 2016, ApJ, 817, L21
- Zolotov et al. (2015) Zolotov, A., Dekel, A., Mandelker, N., et al. 2015, MNRAS, 450, 2327