Ultrafast Melting of Spin Density Wave Order in BaFe2As2 Observed by Time- and Angle-Resolved Photoemission Spectroscopy with Extreme-Ultraviolet Higher Harmonic Generation
Abstract
Transient single-particle spectral function of BaFe2As2, a parent compound of iron-based superconductors, has been studied by time- and angle-resolved photoemission spectroscopy with an extreme-ultraviolet laser generated by higher harmonics from Ar gas, which enables us to investigate the dynamics in the entire Brillouin zone. We observed electronic modifications from the spin-density-wave (SDW) ordered state within 1 ps after the arrival of a 1.5 eV pump pulse. We observed optically excited electrons at the zone center above at 0.12 ps, and their rapid decay. After the fast decay of the optically excited electrons, a thermalized state appears and survives for a relatively long time. From the comparison with the density-functional theory band structure for the paramagnetic and SDW states, we interpret the experimental observations as the melting of the SDW. Exponential decay constants for the thermalized state to recover back to the SDW ground state are 0.60 ps both around the zone center and the zone corner.
pacs:
74.25.Jb, 75.30.Fv, 74.70.Xa, 78.47.D-Ultrafast phenomena in condensed matter have been the subject of intense research. In order to investigate nonequilibrium transient states in solids, the pulsed photons are divided into pump and probe portions: the pump pulses excite the system and the probe pulses measure various physical quantities of the transient states after variable delay times. On the other hand, angle-resolved photoemission spectroscopy (ARPES) is a versatile tool to study the electronic structure of solids with momentum resolution. Combining these strengths, time- and angle-resolved photoemission spectroscopy (TrARPES) was realized shortly after the advent of laser-based ARPES. TrARPES technique has been utilized to study ultrafast dynamics of various materials including charge-density-wave materials Schmitt.F_etal.Science2008 ; Petersen.J_etal.Phys.-Rev.-Lett.2011 , cuprate superconductors Graf.J_etal.Nat-Phys2011 , graphene Johannsen.J_etal.Phys.-Rev.-Lett.2013 ; Ulstrup.S_etal.Phys.-Rev.-Lett.2014 , and topological insulators Sobota.J_etal.Phys.-Rev.-Lett.2013 ; Yamamoto.T_etal.Phys.-Rev.-B2015 .
The ultrafast dynamics of iron-based superconductors (FeSCs) has also been the focus of intense research. In particular, coherent phonon oscillations of the As atoms have been observed by various pump-probe experiments. Mansart et al. Mansart.B_etal.Phys.-Rev.-B2009 reported oscillatory components overlaid on exponential decay in the transient reflectivity spectra of Ba(Fe0.92Co0.08)2As2. TrARPES studies on Ba/EuFe2As2 Rettig.L_etal.Phys.-Rev.-Lett.2012 ; Avigo.I_etal.J.-Phys.-Condens.-Matter2013 found oscillations of the chemical potential of the electrons after the pump pulse. Time-resolved x-ray diffraction experiments Rettig.L_etal.Phys.-Rev.-Lett.2015 ; Gerber.S_etal.Nat-Commun2015 measured the oscillations in the intensity of the Bragg reflections from BaFe2As2 (Ba122). A natural question is how the electronic system is modified concomitantly with the lattice. Since the temperature scale of the pump beam (1.5 eV 17400 K) is much higher than , it may drive the electronic system to undergo a phase transition to the paramagnetic (PM) state. In equilibrium, the reconstruction of the band structure across the SDW transition has been clearly observed by ARPES by changing temperature Yi.M_etal.Phys.-Rev.-B2009 . Therefore, one expects that the phase transition can be induced by optical pumping and the relaxation to the SDW ground state is detectable by TrARPES. Furthermore, since investigations into SDW materials by TrARPES have been limited, TrARPES studies on Ba122 will give us insight into the dynamics of SDW formation in general.
Conventional TrARPES typically utilizes 6-7 eV laser achieved by wavelength conversion. For the FeSCs, however, the information about electron pockets around the X point cannot be obtained. To overcome this hurdle, we have employed higher harmonic generation (HHG) by focusing fundamental light to a cell filled with rare gas Shen.Y_etal.2003 . This method can create photons in the extreme ultraviolet regime ( eV), which are high enough to probe the entire Brillouin zone (BZ) of FeSCs. A previous work by Yang et al. Yang.X_etal.Phys.-Rev.-Lett.2014 utilized a similar setup and observed a global oscillation of the chemical potential due to the phonon mode of As atoms both at the and X points. However, the time-resolved data in that work were limited to the evolution of angle-integrated photoemission intensity.
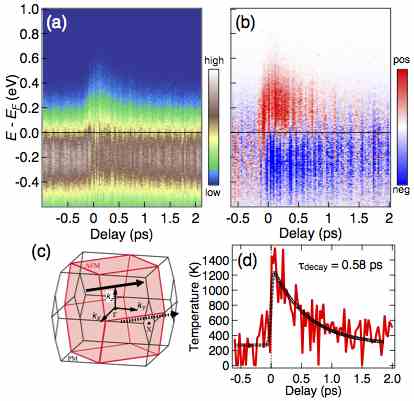
In the present work, we have performed TrARPES measurements of Ba122 in the SDW state in order to directly measure transient single-particle spectral functions both around the zone center and zone corner. The fundamental laser system is a 1 kHz Ti:Sapphire laser operating at wavelengths () of 800 nm with a pulse width of 90 fs. The second harmonics with 400 nm generated by a 0.5-mm-thick -BaB2O4 crystal are employed as the source of HHG. Higher harmonics (HHs) were generated by irradiating the second harmonics to a cell filled with Ar gas and the 9th harmonics with 28 eV were selected by a pair of SiC/Mg multilayer mirrors by suppressing other HHs Ishizaka.K_etal.Phys.-Rev.-B2011 . Ba122 Single crystals were not detwinned and, therefore, the ARPES intensity is the superposition of intensities from two inequivalent domains in the SDW state. The kinetic energies and the momenta of photoelectrons were measured using a Scienta R4000 hemispherical electron energy analyzer. The total energy resolution was 250 meV. All the measurements were done at 10 K, which was well below the of the equilibrium SDW transition. The first BZs for the PM and antiferromagnetic (AFM) states are shown in Fig. 1 (c). For simplicity, we shall use the notation of the PM BZ to specify positions in the momentum space. In-plane (, ) and out-of-plane () momenta are expressed in units of and , respectively, where Å and Å are the in-plane and out-of-plane lattice constants, respectively.

Figure 1 (a) shows the temporal evolution of angle-integrated photoemission (PES) spectra around the zone center. With eV probe photons the momentum cut is on the plane as shown by a solid arrow in Fig. 1 (c). One observes that upon the arrival of a pump pulse at , the electron population above the Fermi level () suddenly increases and it decays afterwards. To improve the visibility of the data, we show the difference spectra in Fig. 1 (b). Here, the spectrum average before has been subtracted. It is clear that just after the population above increases while that below decreases, and that this population modification decreases with delay time. In order to quantify the transient state, we show in Fig. 1 (d) the electronic temperature as a function of delay time. was determined by fitting the PES intensity at each delay time to a Fermi-Dirac distribution function convoluted with a Gaussian with the instrumental resolution of 250 meV. After the pump pulse, reaches K. was fitted to a decay function of the form , where is the Heaviside step function. The best fit is shown by a dotted curve. We obtained a decay constant of ps around the (0,0,6.5) point.

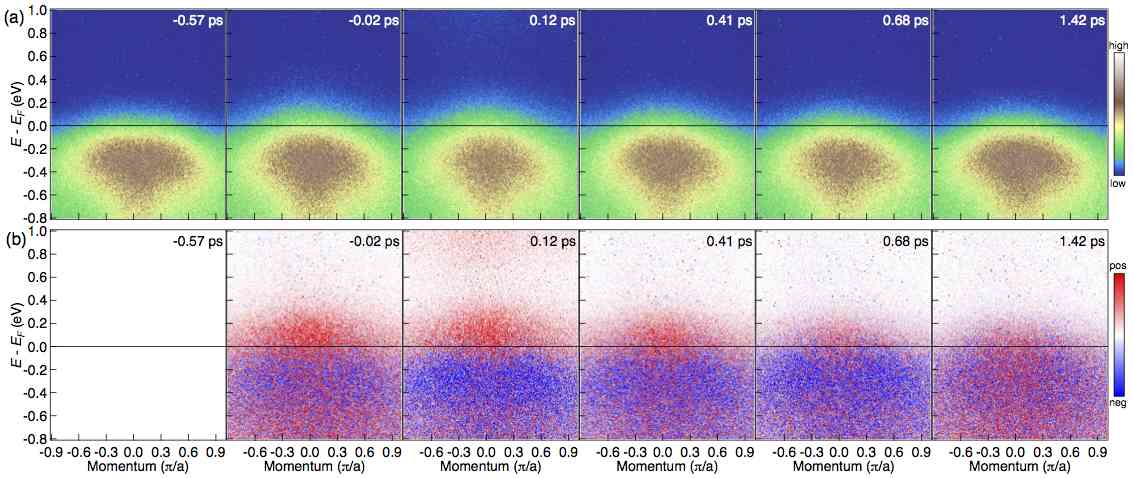
In order to study the momentum-resolved spectral function during the relaxation, we show in Fig. 2 (a) the TrARPES spectra taken at different delay times. The momentum cut is the same as that of Fig. 1. To highlight the change of the spectra, we also show the difference TrARPES spectra in Fig. 2 (b). Here, the spectrum at -0.47 ps has been subtracted from each spectrum. Before the pump arrival (-0.47 ps), the spectrum should represent that of the SDW state, although the identification is not obvious under the present experimental resolution. We later argue that the spectrum represents that of the SDW state. After the arrival of pump pulse ( ps), electrons start to occupy states above . At 0.12 ps, high-energy states are populated above the gap ( eV) and the states have parabolic, electron-band-like intensity distribution. At 0.41 ps, this population disappears, indicating the fast decay of electrons in the high energy state. As for the intensity between eV, it already exists at -0.02 ps, reaches maximum around 0.12 ps, and slowly decays as a function of time. At 1.42 ps, there is almost no separation of positive and negative area in the difference spectrum, indicating that the electronic system has relaxed back to the equilibrium state.
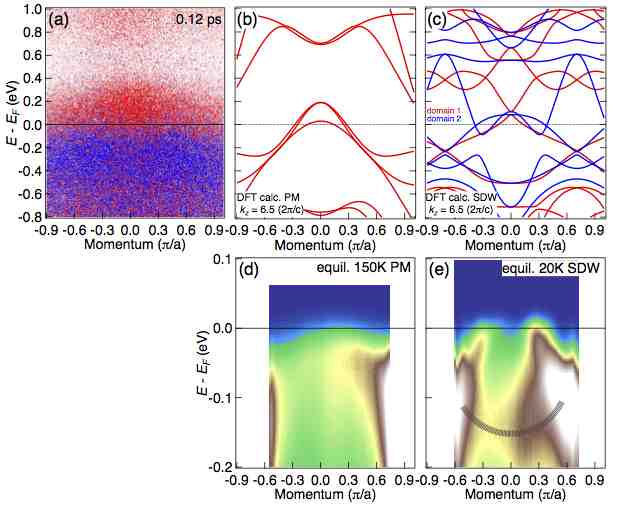
Here we discuss the implications of the present data for an ultrafast phase transition. In the following, we argue that the observed hot electron states are those of the PM states caused by the melting of the SDW state. We compare in Figs. 3 (a) and (b) the difference spectrum at 0.12 ps with density-functional theory (DFT) band structure at () in the PM state calculated within the generalized gradient approximation (GGA) Perdew.J_etal.Phys.-Rev.-Lett.1996 . The intensity increase is shown by red in the difference spectrum in Fig. 3 (a). We can confirm high-energy population above 0.6 eV and a gap between eV. This is qualitatively consistent with the calculated PM band structure shown in Fig. 3 (b), and quantitatively the smaller gap in experiment can be ascribed either to the renormalization of the band structure or to the experimental resolution. We also show the DFT band structures for the SDW state in Fig. 3 (c). Since the Ba122 samples were not detwinned, we show the results for two inequivalent domains. One observes that the band structure near in the SDW state is more entangled than that in the PM state, due to the band folding caused by the AFM ordering. In particular, the band bottoms of domain 1 at 0.3 eV and the flat band at 0.6 eV of domain 2 are not clearly resolved in the present measurement. From these comparisons, the electronic states at 0.12 ps can be identified as that of the PM state, as expected from the high K after the optical pump.
To gain further insight from the intensity decrease shown in blue, equilibrium spectra taken with eV (Z point) for the SDW (20K) and PM (150 K) states are shown in Figs. 3 (d) and (e), respectively. We note that the blue intensity in panel (a) shows a parabolic, electron-band-like feature. We ascribe this to a parabolic feature observed in the equilibrium the SDW state as indicated by a black dotted line in Fig. 3 (e), which does not appear in the PM state [Fig. 3 (d)]. This feature originates from the electron band bottom located at the zone corner in the PM state. The disappearance of this feature by raising the temperature from the SDW state to the PM state is also reported in Ref. Yi.M_etal.Phys.-Rev.-B2009, . Thus the data at -0.47 ps can be naturally assigned to those of the SDW state, as expected from the sample temperature of 10 K .

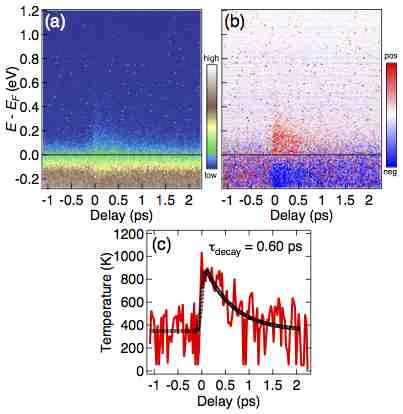
Next we investigate the dynamics of excited electrons around the zone corner. Figure 4 (a) shows the temporal evolution of angle-integrated PES spectra at the (1,1,6.1) point. We employed eV and the momentum cut in the BZ is indicated by a dotted arrow in Fig. 1 (c). The difference spectra are also shown in Fig. 4 (b). As in the case of the (0,0,6.5) point, the intensity above increases and that below decreases at , and this change weakens with time. The evolution of is plotted in Fig. 4 (c). rises up to 900 K just after the pump pulse. We obtain a decay constant of ps, close to ps around the (0,0,6.5) point.

TrARPES spectra around the (1,1,6.1) point are shown in Fig. 5 (a) and the difference spectra are shown in Fig. 5 (b). Although the modifications in the spectra are weaker than those in the zone center, we observed an intensity increase after the pump pulse. Note that we did not observe high-energy population well above within our measurement range. To understand the difference between the results for the (0,0,6.5) and (1,1,6.1) points, we show the calculated PM band structure in Fig. 5 (c). One of the two bands located around 1 eV above is holelike and flat; as a result, the lifetime of excited electrons around the (1,1,6.1) point can be much shorter than around that at (0,0,6.5), because they can easily decay into different momentum states via electron-phonon and/or electron-electron interactions. To support the interpretation, we also show the calculated SDW band structure for two domains in Fig. 5 (d). As in the (0,0,6.5) point, there are more bands in the SDW state than in the PM state. In particular, there are three electron band bottoms between eV, where long excitation lifetime is expected. The absence of the observation of transient population in this energy range corroborates our assignment of the transient states between 0.1 and 0.2 ps to the PM state.

While the high-energy electrons above 0.6 eV around point decay quickly ( ps), the hot electrons close to persist for a longer time, which can be interpreted as the thermalized electronic states. For the time scale of the relaxation of near- states, we compare the present decay constants with those from previous works. The present value 0.60 ps for 10 K is close to 0.8 ps for EuFe2As2 Rettig.L_etal.Phys.-Rev.-Lett.2012 , 0.38 ps for Ba122 Yang.X_etal.Phys.-Rev.-Lett.2014 . Also, it is comparable with 0.6-0.8 ps for superconducting Ba1-xKxFe2As2 Chia.E_etal.Phys.-Rev.-Lett.2010 estimated from time-resolved reflectivity. As for the A1g phonon mode, we did not observe any oscillatory intensity modulation near . Mansart et al. Mansart.B_etal.Phys.-Rev.-B2009 found that, while the phonon oscillation is barely visible at mJ/cm2 in the course of the exponential decay of the reflectivity, it becomes more prominent at higher flux ( mJ/cm2) and makes the relaxation slower. The absence of oscillations may suggest that our data represents the electronic state in weakly pumped regime. Other possibilities include the polarization and the width of the pump pulse. We need further investigation into the dependence of the transient states on fluence, polarization and pump width in the future.
In conclusion, we have studied the ultrafast dynamics of the BaFe2As2 in the SDW state by TrARPES using a HH from rare gas. We observed electronic modifications from the SDW band structure within 1 ps after the 1.5 eV pump pulse. High-energy states above were observed at 0.12 ps at the zone center and they decay rapidly. The 0.12 ps spectrum is more consistent with the band structure calculation of the PM state than that of the SDW state, which is expected from the high above 1000 K. After the fast decay of the optically excited electrons, a thermalized state appears and survives for a relatively long time. Decay constants both around the point and the X point are 0.60 ps, in agreement with previous TrARPES and time-resolved reflectivity measurements.
This work was supported by JSPS KAKENHI (Grant No. JP26610095) and Photon and Quantum Basic Research Coordinated Development Program from the Ministry of Education, Culture, Sports, Science and Technology, Japan. Experiment at Photon Factory was approved by the Photon Factory Program Advisory Committee (Proposal No. 2014G177). H.S. acknowledges financial support from Advanced Leading Graduate Course for Photon Science (ALPS) and the JSPS Research Fellowship for Young Scientists.
References
- (1) F. Schmitt, P. S. Kirchmann, U. Bovensiepen, R. G. Moore, L. Rettig, M. Krenz, J.-H. Chu, N. Ru, L. Perfetti, D. H. Lu, M. Wolf, I. R. Fisher, and Z.-X. Shen, Science 321, 1649 (2008).
- (2) J. C. Petersen, S. Kaiser, N. Dean, A. Simoncig, H. Y. Liu, A. L. Cavalieri, C. Cacho, I. C. E. Turcu, E. Springate, F. Frassetto, L. Poletto, S. S. Dhesi, H. Berger, and A. Cavalleri, Phys. Rev. Lett. 107, 177402 (2011).
- (3) J. Graf, C. Jozwiak, C. L. Smallwood, H. Eisaki, R. A. Kaindl, D.-H. Lee, and A. Lanzara, Nat. Phys. 7, 805 (2011).
- (4) J. C. Johannsen, S. Ulstrup, F. Cilento, A. Crepaldi, M. Zacchigna, C. Cacho, I. C. E. Turcu, E. Springate, F. Fromm, C. Raidel, T. Seyller, F. Parmigiani, M. Grioni, and P. Hofmann, Phys. Rev. Lett. 111, 027403 (2013).
- (5) S. Ulstrup, J. C. Johannsen, F. Cilento, J. A. Miwa, A. Crepaldi, M. Zacchigna, C. Cacho, R. Chapman, E. Springate, S. Mammadov, F. Fromm, C. Raidel, T. Seyller, F. Parmigiani, M. Grioni, P. D. C. King, and P. Hofmann, Phys. Rev. Lett. 112, 257401 (2014).
- (6) J. A. Sobota, S.-L. Yang, A. F. Kemper, J. J. Lee, F. T. Schmitt, W. Li, R. G. Moore, J. G. Analytis, I. R. Fisher, P. S. Kirchmann, T. P. Devereaux, and Z.-X. Shen, Phys. Rev. Lett. 111, 136802 (2013).
- (7) T. Yamamoto, Y. Ishida, R. Yoshida, M. Okawa, K. Okazaki, T. Kanai, A. Kikkawa, Y. Taguchi, T. Kiss, K. Ishizaka, N. Ishii, J. Itatani, S. Watanabe, Y. Tokura, T. Saitoh, and S. Shin, Phys. Rev. B 92, 121106 (2015).
- (8) B. Mansart, D. Boschetto, A. Savoia, F. Rullier-Albenque, A. Forget, D. Colson, A. Rousse, and M. Marsi, Phys. Rev. B 80, 172504 (2009).
- (9) L. Rettig, R. Cortés, S. Thirupathaiah, P. Gegenwart, H. S. Jeevan, M. Wolf, J. Fink, and U. Bovensiepen, Phys. Rev. Lett. 108, 097002 (2012).
- (10) I. Avigo, R. Cortés, L. Rettig, S. Thirupathaiah, H. S. Jeevan, P. Gegenwart, T. Wolf, M. Ligges, M. Wolf, J. Fink, and U. Bovensiepen, J. Phys. Condens. Matter 25, 094003 (2013).
- (11) L. Rettig, O. Mariager, S. A. Ferrer, S. Grübel, A. Johnson, J. J. Rittmann, T. Wolf, L. Johnson, S. G. Ingold, P. Beaud, and U. Staub, Phys. Rev. Lett. 114, 067402 (2015).
- (12) S. Gerber, K. W. Kim, Y. Zhang, D. Zhu, N. Plonka, M. Yi, G. L. Dakovski, D. Leuenberger, P. S. Kirchmann, R. G. Moore, M. Chollet, J. M. Glownia, Y. Feng, J. S. Lee, A. Mehta, A. F. Kemper, T. Wolf, Y. D. Chuang, Z. Hussain, C. C. Kao, B. Moritz, Z. X. Shen, T. P. Devereaux, and W. S. Lee, Nat. Commun. 6, 7377 (2015).
- (13) M. Yi, D. H. Lu, J. G. Analytis, J.-H. Chu, S.-K. Mo, R.-H. He, M. Hashimoto, R. G. Moore, I. I. Mazin, D. J. Singh, Z. Hussain, I. R. Fisher, and Z.-X. Shen, Phys. Rev. B 80, 174510 (2009).
- (14) Y. R. Shen, The principles of nonlinear optics (Wiley-Interscience, Hoboken, 2003).
- (15) X. Yang, L. G. Rohde, T. Rohwer, A. Stange, K. Hanff, C. Sohrt, L. Rettig, R. Cortés, F. Chen, L. Feng, D. T. Wolf, B. Kamble, I. Eremin, T. Popmintchev, M. Murnane, M. C. Kapteyn, H. L. Kipp, J. Fink, M. Bauer, U. Bovensiepen, and K. Rossnagel, Phys. Rev. Lett. 112, 207001 (2014).
- (16) K. Ishizaka, T. Kiss, T. Yamamoto, Y. Ishida, T. Saitoh, M. Matsunami, R. Eguchi, T. Ohtsuki, A. Kosuge, T. Kanai, M. Nohara, H. Takagi, S. Watanabe, and S. Shin, Phys. Rev. B 83, 081104 (2011).
- (17) J. P. Perdew, K. Burke, and M. Ernzerhof, Phys. Rev. Lett. 77, 3865 (1996).
- (18) E. E. M. Chia, D. Talbayev, J.-X. Zhu, H. Q. Yuan, T. Park, J. D. Thompson, C. Panagopoulos, G. F. Chen, J. L. Luo, N. L. Wang, and A. J. Taylor, Phys. Rev. Lett. 104, 027003 (2010).