Matching Community Structure Across Online Social Networks
Abstract
The discovery of community structure in networks is a problem of considerable interest in recent years. In online social networks, often times, users are simultaneously involved in multiple social media sites, some of which share common social relationships. It is of great interest to uncover a shared community structure across these networks. However, in reality, users typically identify themselves with different usernames across social media sites. This creates a great difficulty in detecting the community structure. In this paper, we explore several approaches for community detection across online social networks with limited knowledge of username alignment across the networks. We refer to the known alignment of usernames as seeds. We investigate strategies for seed selection and its impact on networks with a different fraction of overlapping vertices. The goal is to study the interplay between network topologies and seed selection strategies, and to understand how it affects the detected community structure. We also propose several measures to assess the performance of community detection and use them to measure the quality of the detected communities in both Twitter-Twitter networks and Twitter-Instagram networks.
1 Introduction
The problem of detecting communities is one of the most important tasks when studying networks. Community detection can be viewed as partitioning a graph into subgraphs with a higher probability of interaction between vertices of the same subgraph than vertices of different subgraphs. Finding community structure in networks often provides important information about the function and organization of the network.
In this paper, we explore several strategies for detecting a shared community structure across online social networks (e.g., Twitter, Instagram, etc.) with a focus on addressing two important issues that often come up when dealing with data from multiple online social networks.
-
•
Unknown alignment of users across social networks: In online social networks, users are identified by their usernames. They may use different usernames for various social media sites and multiple users may have similar usernames across different sites. Although there are methods such as named entity disambiguation that can help in identifying users from their public profiles, depending on the quality and consistency of the information provided across domains, only a small percentage of the mapping between usernames can be inferred with high confidence. We refer to these aligned users as seeds. A natural question is how to take advantage of this extra seed information for finding a shared community structure across online social networks.
-
•
Unknown fraction of shared users between social networks: Online social networks have become important tools for sharing, discovery and networking. They differ in what service or function they provide—e.g., share pictures, write comments, make friends with common interests, etc. While many users are involved in multiple online social networks and they have common connections across networks, it is not clear how much overlap there is across real-world social networks and how the community structure is affected as the fraction of this overlap changes.
To address the above issues and set the scope of this paper, we assume that there is an implicit community structure that describes the social relationships between people, and each network observed from a particular social media site provides partial information about this underlying community structure. By combining information from multiple social networks, one can find a shared community structure that more accurately captures the overall social structure.
With the above assumption, community detection across social networks can be useful for several important applications. First, it provides a comprehensive understanding of users’ social behaviors and subsequently, it allows us to examine the similarities and differences between communities across online social networks. Second, given that we do not have the exact username alignment across networks, the detected communities can be used as a tool to improve the named entity disambiguation results by adjusting the scores for pairs of usernames based on their community memberships, because similar usernames across networks are more likely to be associated to the same person if they belong to the same community. Lastly, community detection across two social networks can be useful in solving large-scale graph matching problem through a divide-and-conquer procedure [14]: vertices of the two graphs are jointly clustered based on their community memberships and then one can run any graph matching algorithm in parallel within each cluster.
The rest of the paper is organized as follows. Section 2 presents previous work on community detection in networks and some generalization to multilayer networks. In Section 3, we describe a range of strategies for community detection across networks using only seeds and explain several measures that we use to assess the performance of the detection. In Section 4, we will present performance analysis for different community detection strategies on networks with a different fraction of shared users and a varying number of seeds. Our goal is to understand how the network structure (i.e., fraction of shared vertices) and seeds affect the detection of communities across networks. Also, several seed selection strategies are proposed and compared with a goal of improving the community detection performance. The results are presented using both Twitter-Twitter networks and Twitter-Instagram networks. Conclusions and some future directions are presented in Section 5.
2 Related Work
Many methods for community detection have been proposed over the years. Some of the most popular methods include hierarchical clustering [8, 6, 19], modularity maximization [17, 9, 3, 25, 1], Infomap [22, 24], clique percolation [18], Potts spin glass model approach [20, 21] and many others. Lancichinetti and Fortunato have carried out a careful comparative analysis of these methods against a set of benchmark graphs [12] (i.e., the LFR benchmark [13], the benchmark by Girvan and Newman [8] and random graphs [7]). The results of their tests show that Infomap [23], which is based on a compression of information on the network, has excellent performance. The modularity-based Louvain algorithm [1] and the Potts spin glass model [21] also have good performance.
More recently, the study of multilayer networks has become an important research direction in network science [16]. A general notion of a multilayer network consists of a set of networks called layers [16, 5] and a set of interlayer edges that connect vertices across layers. Despite the large volume of research on community detection in networks, only a few approaches have been proposed for combining multiple layers for community detection in multilayer networks. They can be generally divided into three classes—aggregation [5], linking [10] (also referred to as classical random walk), and relaxed random walk [4]. The aggregation approach transforms a multi-layer network to a single layer network by merging aligned vertices and then applies community detection on the resulting graph. The linking approach preserves the multilayer structure by connecting aligned vertices in different layers and then performing community detection on the final result. A challenge in this case is extending standard cost functions to the multilayer structure, e.g., modularity [16]. Finally, relaxed random walk switches between intralayer and interlayer random walks where the interlayer walk is to the neighbors of the aligned vertices.
All of the above methods assume that vertices across layers have a known alignment. As hinted earlier, this assumption is not true in our problem: (1) we may not know the alignment because of different usernames; (2) a user may not appear in both networks.
3 Matching Community Structure
In this paper, we focus on exploring various strategies for learning the community structure across online social networks, particularly when we have limited knowledge of the alignment between usernames across social networks. As mentioned earlier, many users are involved in multiple social networks. We model the interactions between users in various networks as a multilayer network , where each layer is represented by a graph that describes the interactions between users in a particular social network. The key to detect communities across networks is to connect the networks via shared users (see Section 2). However, in practice users are identified by their usernames which are not unique across different networks. Hence, we have limited information about the alignment of users across networks and we call this information seeds.
Without loss of generality and for ease of notation, we now restrict our attention to the two-layer network case, i.e., . Let be the set of all aligned users across and , where and . Let denote a set of seeds and thus . The goal is to obtain a shared community structure for the given multilayer network using only seeds and to understand the effect of on the performance of the community detection. To this end, we first explain three approaches for multilayer community detection. Then we introduce three measures to assess the performance of the detection.
3.1 Methods
For multilayer community detection, we combine two methodologies. First, we focus on random walks on multilayer networks. As mentioned in Section 2, we apply the three approaches of aggregation, linking, and relaxed random walk to construct a network for analysis. Second, we focus on Infomap [24] as a community detection algorithm. Since Infomap is random walk based, it is straightforward to adapt it to the various multilayer network construction approaches. The three approaches for multilayer analysis are shown in Figure 1 and described as follows.


Aggregation approach. This approach first aggregates the network layers into a single (monoplex) network by merging pairs of vertices in the seed set and then applies a standard community detection methods to this network. Moreover, if a ground-truth community is given, then one can also compute an optimal linear weights for combining the layers. It should also be noted that taking the mean or the sum of the edge weights across layers can be problematic, particularly in the case of temporal multilayer networks because it makes a restrictive assumption on the interaction dynamics between the vertices. As shown in Figure 1 (a), the resulting supra-adjacency matrix (using the terminology from [11]) overlaps the adjacency matrices of the original graphs.
Linking approach. This approach combines two graph layers by giving each layer a unique set of vertices. The alignment between vertices in each layer is represented by a link between the layers. The resulting supra-adjacency matrix shown in Figure 1(b) contains the original adjacency matrices on the block diagonal. The off-diagonal blocks are diagonal matrices. Note that in the figure, we show the case of complete connectivity between the layers. In the general case, the diagonals would be sparse and positive only for seed vertices.
Relaxed random walk approach. In the relaxed walk approach, a random walker switches between walking on one layer at some probability to switching between layers at probability . As shown in the supra-adjacency matrix in Figure 1(c), interlayer walks are performed to neighbors of aligned vertices and intralayer walks are determined by the adjacency matrix within that layer. Note that in the figure, we have focused on the completely connected case. In general, only the seed rows would be non-zero in the off-diagonal blocks.
3.2 Performance Measures
We evaluate community detection using methods that capture both performance and community-level entity resolution accuracy. Define the assignment of the community that vertex belongs to as ; let . For community detection performance evaluation, we start with a reference community assignment and a community assignment to test . The contingency matrix, , has entries . Qualitatively, we measure performance by visualizing the matrix of Jaccard similarity indices,
| (1) |
Additionally, we use variation of information (VI) [15] as a quantitative distance measure of community assignment performance,
| (2) |
where is the conditional entropy of given . This value can be calculated by defining , , and , where is the total number of vertices. Then,
| (3) |
A desirable property of is that it is a distance metric and has an interpretable meaning in terms of information theory.
In addition to community assignment performance, we use a recall-based measure which we call oracle accuracy. For a set of truth pairs, , where each truth pair is given by ( and correspond to the same user), we define the oracle accuracy as
| (4) |
4 Experiments
4.1 Experimental Setup
We used geotagged Twitter and Instagram data from the Boston region for our experiments. For Twitter, a total number of 4,654,373 tweets were collected from 1/1/14 to 10/1/14. For Instagram, a total number of 3,709,479 posts and comments were collected from 12/31/2013 to 7/1/2015.
Network construction was performed by designating both users (e.g., @twitter) and hashtags (e.g., #fashion) as vertices in the network. For Twitter, edge types corresponded to multiple categories—user-to-user tweets, user mentions of users or hashtags, retweets, and co-occurrence of hashtags or users. For Instagram, edge types corresponded to—user comments on user posts, user mentions of users, user mentions of hashtags, and co-occurrence of users or hashtags. For both Twitter and Instagram, the count of occurrence of various edges types was saved in the network. For final analysis, counts were summed across edge types resulting in a weighted undirected graph. More details may be found in [2].
4.2 Twitter-Twitter Networks
To show the effect of varying the fraction of shared vertices across networks on community detection, we take the Twitter graph from which two random subgraphs and are chosen such that the fraction of the shared vertices is given by , where means that of the vertices belong to both and .
Denote as the community assignment of the original Twitter graph . For the first experiment, we assume that the alignment of all shared vertices is known. Then, we apply the methods described in Section 3.1 for community detection across and , and let denote the resulting community assignment. Table 1 displays the results of the three methods under the evaluation of the variation of information . It can be seen that the variation of information decreases (i.e., less change in the community structure) as the fraction of shared vertices across networks increases. Among these three methods, the aggregation approach has the lowest variation of information.
| % Shared Vertices | Aggregation | Linking | Relaxed RW |
|---|---|---|---|
| 10 | 1.8301 | 1.9777 | 2.1793 |
| 50 | 0.6590 | 1.4523 | 1.3963 |
| 90 | 0.3406 | 1.3730 | 1.0793 |
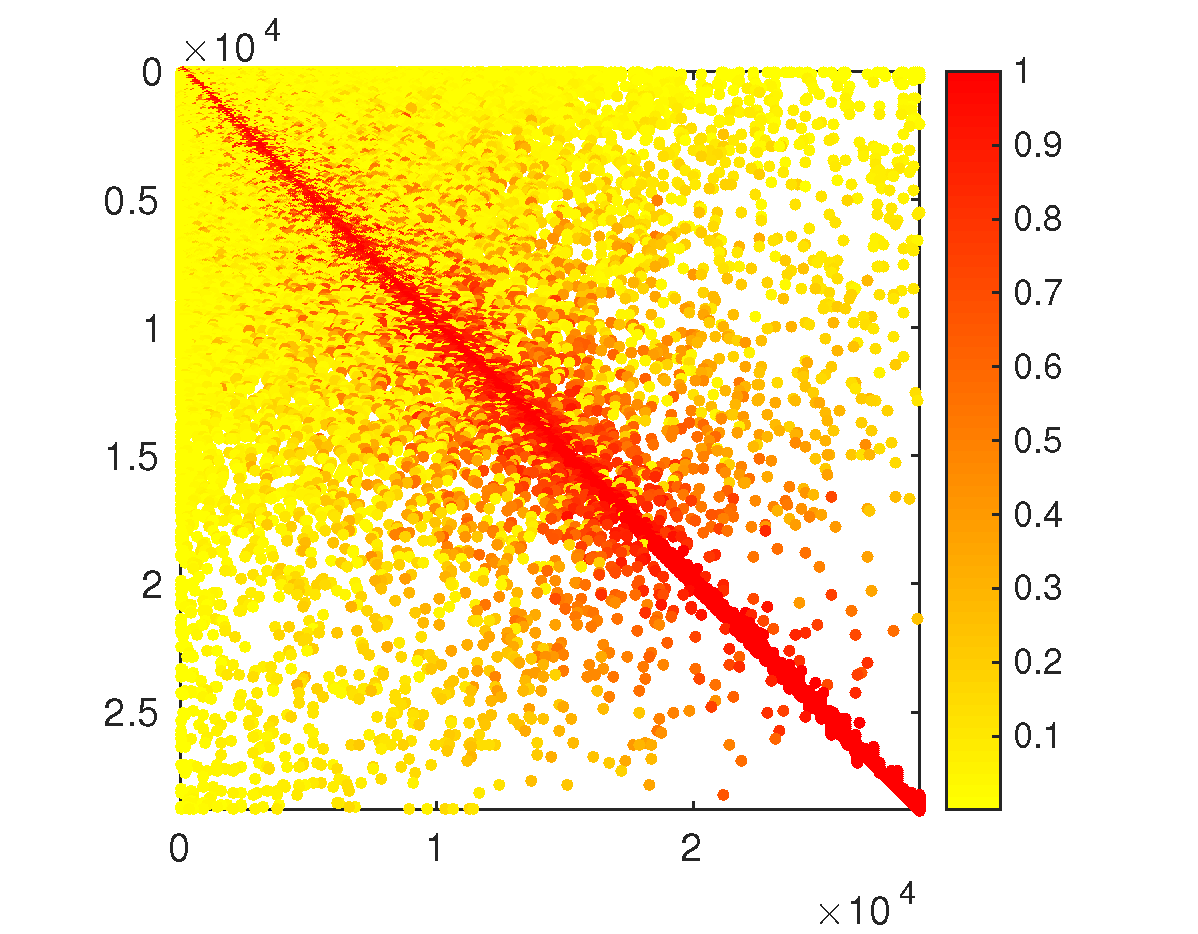
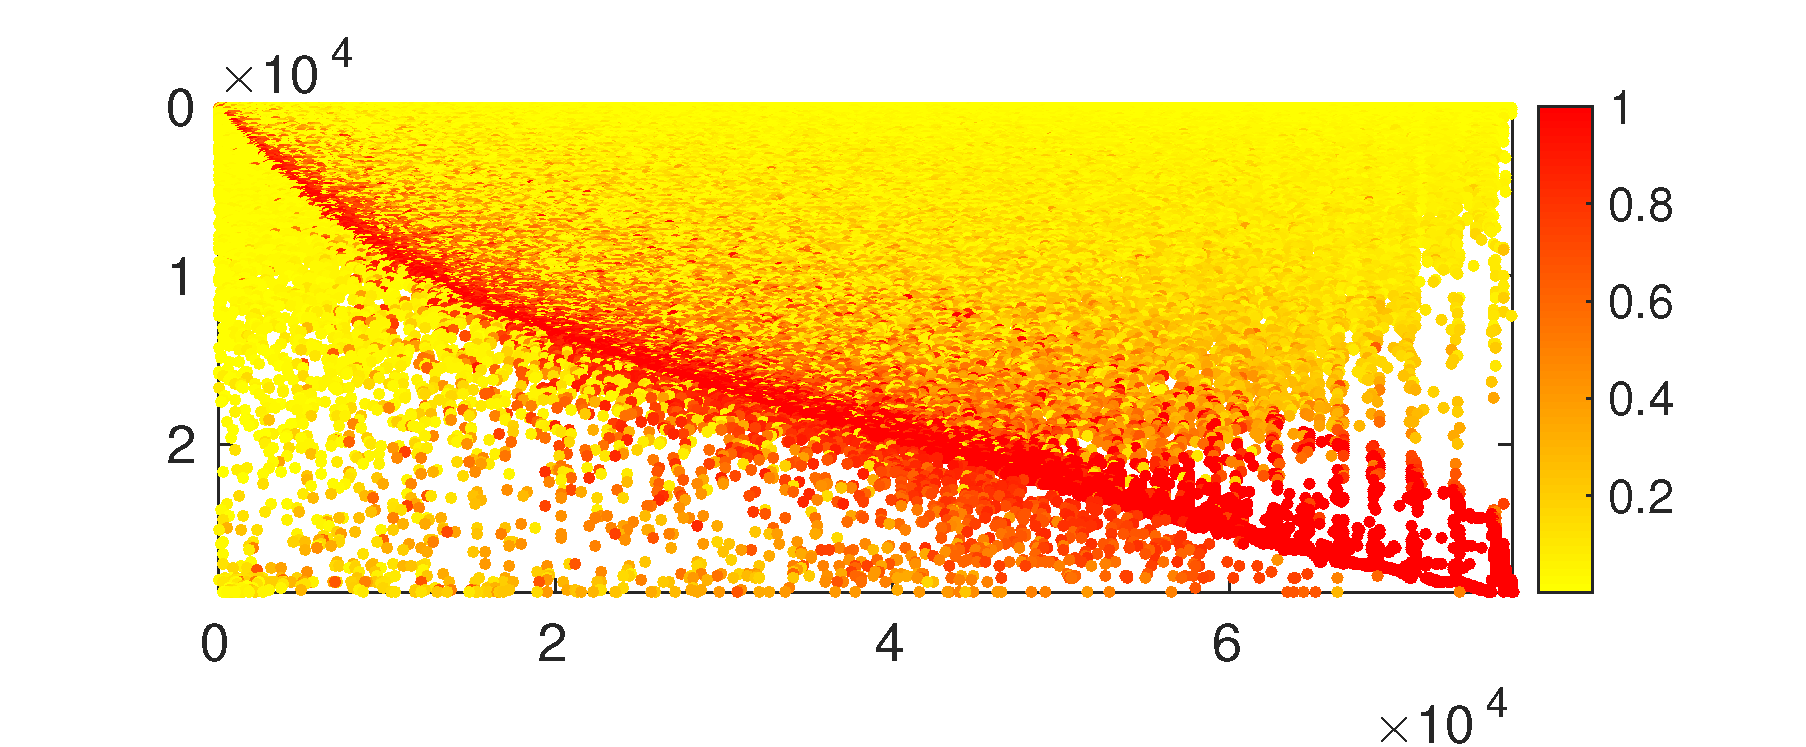
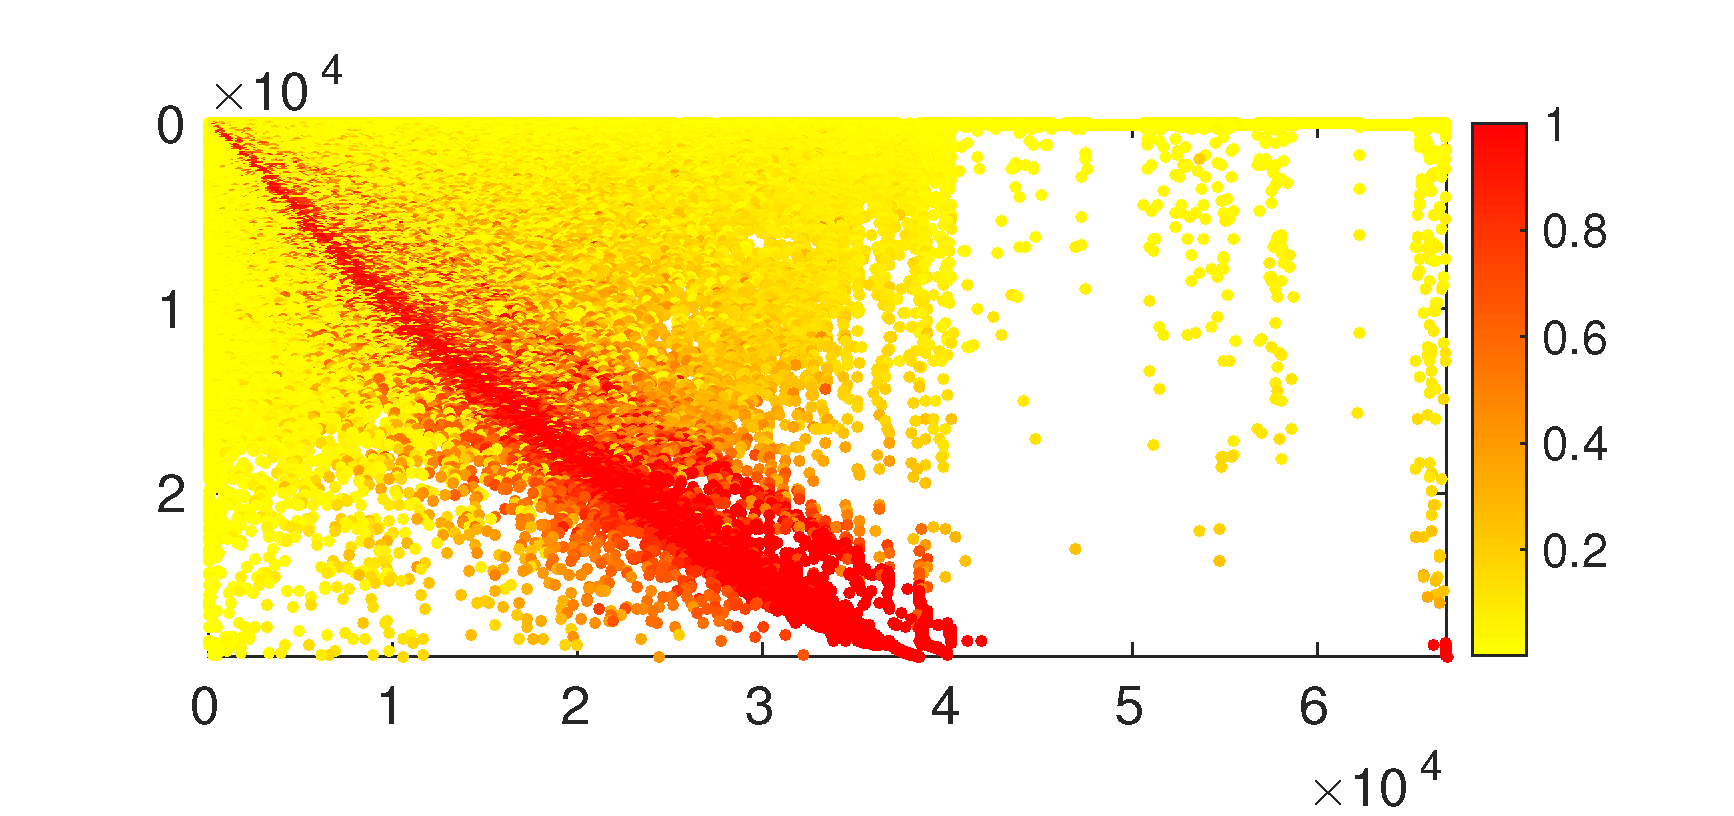
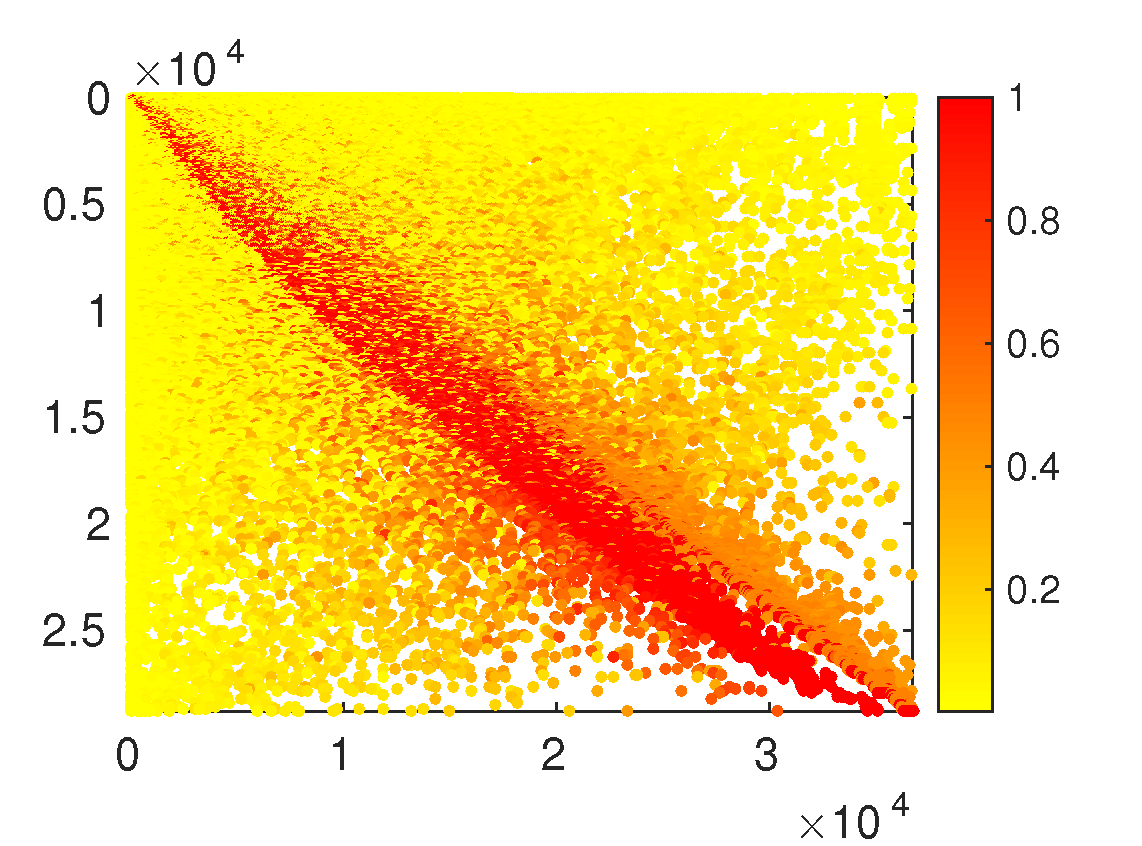
Fig. 2 shows the Jaccard similarity matrix between (-axis) and (-axis) of the same experiment on networks with shared vertices. Communities are ordered by the community PageRank, i.e., index denotes the community with the highest PageRank value. Observe Fig. 2(a) that the Jaccard matrix of the aggregation approach has large values close to the main diagonal, indicating that and share similar community structure. It is to be noted that if the Jaccard matrix is the identity matrix, then it means that the corresponding communities in the reference and the detected are exactly the same. Fig. 2(b) and 2(c) show that the resulting community assignment using the linking approach and the relaxed random walk approach respectively, have more than double the number of communities than that of the reference . In particular, from Fig. 2(c), observe that the first few communities (i.e., communities with the highest PageRank values) in the reference break up into smaller communities in , many of which have low community PageRank values. This also explains why the variation of information values for these two method are large compared to the aggregation approach. In all remaining experiments, the aggregation approach is used for community detection.
In the second experiment, we investigate the effect of using seeds on networks with a different fraction of shared vertices. Let be the detected community assignment across and given only seeds . Let be the reference community assignment across and using all shared users . The plots in Fig. 3 illustrate the results using the variation of information metric as a function of the percentage of seeds, i.e., . Note that hashtags are not considered as seeds, and they are always aligned across networks based on exact string match. Three seed selection strategies are used: random, degree and PageRank. The random strategy randomly selects a fixed number of mappings from and used them as seeds . The degree approach first computes the vertex degrees of the original Twitter graph and then selects the seeds from that have high degree centrality. Similarly, the PageRank approach selects seeds that have high PageRank values. From Fig. 3, it can be observed that both the degree centrality strategy and PageRank centrality strategy give substantially better performance than random seed selection.


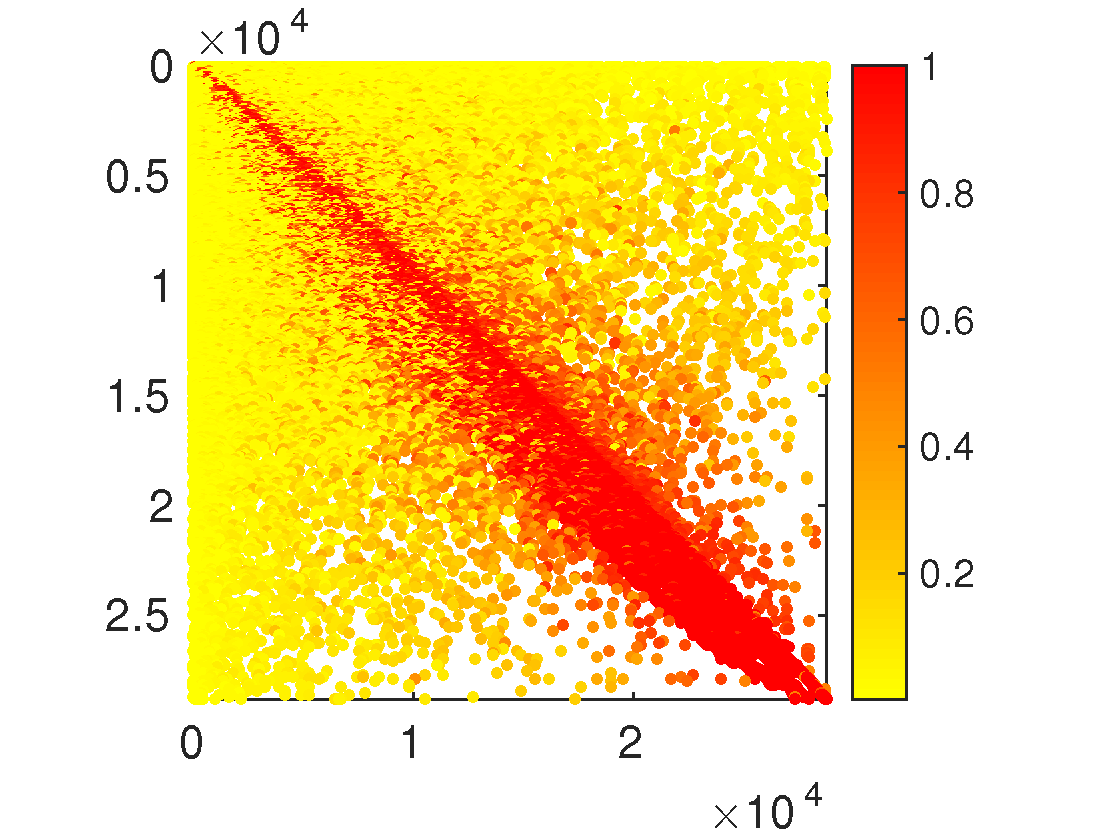
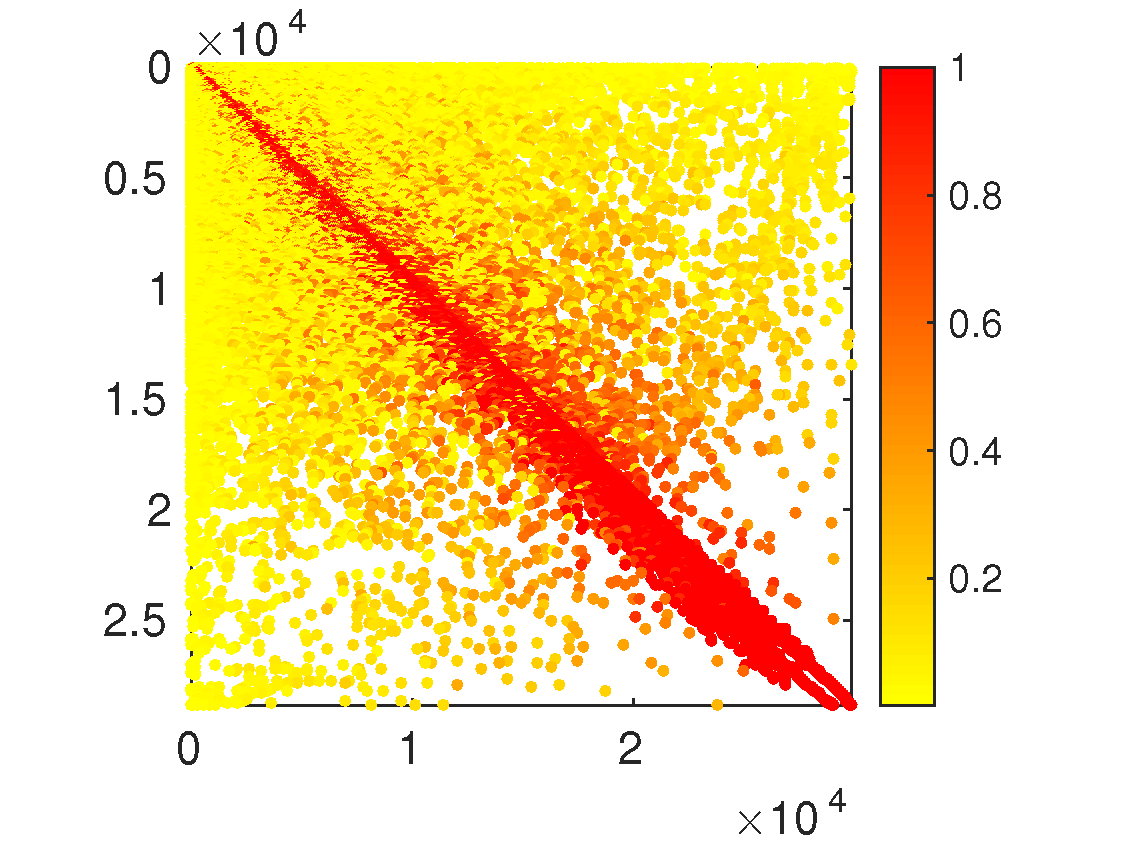
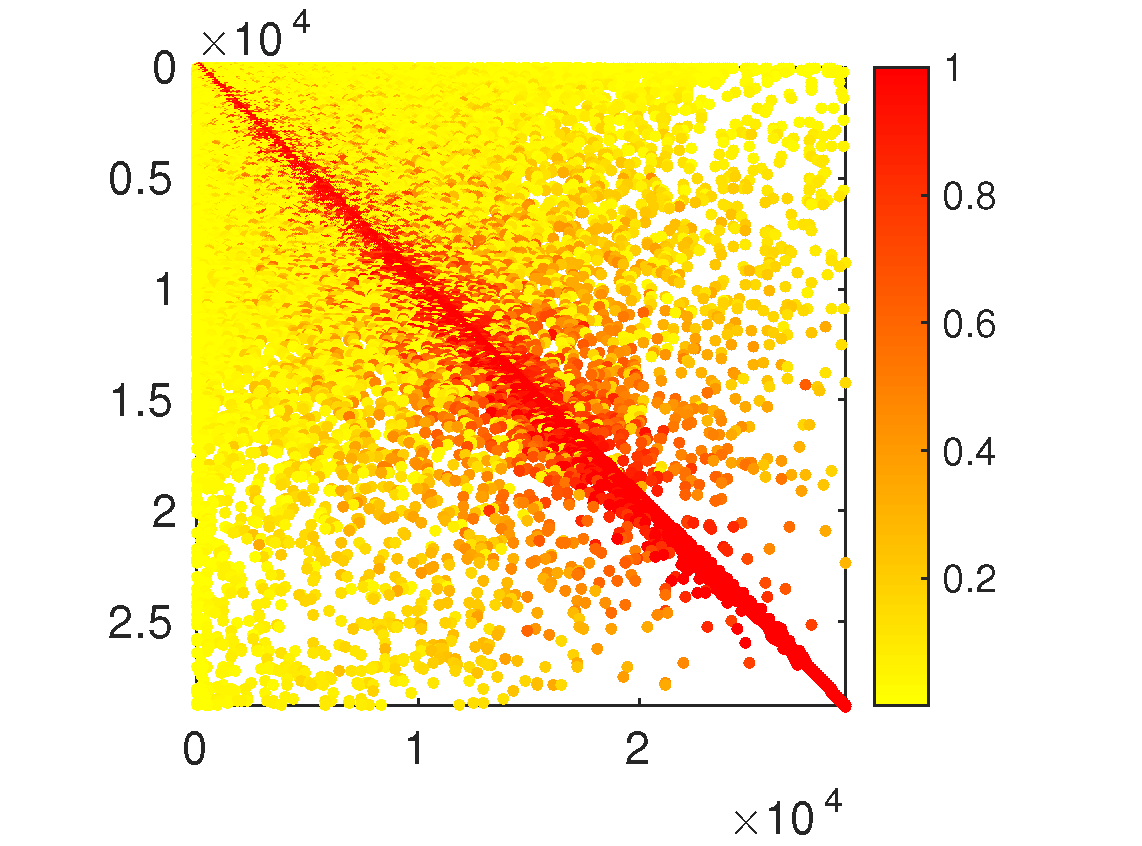
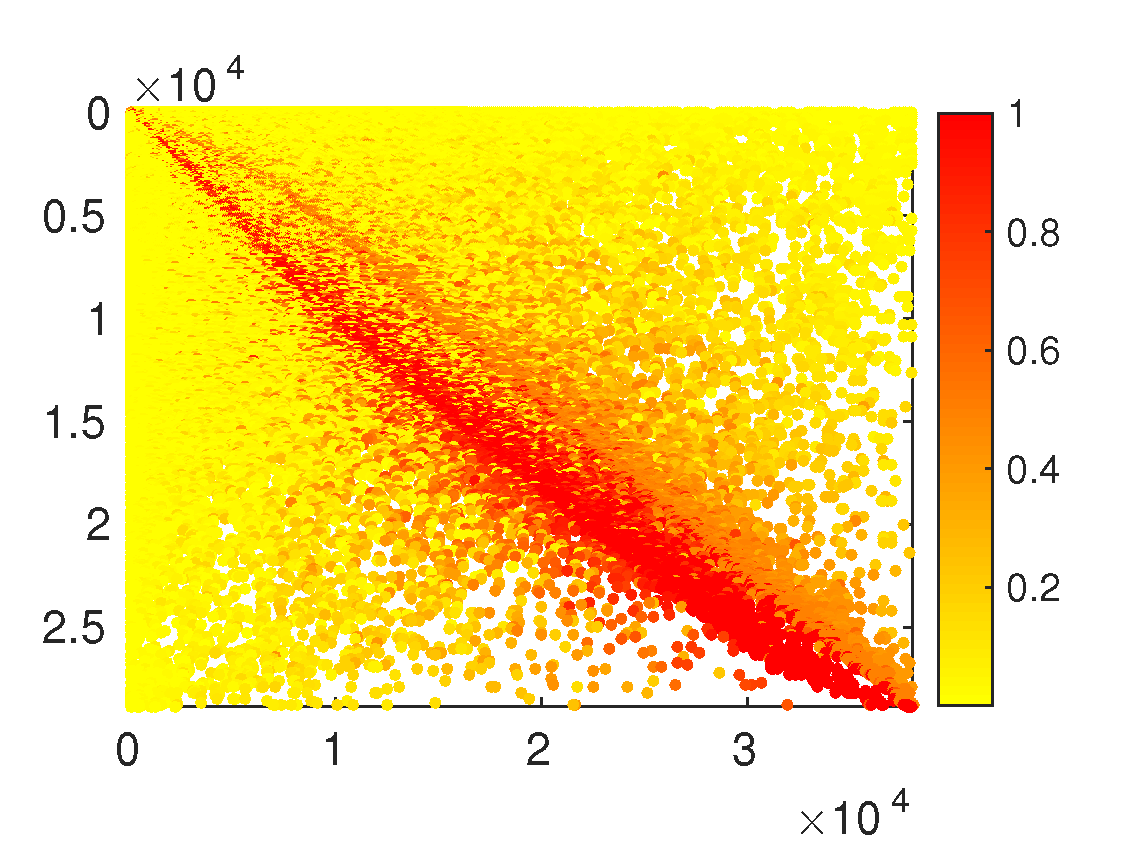
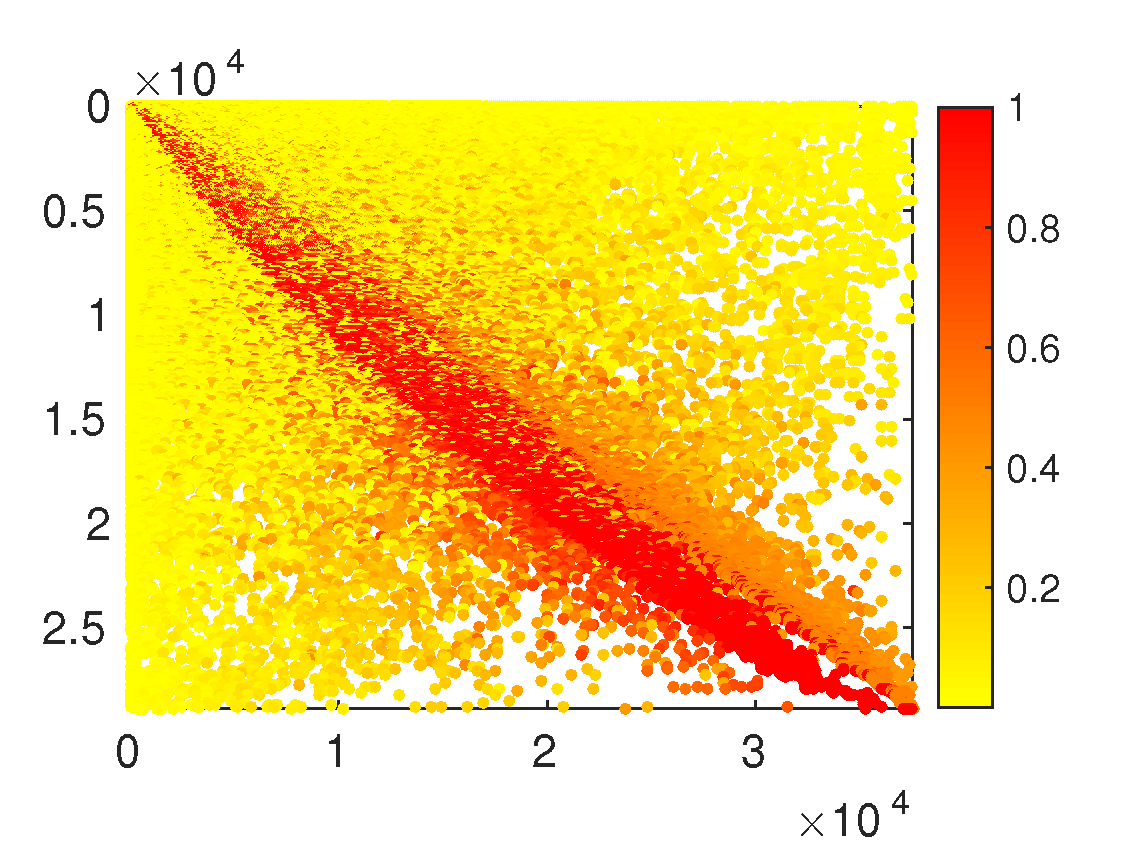
Fig. 4 and 5 display the Jaccard matrices of different seed selection strategies. Fig. 4 shows the results using seeds. Observe that the detected community structure using the PageRank strategy is the most similar to the reference community structure. Fig. 5 displays the results with seeds. It can be observed from Fig. 5(a) that bifurcation occurs, breaking up one community in the reference into roughly two communities in the detected . This is likely due to the lack of useful connections between the two networks. With careful seed selection (i.e., degree or PageRank), the bifurcation disappears as shown in Fig. 5(b) and 5(c). Although in this case, it is hard to see which strategy gives better performance, the Jaccard matrices are still useful in discovering the relationship between the reference and the detected and allow us to discover local changes in the community structure.
The plots in Fig. 6 show the results of the oracle accuracy as a function of the percentage of seeds using the three seed selection strategies. Unlike the previous two measures which compare the detected community assignment with the reference community assignment , the oracle accuracy measures the percentage of shared users across networks that are in the same community; we exclude the seed pairs in the computation. As shown in the plots in Fig. 6, both the PageRank and the degree strategies perform significantly better than random seed selection. Moreover, from 6(b) and 6(c), we observe that for networks with large fraction of shared users, one only needs a small percentage of seeds to achieve a good oracle accuracy. On the other hand, it can be seen from Fig. 6(c) that for networks with a small fraction of shared vertices, one needs a large percentage of seeds to achieve the same level of oracle accuracy.


4.3 Twitter-Instagram Networks
We now turn to another experiment that explores the possibility of detecting communities across Twitter and Instagram networks. In this case, we do not have the complete information of the user alignment . However, there are several ways that one can extract some alignment from the data, i.e., username matching, profile information and Instagram repost on Twitter. Out of 522,247 Twitter users and 1,045,617 Instagram users, we have extracted 42,703 pairs of usernames across the networks that are likely to correspond to the same person. We split up these pairs of usernames into two sets: training and evaluation. The training set is used as seeds for community detection, while the evaluation set is used to compute the oracle accuracy of the detected community structure. The aggregation approach is used for combining the Twitter-Instagram networks. The adjacency matrices of the individual graphs are normalized on the left by the weighted vertex degree.
Table 2 displays the oracle accuracy results of different seed selection strategies with varying number of seeds used in the detection. Given that we do not know how many users are shared in both networks, the percentage of seeds shown in the table are computed with respect to the total number of Twitter users. For the degree and PageRank strategies, we first compute the respective centrality values in Twitter and Instagram networks separately, and then take the average for each pair of seeds. The result in Table 2 shows that in general, the PageRank strategy for seed selection gives the best oracle accuracy, suggesting that for applications where aligning users across network is costly and there is limited resource to cover the cost, it is better to map users who have high PageRank centrality as compared with the other two strategies.
| Seed Selection | ||||||
|---|---|---|---|---|---|---|
| Random | 7.72 | 10.62 | 13.37 | 15.62 | 17.66 | 23.47 |
| Degree | 10.93 | 13.62 | 14.81 | 16.51 | 20.10 | 19.67 |
| PageRank | 11.55 | 14.33 | 15.74 | 17.31 | 22.06 | 44.26 |
It is important to note that the seed strategies displayed in Table 2 are performed on the known set of aligned users, instead of on the entire set of shared users. Hence, the actual oracle accuracy results using the true seed selection strategies should be higher than the displayed values. Nonetheless, they should follow a similar trend as shown in the table. In addition, for the purpose of this paper, seeds are extracted using very basic strategies, such as exact username matching and information provided in user profiles and URL links. Hence, there are errors in the seed set which may have negatively affected the results. For the future work, we will explore more sophisticated methods for obtaining the seed set. It is believed that a high quality seed set will significantly improve the results.
5 Conclusion
In this paper, we explored several methods for community detection across online social networks with no prior knowledge of the alignment of users and of the fraction of shared users across networks. Specifically, we examined three multilayer community detection methods — aggregation, linking and relaxed random walk. We showed that for our problem setup, the aggregation approach finds a community assignment that is the most faithful to the underlying community structure. In addition, we examined the effect of seeds (which are the extracted mappings of users across networks) on the performance of community detection. We proposed three measures to assess the performance: variation of information, Jaccard similarity matrix and oracle accuracy. We showed that for networks with a large fraction of shared users, a small percentage of seeds is needed to obtain a community structure that is close to the reference community assignment and has good oracle accuracy. However, when the networks have a small fraction of shared users, it is difficult to find a good community assignment. We also explored three seed selection strategies: random, degree and PageRank. Both the degree and PageRank strategies significantly outperformed random seed selection, and the PageRank strategy had the best performance.
For future work, we note that both the quantity and the quality of seeds are extremely important in obtaining a good community structure across networks. Although we examined several seed selection strategies, it is also important to explore methods for (high accuracy) seed set expansion, particularly by combining the state-of-the-art entity resolution techniques with network structures.
References
- [1] Vincent D Blondel, Jean-Loup Guillaume, Renaud Lambiotte, and Etienne Lefebvre. Fast unfolding of communities in large networks. Journal of Statistical Mechanics: Theory and Experiment, 2008(10):P10008, 2008.
- [2] William Campbell, Elisabeth Baseman, and Kara Greenfield. Content+context=classification: Examining the roles of social interactions and linguist content in twitter user classification. In Proceedings of the Second Workshop on Natural Language Processing for Social Media (SocialNLP), pages 59–65, Dublin, Ireland, August 2014. Association for Computational Linguistics and Dublin City University.
- [3] Aaron Clauset, Mark EJ Newman, and Cristopher Moore. Finding community structure in very large networks. Physical review E, 70(6):066111, 2004.
- [4] Manlio De Domenico, Andrea Lancichinetti, Alex Arenas, and Martin Rosvall. Identifying modular flows on multilayer networks reveals highly overlapping organization in interconnected systems. Physical Review X, 5(1):011027, 2015.
- [5] Manlio De Domenico, Albert Solé-Ribalta, Emanuele Cozzo, Mikko Kivelä, Yamir Moreno, Mason A Porter, Sergio Gómez, and Alex Arenas. Mathematical formulation of multilayer networks. Physical Review X, 3(4):041022, 2013.
- [6] Luca Donetti and Miguel A Munoz. Detecting network communities: a new systematic and efficient algorithm. Journal of Statistical Mechanics: Theory and Experiment, 2004(10):P10012, 2004.
- [7] P Erdös and A Rényi. On random graphs I. Publ. Math. Debrecen, 6:290–297, 1959.
- [8] Michelle Girvan and Mark EJ Newman. Community structure in social and biological networks. Proceedings of the national academy of sciences, 99(12):7821–7826, 2002.
- [9] Roger Guimera, Marta Sales-Pardo, and Luís A Nunes Amaral. Modularity from fluctuations in random graphs and complex networks. Physical Review E, 70(2):025101, 2004.
- [10] Lucas GS Jeub, Michael W Mahoney, Peter J Mucha, and Mason A Porter. A local perspective on community structure in multilayer networks. arXiv preprint arXiv:1510.05185, 2015.
- [11] Mikko Kivelä, Alex Arenas, Marc Barthelemy, James P Gleeson, Yamir Moreno, and Mason A Porter. Multilayer networks. Journal of Complex Networks, 2(3):203–271, 2014.
- [12] Andrea Lancichinetti and Santo Fortunato. Community detection algorithms: a comparative analysis. Physical review E, 80(5):056117, 2009.
- [13] Andrea Lancichinetti, Santo Fortunato, and Filippo Radicchi. Benchmark graphs for testing community detection algorithms. Physical review E, 78(4):046110, 2008.
- [14] Vince Lyzinski, Daniel L Sussman, Donniell E Fishkind, Henry Pao, Li Chen, Joshua T Vogelstein, Youngser Park, and Carey E Priebe. Spectral clustering for divide-and-conquer graph matching. Parallel Computing, 2015.
- [15] Marina Meilă. Comparing clusterings by the variation of information. In Learning theory and kernel machines, pages 173–187. Springer, 2003.
- [16] Peter J Mucha, Thomas Richardson, Kevin Macon, Mason A Porter, and Jukka-Pekka Onnela. Community structure in time-dependent, multiscale, and multiplex networks. science, 328(5980):876–878, 2010.
- [17] Mark EJ Newman and Michelle Girvan. Finding and evaluating community structure in networks. Physical review E, 69(2):026113, 2004.
- [18] Gergely Palla, Imre Derényi, Illés Farkas, and Tamás Vicsek. Uncovering the overlapping community structure of complex networks in nature and society. Nature, 435(7043):814–818, 2005.
- [19] Filippo Radicchi, Claudio Castellano, Federico Cecconi, Vittorio Loreto, and Domenico Parisi. Defining and identifying communities in networks. Proceedings of the National Academy of Sciences of the United States of America, 101(9):2658–2663, 2004.
- [20] Jörg Reichardt and Stefan Bornholdt. Statistical mechanics of community detection. Physical Review E, 74(1):016110, 2006.
- [21] Peter Ronhovde and Zohar Nussinov. Multiresolution community detection for megascale networks by information-based replica correlations. Physical Review E, 80(1):016109, 2009.
- [22] M Rosvall and CT Bergstrom. Maps of information flow reveal community structure in complex networks. Technical report, Citeseer, 2007.
- [23] Martin Rosvall, Daniel Axelsson, and Carl T Bergstrom. The map equation. The European Physical Journal Special Topics, 178(1):13–23, 2010.
- [24] Martin Rosvall and Carl T Bergstrom. Maps of random walks on complex networks reveal community structure. Proceedings of the National Academy of Sciences, 105(4):1118–1123, 2008.
- [25] Ken Wakita and Toshiyuki Tsurumi. Finding community structure in mega-scale social networks. In Proceedings of the 16th international conference on World Wide Web, pages 1275–1276. ACM, 2007.