Holographic heavy ion collisions with baryon charge
Abstract
We numerically simulate collisions of charged shockwaves in Einstein-Maxwell theory in anti-de Sitter space as a toy model of heavy ion collisions with non-zero baryon charge. The stress tensor and the baryon current become well described by charged hydrodynamics at roughly the same time. The effect of the charge density on generic observables is typically no larger than 15%. We find significant stopping of the baryon charge and compare our results with those in heavy ion collision experiments.
Keywords:
Gauge-gravity correspondence, Holography and quark-gluon plasmasICCUB-16-027
1 Introduction
Holography has provided useful toy models with which to study the quark-gluon plasma (QGP) created in heavy ion collision experiments. In these models one considers a caricature of the incoming ions consisting of two gravitational shock waves moving at the speed of light towards each other in anti-de Sitter space (AdS) Chesler:2010bi ; Casalderrey-Solana:2013aba ; Casalderrey-Solana:2013sxa ; Chesler:2015wra . The collision results in the formation and subsequent hydrodynamization of a strongly coupled QGP which can be studied from first principles (see e.g. CasalderreySolana:2011us ; Chesler:2015lsa for recent reviews).
The dynamics of the gravitational field in AdS encodes only the dynamics of the stress tensor in dual gauge theory. In other words, the collisions considered in the references above result in the formation of a neutral plasma. However, the plasma created in heavy ion collisions certainly carries some non-zero baryon charge which increases in importance as the energy of the collision decreases. The goal of this paper is therefore to provide the first simulation of charged shock wave collisions in AdS in order to model the formation and hydrodynamization of a QGP with a non-zero baryon charge. The conserved baryon current is dual on the gravity side to a Maxwell field, so we consider collisions in Einstein-Maxwell theory.111Homogeneous relaxation in this theory has been considered in Fuini:2015hba .
2 The model
We start with the Einstein-Maxwell action with a negative cosmological constant
| (1) |
where is Newton’s constant, is the Ricci scalar, is the asymptotic AdS radius, is a parameter controlling the backreaction of the Maxwell field on the metric, and is the electromagnetic field strength with the vector potential. The metric and the gauge field are respectively dual on the gauge theory side to the stress tensor and to a conserved current whose time component one is free to think of as the baryon number density. In the case in which the action (1) is viewed as a consistent truncation of the dimensional reduction of type IIB supergravity on the dual gauge theory is Super Yang-Mills and the current arises from the R-symmetry of this theory.222The full five-dimensional action for this truncation would include a Chern-Simons term (see e.g. Gauntlett:2003fk ), but this will play no role in our analysis and we have therefore omitted it. When we need to be concrete (for example to fix normalization factors) we will adopt this viewpoint. However, we emphasize that for most purposes the specific origin of the Maxwell field is unimportant and one could think of (1) simply as a bottom-up model that incorporates the minimal set of ingredients to describe the dynamics of the stress tensor and a conserved current in the dual gauge theory.
The equations of motion following from (1) are
| (2) | |||||
| (3) |
where
| (4) |
is the stress tensor sourced by the electromagnetic field. These equations admit the following solution describing a charged shock wave moving at the speed of light:
| (5) | |||||
| (6) |
where and and are arbitrary functions of . In the case in which the dual theory is SYM these functions are related to the expectation values of the corresponding dual operators through deHaro:2000vlm
| (7) | |||||
| (8) |
The fact that scales as reflects its R-symmetry origin, namely that microscopically it is built out of adjoint degrees of freedom. An analogous solution describing a wave moving in the opposite direction is obtained by replacing in the expressions above.
We will adopt the following choices for the functions and describing our incoming projectiles:
| (9) |
The energy and charge densities per unit area of the shock are and , respectively. Note that we choose the centers and the widths of the Gaussian profiles for and to be the same, as corresponds to the fact that we want to model the collision of projectiles that carry both energy and charge.
We see from Eq. (2) that the parameter controls the magnitude of the backreaction of the Maxwell field on the dynamics of the spacetime metric. It is clear from the action (1) that this parameter could be absorbed in the normalization of the Maxwell field, at the expense of including an explicit factor of multiplying the gauge field amplitude in Eq. (6). In other words, one can either think of the backreaction as being controlled by for a fixed incoming amplitude , or as it being controlled by the incoming amplitude for a fixed . We find it convenient to adopt the first viewpoint.
The limit on the gravity side corresponds to an approximation in which the Maxwell field is treated as a probe field that propagates in a fixed background without affecting it. In the gauge theory this means that the charge density is treated in a quenched approximation in which it has a negligible effect on the dynamics of the gluons. This limit is physically interesting since it describes the situation in which the energy density dominates over the charge density, and also as a benchmark against which the backreacted results can be compared. In Sec. 4 we will consider the collision in the probe approximation, and in Sec. 5 we will consider the backreacted case.
3 Thermodynamics and hydrodynamics
We begin by reviewing the thermodynamics of the plasma in the theory described by the action (1). This will be useful when we later consider the hydrodynamics of the plasma.
We will work with a rescaled stress tensor and current given by
| (10) |
and set
| (11) |
The relation between these quantities and the temperature and the chemical potential is given by the following expressions (see e.g. Erdmenger:2008rm ):
| (12) | |||||
| (13) |
where
| (14) |
Using these expressions one can show that, for a small charge density, the chemical potential is given by
| (15) |
We see that, for fixed energy density, and are linear in one another with a 1% (10%) accuracy if is no larger than 0.15 (0.48). In the opposite limit, when the chemical potential is high compared to the temperature, , we have that
| (16) |
and the ratio of charge to energy density approaches the value
| (17) |
The subindex ‘max’ indicates that this is the maximum value of for a fixed energy density. At this value the black brane becomes extremal and the temperature approaches zero compared to any other scale. Above this value a naked singularity appears. These features are illustrated in Fig. 1.

Charged hydrodynamics for SYM has been studied extensively Erdmenger:2008rm ; Banerjee:2008th . In the case of a 1+1 dimensional flow, as is of interest here, the constitutive relations take the form333Note the the velocity curl term denoted in Erdmenger:2008rm vanishes identically in 1+1 dimensions.
| (18) | |||||
| (19) |
where
| (20) | |||||
| (21) |
and the transport coefficients (rescaled by ) are
| (22) | |||||
| (23) |
4 The probe approximation
With the initial conditions (9) for the collision we can solve the Einstein-Maxwell equations, as outlined in Chesler:2013lia ; vanderSchee:2014qwa .444The Mathematica code to perform an evolution as described above is available upon request at wilke@mit.edu; alternatively, simpler versions can be found at sites.google.com/site/wilkevanderschee In this section we work in the strict probe approximation for the Maxwell field. We are therefore computing the evolution of a Maxwell field on top of the dynamical shock wave collisions studied earlier in Chesler:2010bi ; Casalderrey-Solana:2013aba ; Casalderrey-Solana:2013sxa ; Chesler:2013lia ; vanderSchee:2014qwa ; Chesler:2015fpa . Computationally it is however convenient to evolve both the metric and the Maxwell field at the same time, thereby recomputing the gravitational shock wave background.
We performed simulations for (-shocks in the language of Casalderrey-Solana:2013aba ) and (-shocks in the language of Casalderrey-Solana:2013aba ), which we will refer to as thin and thick shock collisions, respectively. The resulting charge density is plotted in Fig. 2 for both cases, whereby we included the energy density for comparison (also found in Casalderrey-Solana:2013aba ). Clearly in the thin regime the shocks gradually lose their charge into a charged plasma between the shocks, much like the energy density. For the thick shocks the energy density already hydrodynamizes during the collision regime Casalderrey-Solana:2013aba and, as we will see below, the same is true for the charge density. The shape of the charge and energy densities is different, a feature which we will later analyze in the local rest frame as well.
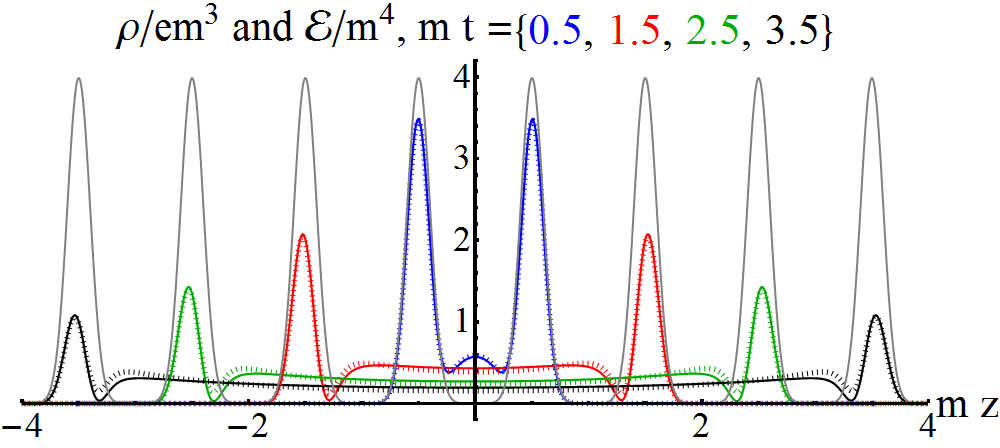
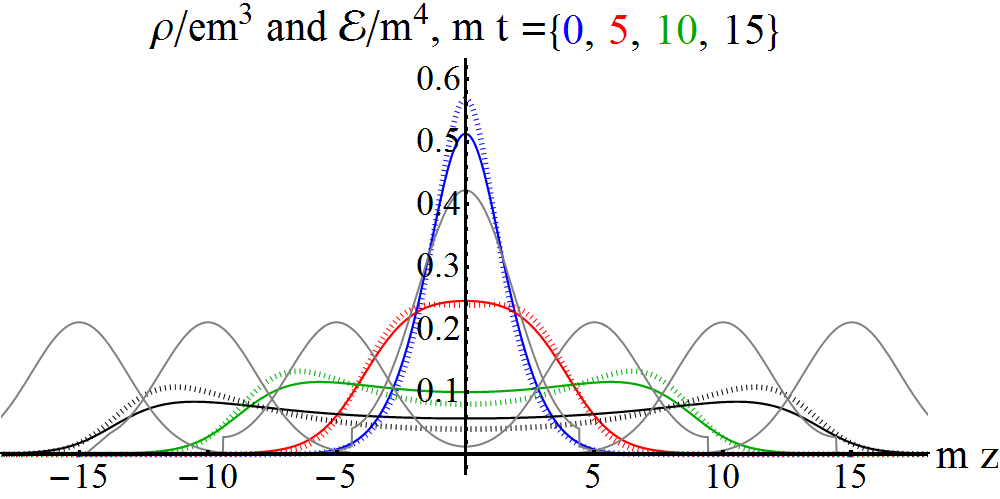
One interesting feature is the decay of the original shocks in the thin regime. Indeed, we see that on the attenuating maxima the charge density exactly follows the energy density, despite the fact that the charge and the energy are distributed differently in between the shocks. This agreement on the attenuating maxima is remarkable in view of the fact that the energy and the charge are governed by in principle completely different dynamics, i.e. the Einstein equations and the Maxwell equations on a fixed background, respectively. This suggests that on the light cone a simplified picture may be possible (perhaps along the lines of Albacete:2009ji ).
Having the complete stress-tensor we are able to extract the energy and charge density in the local rest frame, defined through
| (24) |
from which we find
| (25) |
where is the (timelike) fluid velocity. For the charge density we have
| (26) |
This allows us to study the approach to charged hydrodynamics. We read off from our simulations the fluid velocity and the energy and charge densities. We then use the constitutive relations (18)-(19) to obtain the hydrodynamic prediction for the transverse and longitudinal pressures, and , and for the time component of the current, . We define the hydrodynamization time for the stress tensor, , as the time beyond which
| (27) |
Similarly, we define the hydrodynamization for the current, , as the time beyond which
| (28) |
A crucial difference between the hydrodynamization of the stress tensor versus the charge current is that the pressures at can deviate from their hydrodynamic values due to the gradients of the velocity field. In contrast, parity symmetry implies that has no spatial component at and that vanishes identically. As a consequence, the (ideal) hydrodynamic prediction for the current is always exact at mid-rapidity. In order to asses the validity of the hydrodynamic description for we will therefore look at non-zero rapidity.
The hydrodynamization times for the stress tensor in the case of a neutral fluid were determined in Refs. Chesler:2010bi ; Casalderrey-Solana:2013aba ; Chesler:2015fpa . The result is555Note that we have used a slightly different criterion for hydrodynamisation than in Casalderrey-Solana:2013aba .
| (29) | |||
| (30) |
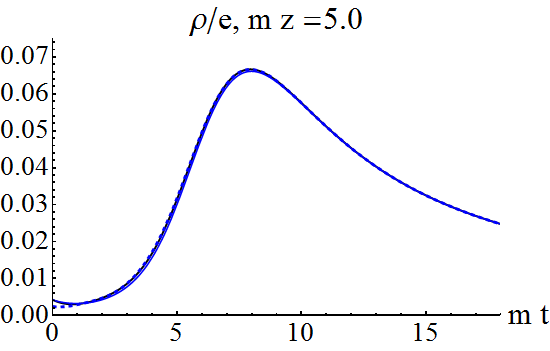
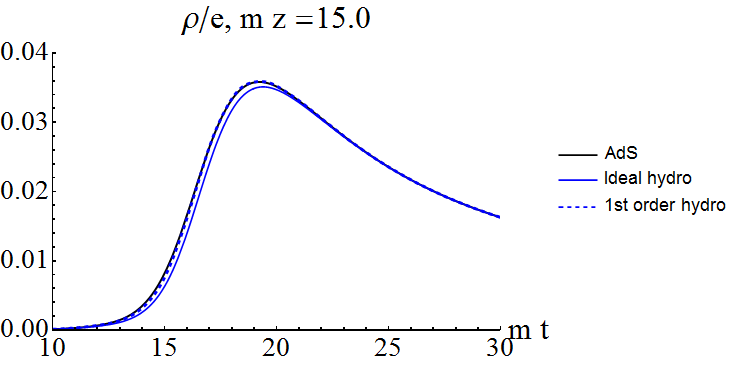
Since in this section we are working in the probe approximation, these times agree with our hydrodynamization times. With our new simulations we can now also study the hydrodynamization of the charge current, whose evolution and hydrodynamic approximations are shown in Fig. 3.
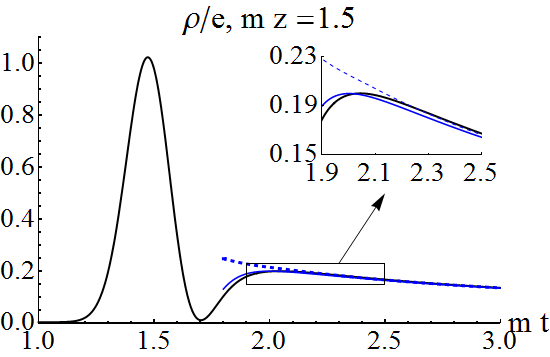
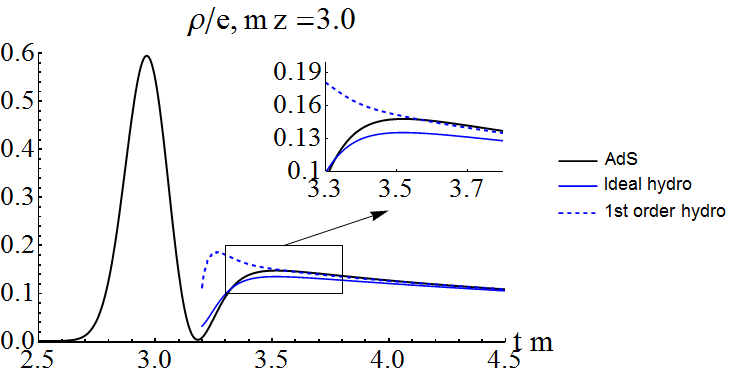
The hydrodynamization times are
| (31) | |||
| (32) |
In the case of thick shocks we have listed the value to indicate that the current is always well predicted by hydrodynamics. In contrast, for thin shocks we see that the hydrodynamization times for the current away from mid-rapidity are very similar to those for the stress tensor. In both cases, after there is a small but significant difference between ideal and viscous hydrodynamics, which shows that the fluid velocity of the charge differs from the velocity of the energy-momentum flow.
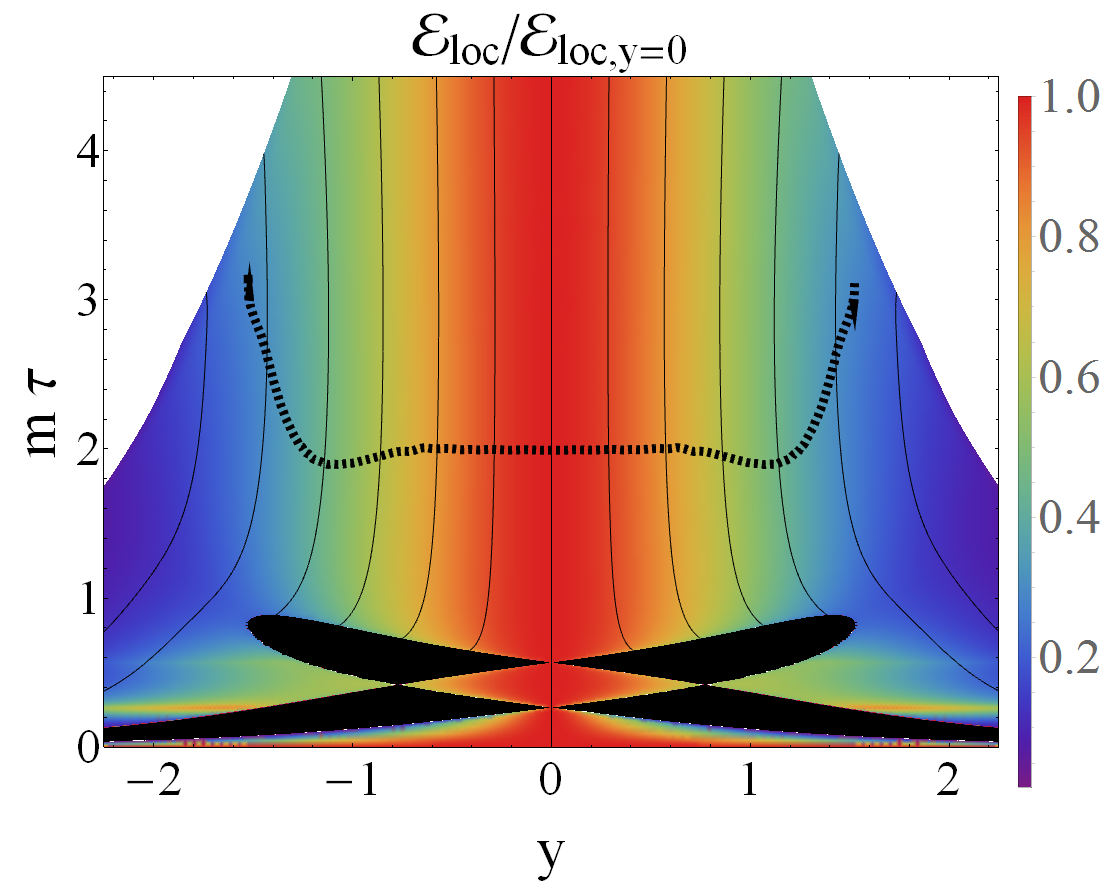
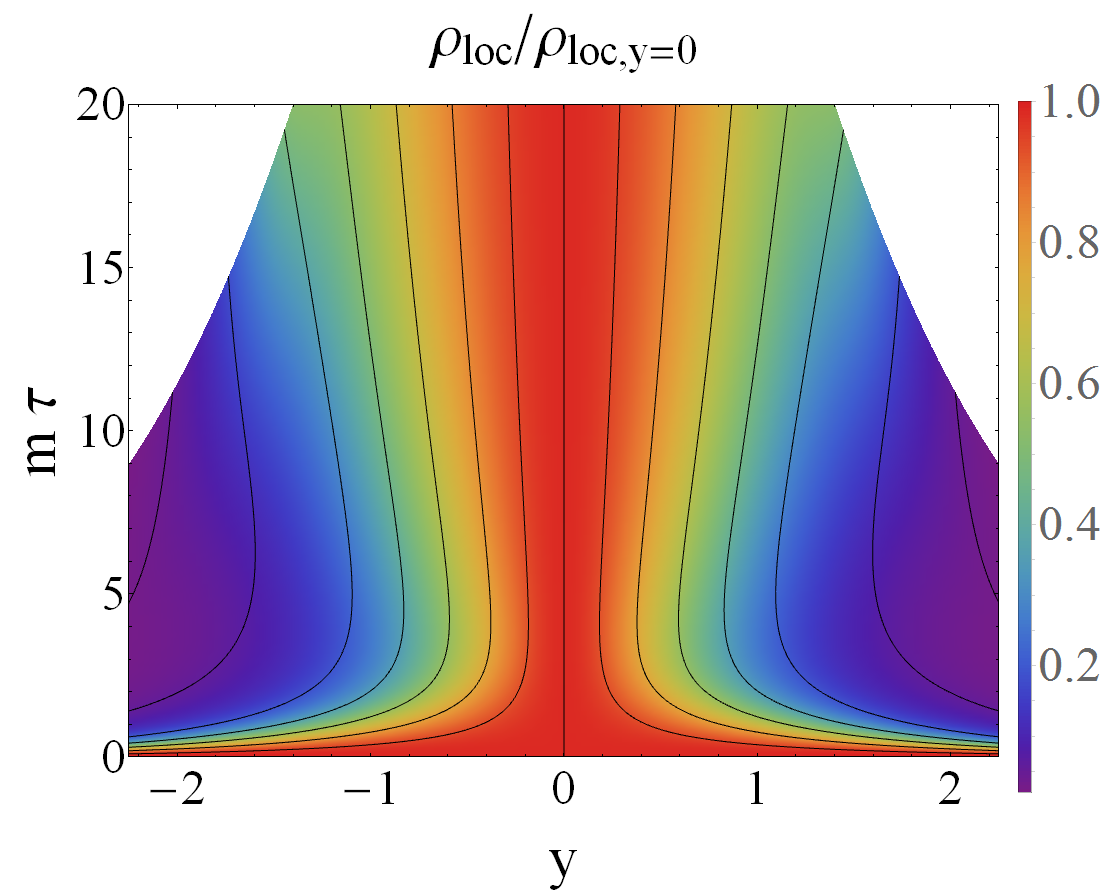
Fig. 4 shows the spacetime rapidity profile of the local charge density.
This is compared with the local energy density rapidity profile for several different proper times in Fig. 5.
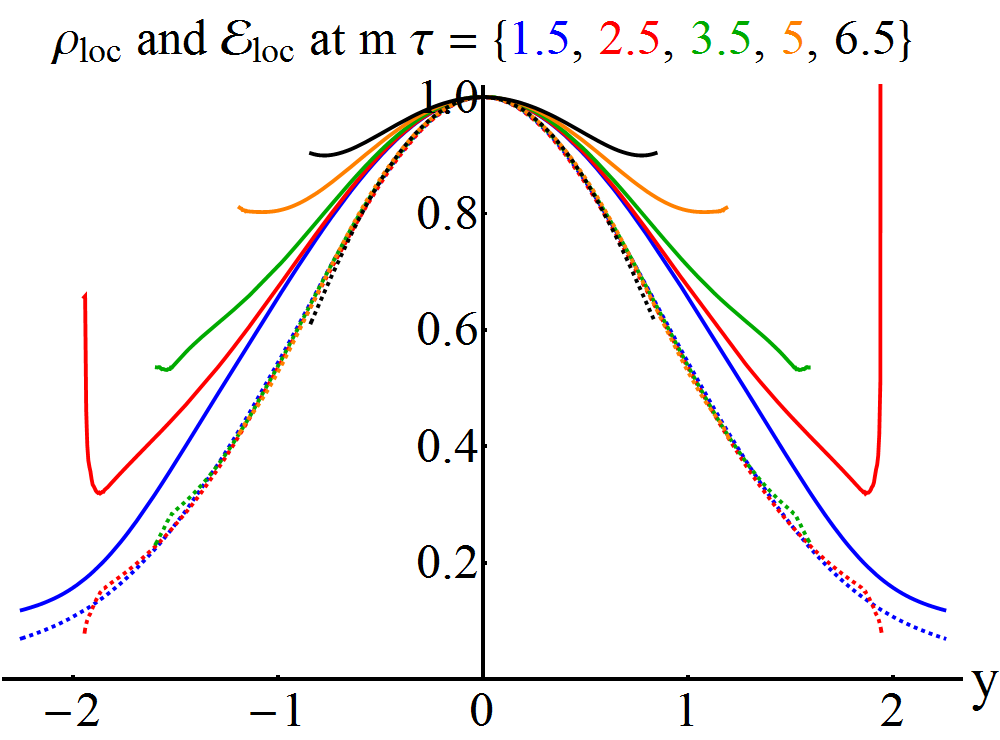
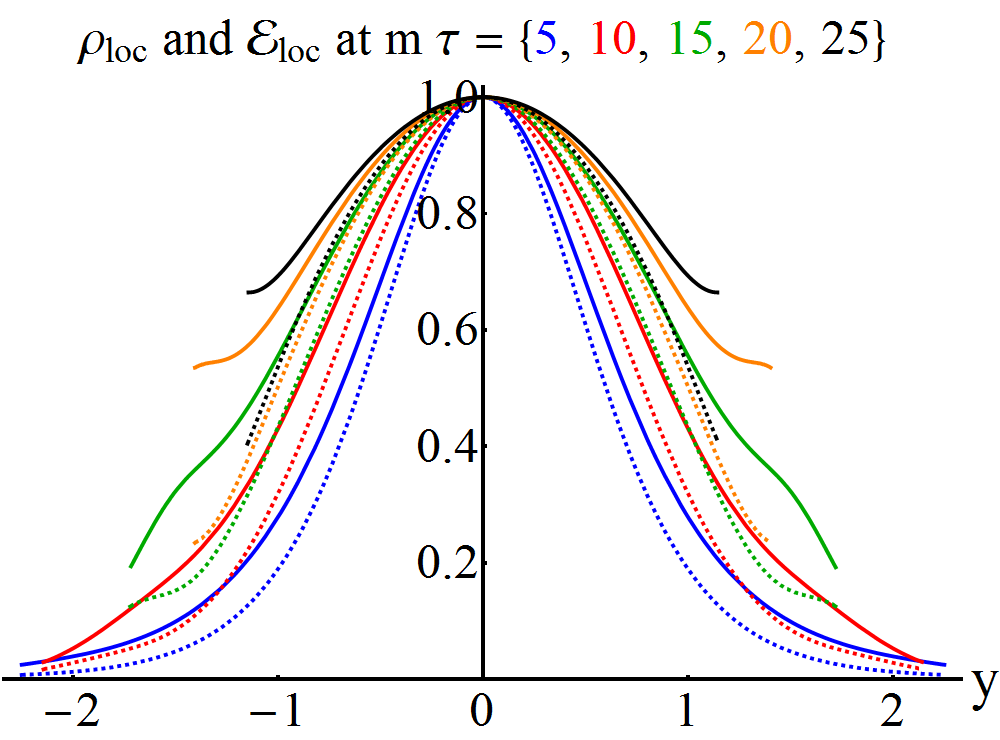
Especially striking in Fig. 5 is the development of maxima at non-zero rapidity for the charge profile; we will come back to this in the Discussion section. This happens fast in the case of thin shocks, whereas it takes longer for thick shocks. Furthermore, we see that for thin shocks the evolution of the charged rapidity profile is expanding much faster than the equivalent profile for the local energy density. For thick shocks both profiles expand at a similar rate.
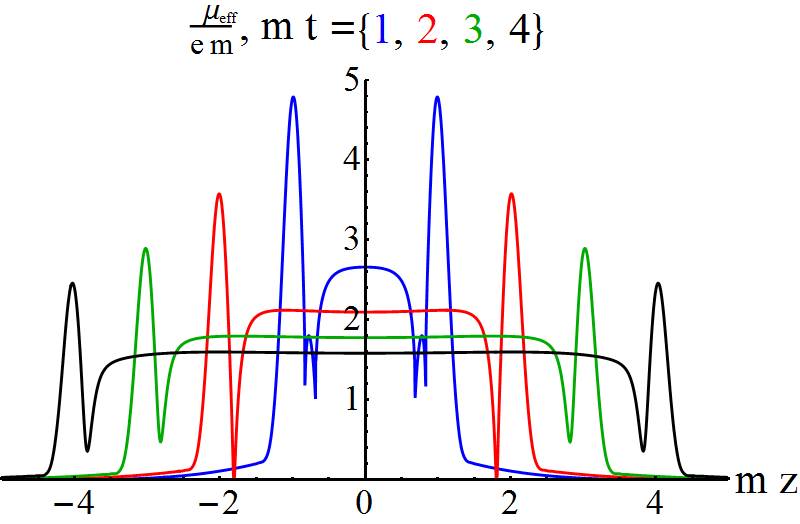
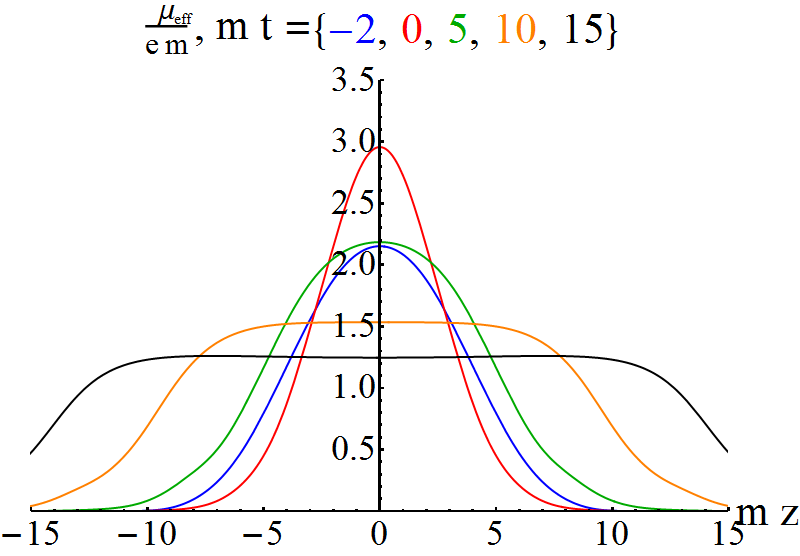
To characterize the charge deposition after the collision, we compare the charge density in the local rest frame, , to the local energy density, . More precisely, at all points in spacetime at which a local rest frame exists, we define the ratio
| (33) |
The significance of this ratio, which we plot in Fig. 6, is that, in equilibrium, coincides with the small-charge limit of chemical potential of the plasma, Eqn. (15). We will come back to Fig. 6 in the Discussion section.
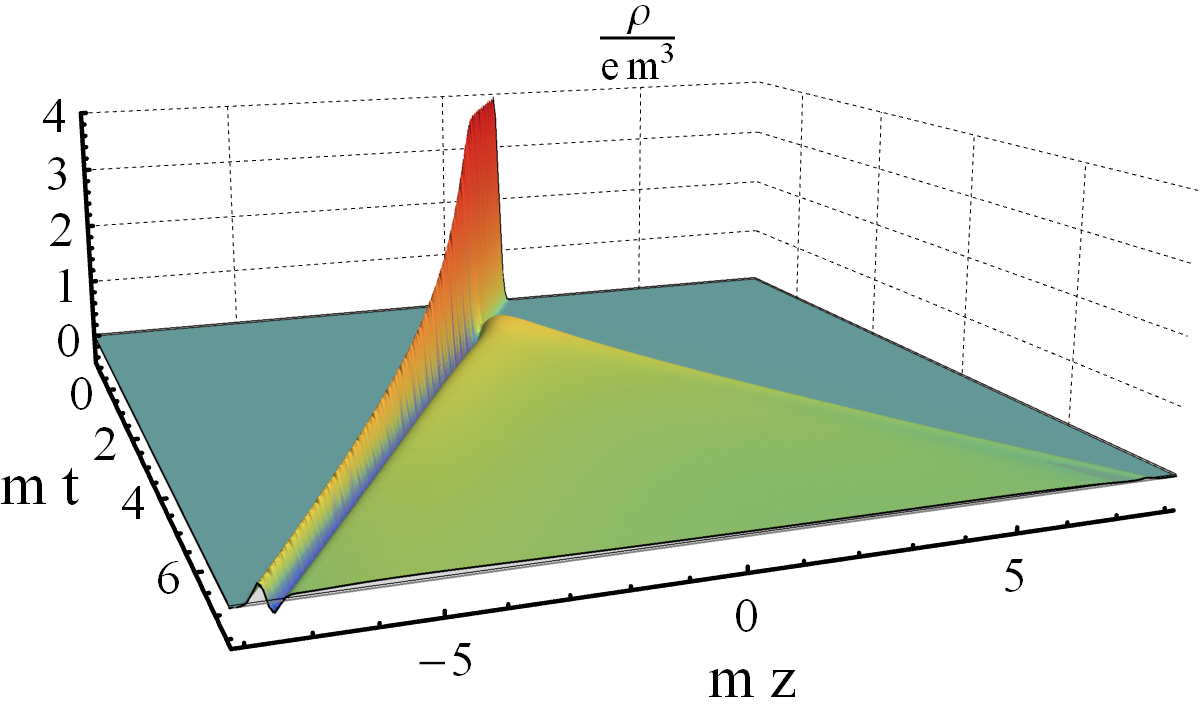
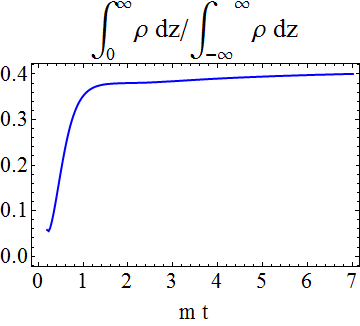
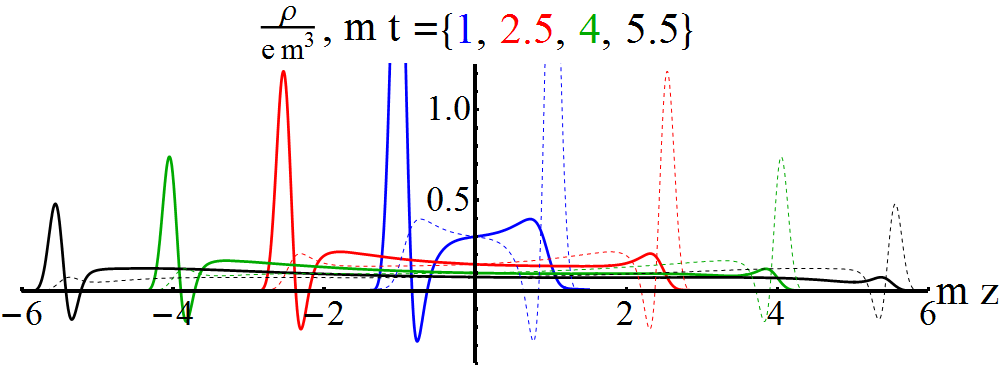
When colliding shocks with symmetric energy and charge distributions it is impossible to determine which part of the energy and charge in the final plasma comes from the left- or right-moving shock. In our current set-up, however, it is possible to charge only the left-moving shock, leaving the right-moving shock neutral. This results in a charge distribution as shown in Fig. 7.666Note that without backreaction the charge of the colliding shocks does not interact with itself; the charge profile of the symmetric collision is hence equal to the sum of the dashed and solid lines in Fig. 7. Clearly most of the charge ends up at , but at later times a surprisingly large fraction of about 41% ends up at , indicating that the strong interactions of the collision can indeed let the charge density bounce back, reflecting the direction of 41% of the charge.
Quite interestingly, the right-moving charge contains a bump moving close to the speed of light, though not as fast as the left-moving shock moving at the speed of light. This bump, however, does not come with a minimum with negative charge density, indicating that the negative charge density has to be associated to the presence of the original shock on the light cone. We verified that the profile away from the original shock is independent of the width of the charge, in agreement with the findings in Casalderrey-Solana:2013sxa . Experimentally, these simulations have potential consequences when it is possible to vary the baryon charge while leaving the energy constant. This can for instance be done by comparing proton with antiproton collisions, or deuteron collisions with proton collisions of double the energy (preferably selected such that the deuteron is aligned along the beam direction).
5 Charge backreaction
We now move away from the case and include the full backreaction of the charge density. We find that, for a given width of the incoming shocks, there is a maximum value of that our code is able to evolve. One clear physical reason why there is such a maximum value is that the charged plasma formed after the collision has to have a smaller charge density than the maximum density set by Eq. (17), and indeed our simulations reach as high as 80% of the maximum value according to the instantaneous energy density. On the other hand, this maximum value is also sensitive to the performance of the numerical code and furthermore depends sensitively on the initial separation of the shocks. The latter may be an indication that single charged shock waves cannot be evolved in a stable manner by themselves. Nevertheless, choosing initial conditions with the shocks close enough to each other determines well-defined initial conditions, which shows us the effect of the back reaction of the charge on the metric. In a nutshell, the conclusions from these simulations are that (i) the effect of the charge on generic observables is relatively small, and (ii) this effect scales approximately linearly with . We emphasize that these results are non-trivial since the charge density attains values well into what is expected to be the non-linear regime based on Eq. (15).
To illustrate these results, in Fig. 8 we compare the energy density at mid-rapidity as a function of time for collisions with identical initial conditions but different values of .
 |

|
The first row shows the energy density itself, whereas the second row shows the relative difference between a given collision and the collision, normalized by . The maximum value of the curves on the second row tells us that the maximum effect of the backreaction is about for thin shocks and for thick shocks. The fact that the curves on the second row fall almost on top of each other for thin shocks (left) means that in this case the backreaction of the charge is almost exactly linear in . For thick shocks the deviations from linearity are slightly larger. Note that in both cases the charge density as a function of time is not small. Indeed, for thin shocks it initially exceeds 60% of the would-be maximum value according to the instantaneous energy density and drops to around 30% at later times. For thick shocks the maximum exceeds 80% and the curve drops to 70% at later times. Fig. 9 shows the same information as Fig. 8 but as a function of at a constant time . In the case of thin shocks we have chosen , whereas in the case of thick shocks is the time at which the green curve in the second row of Fig. 8 attains its maximum.
 |

|
As expected from this discussion, the effect of the charge density on the hydrodynamization time of the stress tensor is relatively small. For example, we find that for collisions with the hydrodynamization time in the charged case, with , is 3% shorter than in the neutral case. Instead, for collisions with the hydrodynamization time in the charged case, with , is 6% longer than in the neutral case.
6 Discussion
We have studied collisions of charged shocks in AdS5. Via the gauge/gravity duality, these are dual in the gauge theory to collisions of lumps of energy carrying fixed amounts of baryon charge (per unit area). As discussed in Casalderrey-Solana:2013aba , the dynamics of the stress tensor show qualitatively different features depending on the width of the colliding shocks. In this paper we have shown that similar qualitative differences also appear in the distribution of baryon charge after the collision. One of the main observations of Casalderrey-Solana:2013aba was that, while thick shocks lead to a complete stopping of the incident energy followed by a subsequent hydrodynamic evolution, narrow shocks exhibit a transparent regime at early times in which the initial shocks cross each other depositing their energy gradually as time progresses. In this paper we have shown that the baryon charge deposition exhibits identical behaviour, as illustrated in Fig. 2.
This transparent regime is transient, meaning that at a sufficiently late time the receding shock fragments are completely absorbed by the plasma. Nevertheless, the space-time rapidity distribution of baryon charge exhibits interesting diverse features for the two cases we have explored, as shown in Fig. 4. At fixed proper times, both for thick and thin shocks the charge distribution is wider in rapidity than the energy distribution. This means that, as rapidity grows, the plasma becomes more baryon rich, as illustrated by the increase in the chemical potential plotted in Fig. 6. However, for thin shocks the deposition of charge is wider than for thick shocks and it evolves much faster with time. Quite remarkably, for thin shocks the initial close-to-Gaussian charge distribution at early times, prior to hydrodynamisation, changes quickly to an almost-flat distribution in space-time rapidity which, within our limited numeric range, hints at the formation of maxima at relatively large rapidity, . In the range of proper times and rapidities covered by our simulations, see Fig. 5, these structures appear in regions in which the evolution is well described by hydrodynamics. However, the formation of these maxima may involve far-from-equilibrium dynamics that the hydrodynamic regions are in causal contact with. For thin shocks at very late times, the large rapidity region also develops local minima close to the edge of the rapidity coverage, which arise solely from the hydrodynamic evolution of the plasma.
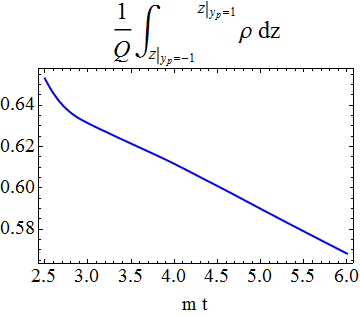
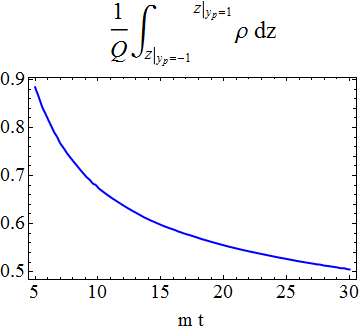
The space-time rapidity profile of the charge distribution hence indicates that collisions of shock waves lead to a significant stopping of the baryon charge of the incident projectiles. To best illustrate this point it is instructive to determine the fraction of the total charge (per unit area) of the incident shocks that is deposited between momentum rapidity and , with and the velocity field in the collision direction. This is determined by integrating the charge between the two points where the fluid velocity reaches , divided by the total charge. We show this quantity as a function of time in Fig. 10 for both thin and thick shocks.
 |
|
For thick shocks, the mid-rapidity charge fraction is bigger than for the thin shocks, which implies that the charge distribution is narrower in rapidity, as also illustrated in the right panel of Fig. 4. If the expansion of the system were exactly boost invariant, this quantity would remain constant in the hydrodynamic regime; therefore, the decrease of this fraction at later times is a consequence of non-boost invariant dynamics. Despite this decrease, this computation shows that more than 50% of the charge carried by the initial shocks is deposited within two units of rapidity at early times.777This quantity does not directly correspond to experimental measurements, as this requires a longer and more advanced hydrodynamic evolution and freeze-out. Nevertheless, for comparison, experimentally the fraction of baryon charge between rapidity -1.0 and 1.0 is approximately and for heavy ion collisions at and GeV respectively Bearden:2003hx .
This strong baryon stopping is reminiscent of the behaviour of the net proton number in low-energy heavy ion collisions at GeV. Indeed, heavy ion experiments performed at AGS Back:2000ru and SPS Appelshauser:1998yb found a large stopping of the baryon charge, with most of the net protons concentrated in the mid-rapidity region. As the energy of the beams increases, the rapidity width of the charge distribution increases, reducing the fraction of the total charge at mid-rapidity. Taking the width of our shocks as a proxy for the energy of the incident nuclei Casalderrey-Solana:2013aba , this trend is in qualitative agreement with the behaviour of the charge distribution in our simulations. This qualitative agreement indicates that shock wave collisions may provide a good framework to understand the hydrodynamisation of low- and moderate-energy heavy ion collisions, as those studied in the RHIC energy scan.
In contrast, the dynamics of our simple holographic model does not seem to agree qualitatively with the distribution of net baryon number in heavy ion collisions at full RHIC or LHC energies. For those energies, the amount of net baryon number at mid-rapidity represents a small fraction of the total baryon number, and the distribution of baryon charge peaks a few units of rapidity away from the beam rapidity. Quite remarkably, as we have discussed, our thin shock simulations hint at the development of maxima at moderately large rapidity, which may be interpreted as the onset of this non-monotonous behaviour. However, unlike in heavy ion collisions, most of the baryon charge is initially concentrated within a few units of rapidity.
The discrepancy above is consistent with the difficulties in reproducing the LHC multiplicity rapidity profiles at high energies, as noted in vanderSchee:2015rta . It may be due to the extreme simplicity of our model, which just evolves in the simplest holographic setting with the simplest Maxwell field possible, and for instance does not contain any matter in AdS. We are also working in a model that only describes the very first moments of a high energy collision, without treating a long hydrodynamic phase or freeze-out, and our model restricts to homogeneity in the transverse plane. Naturally, the discrepancy may also point to a deeper difference between our holographic setup and the dynamics of QCD. Indeed, most of the baryonic charge of hadrons are carried by valence quarks, which also carry a large fraction of the full hadron momentum. In contrast, the shock waves posses structure functions concentrated at small Bjorken Avsar:2009xf . Since processes able to reduce the rapidity of valence quarks by a significant amount involve large momentum transfers, large rapidity shifts at high energies are suppressed as a consequence of asymptotic freedom. The qualitative disagreement in the rapidity distribution of the charge is perhaps not surprising given the absence of this perturbative physics on the gravity side. Nevertheless, since the matter produced at mid-rapidities in a ultra-relativistic collision is soft, the interactions and generation of this matter may still be dominated by strong coupling processes. It would be interesting to develop hybrid approaches able to address these two separated regimes within the duality, perhaps along the lines of Casalderrey-Solana:2014bpa ; Iancu:2014ava .
Acknowledgements.
We thank Michal Heller, Krishna Rajagopal and Paul Romatschke for interesting discussions. JCS is a Royal Society University Research Fellow and was also supported by a Ramón y Cajal fellowship, by the Marie Curie Career Integration Grant FP7-PEOPLE-2012-GIG-333786 and by the Spanish MINECO through grant FPA2013-40360-ERC. We are also supported by grants MEC FPA2013-46570-C2-1-P, MEC FPA2013-46570-C2-2-P, MDM-2014-0369 of ICCUB, 2014-SGR-104, 2014-SGR-1474, CPAN CSD2007-00042 Consolider-Ingenio 2010, and ERC Starting Grant HoloLHC-306605. WS is supported by the U.S. Department of Energy under grant Contract Number DE-SC0011090.References
- (1) P. M. Chesler and L. G. Yaffe, “Holography and colliding gravitational shock waves in asymptotically AdS5 spacetime,” Phys. Rev. Lett. 106, 021601 (2011) doi:10.1103/PhysRevLett.106.021601 [arXiv:1011.3562 [hep-th]].
- (2) J. Casalderrey-Solana, M. P. Heller, D. Mateos and W. van der Schee, “From full stopping to transparency in a holographic model of heavy ion collisions,” Phys. Rev. Lett. 111, 181601 (2013) doi:10.1103/PhysRevLett.111.181601 [arXiv:1305.4919 [hep-th]].
- (3) J. Casalderrey-Solana, M. P. Heller, D. Mateos and W. van der Schee, “Longitudinal Coherence in a Holographic Model of Asymmetric Collisions,” Phys. Rev. Lett. 112, no. 22, 221602 (2014) doi:10.1103/PhysRevLett.112.221602 [arXiv:1312.2956 [hep-th]].
- (4) P. M. Chesler and L. G. Yaffe, “Holography and off-center collisions of localized shock waves,” JHEP 1510, 070 (2015) doi:10.1007/JHEP10(2015)070 [arXiv:1501.04644 [hep-th]].
- (5) J. Casalderrey-Solana, H. Liu, D. Mateos, K. Rajagopal and U. A. Wiedemann, “Gauge/String Duality, Hot QCD and Heavy Ion Collisions,” arXiv:1101.0618 [hep-th].
- (6) P. M. Chesler and W. van der Schee, “Early thermalization, hydrodynamics and energy loss in AdS/CFT,” Int. J. Mod. Phys. E 24, no. 10, 1530011 (2015) doi:10.1142/S0218301315300118 [arXiv:1501.04952 [nucl-th]].
- (7) J. F. Fuini and L. G. Yaffe, “Far-from-equilibrium dynamics of a strongly coupled non-Abelian plasma with non-zero charge density or external magnetic field,” JHEP 1507, 116 (2015) doi:10.1007/JHEP07(2015)116 [arXiv:1503.07148 [hep-th]].
- (8) J. P. Gauntlett and J. B. Gutowski, “All supersymmetric solutions of minimal gauged supergravity in five-dimensions,” Phys. Rev. D 68, 105009 (2003) [Phys. Rev. D 70, 089901 (2004)] doi:10.1103/PhysRevD.70.089901, 10.1103/PhysRevD.68.105009 [hep-th/0304064].
- (9) S. de Haro, S. N. Solodukhin and K. Skenderis, “Holographic reconstruction of space-time and renormalization in the AdS / CFT correspondence,” Commun. Math. Phys. 217, 595 (2001) doi:10.1007/s002200100381 [hep-th/0002230].
- (10) J. Erdmenger, M. Haack, M. Kaminski and A. Yarom, “Fluid dynamics of R-charged black holes,” JHEP 0901, 055 (2009) doi:10.1088/1126-6708/2009/01/055 [arXiv:0809.2488 [hep-th]].
- (11) N. Banerjee, J. Bhattacharya, S. Bhattacharyya, S. Dutta, R. Loganayagam and P. Surowka, “Hydrodynamics from charged black branes,” JHEP 1101, 094 (2011) doi:10.1007/JHEP01(2011)094 [arXiv:0809.2596 [hep-th]].
- (12) P. M. Chesler and L. G. Yaffe, “Numerical solution of gravitational dynamics in asymptotically anti-de Sitter spacetimes,” JHEP 1407, 086 (2014) doi:10.1007/JHEP07(2014)086 [arXiv:1309.1439 [hep-th]].
- (13) W. van der Schee, “Gravitational collisions and the quark-gluon plasma,” arXiv:1407.1849 [hep-th].
- (14) P. M. Chesler, N. Kilbertus and W. van der Schee, “Universal hydrodynamic flow in holographic planar shock collisions,” JHEP 1511, 135 (2015) doi:10.1007/JHEP11(2015)135 [arXiv:1507.02548 [hep-th]].
- (15) J. L. Albacete, Y. V. Kovchegov and A. Taliotis, “Asymmetric Collision of Two Shock Waves in AdS(5),” JHEP 0905 (2009) 060 doi:10.1088/1126-6708/2009/05/060 [arXiv:0902.3046 [hep-th]].
- (16) P. Arnold, P. Romatschke and W. van der Schee, “Absence of a local rest frame in far from equilibrium quantum matter,” JHEP 1410, 110 (2014) doi:10.1007/JHEP10(2014)110 [arXiv:1408.2518 [hep-th]].
- (17) I. G. Bearden et al. [BRAHMS Collaboration], “Nuclear stopping in Au + Au collisions at GeV,” Phys. Rev. Lett. 93, 102301 (2004) doi:10.1103/PhysRevLett.93.102301 [nucl-ex/0312023].
- (18) B. B. Back et al. [E917 Collaboration], “Baryon rapidity loss in relativistic Au+Au collisions,” Phys. Rev. Lett. 86, 1970 (2001) doi:10.1103/PhysRevLett.86.1970 [nucl-ex/0003007].
- (19) H. Appelshauser et al. [NA49 Collaboration], “Baryon stopping and charged particle distributions in central Pb + Pb collisions at 158-GeV per nucleon,” Phys. Rev. Lett. 82, 2471 (1999) doi:10.1103/PhysRevLett.82.2471 [nucl-ex/9810014].
- (20) W. van der Schee and B. Schenke, “Rapidity dependence in holographic heavy ion collisions,” Phys. Rev. C 92, no. 6, 064907 (2015) doi:10.1103/PhysRevC.92.064907 [arXiv:1507.08195 [nucl-th]].
- (21) E. Avsar, E. Iancu, L. McLerran and D. N. Triantafyllopoulos, “Shockwaves and deep inelastic scattering within the gauge/gravity duality,” JHEP 0911, 105 (2009) doi:10.1088/1126-6708/2009/11/105 [arXiv:0907.4604 [hep-th]].
- (22) J. Casalderrey-Solana, D. C. Gulhan, J. G. Milhano, D. Pablos and K. Rajagopal, “A Hybrid Strong/Weak Coupling Approach to Jet Quenching,” JHEP 1410, 19 (2014) Erratum: [JHEP 1509, 175 (2015)] doi:10.1007/JHEP09(2015)175, 10.1007/JHEP10(2014)019 [arXiv:1405.3864 [hep-ph]].
- (23) E. Iancu and A. Mukhopadhyay, “A semi-holographic model for heavy-ion collisions,” JHEP 1506, 003 (2015) doi:10.1007/JHEP06(2015)003 [arXiv:1410.6448 [hep-th]].