Temperature structures in Galactic Center clouds
The Central Molecular Zone (CMZ) at the center of our Galaxy is the best template to study star formation processes under extreme conditions, similar to those in high-redshift galaxies. We observed on-the-fly maps of para-H2CO transitions at 218 GHz and 291 GHz towards seven Galactic Center clouds. From the temperature-sensitive integrated intensity line ratios of H2CO(322,0)/H2CO(320,2) and H2CO(432,1)/H2CO(430,3) in combination with radiative transfer models, we produce gas temperature maps of our targets. These transitions are sensitive to gas with densities of 105 cm-3 and temperatures <150 K. The measured gas temperatures in our sources are all higher (>40 K) than their dust temperatures (25 K). Our targets have a complex velocity structure that requires a careful disentanglement of the different components. We produce temperature maps for each of the velocity components and show that the temperatures of the components differ, revealing temperature gradients in the clouds. Combining the temperature measurements with the integrated intensity line ratio of H2CO(430,3)/H2CO(320,2), we constrain the density of this warm gas to 10106 cm-3. We find a positive correlation of the line width of the main H2CO lines with the temperature of the gas, direct evidence for gas heating via turbulence. Our data is consistent with a turbulence heating model with a density of n = 105 cm-3.
Key Words.:
Galaxy: center, ISM: molecules, ISM: structure, ISM: clouds, Submillimeter: ISM1 Introduction
The central region of the Milky Way, the so-called Central Molecular Zone (CMZ), is an exceptional star-forming environment. This region contains 10% of the Galaxy’s total molecular gas and produces 510% of the Galaxy’s infrared and Lyman continuum luminosity (Morris & Serabyn, 1996). The conditions (pressure, magnetic field strength, turbulence, gas temperature, etc.) in this region are much more extreme than in Galactic plane clouds (Morris & Serabyn, 1996). The star formation rate in the CMZ is a factor of 10100 lower than expected for the huge amount of dense gas and dust contained in this region (e.g. Yusef-Zadeh et al., 2009; Immer et al., 2012; Longmore et al., 2013; Kruijssen & Longmore, 2013).
The high gas temperatures are one of the key properties of the CMZ clouds, influencing the chemistry of the gas as well as the star formation efficiency of the clouds. It determines the thermal Jeans mass as well as the sound speed which in turn sets the Mach number. Understanding the gas temperature structure of Galactic Center clouds is thus crucial for understanding the fragmentation and star forming mechanisms within them. The discrepancy between observed dust and gas temperatures is a long-known feature of CMZ clouds. While multi-wavelength observations of the dust emission in the CMZ yield dust temperatures of 20 K (Lis et al., 1999; Molinari et al., 2011), comparable to dust temperatures of Galactic plane clouds, the gas temperatures are much higher (50 K, Güsten et al., 1981; Hüttemeister et al., 1993; Ao et al., 2013; Mills & Morris, 2013; Ott et al., 2014; Ginsburg et al., 2016). Many previous gas temperature measurements in the CMZ are based on observations of the NH3 molecule which traces low-density gas (n 103 cm-3, e.g. Güsten et al., 1981; Hüttemeister et al., 1993; Ott et al., 2014). Ao et al. (2013) mapped the inner 75 pc of the CMZ in the para-H2CO transitions at 218 GHz, sensitive to warmer (T 20 K) and denser (n 10105 cm-3) gas. Their results show high gas temperatures towards many CMZ clouds, comparable to those measured in prior studies. This survey was extended to the whole CMZ (0.4∘ l 1.6∘) by Ginsburg et al. (2016). The inferred gas temperatures range from 60 K to 100 K, where the highest values are measured towards Sgr B2, the 20 and 50 km/s clouds, and G0.253+0.016 (“The Brick”). Comparing their results with dust temperature measurements of the whole CMZ, they show that the gas is uniformly hotter than the dust. The high gas temperatures are consistent with heating through turbulence, while uniform cosmic ray heating is excluded as a dominant heating mechanism.
H2CO is a slightly asymmetric rotor molecule. It has two different species (i.e. ortho and para) for which the Ka111Ka is the projection of J along the symmetry axis for the limiting case of a prolate (oblate) top. quantum number is odd or even. These two species are not connected by radiative transitions. The differences in the population of levels separated by Ka = 2n are due to collisions. Mangum & Wootten (1993) presented a detailed study of the usability of different H2CO transitions for the determination of the kinetic temperature and density of the gas in molecular clouds. For a range of total angular momentum quantum numbers (here J = 2 and 3), modeling of the relative intensities of (in our case) para-H2CO lines (Ka quantum number of 0 or 2), delivers estimates of the density and the temperature. The Ka ladders are close in frequency and thus can be observed with the same telescope, even very often in the same spectrum which makes them calibration-independent.
The J = 32 and 43 H2CO Ka ladders at 218 and 291 GHz, respectively, can be observed with the Atacama Pathfinder Experiment (APEX) telescope, each group within one band. Mangum & Wootten (1993) showed that measuring several H2CO intensity ratios of transitions with different J values yields better constraints of the kinetic temperature than can be obtained from just one H2CO intensity ratio. This is clear since then a larger range of level energies is covered.
In this paper, we report a detailed gas temperature study of seven molecular clouds in the CMZ, using the H2CO thermometer at 218 and 291 GHz. The names of the observed sources and their coordinates are listed in Table 2. We chose our targets to be high density clouds with previous warm gas temperature measurements. As shown in Fig. 1, they span the whole CMZ. None of these clouds are photon-dominated or X-ray-dominated regions. There is evidence of wide-spread shocks in the form of SiO emission in the CMZ including these clouds. Our sample contains potential star forming clouds (Sgr C, 20 km/s cloud, 50 km/s cloud, G0.4800.006), quiescent clouds (G0.411+0.050) and shock heated clouds (G0.253+0.016). There is an ongoing debate whether Sgr D is part of the CMZ or not (Mehringer et al., 1998; Blum et al., 1999; Sawada et al., 2009). However, this uncertainty does not influence our results or conclusions.
In Section 2, we describe the observations and the calibration of the data. In Section 3, we present how the H2CO spectra, ratio and uncertainty maps were produced. In Section 4, the radiative transfer modeling is described. We discuss the different results in Section 5 and give conclusions in Section 6.
2 Observation and Data Reduction

2.1 Observations
| Source | R.A. | Dec | vLSR | OTF Size | vrange | ||||
|---|---|---|---|---|---|---|---|---|---|
| (hh mm ss.ss) | (dd .) | (km s-1) | ( x ) | (mK per pixel) | (km s-1) | ||||
| (EQ 2000) | (EQ 2000) | 218 GHz | 291 GHz | 218 GHz | 291 GHz | Whole Source | Vel. Comp. | ||
| 20 km/s cloud | 17 45 36.89 | 29 05 12.0 | 20 | 115 x 200 | 180 x 270 | 41 | 30 | 15 36 | 0 6 |
| 8 14 | |||||||||
| 27 33 | |||||||||
| 50 km/s cloud | 17 45 51.18 | 28 59 34.3 | 50 | 115 x 150 | 180 x 180 | 59 | 46 | 16 80 | 41 47 |
| 57 63 | |||||||||
| G0.253+0.016 | 17 46 08.55 | 28 42 44.0 | 25 | 115 x 200 | 200 x 340 | 35 | 44 | 6 54 | 3 3 |
| 16 22 | |||||||||
| 36 42 | |||||||||
| 75 81 | |||||||||
| G0.411+0.050 | 17 46 24.44 | 28 33 26.6 | 25 | 115 x 115 | 180 x 240 | 36 | 44 | 10 30 | 19 25 |
| G0.4800.006 | 17 46 46.00 | 28 31 51.0 | 25 | 115 x 115 | 180 x 240 | 49 | 43 | 19 44 | 27 33 |
| Sgr C | 17 44 43.20 | 29 27 53.7 | 50 | 200 x 180 | 44 | 60 46 | 55 49 | ||
| Sgr D | 17 48 41.75 | 28 01 45.0 | 15 | 180 x 180 | 44 | 17 14 | 19 13 | ||
| Transition | Eup | |
|---|---|---|
| (GHz) | (K) | |
| 320,2 | 218.22219 | 20.96 |
| 322,1 | 218.47563 | 68.09 |
| 322,0 | 218.76007 | 68.11 |
| 430,3 | 290.62341 | 34.90 |
| 432,2 | 291.23778 | 82.07 |
| 432,1 | 291.94806 | 82.12 |
In 2012 and 2014, we observed five and seven molecular clouds in the Central Molecular Zone (Table 2) with the APEX444This publication is based on data acquired with the Atacama Pathfinder Experiment (APEX). APEX is a collaboration between the Max-Planck-Institut für Radioastronomie, the European Southern Observatory, and the Onsala Space Observatory. telescope (Güsten et al., 2006) at 218 and 291 GHz, respectively (project codes: M089.F00292012, M093.F00302014). On-the-fly (OTF) maps were taken with the Swedish heterodyne facility instrument (SHeFi, Vassilev et al., 2008) as well as the First Light APEX Submillimeter Heterodyne (FLASH) receiver (Heyminck et al., 2006; Klein et al., 2014), using the eXtended bandwidth Fast Fourier Transform Spectrometer (XFFTS) backend (Klein et al., 2012). Table 3 shows the covered para-H2CO transitions.
The SHeFi observations were centered at 218.9 GHz and covered a bandwidth of 4 GHz. The FLASH observations were taken in the frequency ranges 278.5282.5 GHz and 290.5294.5 GHz. The XFFTS backend provides a fixed number of 32768 spectral channels, resulting in a resolution of 0.1 km s-1 at 218 GHz and 0.04 km s-1 at 291 GHz. To increase the signal-to-noise ratio of the spectra, we smoothed the two datasets by a factor of 9 and 24, respectively, yielding a velocity resolution of 0.9 km s-1. Since we do not expect to detect lines in our spectra that are narrower than a few km s-1, this velocity resolution is sufficient. The full widths at half maximum of the beams were 30 at 218 GHz and 24 at 291 GHz.
A first calibration of the data was conducted already at the telescope, yielding spectra with calibrated fluxes at each position of the OTF maps. The calibration error of this step is about 15% for each dataset (SHeFI calibration plan; A. Belloche for FLASH, priv. comm.). We then converted the antenna temperatures of the spectra into main beam temperatures, using Ruze’s equation with the scaling factor being 0.69 and the width factor 19 micron. The two datasets were further edited and analyzed with the software CLASS from the GILDAS package (Pety, 2005).
2.2 Baseline subtraction
The 218 GHz spectra were strongly affected by bad baselines (Fig. 7c). Since the baselines could not be cleanly removed by fitting low-level polynomials to the data, we fitted the spectra with splines over the velocity ranges 90250 km s-1 for the 20 km/s cloud, G0.253+0.016, G0.411+0.050, and G0.4800.006, and 60220 km s-1 for the 50 km/s cloud. First, the raw data were smoothed to a velocity resolution of 0.9 km s-1, then lines in the spectra were fitted with Gaussians and removed from the spectra if they were at least a 3 detection. Then, the data were down sampled to a resolution of 36 km s-1 to ensure that weak line emission that was not removed in the previous step would be smoothed out over the adjacent channels. This spectrum was then resampled to the original resolution of 0.9 km s-1, yielding the spline spectrum, and then subtracted from the input spectrum. However, in some of the spectra, the baseline features are as narrow as the spectral lines and could not be removed completely, resulting in negative features in the final spectra. Figure 7c in the Appendix shows one input spectrum, the fitted spline, and the final spectrum. The grey box marks one of the narrow negative features in the spectrum.
The 291 GHz dataset was much less affected by bad baselines. The baselines were removed by fitting each spectrum with a 1st-order polynomial over the velocity ranges 120120 km s-1 (20 km/s cloud), 70120 km s-1 (50 km/s cloud), 90120 km s-1 (G0.253+0.016, G0.411+0.050, G0.4800.006), and 200100 km s-1 (Sgr C, Sgr D).
2.3 H2CO spectra


To obtain average spectra of the six H2CO lines at 218 GHz and 291 GHz, we averaged the 218.15218.85 GHz and 290.55292.1 GHz emission, respectively, over the OTF map of each source. As an example, the spectra of the 20 km/s cloud and G0.411+0.050 are shown in Fig. 2. In addition to the six pH2CO lines in the two frequency ranges, we marked the transitions HC3N(2423), CH3OH(431,2), and oH2CO(433,1). The spectra of all sources are presented in Fig. 8 in the Appendix. To better compare the strength of the different lines, we chose the same intensity scale for all spectra.
The H2CO emission at both frequencies is strongest in the 20 and 50 km/s clouds. Here, all six pH2CO lines are well-detected. In G0.411+0.050 and Sgr D, the H2CO emission at 291 GHz is almost not detected in the average spectra.
In Fig. 9 in the Appendix, we overplot the H2CO(320,2) and the H2CO(430,3) spectra for the 20 and 50 km/s clouds. The figure shows that the line width of the two transitions is comparable.
2.4 Methanol contamination
The H2CO(322,1) and the CH3OH(431,2) transitions are separated by 35 MHz, corresponding to 25.5 km s-1. These two lines are well-resolved and well-separated in our data. However, in sources for which the range of velocity components extends over more than 26 km s-1, the integrated intensity maps of the H2CO(322,1) line are contaminated by methanol emission for certain velocity components (see Fig. 10c in the Appendix). We thus excluded this line from the further analysis.
3 Analysis
3.1 Velocity ranges
To determine the whole velocity range covered by H2CO emission for each source, we used the
218 GHz spectra (Fig. 8, Sect. 2.3) and zoomed in
on the H2CO(320,2) line. We fitted a linear baseline
to line-free channels close to the line to obtain the average rms level in each OTF map.
For each source, we determined the velocity range where the
line emission was above 3 (Col. 9 in Table 2, Fig. 11g in the Appendix).
For Sgr C and Sgr D, we followed the same procedure but used the transition H2CO(430,3).
To detect different velocity components, we subdivided the OTF maps into small tiles of size 33 x 33, slightly larger than the beam, and averaged the H2CO(320,2) spectra over these areas. We fitted the line with several Gaussians if more than one velocity component was present and determined the central velocity of each component in each tile.
For each velocity component in each source, we averaged the H2CO(320,2) spectra (H2CO(430,3) in the case of Sgr C and Sgr D) over the area where this component dominated and again estimated the central velocity of the line in the averaged spectrum. To separate the components well spatially and spectrally in the following analysis, we set the velocity ranges over which the H2CO emission is integrated as 3 km s-1 around the central velocity of each component (Col. 10 in Table 2).
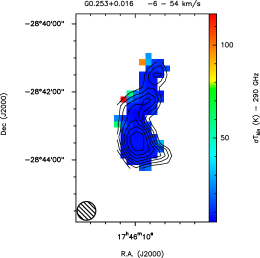
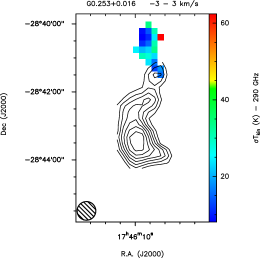
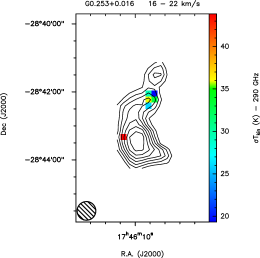
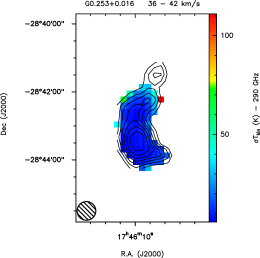
We detected velocity gradients in three of our clouds. In G0.253+0.016, the average velocities range from 40 km s-1 in the south-west of the cloud to 0 km s-1 in the North-East. We identified four spatially distinct velocity components at 0, 19, 39, and 78 km s-1 in this source. While the emission of the first three velocity components peaks towards the cloud, the emission of the 78 km s-1 component originates from the south-east border of the cloud and might not be associated with this cloud.
In the 20 km/s cloud, the velocity gradient spreads over 30 km s-1 from the south-east end of the cloud to the north-west part. The three velocity components we identified in this source are at 3, 11, and 30 km s-1. Most of the 50 km/s cloud is at 45 km s-1 but there are higher velocities detected at the north and lower velocities at the west end of the cloud. The velocity gradient also spans about 15 km s-1. We could distinguish between two velocity components at 44 and 60 km s-1.
We identified only one velocity component in the other clouds. The H2CO emission peaks at 22 km s-1 in G0.411+0.050, 30 km s-1 in G0.4800.006, 52 km s-1 in Sgr C and 16 km s-1 in Sgr D.
3.2 Integrated intensity ratio and uncertainty maps
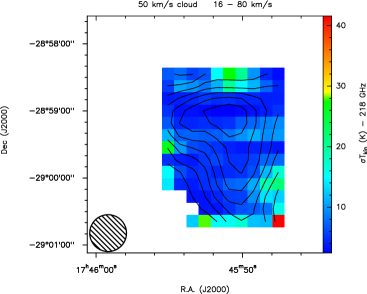
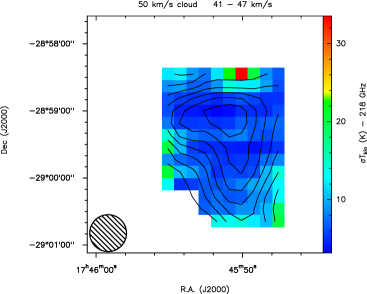
For each H2CO transition in Table 3, we produced calibrated data cubes on a grid with a resolution of 1 km s-1. The cubes are smoothed to a resolution of 33. The pixel size is 11. For each pixel of these cubes, we fitted linear baselines to line-free velocities at both sides of the lines. For each line and all velocity components of our targets, we produced maps of the uncertainty of the line intensity by assigning every pixel of the map the corresponding from the baseline fitting. The median of of the maps ranges between 35 and 59 mK per pixel at 218 GHz and 30 and 46 mK per pixel at 291 GHz (Cols. 7, 8 in Table 2).
As described in Sect. 1, the relative intensities of para-H2CO lines yield estimates of the temperature and density of the gas. We selected the following key line ratios
For a better readability of the paper, we will abbreviate these ratios with R321, R404, and R422, respectively, in the following text.
For each pixel in the data cubes, we integrated the emission of the para-H2CO lines independently over the same velocity range vrange, yielding separate integrated intensity maps for the different lines. We produced these maps for all velocity components of our targets (vrange in Cols. 9, 10 in Table 2; Figs. 12 18 in the Appendix).
We identified the pixels in the OTF maps of each source where the integrated emission of the H2CO(320,2) and the H2CO(430,3) lines, respectively, was above the threshold. The parameter vres is the velocity resolution of our data. For these pixels, we determined the aforementioned ratios from the integrated intensity maps of these lines, yielding integrated intensity ratio maps (Figs. 19 25 in the Appendix).
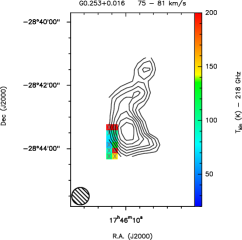
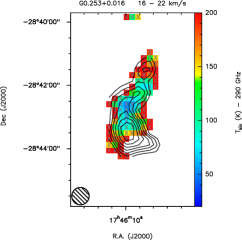
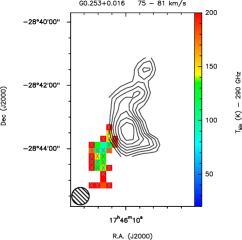
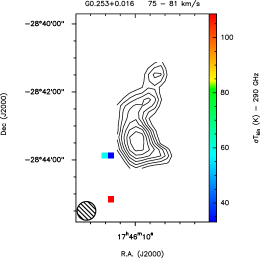
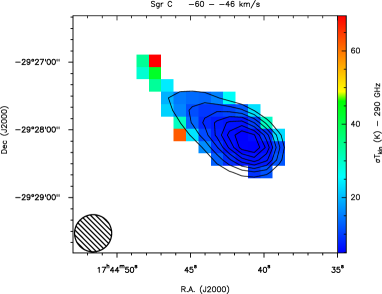
For positions where the integrated emission of the line in the numerator was below the 5 threshold, the integrated intensity value was exchanged for the value , representing upper limits of the ratios (marked with Xs in the maps). For each pixel in the ratio maps (except upper limits), we then determined the uncertainty of the ratio via Gaussian error propagation, using the uncertainty maps of the intensity of the two corresponding lines. The remaining pixels (corresponding to the pixels with upper limits in the ratio maps) were blanked in grey. In two velocity components of two sources, all or almost all pixels are upper limits (G0.253+0.016: 1622 km/s, 291 GHz; 7581, 218 and 291 GHz; G0.411+0.050: both velocity components, 291 GHz).
4 Modeling
4.1 Fundamental Approach


We use RADEX (van der Tak et al., 2007) and a related solver (Fujun Du’s myRadex; https://github.com/fjdu/myRadex) to create model intensities for the para-H2CO lines. The calculations are executed using pyradex, a Python–based wrapper for RADEX (developed by A. Ginsburg; https://github.com/keflavich/pyradex). The collision rates used here (from Wiesenfeld & Faure, 2013) are retrieved from the LAMDA data base (Schöier et al., 2005). This approach is conceptually identical to the one employed by Ginsburg et al. (2016), though we choose slightly different gas properties to solve the radiative transfer problem.
We adopt a fiducial set of conditions for our calculations of emission line intensities and ratios. Below we show that our temperature estimates are robust with respect to the choice of values for these parameters. We assume particle densities of . This choice is motivated by the average densities of a few as estimated for our targets via the analysis of dust emission maps (Kauffmann et al., subm.). The column density of para-H2CO is set to . For a representative column density of (Kauffmann et al., subm.) this corresponds to an abundance of with respect to , a value that is suggested by previous work (for a summary, see Ginsburg et al., 2016). We adopt a velocity dispersion of . This value is appropriate for structures with a radius of order 1 pc, which is about the diameter of our beam. The calculations are executed assuming a spherical geometry.
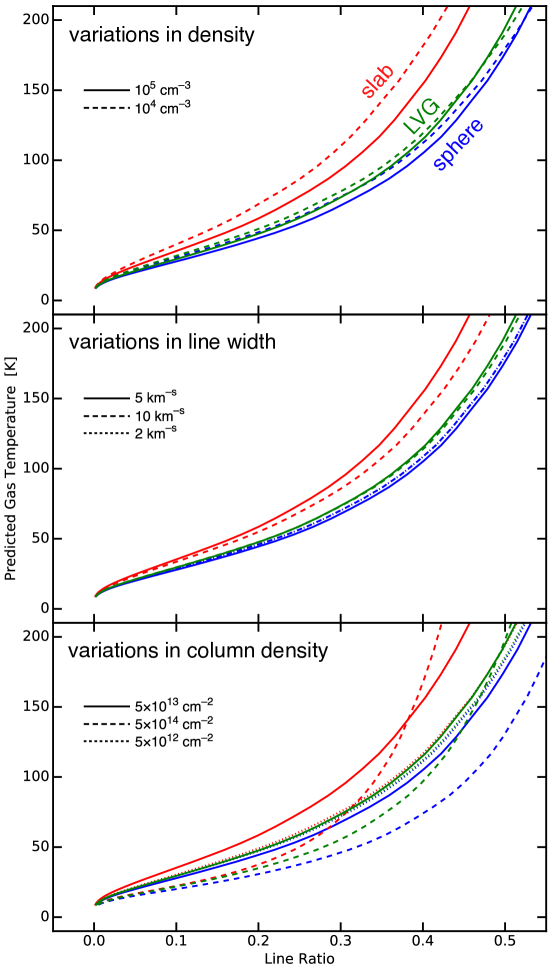
We compute the intensities of para– emission lines under the aforementioned conditions. These intensities can be used to calculate the R321 and R422 line ratios. These line ratios are known to be highly sensitive to the temperature while being rather insensitive to changes in other parameters (e.g. Mangum & Wootten, 1993, see left panel of Fig. 3b for R321). This trend is confirmed in calculations discussed below. For this reason, the R321 and R422 line ratios can be used to estimate the kinetic gas temperature.
In essence, we use the aforementioned RADEX calculations for kinetic gas temperatures of 10 to 300 K to obtain functions that yield estimates of the kinetic gas temperature for given R321 or R422. The ratios range from 0 to values larger than 0.5 for this temperature range. The resulting function for R321 is almost identical to the one used by Ginsburg et al. (2016). This is in particular remarkable because Ginsburg et al. use large velocity gradient (LVG) calculations where we choose to adopt spherical model geometries. Here, we opt for the latter modeling geometry since it is close to the naive picture of a cloud with a well-defined boundary that is immersed in tenuous material. The comparison with the LVG case shows, however, that our analysis is robust with respect to the adopted modeling geometry.
4.2 Systematic Uncertainties
We assess the robustness of this method by repeating the line ratio calculations for different choices in gas properties. We vary the velocity dispersion between 2 and , increase and decrease in column density by a factor of 10, explore lower densities of , and examine the results for the slab and LVG models available within RADEX (Fig. 26a). This shows that, for a given line ratio, none of these modifications lead to temperatures that deviate by more than from the result obtained using our fiducial case (solid blue line in Fig. 26a). For reference, we note that spherical model geometries give the lowest temperatures, followed by slightly elevated values for LVG conditions. Slab geometries, however, give for a fixed line ratio temperatures that are up to 30% higher than those found for the fiducial case. Note in particular that these calculations explore the density range between 104 and 105 cm-3 that is suggested by the observations of dust emission discussed by Kauffmann et al. (subm.). Variations in density by a factor 10 have no significant impact on our results.
In the high column density Galactic center environment, the H2CO(320,2) emission might be optically thick. This saturation would cause a falsely high R321 line ratio in our integrated intensity ratio maps. A higher ratio implies higher temperatures. Thus, an optically thick H2CO(320,2) line would mimic higher gas temperatures in the clouds.
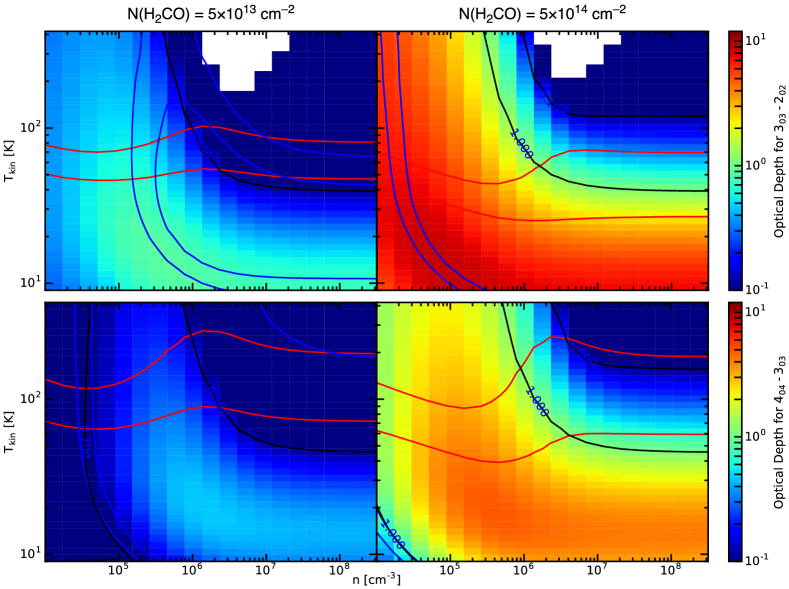
We have executed more detailed experiments for selected positions in order to understand the impact of the line optical depth. For example, we modeled the emission from the cloud in the velocity slice of 8 to (Fig. 27a, left panel). The 320,2 transition has a velocity–integrated peak intensity of (blue line in top panel of Fig. 27a). At this peak position the 430,3 transition has an integrated intensity of (blue line in bottom panel of Fig. 27a), while we find and (red line in top and bottom panel, respectively, of Fig. 27a). Further, the analysis of dust emission maps (Kauffmann et al., subm.) indicates H2 densities below 105 cm-3. This limits the parameter space explored in our radiative transfer experiments. In our modeling, we thus require that the model intensities match the observed ones for densities below . For these constraints we find that the data for the transitions near 218 GHz can only be matched if we increase the column density to a multiple of the fiducial value (Fig. 27a, right panel, for an increased column density of 51014 cm-2). The optical depth of the 320,2 line is larger than one under these conditions. One might think that the high optical depth leads to massive biases in temperature estimates. This is, however, not the case: given a fixed line ratio, conditions with high optical depth can imply temperatures lower by 30% for optical depths (i.e., our procedure, which assumes low optical depth, overestimates gas temperatures in regions of high optical depth).
4.3 Observational Uncertainties
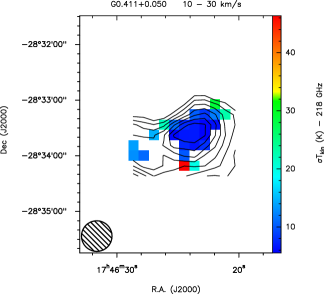
Further uncertainties in the temperature result from observational uncertainties in line ratios due to noise. To handle these uncertainties we first obtain two additional temperature estimates per map position. These two estimates are calculated for line ratios that are equal to the observed value plus or minus the observed uncertainty in the line ratio. Conceptually these values bracket the range of possible temperatures for a given map position. The difference between these values represents the change in kinetic gas temperatures when changing the line ratio by twice its uncertainty (i.e., from to , where and are the line ratio and its uncertainty). Half of this difference can thus be considered to represent the average temperature uncertainty associated with a line ratio uncertainty . In our analysis we thus calculate for every map position the temperatures corresponding to , and we report half of the difference between these temperatures as the observational uncertainty in kinetic gas temperatures. We are aware that the temperature uncertainties are asymmetric around the temperature value. However, we decided that the chosen method is the best way to present the uncertainties in the paper.
For some locations, the observations only yield upper limits to the line ratios. In such cases we take this upper limit to , we calculate the associated temperature, and we report this resulting value as an upper limit to the kinetic gas temperature.
5 Discussion
H2CO integrated intensity maps (from
left to right: H2CO(320,2), H2CO(322,0), H2CO(430,3), and
H2CO(432,1))
H2CO ratio (upper panels) and uncertainty maps (lower panels) (from left to right:
R321, R422, and R404).
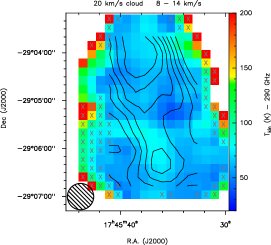
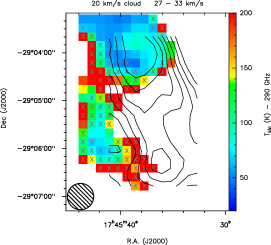
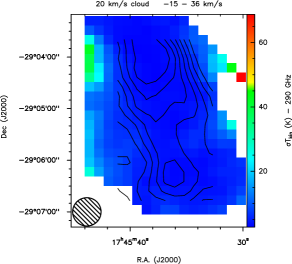
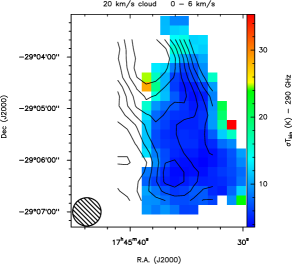
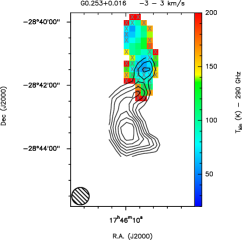
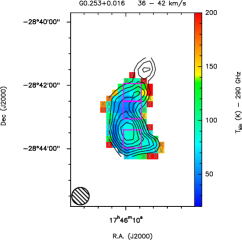
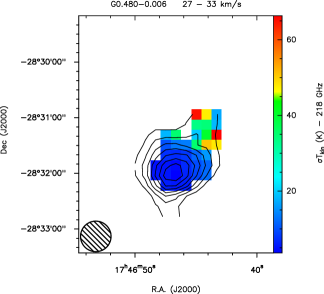
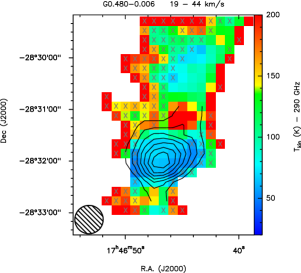
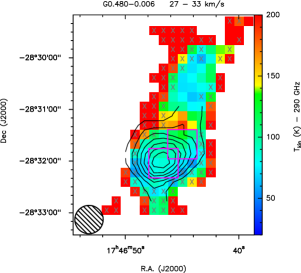
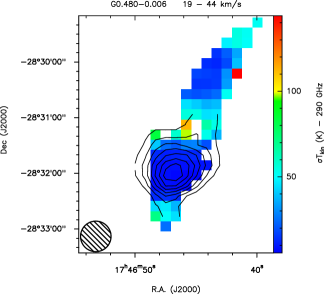
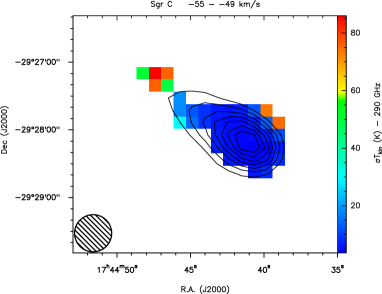
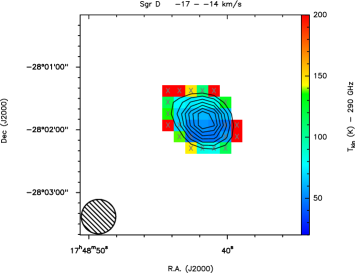
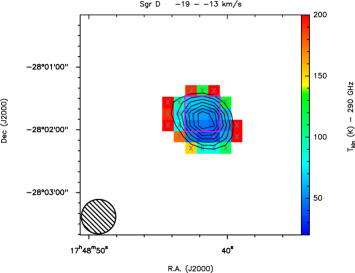
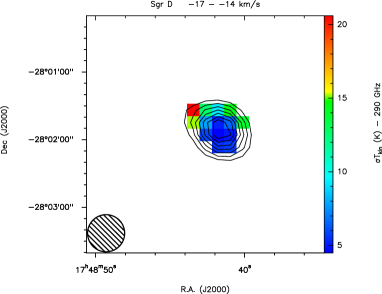
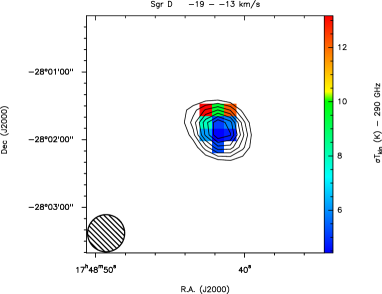
H2CO temperature (upper panels) and uncertainty maps (lower panels), derived from the 218 GHz (left panels) and 291 GHz data (right panels)
 (k)
(k)
 (l)
(l)
 (m)
(m)
 (n)
Spitzer/GLIMPSE RGB image (blue = 3.6 m, green = 4.5 m, and red = 8.0 m)
 (o)
(o)


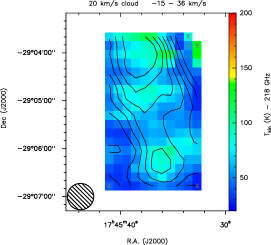
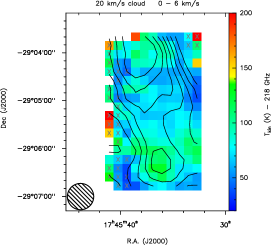
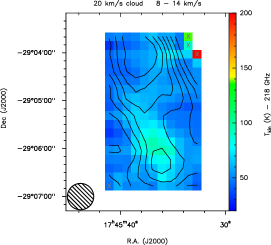
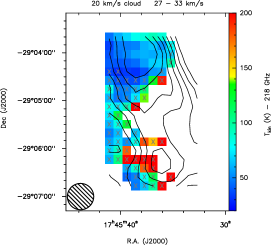
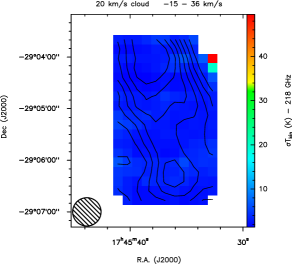
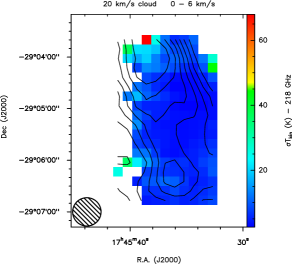
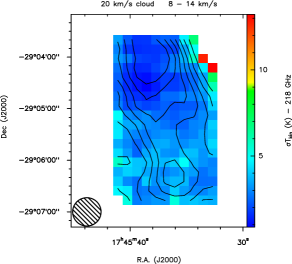
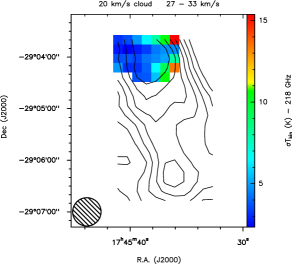
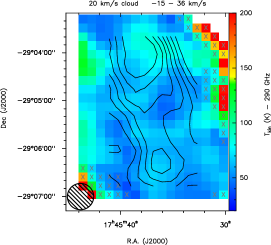
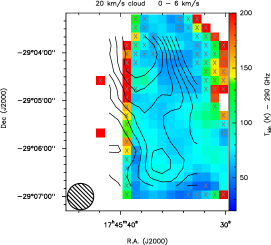
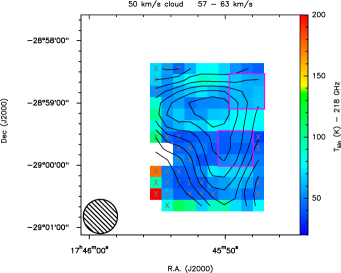
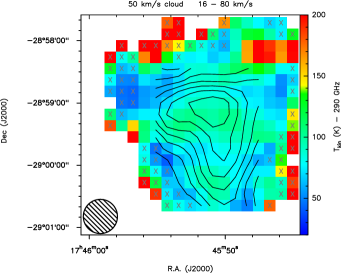
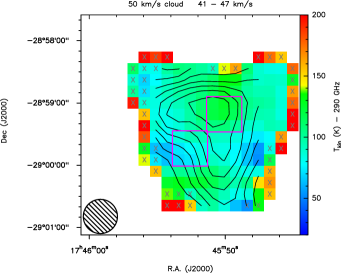
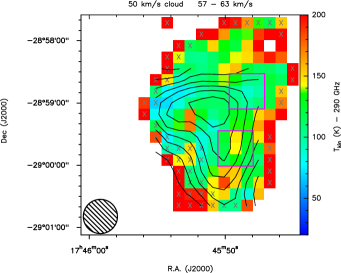
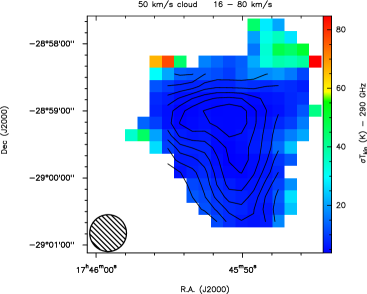
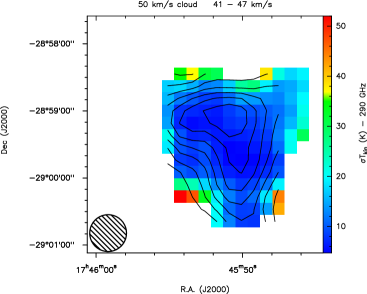
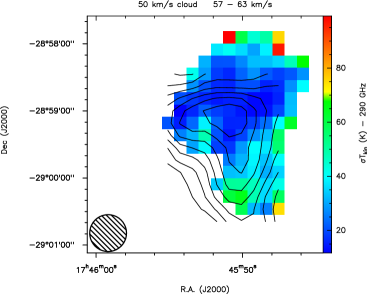
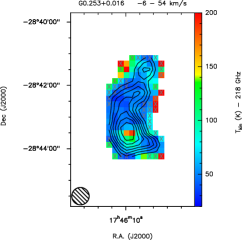
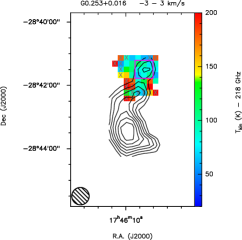
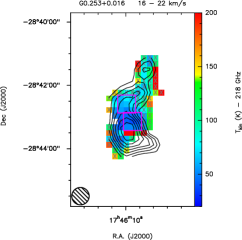
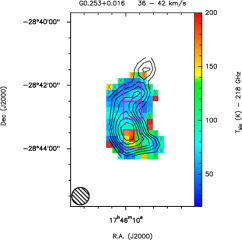
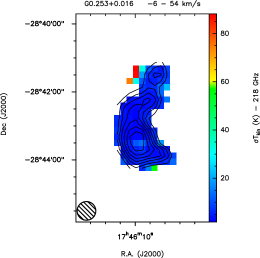
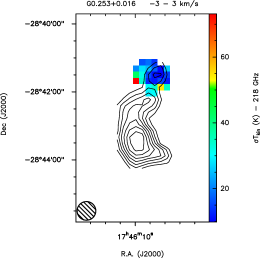
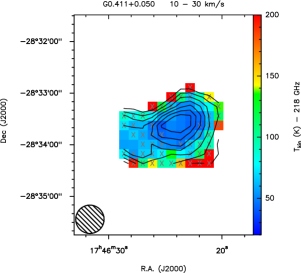
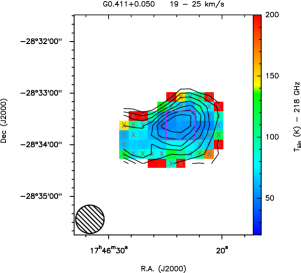
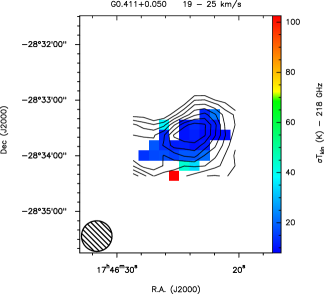
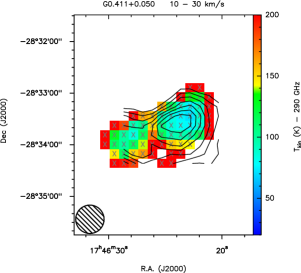
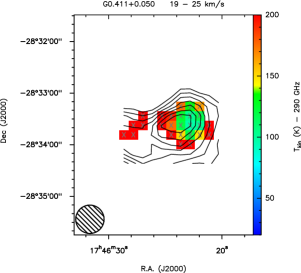
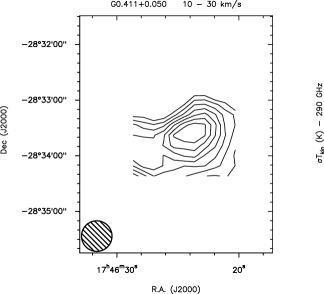
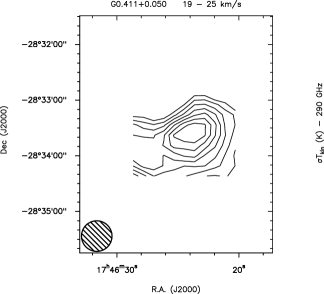
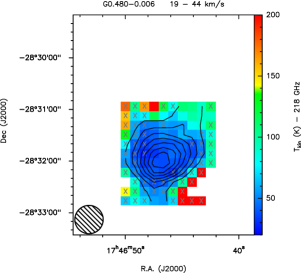
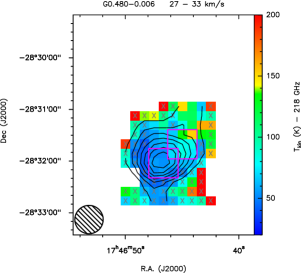
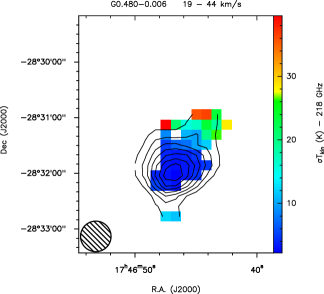
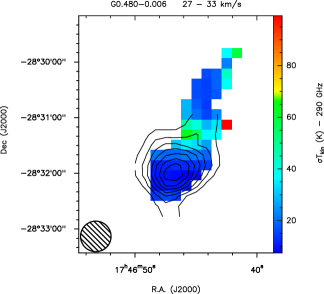
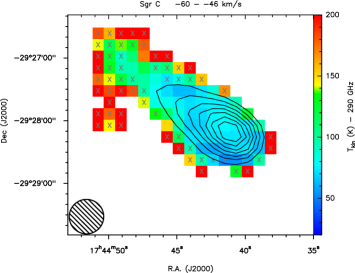
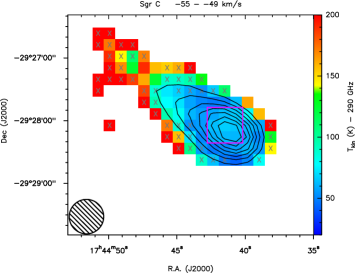
The temperature maps of all velocity components of all sources are shown in Figs. 28 34 in the Appendix. Upper limits in the temperature maps are marked again with Xs. The corresponding pixels in the uncertainty maps are blanked in white. The measured temperatures range between 28 and 242 K at 218 GHz and between 37 and 252 K at 291 GHz (excluding upper limit values of the temperature). This shows that the gas temperatures are everywhere in the clouds much higher than the dust temperatures that are measured towards these clouds (25 K, Molinari et al., 2011). However, temperatures above 150 K have to be considered as lower limits since the radiative transfer models start to diverge significantly at these temperatures and the para-H2CO line ratios are intrinsically insensitive to higher temperatures (Mangum & Wootten, 1993; Ginsburg et al., 2016).
We present the different plots we generated (integrated intensity maps, line ratio and uncertainty maps, temperature and uncertainty maps) for the 814 km s-1 component of the 20 km/s cloud in Fig. 4. In the last panel, we show a three-color image of Spitzer/GLIMPSE data (Churchwell et al., 2009, blue = 3.6 m, green = 4.5 m, red = 8.0 m) of this source.
5.1 Average Temperatures
| Source | Velocity Component | 218 GHz | 291 GHz | TGinsburg | ||||||
|---|---|---|---|---|---|---|---|---|---|---|
| TMin | TAverage | TMax | TMin | TAverage | TMax | |||||
| (km s-1) | (K) | (K) | (K) | (K) | (K) | (K) | (K) | (K) | (K) | |
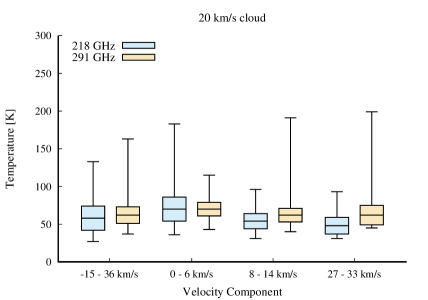
| 20 km/s cloud | 15 36 | 28 | 58 | 16 | 133 | 37 | 62 | 11 | 163 | 64 |
| 0 6 | 36 | 70 | 16 | 183 | 43 | 71 | 9 | 115 | ||
| 8 14 | 31 | 54 | 10 | 96 | 40 | 62 | 9 | 191 | ||
| 27 33 | 31 | 48 | 11 | 93 | 45 | 62 | 13 | 199 | ||
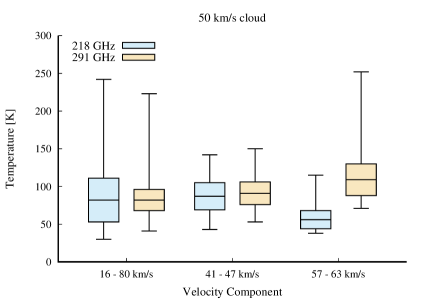
| 50 km/s cloud | 16 80 | 30 | 82 | 29 | 242 | 41 | 82 | 14 | 223 | 91 |
| 41 47 | 44 | 87 | 18 | 142 | 53 | 91 | 15 | 150 | ||
| 57 63 | 38 | 56 | 12 | 115 | 71 | 109 | 21 | 252 | ||
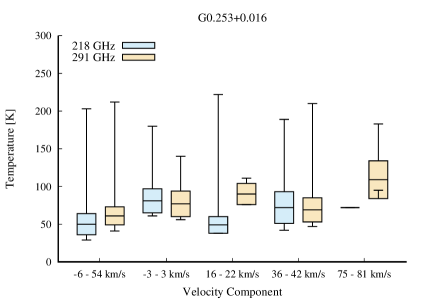
| G0.253+0.016 | 6 54 | 29 | 50 | 14 | 203 | 41 | 61 | 12 | 212 | 82 |
| 3 3 | 61 | 81 | 16 | 180 | 56 | 77 | 17 | 140 | ||
| 16 22 | 38 | 49 | 11 | 222 | 76 | 90 | 14 | 111 | ||
| 36 42 | 42 | 72 | 21 | 189 | 47 | 69 | 16 | 210 | ||
| 75 81 | 72 | 72 | 72 | 95 | 109 | 25 | 183 | |||
| G0.411+0.050 | 10 30 | 41 | 49 | 8 | 132 | 57 | ||||
| 19 25 | 49 | 59 | 11 | 197 | ||||||
| G0.4800.006 | 19 44 | 32 | 40 | 8 | 117 | 50 | 69 | 18 | 239 | 84 |
| 27 33 | 42 | 56 | 12 | 161 | 65 | 84 | 14 | 189 | ||
| Sgr C | 60 46 | 54 | 72 | 8 | 173 | 53 | ||||
| 55 49 | 43 | 59 | 7 | 191 | ||||||
| Sgr D | 17 14 | 47 | 56 | 8 | 80 | 52 | ||||
| 19 13 | 39 | 50 | 7 | 66 | ||||||
To estimate and compare the overall temperatures of the clouds, we determined the weighted average of the temperature in each cloud for each velocity component, first, derived from the 218 GHz lines and, second, from the 291 GHz ladder. The squared reciprocal of the temperature uncertainties served as the weights. In this calculation, temperature upper limits were not included. The results are listed in Table 5. In addition, we give the minimal and maximal temperature of each map in the table.
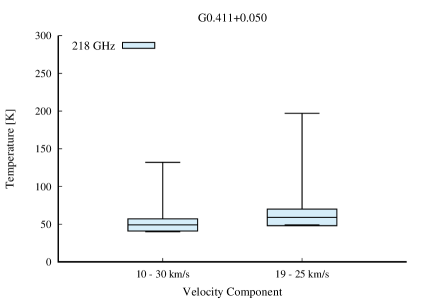
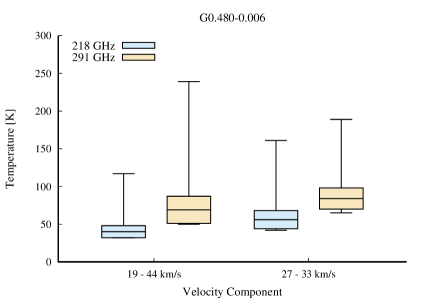
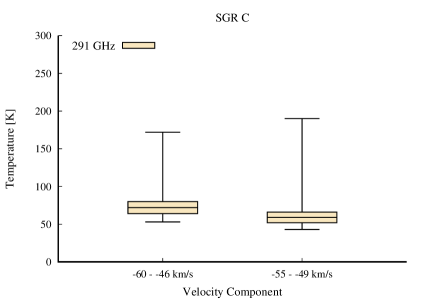
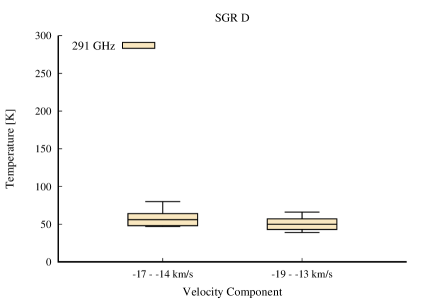
In most cases, the average temperature derived from the 291 GHz data is higher than the average temperature derived from the 218 GHz lines but the values agree within the 1 temperature uncertainty. In two cases, however, the temperature difference is rather large (50 km/s cloud: 5763 km s-1 component, G0.253+0.016: 1622 km s-1 component). In Fig. 35g in the Appendix, we visualize these results in temperature box plots.
To check the validity of our results, we compared our temperature measurements to the H2CO 218 GHz survey of Ginsburg et al. (2016). For each source, we averaged their temperature map (their Fig. 7c) over the sizes of our 218 GHz OTF maps (the 291 GHz OTF maps for Sgr C and Sgr D). The obtained values are shown in the last column of Table 5. These average temperatures are roughly consistent with our results except for G0.4800.006. Here, the average temperature of Ginsburg et al. (2016) is much higher than our values at 218 GHz. However, our 291 GHz measurements do show a high temperature component. We conclude that on average our study yields similar temperatures for the observed clouds as the survey of Ginsburg et al. (2016).
Comparing the average temperature of the whole velocity range of each source, we noticed a large spread of temperatures between 40 K in G0.4800.006 and 82 K in the 50 km/s cloud. There is no clear correlation of the average temperature with the location of the clouds in the CMZ.
5.2 Temperature Gradients within clouds
Table 5 shows that the average temperatures of the different velocity components in the sources are not the same. Differences of 30 K are observed. This indicates the presences of temperature gradients in the sources. These results show that averaging the temperatures over the whole velocity range of the clouds can yield misleading values of the temperature. It is thus important to look at the temperatures of the gas with different velocities to understand the underlying temperature structures of the clouds.
The 20 km/s cloud and G0.253+0.016 even show temperature gradients across the sources within one velocity component. In Fig. 4, the temperature map of the 814 km s-1 component of the 20 km/s cloud is plotted. There is a clear temperature gradient from 6070 K at the north-east side of the cloud to 110120 K in the southern part. A similar gradient is seen in the 3642 km s-1 component of G0.253+0.016 (Fig. 30, fourth panel), with the temperature increasing from 70 K in the north of the cloud to more than 150 K in the southern part.
In a forthcoming paper, we will compare the temperature structures of the clouds with tracers of shocks (e.g. observations of SiO, Class I methanol masers) or star formation (Class II methanol masers, water masers) to apprehend the cause for the different temperatures.
5.3 Evidence for heating by turbulence
To better understand the temperature structures in our clouds, we will investigate the energy balance in the gas following the analysis of Ginsburg et al. (2016). We will not consider stellar heating or energy injection through supernovae since these processes can only explain local heating of the clouds but not their overall high gas temperature. Ao et al. (2013) already excluded diffuse X-rays as the main heating source, leaving only cosmic ray and mechanical heating (turbulence) as the energetically important heating processes. Ginsburg et al. (2016) concluded that cosmic ray heating is either irrelevant in the CMZ or the heating is non-uniform since uniform heating cannot simultaneously explain the high (> 100 K) and low (< 50 K) temperatures measured in the CMZ. The detected temperature gradients in our clouds also exclude the latter except if the cosmic ray heating is non-uniform on very small scales (1 pc). We will produce similar gas temperature vs line width plots (as their Fig. 9) for the 218 and 291 GHz temperatures and compare our data to the same models as used in Ginsburg et al. (2016) to narrow down the parameter space of possible heating models.
To collect the data of these plots, we chose one or several positions in the 218 and 291 GHz temperature maps of the 6 km s-1 broad velocity components of each source where none of the pixels in a 33 x 33 tile (roughly corresponding to the size of the beam) around these positions are upper limits. The boxes are overlayed on the temperature maps in Figs. 28 34 in the Appendix. We then determined the weighted average temperature within these boxes, using the squared reciprocal of the temperature uncertainties as weights. Averaging the H2CO(320,2) spectra of the nine pixels in the boxes, we fitted the line with one or more velocity components depending on the source. We then assigned each average temperature value the line width of the corresponding velocity component. We excluded the 20 km/s cloud from this analysis because we could not fit the line width of the different components unambiguously. To make sure that any trend we see is real and not due to the radiative transfer modeling, we also obtained the average line ratios R321 and R422 in those tiles. The values for line ratio, temperature and line width are listed in Table 4. In Fig. 5b, we show the relation of line ratio (left panel) and temperature (middle panel), respectively versus line width.
Considering the statistical uncertainties associated with both parameters (20% for the line width, 30% for the temperature), we adopt the method of total least squares (Vanderplas et al., 2012) to measure the slope of the dv-Tkin relation. Since we are integrating the emission of the H2CO lines over a fixed velocity ranges, it is save to assume that the temperature and line width measurements are uncorrelated, so we set the covariance between them to be zero. Figure 5b shows a statistically significant positive correlation suggesting that regions of higher line widths in our clouds are expected to have higher gas temperature. This implies that turbulence might play a direct role in gas heating.


Figure 6 shows a collection of thermal equilibrium models computed using the DESPOTIC (Krumholz, 2014) code. Each model uses the heating terms specified in the legend and both line and dust cooling. The models compute the equilibrium temperature achieved at the specified density. The primary variable being varied is the line width, which is treated as an observational proxy for the 3D velocity dispersion following the equation . In contrast with Ginsburg et al. (2016), who observed a wider range in densities and environments, our data show a strong trend between the observed temperature and the velocity dispersion. They are readily explained by the n = 105 cm-3 model which assumes that each cloud has a line-of-sight length of 1 pc. These observations therefore significantly strengthen the case put forth by Ao et al. (2013) and Ginsburg et al. (2016) that the densest Galactic center clouds are predominantly heated by turbulence.

5.4 Density Constraints
Following Mangum & Wootten (1993), the integrated intensity ratio of H2CO J = 1 lines with different J, but the same Ka quantum numbers constrains the density of the gas. Figure 3b (right panel) shows that the R404 ratio depends strongly on both temperature and density for densities 107 cm-3 while the R321 ratio only depends on temperature (Fig. 3b, left panel). Thus, combining the measurements of the R321 and R422 ratios which yield the temperature with the R404 ratio we can estimate the density in the clouds. The red plus signs in Fig. 3b mark the locations where the R321 and R404 ratios are matched at the same time. Due to the significant dependence of the density estimate on the temperature estimate and our temperature uncertainties of 30%, we cannot compute density maps of our clouds. However, we constrain the density of the widespread warm gas in our clouds to 10106 cm-3. Efforts are ongoing to further constrain this range using the cm transitions of H2CO (Ginsburg et al. in prep).
6 Conclusion
In this paper, we present H2CO observations of five and seven CMZ clouds at 218 and 291 GHz, respectively. Combining integrated intensity H2CO line ratios with radiative transfer models, we obtain gas temperature maps for our clouds. The two different sets of H2CO lines (H2CO(32) at 218 GHz and H2CO(43) at 291 GHz) yield two independent estimates of the gas temperature.
Our observations at 218 GHz are a factor of 1.5 deeper than previous H2CO CMZ observations by Ginsburg et al. (2016, compare our median rms values of 45 mK per pixel to their noise level of 70 mK per pixel). While Ginsburg et al. focus on the global temperature differences in the CMZ, we disentangle the different velocity components of the gas in our sources and investigate their temperature structures. This is a significant step since the CMZ clouds exhibit the widest velocity components observed in our galaxy.
From a comparison of the H2CO main lines at 218 and 291 GHz, we accessed that the H2CO(320,2) line is optically thick in some parts of the clouds. Combining the observed line ratios R321 and R404, we constrain the density of the warm cloud gas to 10106 cm-3.
Our temperature maps at 218 and 291 GHz show clear temperature gradients in our clouds. This indicates that heating mechanisms that act on the bulk of the molecular gas cannot be the main heating sources. Cosmic ray heating is only possible if the heating is non-uniform on very small scales. In a following paper, we will compare our results with complementary observations of shock and star formation tracers as well as supernova remnants in the clouds to understand if these gradients are caused by local heating through cloud collisions, feedback from new born stars or the explosion of stars.
Comparing the line widths of the main H2CO lines at 218 and 291 GHz with the measured temperatures at selected positions in our clouds, we found a clear positive correlation between these two parameters. This indicates that turbulence plays an important role in the heating of the gas. Our data is consistent with a turbulence model with a density n = 105 cm-3 which assumes that each cloud has a line-of-sight length of 1 pc.
Acknowledgements.
We thank the APEX team and MPIfR observers for carrying out these service-mode observations. The authors are thankful for the helpful comments of the anonymous referee. T.P. acknowledges support from the Deutsche Forschungsgemeinschaft, DFG via the SPP (priority program) 1573 “Physics of the ISM”. This research has made use of NASA’s Astrophysics Data System Bibliographic Services.References
- Ao et al. (2013) Ao, Y., Henkel, C., Menten, K. M., et al. 2013, A&A, 550, A135
- Blum et al. (1999) Blum, R. D., Damineli, A., & Conti, P. S. 1999, AJ, 117, 1392
- Churchwell et al. (2009) Churchwell, E., Babler, B. L., Meade, M. R., et al. 2009, PASP, 121, 213
- Ginsburg et al. (2016) Ginsburg, A., Henkel, C., Ao, Y., et al. 2016, A&A, 586, A50
- Güsten et al. (2006) Güsten, R., Nyman, L. Å., Schilke, P., et al. 2006, Astronomy and Astrophysics, 454, L13
- Güsten et al. (1981) Güsten, R., Walmsley, C. M., & Pauls, T. 1981, Astronomy and Astrophysics, 103, 197
- Heyminck et al. (2006) Heyminck, S., Kasemann, C., Güsten, R., de Lange, G., & Graf, U. U. 2006, A&A, 454, L21
- Hüttemeister et al. (1993) Hüttemeister, S., Wilson, T. L., Bania, T. M., & Martin-Pintado, J. 1993, Astronomy and Astrophysics, 280, 255
- Immer et al. (2012) Immer, K., Schuller, F., Omont, A., & Menten, K. M. 2012, A&A, 537, A121
- Klein et al. (2012) Klein, B., Hochgürtel, S., Krämer, I., et al. 2012, A&A, 542, L3
- Klein et al. (2014) Klein, T., Ciechanowicz, M., Leinz, C., et al. 2014, IEEE Transactions on Terahertz Science and Technology, 4, 588
- Kruijssen & Longmore (2013) Kruijssen, J. M. D. & Longmore, S. N. 2013, MNRAS, 435, 2598
- Krumholz (2014) Krumholz, M. R. 2014, MNRAS, 437, 1662
- Lis et al. (1999) Lis, D. C., Li, Y., Dowell, C. D., & Menten, K. M. 1999, in ESA Special Publication, Vol. 427, The Universe as Seen by ISO, ed. P. Cox & M. Kessler, 627
- Longmore et al. (2013) Longmore, S. N., Bally, J., Testi, L., et al. 2013, MNRAS, 429, 987
- Mangum & Wootten (1993) Mangum, J. G. & Wootten, A. 1993, ApJS, 89, 123
- Mehringer et al. (1998) Mehringer, D. M., Goss, W. M., Lis, D. C., Palmer, P., & Menten, K. M. 1998, ApJ, 493, 274
- Mills & Morris (2013) Mills, E. A. C. & Morris, M. R. 2013, ApJ, 772, 105
- Molinari et al. (2011) Molinari, S., Bally, J., Noriega-Crespo, A., et al. 2011, ApJ, 735, L33
- Morris & Serabyn (1996) Morris, M. & Serabyn, E. 1996, Annual Review of Astron and Astrophys, 34, 645
- Ott et al. (2014) Ott, J., Weiß, A., Staveley-Smith, L., Henkel, C., & Meier, D. S. 2014, ApJ, 785, 55
- Pety (2005) Pety, J. 2005, in SF2A-2005: Semaine de l’Astrophysique Francaise, ed. F. Casoli, T. Contini, J. M. Hameury, & L. Pagani, 721
- Sawada et al. (2009) Sawada, M., Tsujimoto, M., Koyama, K., et al. 2009, PASJ, 61, S209
- Schöier et al. (2005) Schöier, F. L., van der Tak, F. F. S., van Dishoeck, E. F., & Black, J. H. 2005, A&A, 432, 369
- Schuller et al. (2009) Schuller, F., Menten, K. M., Contreras, Y., et al. 2009, Astronomy and Astrophysics, 504, 415
- Shirley (2015) Shirley, Y. L. 2015, PASP, 127, 299
- van der Tak et al. (2007) van der Tak, F. F. S., Black, J. H., Schöier, F. L., Jansen, D. J., & van Dishoeck, E. F. 2007, A&A, 468, 627
- Vanderplas et al. (2012) Vanderplas, J., Connolly, A., Ivezić, Ž., & Gray, A. 2012, in Conference on Intelligent Data Understanding (CIDU), 47 –54
- Vassilev et al. (2008) Vassilev, V., Meledin, D., Lapkin, I., et al. 2008, A&A, 490, 1157
- Wiesenfeld & Faure (2013) Wiesenfeld, L. & Faure, A. 2013, MNRAS, 432, 2573
- Yusef-Zadeh et al. (2009) Yusef-Zadeh, F., Hewitt, J. W., Arendt, R. G., et al. 2009, ApJ, 702, 178
Appendix A Calibration


Appendix B Spectra
20 km/s cloud
50 km/s cloud
G0.253+0.016


G0.411+0.050
G0.4800.006
Sgr C Sgr D


20 km/s cloud 50 km/s cloud


Appendix C Methanol contamination


Appendix D H2CO(320,2) spectra


Appendix E Integrated Intensity Maps
H2CO(320,2)
H2CO(322,0)
H2CO(430,3)
H2CO(432,1)


H2CO(320,2)
H2CO(322,0)
H2CO(430,3)
H2CO(432,1)


H2CO(320,2)
H2CO(322,0)
H2CO(430,3)
H2CO(432,1)


H2CO(320,2)
H2CO(322,0)
H2CO(430,3)
H2CO(432,1)


H2CO(320,2)
H2CO(322,0)
H2CO(430,3)
H2CO(432,1)


H2CO(430,3)
H2CO(432,1)


H2CO(430,3)
H2CO(432,1)


Appendix F Integrated Intensity Ratio and Uncertainty Maps
R321
R422


R404


R321
R422


R404


R321
R422


R404


R321
R422


R404


R321
R422


R404


R422


R422


Appendix G Modeling
Appendix H Temperature Maps
218 GHz temperatures
291 GHz temperatures
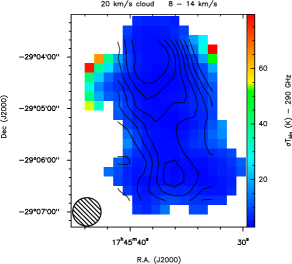
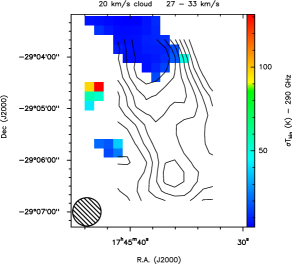
218 GHz temperatures
291 GHz temperatures
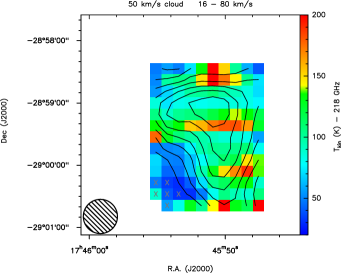
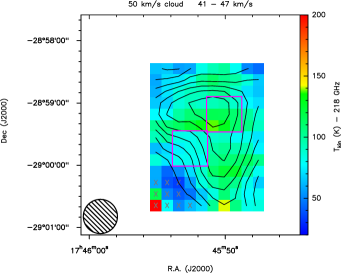
218 GHz temperatures
291 GHz temperatures
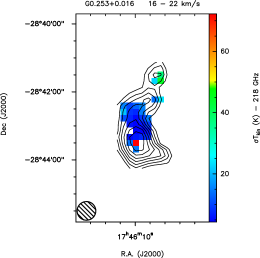
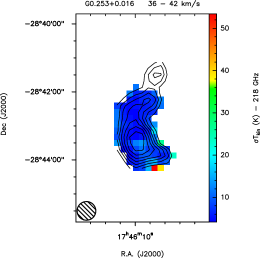
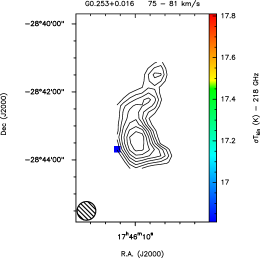
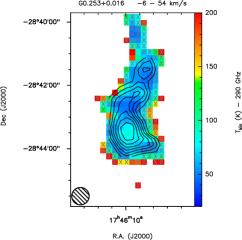
218 GHz temperatures
291 GHz temperatures
218 GHz temperatures
291 GHz temperatures
291 GHz temperatures
291 GHz temperatures
Appendix I Temperature vs Line width
| Source | Velocity Component | 218 GHz | 291 GHz | ||||
|---|---|---|---|---|---|---|---|
| R321,Average | TAverage | Line width | R422,Average | TAverage | Line width | ||
| (km s-1) | (K) | (km s-1) | (K) | (km s-1) | |||
| 50 km/s cloud | 41 47 | 0.409 | 104.9 | 24.6 | 0.464 | 113.4 | 20.9 |
| 0.346 | 82.0 | 26.4 | 0.38 | 82.5 | 23.1 | ||
| 57 63 | 0.279 | 61.7 | 10.1 | 0.440 | 103.2 | 20.5 | |
| 0.208 | 45.5 | 14.1 | 0.489 | 126.4 | 17.8 | ||
| G0.253+0.016 | 3 3 | 0.355 | 83.0 | 18.4 | |||
| 16 22 | 0.227 | 57.8 | 19.4 | ||||
| 0.198 | 43.7 | 11.6 | |||||
| 36 42 | 0.295 | 63.8 | 12.8 | 0.362 | 73.5 | 11.2 | |
| 0.458 | 67.4 | 11.7 | 0.264 | 53.5 | 10.6 | ||
| 0.460 | 131.6 | 19.2 | 0.392 | 87.1 | 17.9 | ||
| G0.411+0.050 | 19 25 | 0.255 | 55.6 | 7.3 | |||
| G0.4800.006 | 27 33 | 0.333 | 74.9 | 11.6 | 0.416 | 92.9 | 12.3 |
| 0.252 | 54.4 | 9.3 | 0.385 | 85.0 | 9.7 | ||
| Sgr C | 55 49 | 0.299 | 62.9 | 8.2 | |||
| Sgr D | 19 13 | 0.250 | 51.2 | 4.0 | |||