Double Beta Decays into Excited States in 110Pd and 102Pd
Abstract
A search for double beta decays of and into excited states of the daughter nuclides has been performed using three ultra-low background gamma-spectrometry measurements in the Felsenkeller laboratory, Germany, the HADES laboratory, Belgium and at the LNGS, Italy. The combined Bayesian analysis of the three measurements sets improved half-life limits for the and decay modes of the , and transitions in to yr, yr and yr respectively and in to yr, yr and yr respectively with 90 % credibility.
1 Introduction
The investigation of neutrinoless double beta () decay is a promising approach to search for physics beyond the Standard Model (SM). This second order weak nuclear decay requires lepton number violation which can in principle be generated by many new theories. As a consequence also the Majorana nature of the neutrino would be implied. The most intuitive mechanism to describe the decay is the exchange of a virtual light Majorana neutrino linking its mass () to the half-life () of the decay:
| (1) |
A phase space factor (PSF, ) and a nuclear matrix element (NME, ) are required for the conversion and both are strongly depending on the nuclide under study. While the calculation of the PSF is relatively straight forward [1], the calculation of the NME is subject to large theoretical uncertainties. Various nuclear models are applied for the calculations which currently disagree by around a factor of three [2] and are the largest uncertainty in constraining the effective Majorana neutrino mass with double beta decay experiments [3]. The nuclear model calculations might be improved by providing additional experimental information in the same nuclear systems. This is possible with the investigation of the SM allowed process of two neutrino double beta () decay which has been well observed in over 10 nuclides. In contrast to the mode, the partial half-life for the mode can be calculated directly via a PSF and NME:
| (2) |
Although the calculation of NMEs for the and modes are based on different nuclear levels in the intermediate nucleus and are numerically different, they can nevertheless be obtained in the same nuclear model framework. Experimental data on decay helps to verify the calculation of Eq. (2) in a given framework and thus creating confidence in the calculations for Eq. (1). In addition, free nuclear model parameters can be constrained [2]. For recent reviews see [4].
Apart from decays into the ground state (g.s.), double beta decays can also occur into the excited states of the daughter nucleus. These decay modes are expected to have a slower rate due to a smaller phase space but their experimental signature is enhanced by accompanying de-excitation -rays. Excited state transitions can in principle occur in the and the domain with difference only in the residual electron energy. The investigation of modes into excited states provides additional information on the nuclear structure and can over-constrain the system Eq. (1,2). So far only transitions to the first excited state have been observed, in [5, 6, 7, 8, 9] and in [10] with recent half-life values of yr [11] and yr [12], respectively. The half-life calculations of the ground state and excited state transitions in these nuclides based on the same nuclear model parameters are currently inconsistent by more than one order of magnitude [13].
The equivalent processes to double beta minus decay with the emission of two electrons could also occur on the right side of the mass parabola of even-even isobars. Three different decay modes are possible involving decay and electron capture (EC)
| (3) | |||||
| (4) | |||||
| (5) | |||||
| (6) |
Decay modes containing an EC emit X-rays or Auger electrons created by the atomic shell vacancy in the daughter nuclide. Decay modes containing a create two 511 keV annihilation -rays and have a reduced phase space by 1022 keV per .
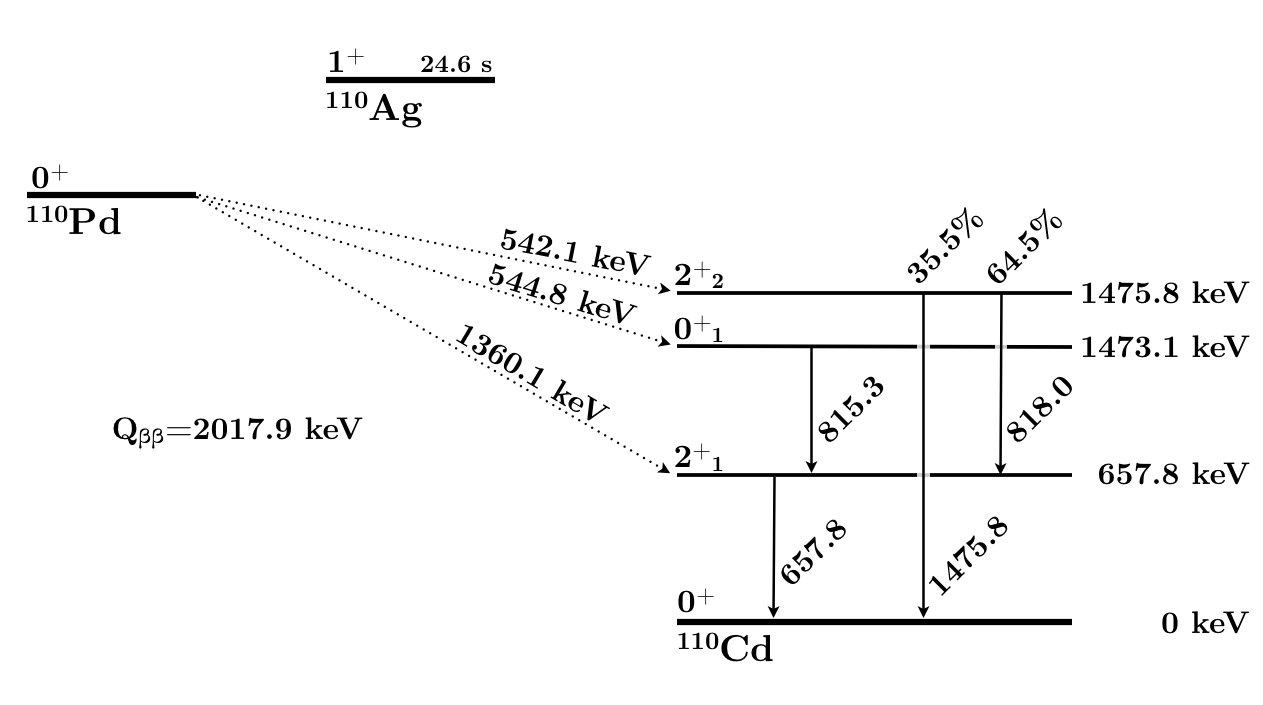
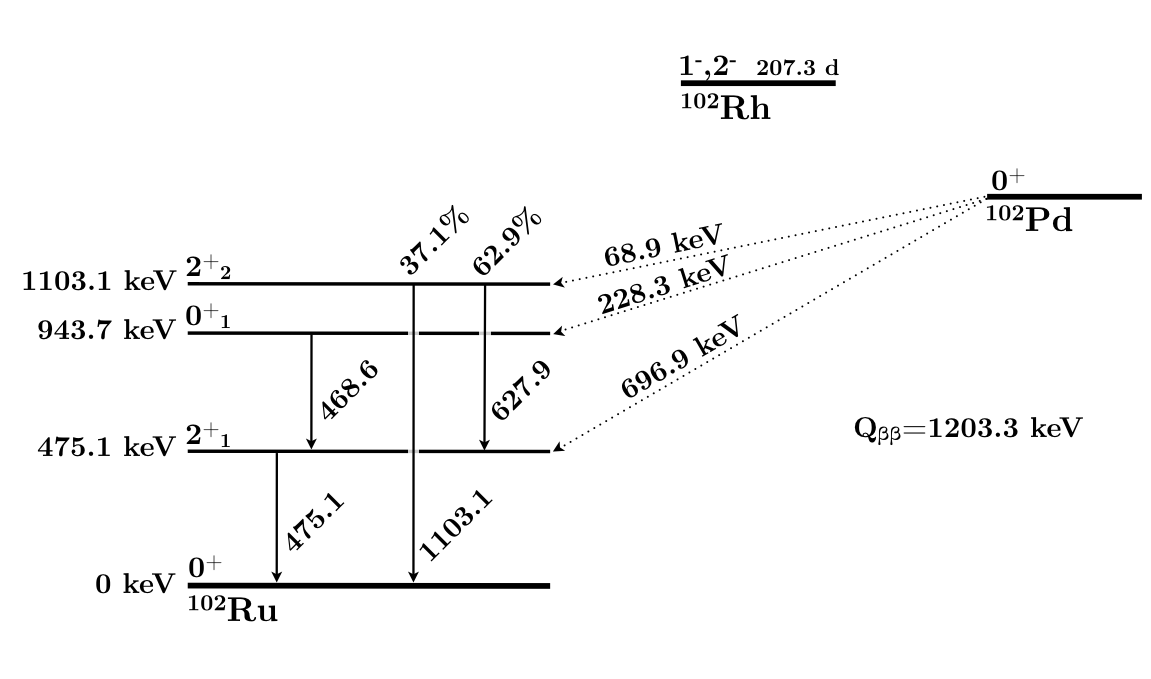
The element under study is palladium with the isotopes of interest and . The decay schemes including the investigated transitions are shown in Fig. 1 and Fig. 2, respectively. Among the 35 nuclides expected to undergo decay, has the second highest natural abundance with 11.72 %. Recently, the Q-value was remeasured to 2017.85(64) keV [15] and places among the 11 nuclides with a Q-value larger than 2 MeV. The second isotope has a Q-value of 1203.27(36) keV [16], a natural abundance of 1.02 % and is able to decay via and EC.
Three measurements of have been performed in the past, one in 1954 [17] and two more recently in 2011 in the Felsenkeller laboratory [18] and in 2013 in the HADES laboratory [19]. The latter two measurements were the first to investigate excited state transitions in palladium with gamma-spectrometry. The search described here is based on a combination of data from these previous measurements and data from a new measurement at the Laboratory Nazionali del Gran Sasso (LNGS). For excited state transitions exist many theoretical calculations to which the experimental limits can be compared. For the excited state transitions only experimental half-life limits are known and no theoretical calculation have been published up to date. The existing experimental and theoretical half-life limits are summarized in Tab. 1.
| decay | [yr] | model | ref. | year |
|---|---|---|---|---|
| (657.76 keV) | (95 % CL) | exp. | [18] | 2011 |
| (95 % CL) | exp. | [19] | 2013 | |
| SRPA | [20] | 1994 | ||
| SSD | [21] | 2005 | ||
| pnQRPA | [22] | 2007 | ||
| and a | pnQRPA | [23] | 2011 | |
| (1473.12 keV) | (95 % CL) | exp. | [18] | 2011 |
| (95 % CL) | exp. | [19] | 2013 | |
| SSD | [21] | 2005 | ||
| and a | pnQRPA | [23] | 2011 | |
| b | IBM-2 | [2] | 2015 | |
| (1475.80 keV) | (95 % CL) | exp. | [19] | 2013 |
| SSD | [21] | 2005 | ||
| and a | pnQRPA | [23] | 2011 | |
| (1731.33 keV) | (95 % CL) | exp. | [19] | 2013 |
| SSD | [21] | 2005 | ||
| (1783.48 keV) | (95 % CL) | exp. | [19] | 2013 |
| SSD | [21] | 2005 | ||
| (475.10 keV) | (95 % CL) | exp. | [18] | 2011 |
| (95 % CL) | exp. | [19] | 2013 | |
| (943.69 keV) | (95 % CL) | exp. | [18] | 2011 |
| (95 % CL) | exp. | [19] | 2013 | |
| (1103.05 keV) | (95 % CL) | exp. | [19] | 2013 |
2 Palladium Sample
The sample consists of 802.4 g of irregularly shaped mm x 1 cm2 palladium plates.
Prior to any of the measurements, the sample was purified by C. HAFNER GmbH + Co. KG in 2010 to a certified purity of % which lowered the continuous background in the peak regions by approximately 20 % [18]. In order to avoid radionuclides produced by cosmic ray spallation, the palladium was kept underground apart from weeks during purification in 2010, weeks for surface transport in fall 2011, and days transport in spring 2012 of which 3 hours were done by airplane.
For the measurements at the Felsenkeller and in HADES the palladium was placed in a single container of polystyrene with 70 mm diameter and 21 mm height. The effective density is calculated as 10.2 g/cm3 compared to the bulk density of palladium of 12.02 g/cm3.
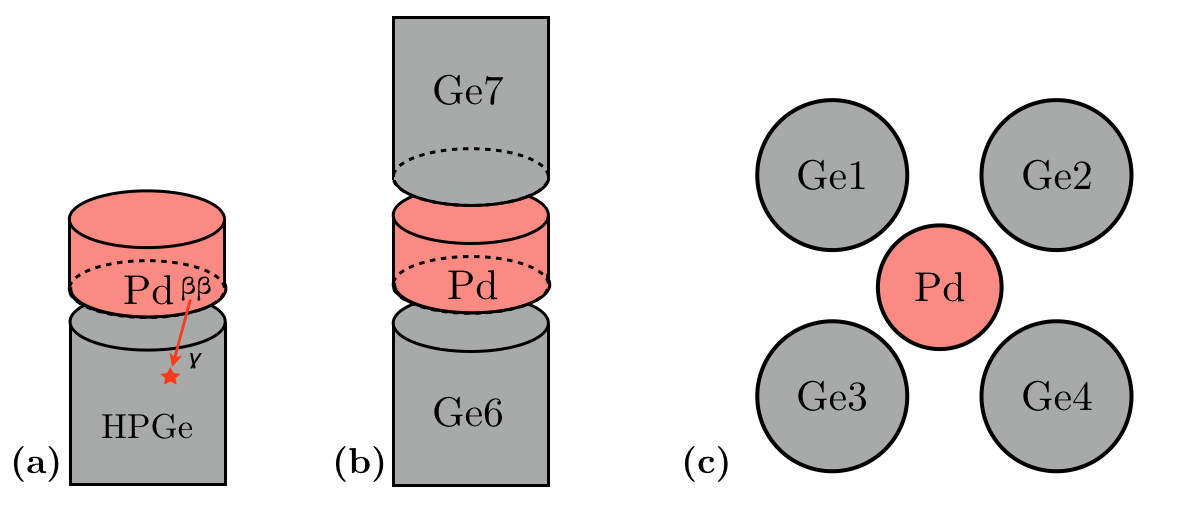
For the measurement at LNGS the plates were placed inside two measuring containers of 55 mm diameter and 30 mm height which were piled on top of each other. The effective density is calculated as 7.59 g/cm3. A picture of the palladium sample is shown in Fig. 3 before purification (a), as used for the Felsenkeller and HADES measurements (b) and as used for the LNGS measurement (c).

The radioactive impurity of the palladium sample was assessed during the gamma-spectrometry measurement in HADES and positive evidence for and was found with around 2 mBq/kg activity [19]. This indicates the presence of in either the sample (most likely) or the container. Additionally, a potential contamination of the following radionuclides was investigated: (= 207.3 d), (= 3.742 yr) and (= 249.76 d). The reason is the possible interference with the search for and decays, because of the emission of -rays from the same excited daughter states. The investigation was performed with additional -lines of these decays which are not part of the experimental signal of the double beta decay transitions due to the larger Q-value of the beta decay and the additional EC. No presence of these radionuclides was found.
3 Experimental Setup and Datasets
The data used in this work comprises of three datasets obtained with three different ultra-low background gamma-spectrometry setups which are illustrated in Fig. 4.
3.1 Felsenkeller Dataset
The measurement was performed in the Felsenkeller underground laboratory in Dresden, Germany, with a shielding of 110 m.w.e. rock overburden reducing the muon flux by about a factor of 20 to cm-2s-1 [25, 26]. The palladium sample was measured for 16.2 days (13.0 kgd exposure) with a 90 % efficiency HPGe detector routinely used for gamma-spectrometry [27]. The detector is surrounded by a 5 cm copper shielding embedded in another shielding of 15 cm of low activity lead. The inner 5 cm of the lead shielding has a specific activity of Bq/kg 210Pb while the outer 10 cm has Bq/kg. The spectrometer is located in a measuring chamber which is an additional shielding against radiation from the ambient rock. Furthermore, the detector is constantly held in a nitrogen atmosphere to avoid radon. The data is collected with a 8192 channel MCA from ORTEC recording energies up to 2.8 MeV. The full energy peak detection efficiencies are determined with MaGe [28], a software framework based on Geant4 which was specifically developed for MC simulation of low energy interactions. The simulations are cross checked with an analytically pure SiO2 calibration standard which was measured in the same geometry as the palladium sample. More details can be found in [18, 29].
3.2 HADES Dataset
The measurement was performed in the HADES underground laboratory [30] on the premises of the Belgian Nuclear Research Center SCKCEN in Mol, Belgium. The HADES laboratory has an overburden of 500 m.w.e. reducing the muon flux by about a factor of 5000. The palladium sample was measured for 44.8 days (35.9 kgd exposure) with a two-detector sandwich setup as illustrated in Fig. 4 (b). The bottom detector (Ge6) is a p-type HPGe in a copper cryostat with a relative efficiency of 80 %. The top detector (Ge7) is a n-type HPGe in an aluminium cryostat with a relative efficiency of 90 %. The detectors are surrounded by a shielding consisting of an outer layer of 14.5 cm 18 Bq/kg () lead, an intermediate layer of 4.0 cm 2.4 Bq/kg () low activity lead and an inner layer of 3.5 cm electrolytic copper with less than 9 Bq/kg and less than 20 Bq/kg [31]. The data is collected with a standard GENIE DAQ system in histogram mode for each HPGe detector independently. An additional custom made list-mode DAQ which also records the detector coincidence and a muon veto signal was not fully operational during the data taking. The full energy peak detection efficiencies in the setup were determined with the EGS4 software [19, 32].
3.3 LNGS Dataset
The measurement was performed at the LNGS of INFN in L’Aquila, Italy with an overburden of 3500 m.w.e. reducing the muon flux by about 6 orders of magnitude.
The palladium sample was measured for 87.2 d (70.0 exposure) with a setup of four similar sized HPGe detectors as illustrated in Fig. 4 (c) with 55 to 57 % relative efficiency. The detectors of cm3 each are installed inside a single cryostat with the endcap facing upwards. The palladium sample is arranged in the central well facing the lateral sides of the detectors. The whole setup is enclosed in a passive shielding made of 25 cm low-radioactivity lead as an outer layer and 5 cm low-radioactivity copper as an inner layer. In addition the setup is ventilated with nitrogen to remove radon.
The full energy -ray detection efficiency of the system is determined with MC simulations based on MaGe [28]. A validation of the simulation has been performed e.g. in [33] and references therein. The data acquisition consists of a four channel ADC system from XIA Inc. (Pixie-4), recording the energy of each detector and the time of the event in list mode if a trigger is give by any detector.
A feasibility study of a coincidence analysis using multi-detector events to tag the -ray cascade
showed a significantly lower sensitivity for coincidence events compared to the single detector events considering each detector individually. For the decay mode, the efficiency to fully detect the 657.8 keV or the 815.3 keV -ray in one detector and triggering one other detector as well is 0.42 %. This can be compared to the efficiency of 2.64 % and 2.30 % to detect these -rays in any single detector without triggering another one. The reason is the large self absorption in the sample in combination with the unfavorable geometrical configuration of the source facing the lateral sides of the detectors. This is creating additional attenuation in the crystal holders and is reducing the detection efficiency of -ray cascades in multiple detectors. Thus, for this analysis only an anti-coincidence cut was applied between the detectors which reduces the environmental background more than it reduces the detection efficiency.
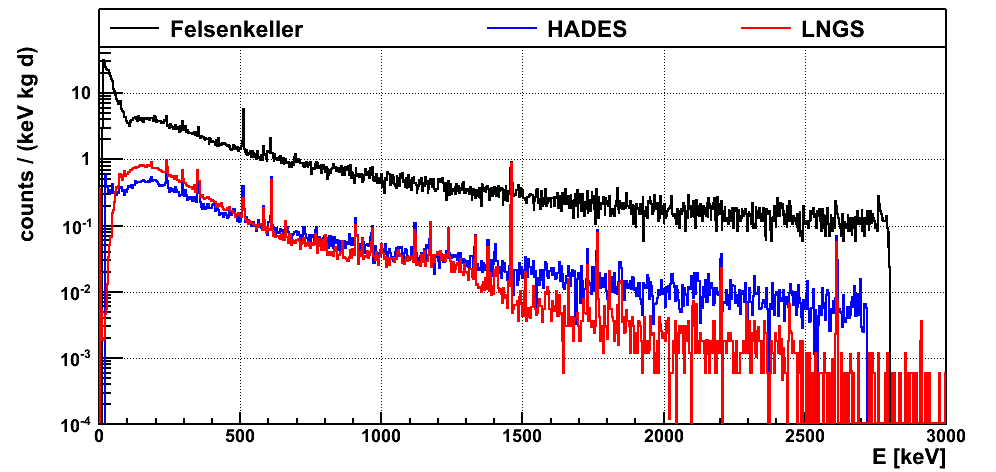
A comparison of the key parameters of each measurement is shown in Tab. 2. The sample spectrum of each measurement is shown in Fig. 5 normalized to keV, day and kg detector mass. For the HADES and LNGS measurements the combined sum spectra of the detectors are shown. The continuous component in the spectrum, which is produced by muons and neutrons, is about an order of magnitude larger in the Felsenkeller than in HADES due to the smaller overburden. The continous component is further reduced in the LNGS spectrum which lowers the background above the peak at 1460.8 keV. The relative background per detector mass and time in the regions of interest for the de-excitation -rays of and is slightly smaller in the LNGS setup compared to the HADES setup. The absolute background in the setup per time is comparable due to the larger amount of detectors. However, due to the unfavorable source-detector geometry, the larger number of detectors does not increase the detection efficiency compared to the HADES setup and thus makes not use of the lower background environment. For this reason the expected sensitivity of the LNGS measurement is comparable with the one from the HADES measurement and all datasets are combined for improved sensitivity. The radioactivity from the sample itself is subdominant in the overall background for all measurements.
| location | overburden | time | bg | gamma-spectrometry setup | |
|---|---|---|---|---|---|
| [m] / [m.w.e.] | [d] | [cts/keV/d] | [%] | ||
| Felsenkeller | 47 / 110 | 16.2 | 1.81 | 3.06 | single HPGe |
| HADES | 223 / 500 | 44.8 | 0.28 | 4.70 | two HPGe sandwich |
| LNGS | 1400 / 3500 | 87.2 | 0.30 | 2.57 | four HPGe setup |
4 Analysis
The analysis is performed on the three datasets (Felsenkeller, HADES and LNGS). Each de-excitation -line in a given decay mode has its own fit region of keV around the -line. An exception is the mode in which the two de-excitation -lines of 468.6 keV and 475.1 keV are combined into a single fit region. Thus the , and transitions have , and fit regions in each dataset, respectively. The , and transitions have , and fit regions, respectively. The signal count expectation of each -line in each dataset depends on the half-life of the decay mode as
| (7) |
where is the full energy detection efficiency of -line in dataset , is the Avogadro constant, is the live-time of the dataset, is the mass of the palladium sample, the molar mass and is the isotopic natural abundance of and , respectively. The data is binned with 0.68 keV, 0.5 keV, 1.0 keV wide bins for the Felsenkeller, HADES and LNGS datasets respectively. The Bayesian Analysis Toolkit (BAT) [34] is used to perform a maximum posterior fit combining all three datasets and -lines for a given decay mode. The likelihood is defined as the product of the Poisson probabilities of each bin in fit region in every dataset
| (8) |
where n denotes the data and p the set of floating parameters. is the measured number of counts and is the expected number of counts in bin . is taken as the integral of the extended p.d.f. in this bin. The counts in the fit region are expected from three different types of contributions which are used to construct : (1) A linear background, (2) the Gaussian signal peak and (3) a number of Gaussian background peaks. The number and type of background peaks depend on the fit region and will be described later. The full expression of is written as:
The first line is describing the linear background with the two parameters and .
The second line is describing the signal peak with the energy resolution and the -line energy .
The third line is describing the background peaks in fit region with the strength of the peak and the peak position . The same p.d.f. with different parameter values is used for all three datasets. Hence, the same number of background peaks is used in every dataset even if not all background peaks are prominent in every datasets.
The free parameters in the fit are:
-
•
1 inverse half-life with flat prior
-
•
2 x x linear background parameters and with flat priors
-
•
x energy resolutions with Gaussian priors
-
•
x detection efficiencies with Gaussian priors
-
•
signal peak positions with Gaussian priors
-
•
x x background peak strength with flat priors
-
•
x background peak positions with Gaussian priors
In total this amounts to 30 fit parameters for the mode, 59 parameters for the mode and 76 parameters for the mode of and 18 parameters for the mode, 25 parameters for the mode and 52 parameters for the mode of .
The energy resolutions are determined with calibration spectra for each dataset independently. The mean of the Gaussian priors is taken from these calibrations and reported in Tab. 4 in the appendix. The width of these priors is taken as the uncertainty of the resolution calibration curve and approximated with 5 % for all datasets and -lines.
The detection efficiencies are determined with MC simulations for each dataset and transition independently.
The mean value of the Gaussian prior is reported in Tab. 5 in the appendix.
For the HADES dataset the efficiencies are taken from [19]. For the Felsenkeller dataset the efficiencies are reevaluated compared to [18] to include the transitions.
The uncertainty of the detection efficiencies is approximated with 10 % for each dataset and -line and used for the width of the prior. The mean values and uncertainties of the signal and background peak positions are taken from nuclear data sheets [14].
The posterior probability is calculated from the likelihood and prior probabilities with BAT. The maximum of the posterior probability is the best fit. The marginalized posterior probability distribution of is extracted and the 90 % quantile of this distribution is used for setting a 90 % credibility limit on the half-life. Systematic uncertainties are included via the distribution of the priors. The influence of the systematic uncertainties on the half-life is % which is evaluated by fixing all Gaussian priors to their mean value and repeating the analysis.
5 Results
The analysis of each decay mode is discussed for and . No signal is observed for either decay mode or nuclide and half-life limits are extracted.
5.1 Decay Mode
The fit region of keV is centered around the single -line of 657.8 keV and illustrated in Fig. 6 for all three datasets.
Three known background -lines from decay chain nuclides are included in the fit coming from at 649.6 keV (3.4 %), at 665.5 keV (1.5 %) and from at 674.8 keV (2.1 %), where the value in parentheses is the emission probability of this -ray. Additionally, at 661.7 keV (85.1 %) is included in the fit as an anthropogenic background. This contamination can be clearly seen in the HADES and LNGS datasets. In comparison, the background peaks in the Felsenkeller dataset are not significant. Here, the background is dominated by atmospheric muons due to the smaller overburden.

The best fit is shown as the blue p.d.f. in Fig. 6. The signal peak according to the 90 % C.I. is shown as the red p.d.f. The best fit yields zero expected events from the signal process. The obtained 90 % quantile of the posterior translates into a half-life limit for the decay mode of
| (10) |
5.2 Decay Mode
For this decay mode two fit regions are selected. The first is the same as for the transition and the second is centered around the de-excitation -line of 815.3 keV. The fit regions are shown in Fig. 7.
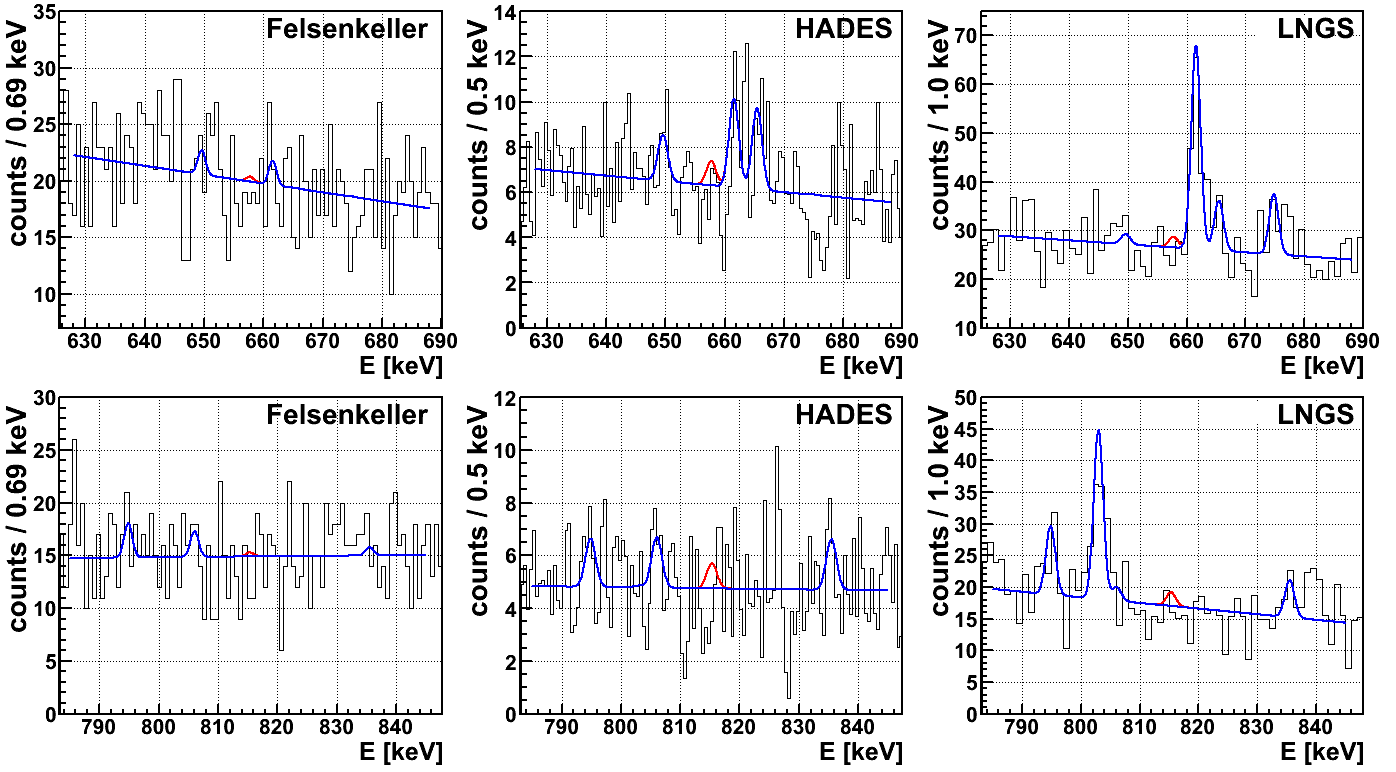
Three known background -lines are included in the second fit region coming from at 795.0 keV (4.3 %) and at 835.7 keV (1.6 %) and from at 806.1 keV (1.3 %).
Another prominent -line is visible in the LNGS dataset at 803.1 keV which is potentially coming from the first excited state in after excitation with elastic neutron scattering (,). It is included in the fit as a background -line.
Yet another potential -line can be seen at 826.5 keV in the HADES dataset. This -line could not be identified and is therefore not included as a background. However, including this -line in a test fit changes the combined half-life limit by only 2.2 % compared to not including it in the fit.
The final half-life limit for the decay mode is
| (11) |
5.3 Decay Mode
This decay mode has two decay branches, one with a single -ray emission (35.5 %) and one with two coincident -rays (64.5 %).
In total three fit regions are selected. The first is the same as for the transition. The second region is centered around the 818.0 keV -line and the third region is centered around the 1475.8 keV -line. All fit regions are shown in Fig. 8.
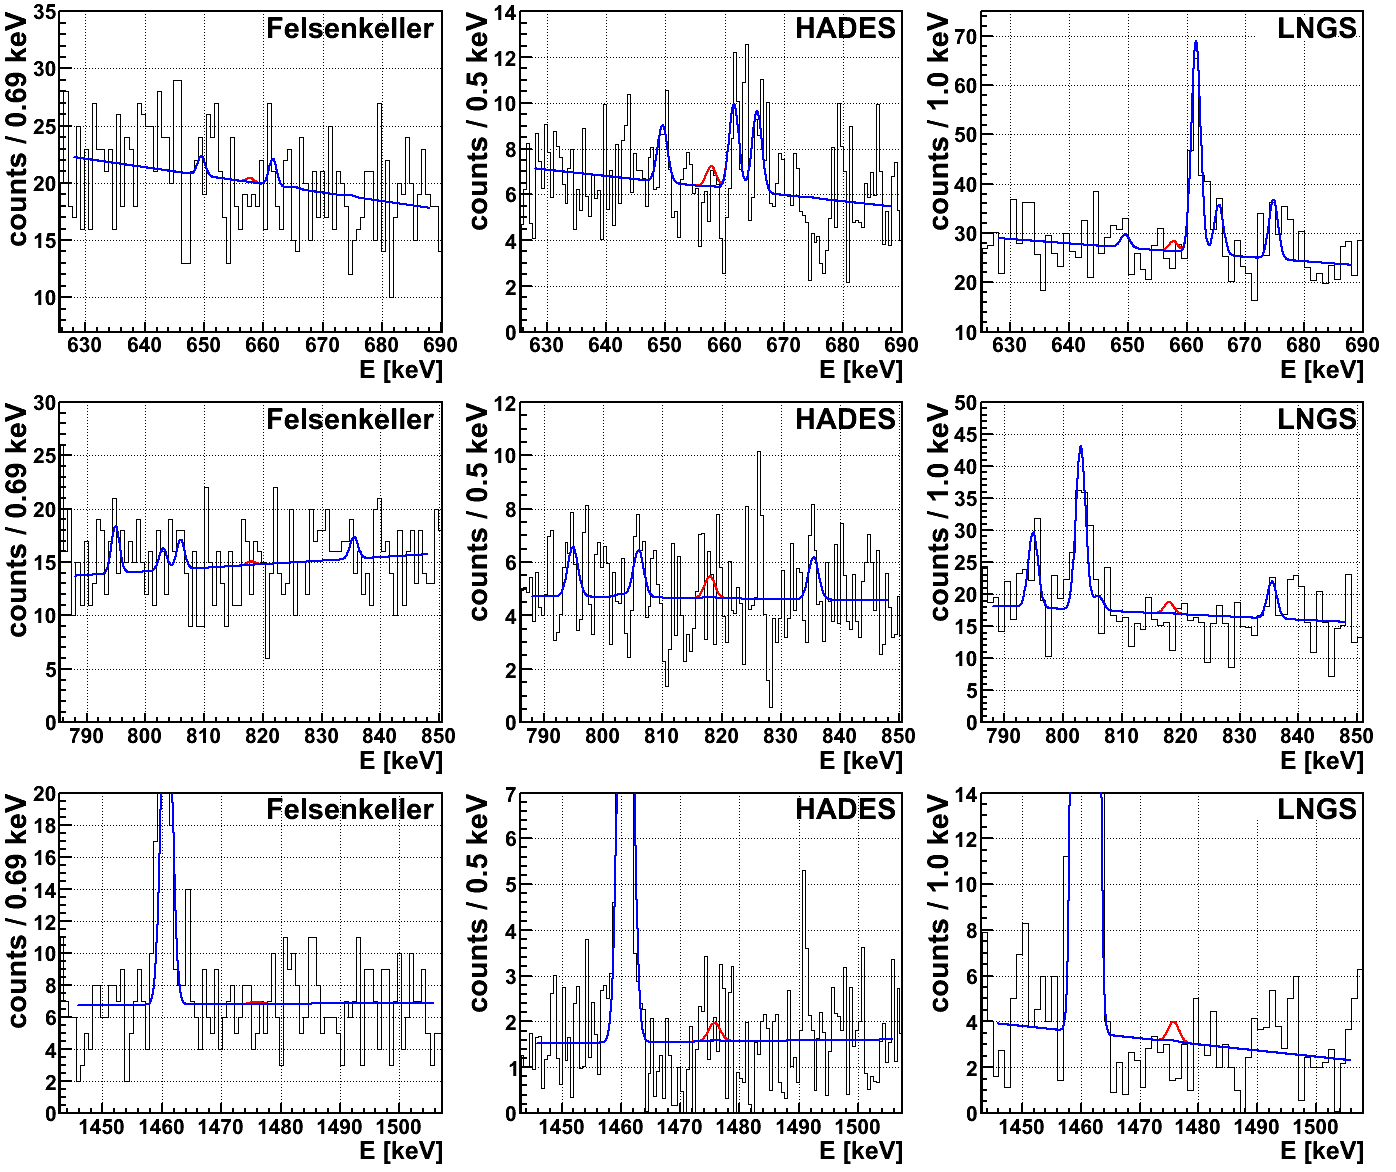
In the first and second fit region the background -lines are included as described in the other transitions above. In the third fit region the -line at 1460.83 keV (10.7 %) is the most prominent feature in all datasets and is included in the fit. Another potential -line at 1490.7 keV can be seen in the HADES dataset with 1.8 significance. Some indication can also be seen in the LNGS dataset with 1.3 . This potential -line, however, could not be identified and is therefore not included in the fit. The difference in the half-life limit between including and not including the potential -lines at 826.5 keV and 1490.7 keV is 3 % and thus not very strong.
The final half-life for the decay mode is
| (12) |
5.4 Decay Mode
The single fit region of the transition is centered 30 keV around the 475.1 keV de-excitation -ray energy and is shown in Fig. 9.

The background -line at 463.0 keV (4.4 %) is included in the fit. Some potential peak structures can be seen in the HADES spectrum close to or directly underneath the signal peak. They cannot be clearly identified and appear to be at keV and keV. A search for radionuclides with -ray emission at those energies as well as a search for potential -ray summation or escape effects remained inconclusive.
The peak structures are only visible in the bottom detector Ge6 with copper endcap and 0.9 mm dead layer. The top detector Ge7 with Al endcap and 0.3 micron dead layer, does not show these features. They are also not visible in the background spectrum of the setup. Hence, those -line features are either a background fluctuation in Ge6 alone or an unknown irreducible background contribution. In both cases they cannot be included in the fit.
Performing the fit on all three datasets results in a best fit and limit as shown in Fig. 9. The best fit finds a half-life of yr which includes the no signal case in the smallest connected 98.4 % or 2.41 interval. The significance of the signal peak is almost entirely due to the background features in the HADES dataset. Performing the same fit only on the Felsenkeller and LNGS datasets results in a best fit consistent with zero at the 0.77 level. The 90 % C.I. lower limit with the HADES dataset is yr compared to yr without the HADES dataset. With the HADES dataset the limit is reduced due to the upwards fluctuations of background in the peak region whereas without the HADES dataset the sensitivity is smaller.
For the final limit of the transition the HADES dataset is included due to the larger sensitivity. The limit is set to
| (13) |
5.5 Decay Mode
This decay mode has two coincident -ray emissions at 475.1 keV and 468.6 keV which are analyzed in a single fit region identical to the one for the transition above. This is the only decay mode with two signal peaks in the same fit region which adds another signal term to the p.d.f. in Eq. 4. The fit is shown in Fig. 10 using the same background -line from at 463.0 keV as before.

Also in this case the unidentified peak features are present and are treated in the same way as above. In addition there is a small upwards fluctuation underneath the 468.6 keV signal peak in the HADES dataset as well. Also this fluctuation is only visible in one of the HADES detectors and is thus treated as a background fluctuation. With the HADES dataset the smallest interval containing the no signal case is 98.7 % or 2.49 . Excluding the HADES dataset results in a 0.1 difference to the no signal case. The difference in half-life limit is yr including HADES and yr excluding HADES.
The final limit for the transition is taken as the one with the HADES dataset and set to
| (14) |
5.6 Decay Mode
This decay mode has two decay branches with a coincident double -ray emission of 475.1 keV and 627.9 keV (62.9 %) and a single -ray emission of 1103.1 keV (37.1 %). The first fit region is identical to the one in the transition. The second fit region is centered around the 627.9 keV -line and includes the background -line at 609.3 keV (45.5 %). The third fit region is centered around the 1103.1 keV -line and includes the background -line at 1120.3 keV (14.9 %). All three regions including the fit are shown in Fig. 11.
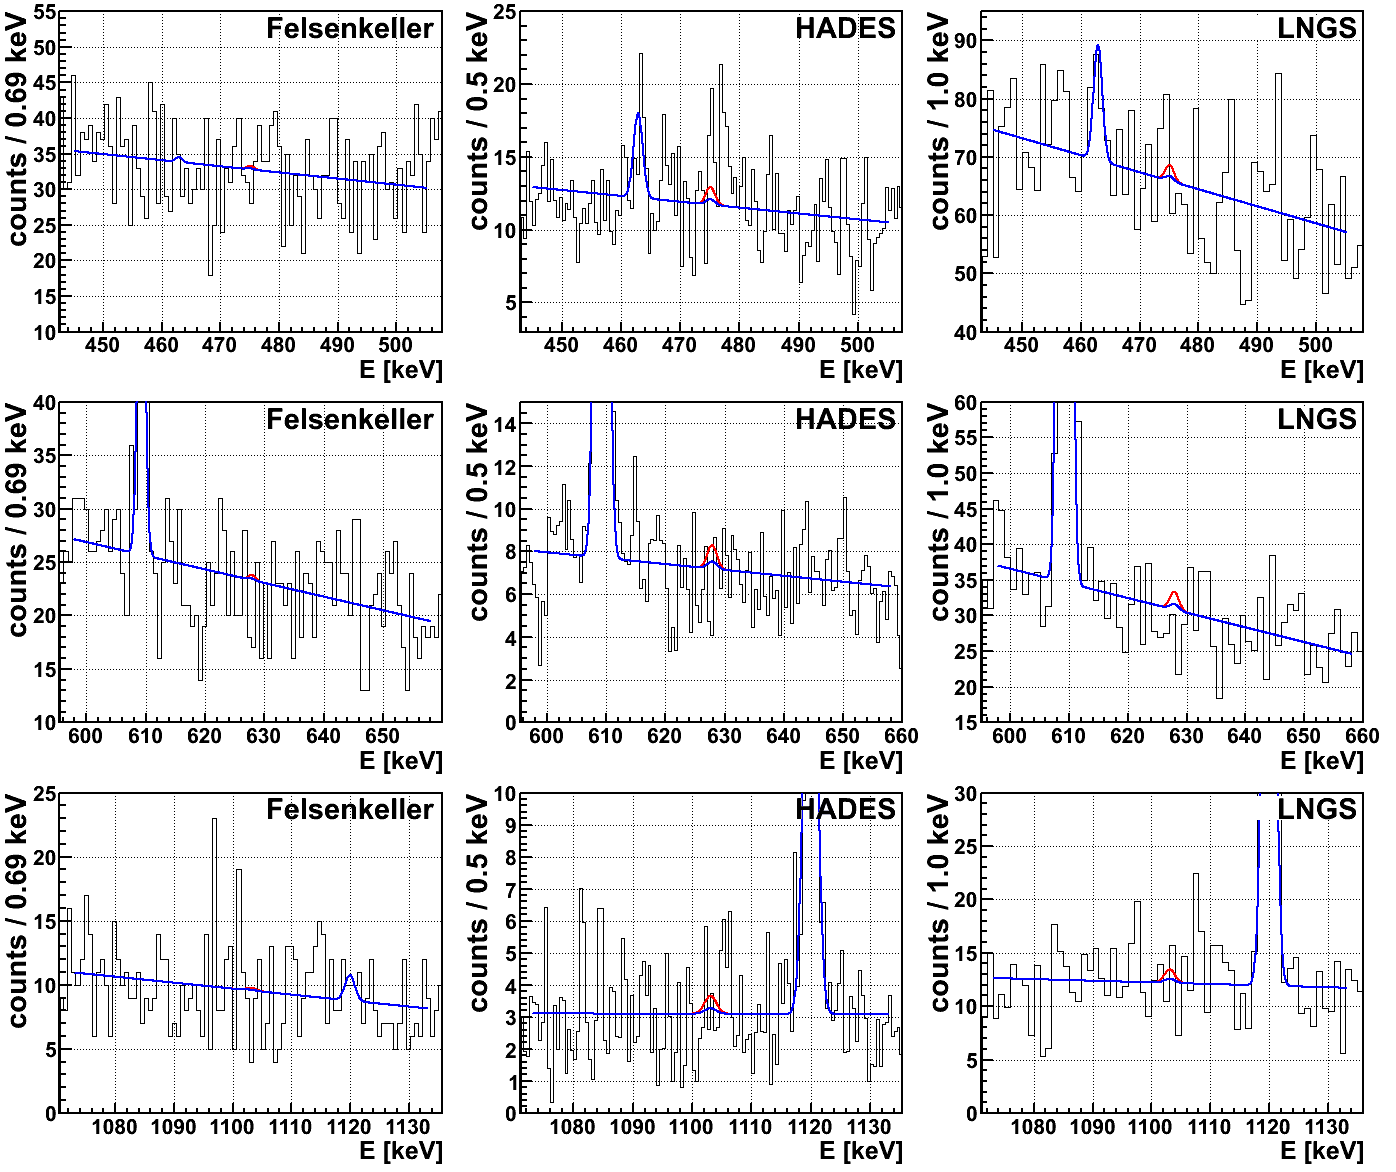
In this case, the background fluctuations in the first fit region of the HADES dataset do not have a strong influence since the fit is dominated by the other two fit regions in which no fluctuations occur. The final limit for the transition is found as
| (15) |
6 Discussion and Conclusions
Excited state transitions in the double beta decay candidate nuclides of and were investigated. A new measurement was performed at LNGS in a deeper location with lower ambient background per detector mass and with a larger 4-detector setup compared to previous measurements. However, this measurement by itself could not significantly improve the previous limit due to an unfavorable detectors-sample configuration reducing the detection efficiency. Thus the data was combined with the two previous measurements at the Felsenkeller and HADES underground laboratories. This combined analysis features the following improvements:
-
•
All available data of the palladium sample was combined improving the overall sensitivity compared to individual datasets.
-
•
The analysis combines the information of all de-excitation -rays in a given decay mode compared to using only a single -ray with the best limit in the past analyses. This is improving the sensitivity for the and excited state transitions with multiple -ray emission and multiple decay branches.
-
•
The analysis is based on spectral fits compared to simple counting limits in the past. The change of methodology is considered an improvement using the full spectral information; however the influence on the limit setting is expected to be only marginal.
-
•
The Bayesian half-life limits are set with the full extraction of the posterior probability which naturally includes systematic uncertainties as prior information in the fit and thus makes the results more robust.
The analysis finds no signal for any decay mode and 90 % credibility lower half-life bounds are obtained which are summarized in Tab. 3. The bounds include systematic uncertainties on the efficiency, energy resolution and peak position. The limits for the decay modes are roughly one order of magnitude weaker than for the decay modes due to the smaller isotopic abundance. The previous best limits could be improved by factors of 1.3 to 3 depending on the decay mode. The current experimental sensitivity is still three orders of magnitude smaller than the lowest half-life prediction for the transition by the QRPA model [23].
| decay mode | [yr] | decay mode | [yr] |
|---|---|---|---|
| 90 % C.I. | 90 % C.I. | ||
Potential future improvements could be achieved by lowering the radioactive background of ambient sources (), increasing the detection efficiency () by rearranging the detector setup and in general by using more target material () and increasing the measuring time (). However, considering the figure of merit for the half-life sensitivity of such an experiment it is clear that the gap between current sensitivity and the lowest theoretical predictions cannot be bridged by standard gamma-spectroscopy setups. A dedicated experiment would need to reduce or discriminate the ambient background by at least a factor of 10. Since the intrinsic background in the palladium is subdominant and other dedicated double beta decay experiments have proven very low background environments this is not unfeasible. An optimized HPGe detector setup and sample volume would need to increase the detection efficiency by a factor of 10. This could be achieved with a thin layer of palladium between multiple sandwich detectors reducing self-absorption and increasing the solid angle coverage. With an increase in measuring time by a factor of 10 to about 2 yr, this would lead to a two orders of magnitude larger half-life sensitivity. Such an arrangement would also allow for a coincidence analysis further reducing the background while remain with a large detection efficiency. To improve by another order of magnitude, the target could be increased in mass and possibly enriched which would, however, dominate the cost for searches in palladium. An alternative option would be to re-use the existing low background environment of current generation double beta decay experiments with good gamma-ray discrimination capability such as e.g. GERDA, CUORE or C0BRA.
References
References
- [1] J. Kotila and F. Iachello. Phase-space factors for double- decay. Phys. Rev. C, 85(3):034316, March 2012.
- [2] J. Barea, J. Kotila, and F. Iachello. and nuclear matrix elements in the interacting boson model with isospin restoration. Phys. Rev. C, 91(3):034304–11, March 2015.
- [3] J. Suhonen and O. Civitarese. Review of the properties of the nuclear matrix elements. J. Phys. G: Nucl. Part. Phys., 39:124005, December 2012.
- [4] F. T. Avignone III, S. R. Elliott, and J. Engel. Double beta decay, Majorana neutrinos, and neutrino mass. Rev. Mod. Phys., 80, 2008.
- [5] A. S. Barabash et al. Two neutrino double-beta decay of 100Mo to the first excited 0+ state in 100Ru. Phys. Lett. B, 345:408–413, February 1995.
- [6] A. S. Barabash, V. I. Umatov, R. Gurriaran, F. Hubert, and P. Hubert. 2nu beta beta decay of Mo-100 to the first 0+ excited state in Ru-100. Phys. Atom. Nucl., 62:2039–2043, 1999.
- [7] R. Arnold et al. Measurement of double beta decay of Mo-100 to excited states in the NEMO 3 experiment. Nucl. Phys., A781:209–226, 2007.
- [8] M. F. Kidd, J. H. Esterline, W. Tornow, A. S. Barabash, and V. I. Umatov. New Results for Double-Beta Decay of Mo-100 to Excited Final States of Ru-100 Using the TUNL-ITEP Apparatus. Nucl. Phys., A821:251–261, 2009.
- [9] P. Belli et al. New observation of 2beta 2nu decay of Mo-100 to the 0+(1) level of Ru-100 in the ARMONIA experiment. Nucl. Phys., A846:143–156, 2010.
- [10] A. S. Barabash, F. Hubert, P. Hubert, and V. I. Umatov. Double beta decay of 150Nd to the first 0+ excited state of 150Sm. JETP Lett., 79:10–12, 2004.
- [11] R. Arnold et al. Investigation of double beta decay of 100Mo to excited states of 100Ru. Nucl. Phys. A, 925, 2014.
- [12] A. Barabash, Ph. Hubert, A. Nachab, and V. Umatov. Investigation of decay in 150Nd and 148Nd to the excited states of daughter nuclei. Phys. Rev. C, 79(4):045501, April 2009.
- [13] B. Lehnert. Excited State Transitions in Double Beta Decay: A brief Review. EPJ Web of Conferences, 93:01025, May 2015.
- [14] National nuclear data center, information extracted from the nudat 2 database, \urlhttp://www.nndc.bnl.gov/nudat2/, 2015.
- [15] D. Fink et al. Q Value and Half-Lives for the Double--Decay Nuclide 110Pd. Phys. Rev. Lett., 108(6):062502, February 2012.
- [16] M. Goncharov et al. Probing the nuclides 102-Pd, 106-Cd, and 144-Sm for resonant neutrinoless double-electron capture. Phys. Rev. C, 84(2):028501–3, August 2011.
- [17] R. Winter. A Search for Double Beta-Decay in Palladium. Phys. Rev., 85(4):687–687, February 1952.
- [18] B. Lehnert and K. Zuber. A first search of excited states double beta and double electron capture decays of 110Pd and 102Pd . Phys. Lett. B, 705(1-2):47–51, November 2011.
- [19] B. Lehnert, K. Zuber, E. Andreotti, and M. Hult. New half-life limits on double- decays of 110Pd and 102Pd into excited states. Phys. Rev. C, 87:034312, 2013.
- [20] S. Stoica. Half-lives for two neutrino double-beta-decay transitions to first 2+ excited states. Phys. Rev. C, 49(4):2240–2243, April 1994.
- [21] P. Domin, S. Kovalenko, F. Šimkovic, and S. V. Semenov. Neutrino accompanied , and and processes within single state dominance hypothesis. Nucl. Phys. A, 753:337–363, May 2005.
- [22] A. A. Raduta and C. M. Raduta. Double beta decay to the first state within a boson expansion formalism with a projected spherical single particle basis. Phys. Lett. B, 647(4):265–270, April 2007.
- [23] J. Suhonen. On the double-beta decays of 70Zn, 86Kr, 94Zr, 104Ru, 110Pd, 124Sn. Nucl. Phys. A, 864(1):63–90, August 2011.
- [24] B. Lehnert. Search for 2 Excited State Transitions and HPGe Characterization for Surface Events in GERDA Phase II. PhD thesis, TU Dresden, 2016.
- [25] S. Niese, M. Köhler, and B. Gleisberg. Low-level counting techniques in the underground laboratory ”Felsenkeller” in Dresden. Journal of Radioanalytical and Nuclear Chemistry, 233(1):167–172, 1998.
- [26] F. Krüger. Characterization of the cosmic-ray component in the low-level measurement laboratory Felsenkeller/Dresden. \urlhttp://www.dpg-verhandlungen.de/year/2010/conference/bonn/part/hk/session/45/contribution/5, DPG Spring Conference, 2010.
- [27] M. Köhler et al. A new low-level -ray spectrometry system for environmental radioactivity at the underground laboratory Felsenkeller. Appl. Rad. Isot., 67(5):736–740, May 2009.
- [28] M. Boswell et al. MaGe - a Geant4-Based Monte Carlo Application Framework for Low-Background Germanium Experiments. IEEE Trans. Nucl. Sci., 58(3):1212–1220, 2011.
- [29] B. Lehnert. Analysis of Double Beta Decays in Germanium, Palladium and Argon. Diploma Thesis, TU Dresden, 2011.
- [30] E. Andreotti et al. Status of underground radioactivity measurements in HADES. 3rd International Conference on Current Problems in Nuclear Physics and Atomic Energy in Kiev, page 601, 2011.
- [31] J.S. E. Wieslander et al. The Sandwich spectrometer for ultra low-level -ray spectrometry. Appl. Rad. Isot., 67(5):731–735, May 2009.
- [32] W.R. Nelson, H. Hirayama, and D.W.O. Rogers. The EGS4 Code System. SLAC PUB 5193, 1985.
- [33] C. M. Cattadori, M. De Deo, M. Laubenstein, L. Pandola, and V. I. Tretyak. Observation of decay of 115In to the first excited level of 115Sn. Nucl. Phys. A, 748(1-2):333–347, February 2005.
- [34] A. Caldwell, D. Kollár, and K. Kröninger. BAT – The Bayesian analysis toolkit. Comp. Phys. Comm., 180(11):2197–2209, November 2009.
7 Appendix
| -line energy | Felsenkeller | HADES | LNGS |
|---|---|---|---|
| 657.8 keV | 0.642 keV | 0.828 keV | 0.768 keV |
| 815.3 keV | 0.683 keV | 0.868 keV | 0.794 keV |
| 818.0 keV | 0.684 keV | 0.868 keV | 0.794 keV |
| 1475.8 keV | 0.837 keV | 1.003 keV | 0.912 keV |
| 468.6 keV | 0.590 keV | 0.773 keV | 0.739 keV |
| 475.1 keV | 0.592 keV | 0.775 keV | 0.740 keV |
| 627.9 keV | 0.634 keV | 0.819 keV | 0.764 keV |
| 1103.1 keV | 0.754 keV | 0.932 keV | 0.844 keV |
| -line energy [keV] | Felsenkeller | HADES | LNGS |
| 657.8 keV decay mode: | |||
| 657.7 keV (100.0 %) | 3.06 % | 4.70 % | 2.57 % |
| 1473.1 keV decay mode: | |||
| 657.8 keV (100.0 %) | 2.56 % | 3.94 % | 2.08 % |
| 815.3 keV (100.0 %) | 2.30 % | 3.68 %a | 1.97 % |
| 1475.80 keV decay mode: | |||
| 657.8 keV (64.5 %) | 1.68 % | 2.53 % | 1.38 % |
| 818.0 keV (64.5 %) | 1.53 % | 2.40 % | 1.28 % |
| 1475.8 keV (35.5 %) | 0.87 % | 1.32 % | 0.69 % |
| 475.1 keV decay mode: | |||
| 475.1 keV (100.0 %) | 3.32 % | 5.09 % | 2.75 % |
| 943.7 keV decay mode: | |||
| 475.1 keV (100.0 %) | 2.72 % | 4.31 % | 2.26 % |
| 468.6 keV (100.0 %) | 2.75 % | 4.32 % | 2.30 % |
| 1103.05 keV decay mode: | |||
| 475.1 keV (62.9 %) | 1.76 % | 2.67 % | 1.48 % |
| 627.9 keV (62.9 %) | 1.63 % | 2.54 % | 1.39 % |
| 1103.1 keV (37.1 %) | 1.04 % | 1.60 % | 0.83 % |
a typographical error in Ref. [19]