Planck intermediate results. XLVIII.
Disentangling Galactic dust emission and cosmic infrared background anisotropies
Using the Planck 2015 data release (PR2) temperature maps, we separate Galactic thermal dust emission from cosmic infrared background (CIB) anisotropies. For this purpose, we implement a specifically tailored component-separation method, the so-called generalized needlet internal linear combination (GNILC) method, which uses spatial information (the angular power spectra) to disentangle the Galactic dust emission and CIB anisotropies. We produce significantly improved all-sky maps of Planck thermal dust emission, with reduced CIB contamination, at , , and GHz. By reducing the CIB contamination of the thermal dust maps, we provide more accurate estimates of the local dust temperature and dust spectral index over the sky with reduced dispersion, especially at high Galactic latitudes above . We find that the dust temperature is K and the dust spectral index is averaged over the whole sky, while K and on % of the sky at high latitudes. Moreover, subtracting the new CIB-removed thermal dust maps from the CMB-removed Planck maps gives access to the CIB anisotropies over 60% of the sky at Galactic latitudes . Because they are a significant improvement over previous Planck products, the GNILC maps are recommended for thermal dust science. The new CIB maps can be regarded as indirect tracers of the dark matter and they are recommended for exploring cross-correlations with lensing and large-scale structure optical surveys. The reconstructed GNILC thermal dust and CIB maps are delivered as Planck products.
Key Words.:
Cosmology: observations — methods: data analysis — ISM: general — ISM: dust, extinction — infrared: diffuse background — Cosmology: large-scale structure of Universe1 Introduction
The various populations of dust grains in the Galaxy are heated by absorbing the ultraviolet emission from stars. By re-emitting the light at infrared frequencies, the heated dust grains are responsible for the thermal dust radiation of the Galaxy. For this reason, the dust emission is a tracer of the gas and particle density in the interstellar medium (Planck Collaboration XIX 2011; Planck Collaboration XI 2014; Planck Collaboration Int. XVII 2014; Planck Collaboration Int. XXVIII 2015; Planck Collaboration Int. XXXII 2016) and of the star formation activity in the Galaxy (Draine & Li 2007). The Galactic thermal dust emission is also one of the major astrophysical foregrounds for observations of the cosmic microwave background (CMB) (Planck Collaboration Int. XXX 2016; BICEP2/Keck Array and Planck Collaborations 2015). Incorrect modelling of thermal dust might be responsible for a significant bias on the cosmological parameters (e.g., Remazeilles et al. 2016). The characterization of Galactic thermal dust emission over the whole sky is therefore essential for the accurate subtraction of this foreground from the CMB observations. Accurate characterization of the Galactic dust is also useful for the analysis of supernovae observations, where the Galactic dust causes extinction (Riess et al. 1996).
An unresolved background of dusty star-forming early galaxies also generates diffuse emission, known as the cosmic infrared background radiation (Puget et al. 1996; Gispert et al. 2000; Lagache et al. 2005). The cosmic infrared background (CIB) anisotropies are a probe of star-formation history in the Universe and also an indirect tracer of the dark matter (Planck Collaboration XVIII 2011; Planck Collaboration XXX 2014). At high frequencies ( 300 GHz), the Galactic thermal dust emission and the CIB radiation both scale approximately as modified blackbodies. This makes it challenging to separate the dust and CIB components solely on the basis of their spectral properties (Planck Collaboration XI 2014; Planck Collaboration X 2016)
The previously released Planck111Planck (http://www.esa.int/Planck) is a project of the European Space Agency (ESA) with instruments provided by two scientific consortia funded by ESA member states and led by Principal Investigators from France and Italy, telescope reflectors provided through a collaboration between ESA and a scientific consortium led and funded by Denmark, and additional contributions from NASA (USA). dust maps – the Planck 2013 (P13) dust model (Planck Collaboration XI 2014) and the Planck 2015 (P15) dust model (Planck Collaboration X 2016) – have been produced by fitting a modified blackbody (MBB) spectrum to the Planck data. For the P13 dust map, a standard fitting of the MBB spectrum was applied pixel by pixel to four maps, namely the CMB-removed Planck temperature maps at , , and GHz from the Planck 2013 data release (hereafter, PR1), and a m map obtained from a combination of the IRIS map from Miville-Deschênes & Lagache (2005) and the map from Schlegel et al. (1998). The CMB removal in the Planck frequency channels was performed by subtracting the Planck SMICA CMB map (Planck Collaboration XII 2014) from the Planck frequency maps. For the P15 dust map, a Bayesian fitting of the MBB spectrum was implemented on the Planck 2015 data release (hereafter, PR2) temperature maps by using the full set of Planck frequency channels.
However, the Planck dust models P13 and P15 still suffer from contamination by the CIB anisotropies. In particular, at high Galactic latitudes the contamination by CIB anisotropies adds significant uncertainty to the measured dust spectral index and dust temperature (Planck Collaboration XI 2014).
By definition, the spectral fitting employed in Planck Collaboration XI (2014) and Planck Collaboration X (2016) relied solely on the frequency information to reconstruct the Galactic thermal dust model from observations of the sky emission. Because the Galactic dust emission and the extragalactic CIB emission have such similar spectral indices in the Planck bands, the result of these frequency-based fits is that the CIB anisotropies inevitably leak into the Planck dust model maps. In order to disentangle the Galactic thermal dust emission and the extragalactic CIB emission, additional discriminating statistical information is required.
The CIB temperature fluctuations have been successfully measured by Planck in relatively small regions of the sky, where the Galactic dust contamination is low (Planck Collaboration XXX 2014), and the angular power spectra of the CIB anisotropies have been computed at frequencies from GHz to GHz.
In this work we perform the separation of the Galactic thermal dust and CIB components over a large area of the sky by exploiting not only the frequency spectral information but also the spatial information through the use of the Planck CIB best-fit angular power spectra computed in Planck Collaboration XXX (2014, hereafter, CIB 2013). The CIB power spectrum scales approximately as (Planck Collaboration XVIII 2011), while the dust power spectrum scales approximately as (Planck Collaboration XXX 2014). This distinct spatial behaviour provides the necessary extra statistical information that enables robust separation of thermal dust emission and CIB radiation. Although the CIB 2013 angular power spectra have been estimated in only small areas of the sky, we assume that the statistics of the CIB anisotropies are the same in a larger area of the sky, because of the homogeneity and isotropy of the CIB emission.
The component-separation method employed in this work is the generalized needlet internal linear combination (GNILC) method, first developed in Remazeilles et al. (2011b). It is worth noting that the GNILC method has also been applied in a different context to simulations of a radio intensity mapping experiment for separating the cosmological H i -cm temperature fluctuations and the Galactic synchrotron radiation in Olivari et al. (2016), where the component-separation problem was similar.
This paper is organized as follows. In Sect. 2 we present the data used in the analysis. In Sect. 3 we give a summary of the component-separation method that we implement on the data to disentangle the Galactic dust emission and the CIB anisotropies; the full description of the method and validation on simulations are presented in Appendix A. In Sect. 4 we discuss the results for the Galactic thermal dust emission and the estimated spectral parameters. In Sect. 5 we discuss the results for the CIB emission. In Sect. 6 we explore the correlations of the new dust and CIB maps with the H i gas tracer. We conclude in Sect. 7.
2 Data and preprocessing
2.1 Planck data
The data used in this paper are the temperature full-mission sky maps (Planck Collaboration VI 2016; Planck Collaboration VIII 2016) of the Planck 2015 data release (PR2) that have been made publicly available on the Planck Legacy Archive. We make use of the nine single-frequency maps from to GHz from both LFI and HFI instruments. As discussed in Planck Collaboration XIV (2014), the zodiacal light emission is removed from the Planck HFI temperature maps ( to GHz) by fitting different Planck surveys of the sky with the COBE/DIRBE222Cosmic Background Explorer Diffuse Infrared Brightness Experiment. zodiacal model (Kelsall et al. 1998). Because different Planck surveys are taken at different times, the sky is observed through different column depths of interplanetary dust. Differencing two surveys removes all distant structure in the maps, such as Galactic and extra-galactic emission, but leaves a detectable Zodiacal signal. This difference signal is fit to extend the COBE zodiacal model to Planck frequencies. The entire, un-differenced signal is then reconstructed from the model and removed from the data of each Planck HFI bolometer prior to mapmaking (Planck Collaboration VIII 2016).
We also make use of the Planck temperature half-mission sky maps (hereafter, HM1 and HM2, as defined in Planck Collaboration VIII (2016)) in the nine frequency channels, in order to estimate by their half-difference (see Eq. 25) the local rms of the instrumental noise in the Planck full-mission maps.
2.2 The IRAS 100 m map
Following Planck Collaboration XI (2014), in addition to the Planck PR2 data we also use in this work the full-sky temperature map at 100 m based on the combination of the IRIS map (Miville-Deschênes & Lagache 2005) and the map of Schlegel et al. (1998, hereafter SFD map) both projected on the HEALPix grid (Górski et al. 2005) at . The combined 100 m map is compatible with the SFD map at angular scales larger than and compatible with the IRIS map at smaller angular scales. The effective beam resolution of the combined 100 m map is and the noise rms level is MJy sr-1.
Note that residual low-level zodiacal light emission is present in the combined 100 m map, because the zodiacal emission has not been corrected in the same way in the SFD map and in the IRIS map. We refer to the appendix of Planck Collaboration XI (2014) for further discussion of this point.
2.3 Preprocessing of the point sources
We make use of nine point source masks, one for each Planck frequency channel, in order to remove the point sources detected in each frequency at a signal-to-noise ratio S/N 5 in the second Planck Catalogue of Compact Sources, PCCS2 (Planck Collaboration XXVI 2016).
The masked pixels in each Planck frequency map are filled in through a minimum curvature spline surface inpainting technique, implemented in the Planck Sky Model (PSM) software package (Delabrouille et al. 2013) and described in Remazeilles et al. (2015) and Planck Collaboration XII (2016). For consistency, we also consider the source-subtracted version of the combined 100 m map that is described in the appendix of Planck Collaboration XI (2014). The inpainted Planck 2015 maps and the inpainted combined 100 m map are the inputs to the component-separation algorithm described in the next section.
3 Summary of the component-separation method
The component-separation technique that we follow in this work is based on Remazeilles et al. (2011b) and called GNILC.
In order to simplify the reading of the paper, we give a brief summary of the method employed in this work to separate the thermal dust and CIB anisotropies. A complete description of the formalism and technical details of GNILC are presented in Appendix A.
Each frequency map is first decomposed on a needlet (spherical wavelet) frame (Narcowich et al. 2006; Guilloux et al. 2009). The localization properties of the needlets allow us to adapt the component separation to the local conditions of contamination in both harmonic space and real space (Delabrouille et al. 2009; Remazeilles et al. 2011b; Basak & Delabrouille 2012; Remazeilles et al. 2013; Basak & Delabrouille 2013). We define ten needlet windows, , having a Gaussian shape and acting as bandpass filters in harmonic space, each of them selecting a specific subrange of angular scales (see Fig. 21). The spherical harmonic transform, , of each frequency map is bandpass filtered in harmonic space by the ten needlet windows. The inverse transform of the bandpass-filtered coefficient, , provides a needlet map at scale , conserving only statistical information from the range of considered. Therefore, we have 100 input maps (10 frequencies times 10 needlet scales). The component separation is performed on each needlet scale independently. The main steps of the GNILC algorithm are the following. For each needlet scale, , considered we perform seven steps:
-
1.
Compute the frequency-frequency data covariance matrix, at pixel , and scale ,
(1) where is a domain of pixels centred at pixel and and are the needlet maps at scale of the observations for the pair of frequencies . In practice, the domain of pixels, , is defined by the convolution in real space of the product of the needlet maps with a Gaussian kernel. The width of the Gaussian kernel is a function of the needlet scale considered.
-
2.
Similarly, compute the frequency-frequency covariance matrix of the instrumental noise, at pixel , and scale ,
(2) where the instrumental noise maps, , are estimated from the half-difference of the half-mission HM1 and HM2 Planck maps.
-
3.
Similarly, compute the frequency-frequency covariance matrix of the CMB, , and the frequency-frequency covariance matrix of the CIB, , but this time using CMB maps and CIB maps that are simulated from the Planck CMB best-fit (Planck Collaboration XV 2014) and the Planck CIB best-fit (Planck Collaboration XXX 2014) respectively. The simulated maps were analyzed with the same needlet decomposition as was applied to the real data before computing the CMB and CIB covariance matrices.
-
4.
Compute the “nuisance” covariance matrix, , by co-adding the noise covariance matrix, the CMB covariance matrix, and the CIB covariance matrix:
(3) -
5.
Diagonalize the transformed data covariance matrix
(7) where is the number of frequency channels. In this representation, the eigenvalues that are close to unity correspond to the nuisance power (CIB plus CMB plus noise), while the eigenvalues larger than unity that are collected in the diagonal matrix correspond to the power of the Galactic signal. The matrix collects the eigenvectors spanning the Galactic signal subspace.
-
6.
Compute the effective dimension, , of the foreground signal subspace (number of Galactic degrees of freedom, or principal components) by minimizing the Akaike Information Criterion (AIC, Akaike 1974):
(8) where are the eigenvalues of .
-
7.
Apply the –dimensional ILC filter (Remazeilles et al. 2011b) to the data in order to reconstruct the total Galactic signal at scale :
(9) where the estimated mixing matrix is given by
(10) with collecting the eigenvectors selected by the AIC criterion at scale .
The reconstructed Galactic signal maps are finally synthesized as follows. We transform the estimated maps, , to spherical harmonic coefficients, then bandpass filter the harmonic coefficients by the respective needlet window, , and transform back to maps in real space. This operation provides one reconstructed Galactic signal map per needlet scale. We co-add these maps to obtain, for each frequency channel, the complete reconstructed Galactic signal map on the whole range of angular scales. The needlet windows are chosen so that , therefore conserving the total power in the synthesis.
The reconstruction of the CIB maps is performed as follows. In step 4, we replace Eq. (3) by so that the reconstructed signal is the sum of the Galactic dust plus the CIB. We then subtract the reconstructed Galactic dust (only), , from the Galactic dust plus CIB reconstruction.
Note that the priors on the CMB and CIB angular power spectra are only used for estimating the dimension, , of the Galactic signal subspace (step 5), not for the ILC filtering (step 7) in the reconstruction of the components of the emission.
4 GNILC results on the thermal dust


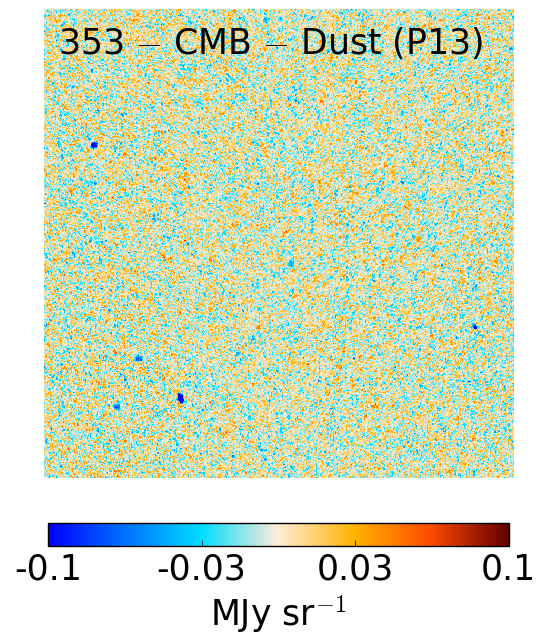
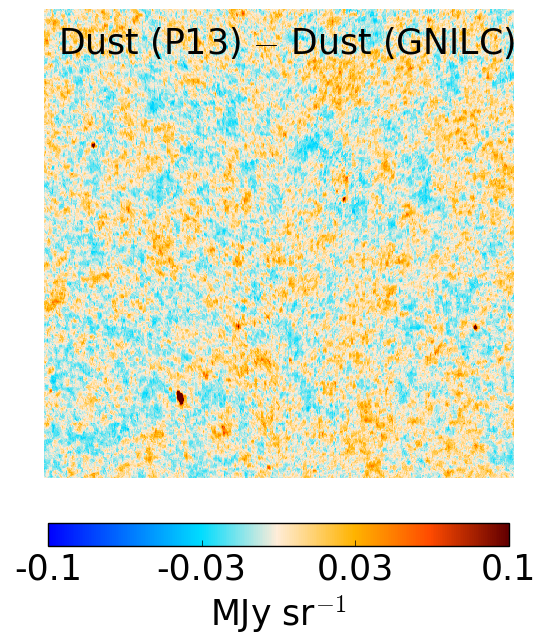


4.1 Dust maps and power spectra
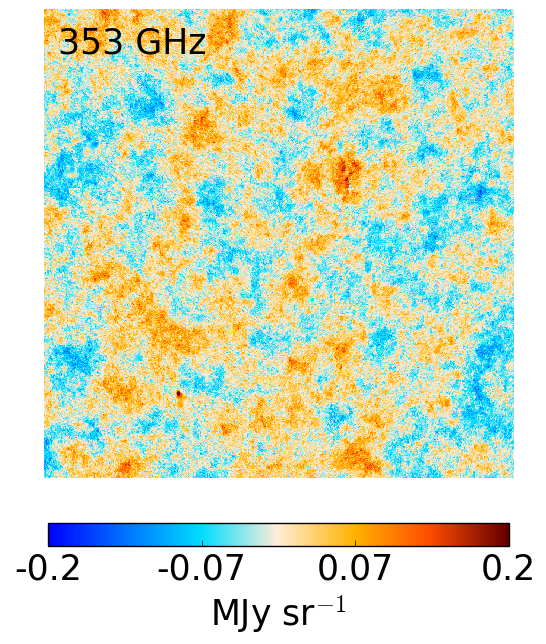
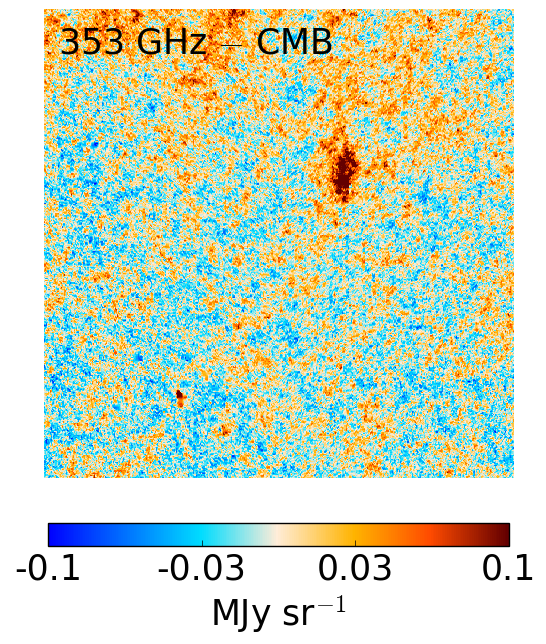
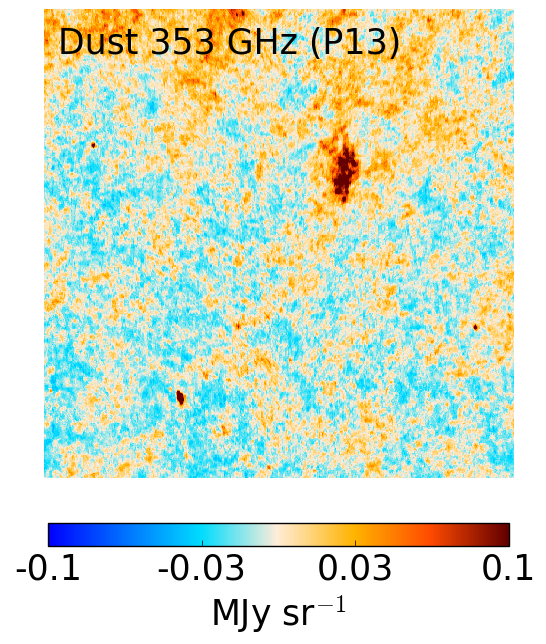
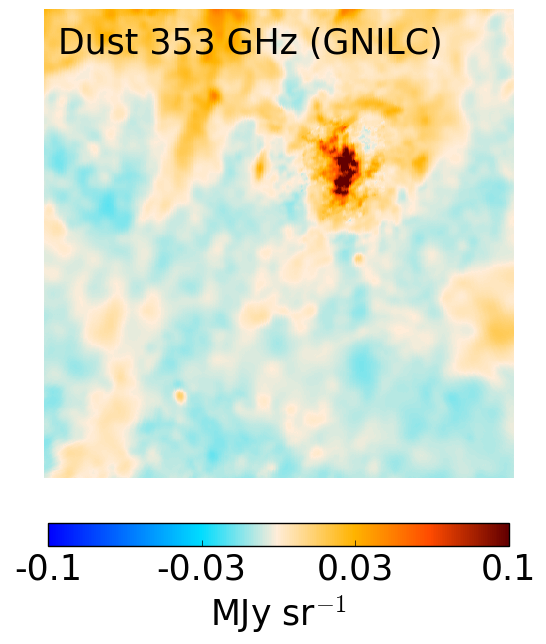
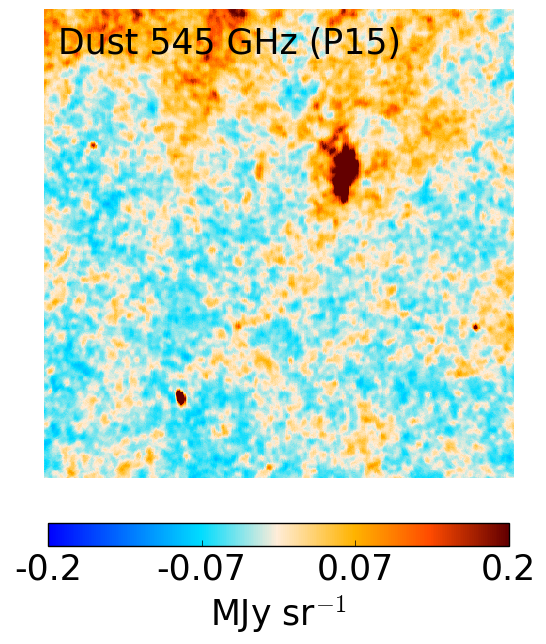
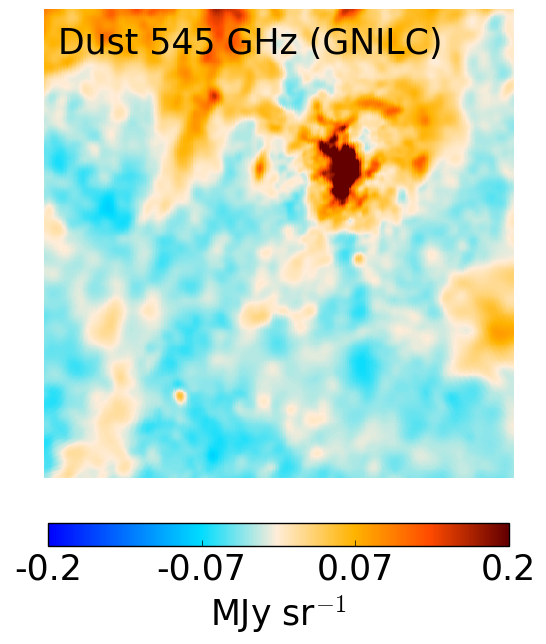
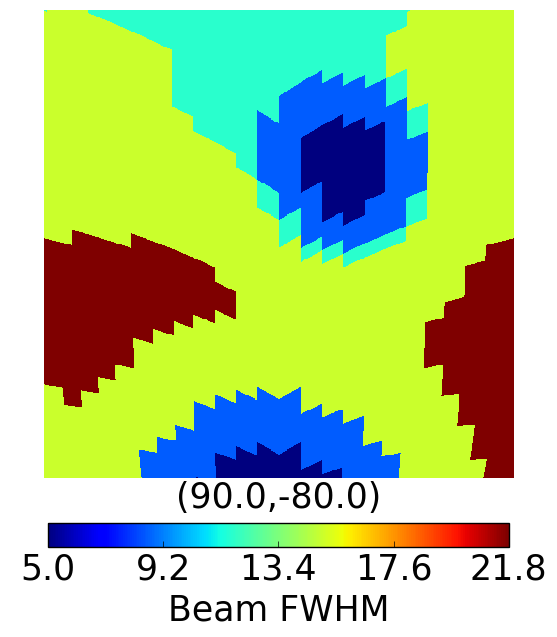
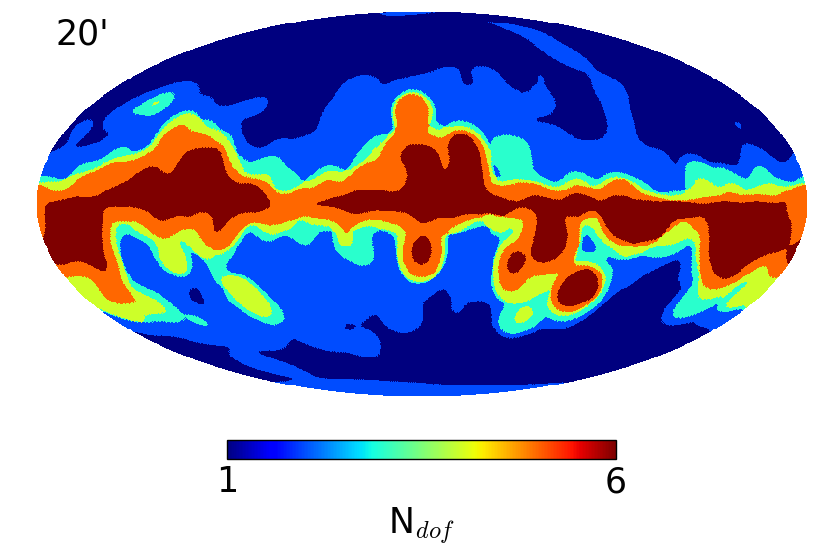
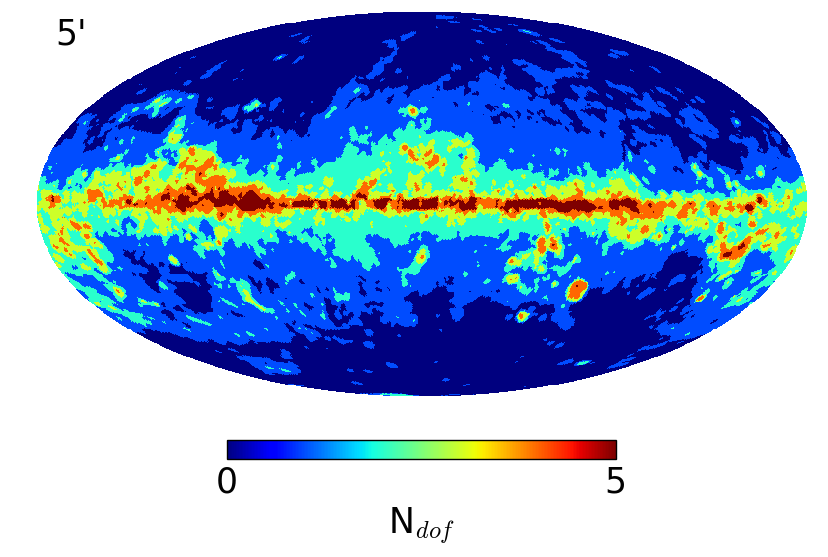
In Fig. 1 we compare various maps projected onto a high Galactic latitude area centred at . In the top left panel of Fig. 1, the Planck -GHz channel map is shown. At 353 GHz the CMB radiation is clearly visible in the Planck observation map at high Galactic latitude, through degree-scale temperature fluctuations which are typical in size of the CMB anisotropies. In the top right panel of Fig. 1, the Planck -GHz map is shown after subtraction of the Planck CMB map (i.e., the SMICA map from Planck Collaboration XII 2014). The CMB-removed Planck -GHz map reveals the thermal dust emission, but is still quite noisy and contaminated by the CIB temperature anisotropies. The dust model P13 at GHz, which has been computed by fitting an MBB spectrum to the CMB-removed Planck maps (Planck Collaboration XI 2014), is plotted in the middle left panel of Fig. 1. Because of the similar spectral signatures of the thermal dust and the CIB, the dust model P13 resulting from the spectral fitting can not avoid the leakage of the CIB fluctuations into the dust map. Conversely, in the GNILC dust map at GHz produced in this work, the CIB anisotropies have been successfully filtered out, while the -scale dust emission has been conserved in the map. Note that all the maps are shown at resolution, but the GNILC dust map has a local effective beam resolution that is shown in Fig. 2. The local beam resolution of the GNILC dust maps is not the result of a local smoothing of the maps, but the result of the thresholding of the needlet coefficients that depends on local signal-to-noise ratio. In some high-latitude regions of the sky, beyond a certain angular scale, the power of the dust is found to be consistent with zero, i.e., the dimension of the Galactic signal subspace selected by the AIC criterion is (see Fig. 20), because the sky observations in this needlet domain become compatible with the CIB-plus-CMB-plus-noise model.
In the bottom panels of Fig. 1, we compare the dust model P15 at GHz from Planck Collaboration X (2016) and the GNILC dust map at GHz produced in this work. The dust model P15 has been obtained by using a Bayesian fitting method, Commander (Eriksen et al. 2008), instead of the fitting method used for the dust model P13 in Planck Collaboration XI (2014). Commander makes an overall fit of many foreground parameters, including those of the thermal dust component (intensity, spectral index, and temperature). However, the Commander fitting again does not make any distinction between the CIB and the Galactic thermal dust, both sharing a similar MBB spectrum. In summary, thermal dust and CIB are still fitted as a single component in constructing the dust models P13 and P15. The dust model P15 at GHz still shows CIB anisotropies at high latitude, whereas those CIB anisotropies have been successfully filtered out in the GNILC dust map at GHz (see Fig. 1). Unlike the dust models P13 and P15, the GNILC dust maps are not the result of any fit of a dust model, but the result of a component-separation procedure solely based on prior assumptions on the CIB, CMB, and noise angular power spectra.
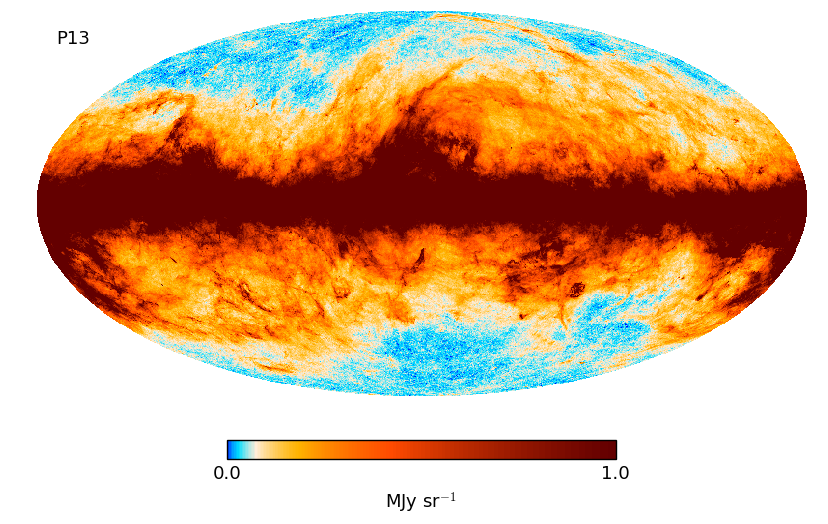
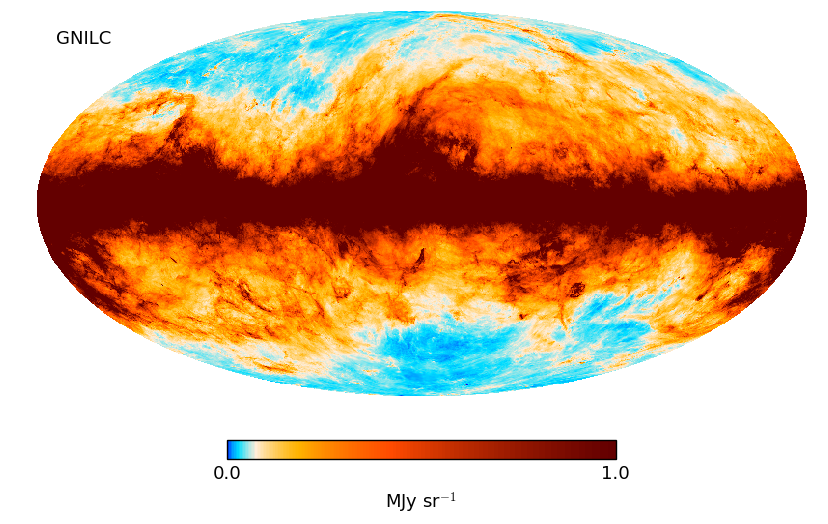
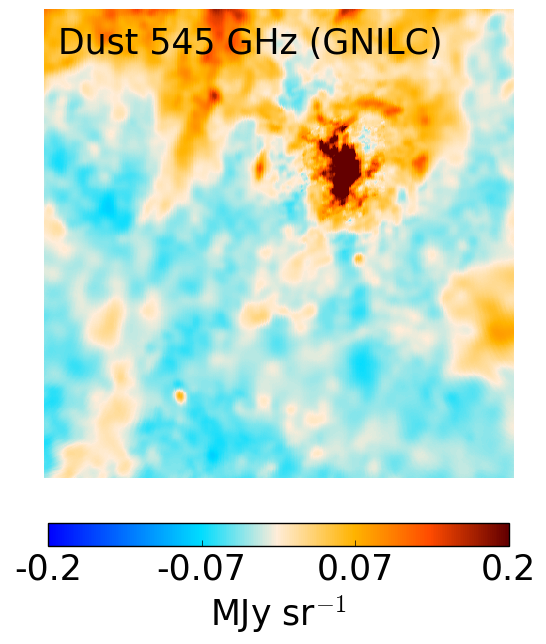
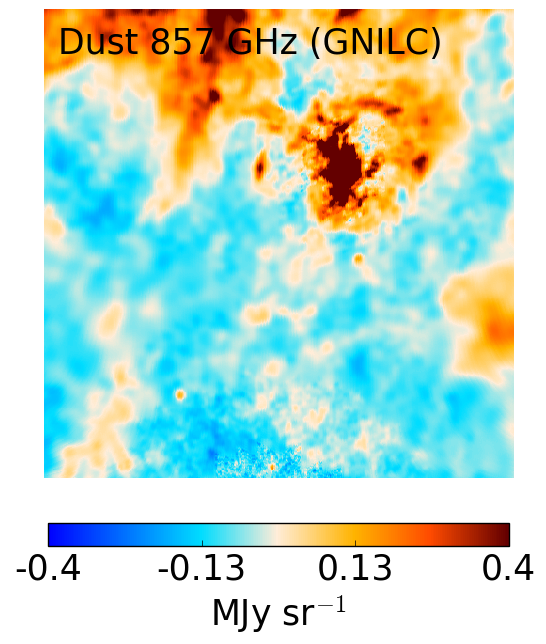
Figure 3 shows the GNILC all-sky map of the thermal dust at GHz in the bottom panel. This map can be compared to the dust model P13 at GHz from Planck Collaboration XI (2014), shown in the top panel. While the dust model P13 still shows visible small-scale contamination by CIB anisotropies at high latitude, in the GNILC dust map the CIB fluctuations are clearly filtered out at high latitude. The gnomonic projections, centred at , of the various GNILC maps of the dust at , , and GHz, are shown in Fig. 4.
At high Galactic latitude and small angular scales, the AIC criterion can select a dimension zero for the Galactic signal subspace, considering that in this region the Galactic signal is completely buried under the CIB and noise signals, and therefore the dust is compatible with zero. This aspect of the GNILC filtering is visible in the bottom panel of Fig. 20, where in the high-latitude region at scale there are no Galactic degrees of freedom selected by the AIC criterion. Therefore, in practice the GNILC filtering is equivalent to a local smoothing of the sky map, depending on the relative power of the Galactic dust with respect to the local contamination by the CIB, the CMB, and the instrumental noise. The effective local beam FWHM over the sky of the GNILC dust maps is plotted in Fig. 2. Over % of the sky, where the dust signal is significant, the beam resolution is preserved by the GNILC filtering.
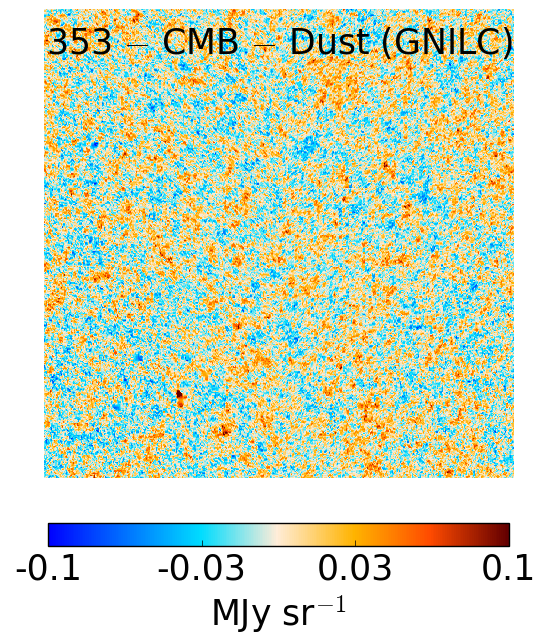
It is interesting to look at the residual map given by the difference between the CMB-removed Planck map and the dust map, i.e., the difference map (Planck map Planck CMB map dust map). In the case where the GNILC dust map is used in the subtraction, the residual map clearly shows the CIB anisotropies plus the instrumental noise (left panel of Fig. 5), as expected. Conversely, if the Planck 2103 dust model is used for the subtraction in place of the GNILC dust map then the residual map shows the instrumental noise only (middle panel of Fig. 5). This, again, indicates that the CIB anisotropies have leaked into the dust model P13, and therefore that the CIB anisotropies can not be recovered in the residual map. In the right panel of Fig. 5, we plot the difference between the Planck 2103 dust model and the GNILC dust map at GHz, highlighting the amount of CIB leaking into the dust model P13.
The resulting angular power spectrum of the various dust maps and the residual maps at , , and GHz are plotted in Fig. 6. We have used the HEALPix routine anafast (Górski et al. 2005) for computing the angular power spectrum of the maps. The amplitude of the power spectrum of the GNILC dust map at GHz (long dashed red line) is reduced by a factor of at with respect to the dust model P13 (dotted blue line) because of the removal of the CIB contamination. The power spectrum of the GNILC dust map is steeper than the power spectrum of the dust model P13. The GNILC dust power spectrum scales as a power-law . For completeness, the GNILC dust power spectrum corrected for residual noise is overplotted as a solid green line.
The angular power spectrum of the GNILC residual map, i.e. of the difference map (Planck map Planck CMB GNILC dust), typically shows the power of the CIB plus noise that has been filtered out in the GNILC dust map (solid yellow line). As illustrated in the top panel of Fig. 6, the angular power spectrum of the GNILC residual map successfully matches the sum of the Planck CIB best-fit power spectrum at GHz (dash-dot purple line) and the Planck -GHz instrument noise power spectrum (dashed orange line). At and GHz the angular power spectrum of the GNILC residual map is below the Planck CIB best-fit power spectrum, which means that some amount of residual CIB contamination is still left in the GNILC dust maps at and GHz.
4.2 Thermal dust temperature and spectral index


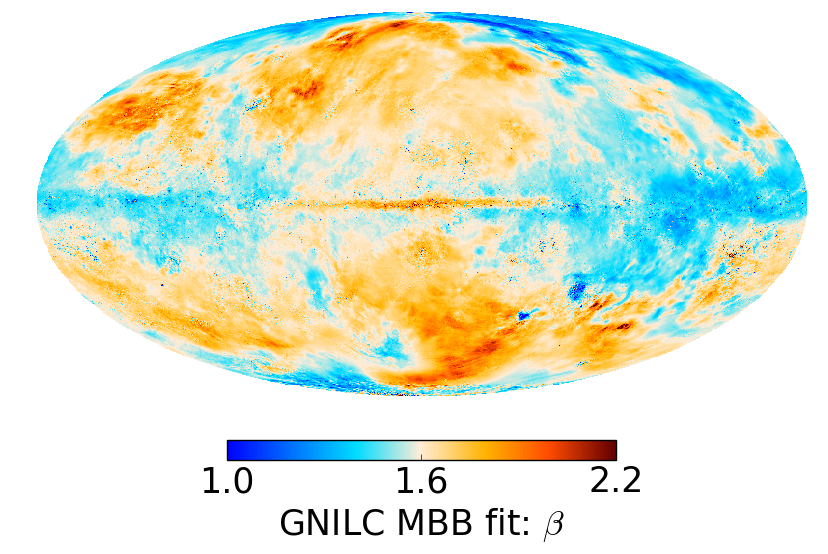
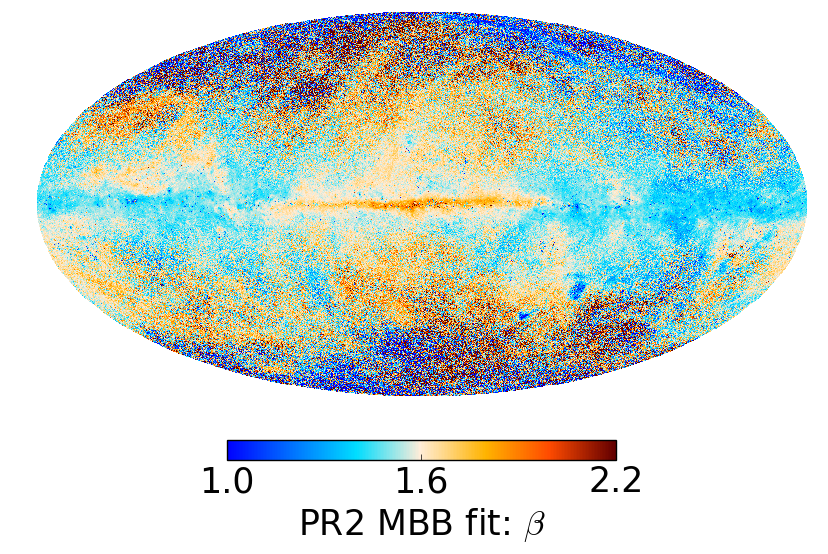
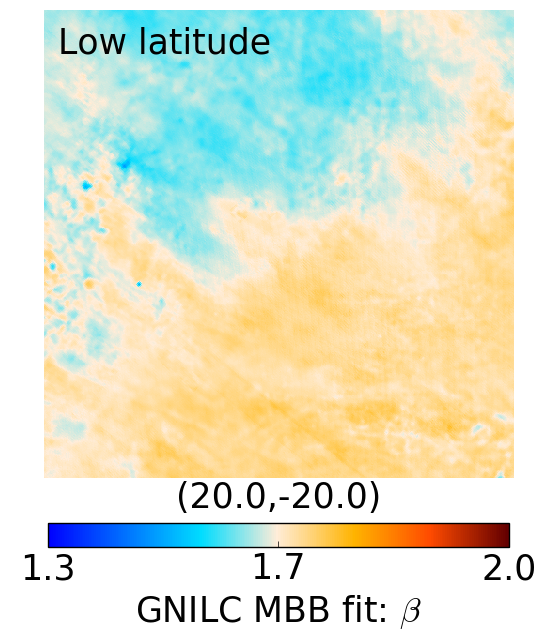
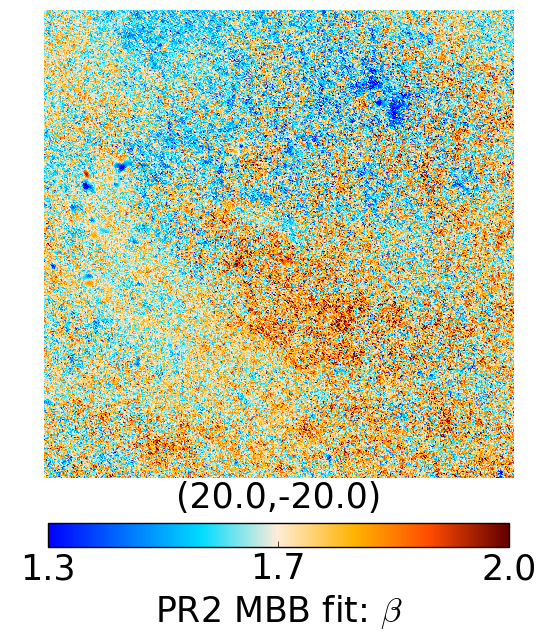
Following Planck Collaboration XI (2014), we fit in each pixel a modified blackbody (MBB) spectral model to the GNILC dust maps at , , , and GHz in order to estimate the dust temperature, spectral index, and optical depth over the sky. We also performed an analysis similar to that of Planck Collaboration XI (2014), which used the PR1 data, by fitting the same MBB model to the CMB-removed PR2 maps, in place of the GNILC dust maps. We refer to this as the PR2 MBB fit. This allows us to highlight the improvement in estimating the dust temperature and spectral index after filtering out the CIB anisotropies with GNILC.


| Area . [%] [K] [K] Full sky . 100 19.40 1.26 1.60 0.13 High latitude . 21 19.41 1.54 1.63 0.17 Low latitude . 20 19.19 1.49 1.54 0.11 Area . [%] [K] [K] Full sky . 100 19.50 1.70 1.59 0.27 High latitude . 21 19.56 2.46 1.64 0.45 Low latitude . 20 19.18 1.50 1.55 0.10 Area . [%] [K] [K] Full sky . 100 20.93 2.25 1.54 0.05 High latitude . 21 23.25 1.67 1.55 0.05 Low latitude . 20 18.63 1.96 1.57 0.05 |


4.2.1 fitting
The model of dust emission that we fit to the data is a modified blackbody (MBB) spectrum with three parameters:
| (11) |
where GHz is the reference frequency, the dust optical depth at GHz in pixel , the dust temperature in pixel , and the dust spectral index in pixel . The function is the Planck law for blackbody radiation.
We use a standard fitting method as in Planck Collaboration XI (2014). However, there a two-step approach was adopted for the fit; in order to limit the fluctuations in the estimated parameters induced by the noise and the CIB contamination, the spectral index parameter was estimated at resolution in a first step, then the temperature and the optical depth were fit at resolution. Given that we already have cleaned the thermal dust from CIB contamination at , , , and GHz by using the GNILC component-separation method, there is no reason to perform a low-resolution MBB fit on the cleaned GNILC maps. Therefore, we will fit the three parameters , , and simultaneously at full resolution (), instead of following the two-step approach adopted in Planck Collaboration XI (2014). For the fit, we use the frequency data at , , , and GHz, either from the unfiltered PR2 data (i.e., inputs similar to those used to produce the dust model P13) or from the CIB-removed GNILC dust maps. In this way, we will highlight the improvement in the estimated dust parameters resulting from the removal of the CIB fluctuations with GNILC.
In most of the images presented in this paper the local average of the dust maps has been subtracted to facilitate side-by-side comparisons of the different versions of the Planck dust map in terms of contamination by CIB fluctuations. There is no subtraction of any offset in the released GNILC products themselves. In order to fit for the dust spectral parameters, , , and , the offsets of the GNILC dust maps have been estimated by correlation with the H i map at high latitude in the exact same way as described in Planck Collaboration XI (2014). The offsets of the GNILC dust maps are found to be , , , and MJy sr-1 at , , , and GHz respectively. The uncertainties on the absolute calibration of the Planck channels have been estimated from the observation of planets (Planck Collaboration VIII 2016); they are % at GHz, % at GHz, and % at GHz. The calibration incertainty at GHz is % (Miville-Deschênes & Lagache 2005). Calibration uncertainties and offset uncertainties have been taken into account in the fitting, following the procedure detailed in the appendix of Planck Collaboration XI (2014).
4.2.2 Parameter maps
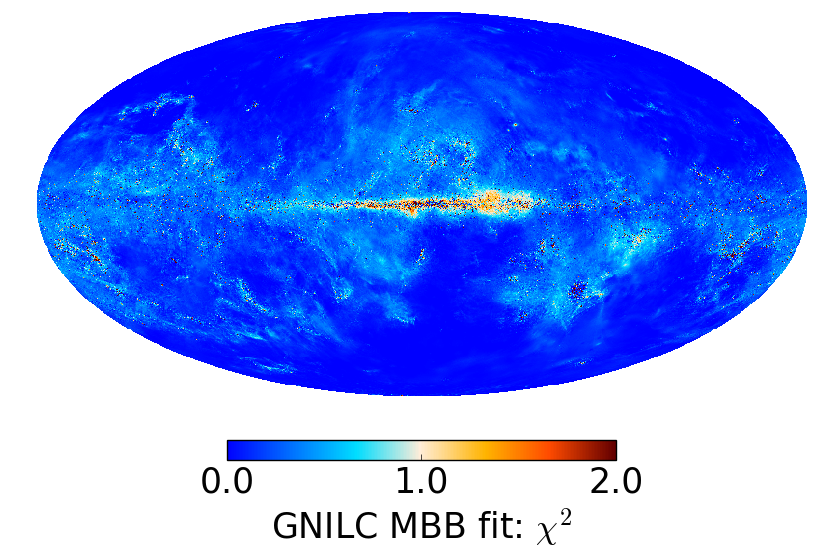
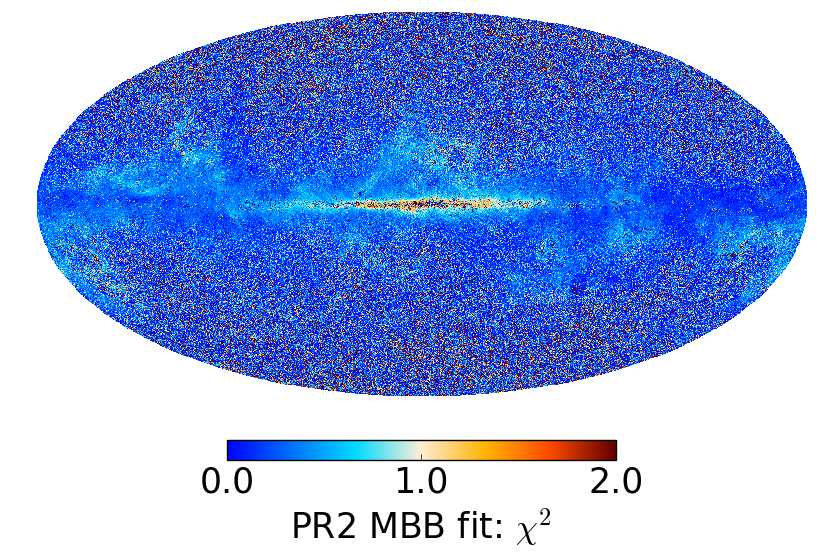
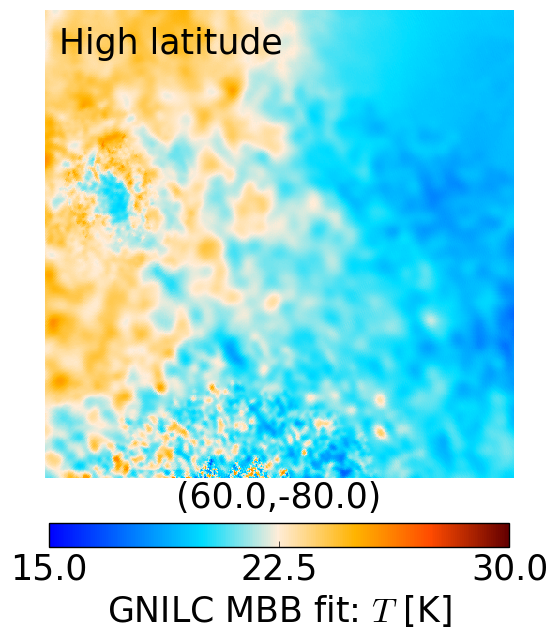
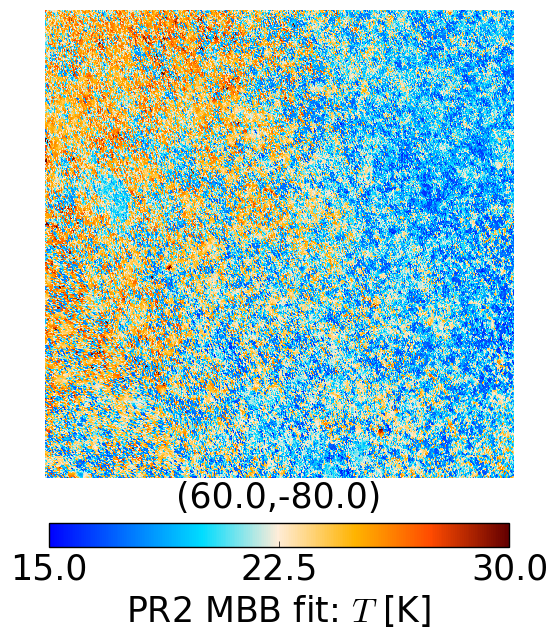
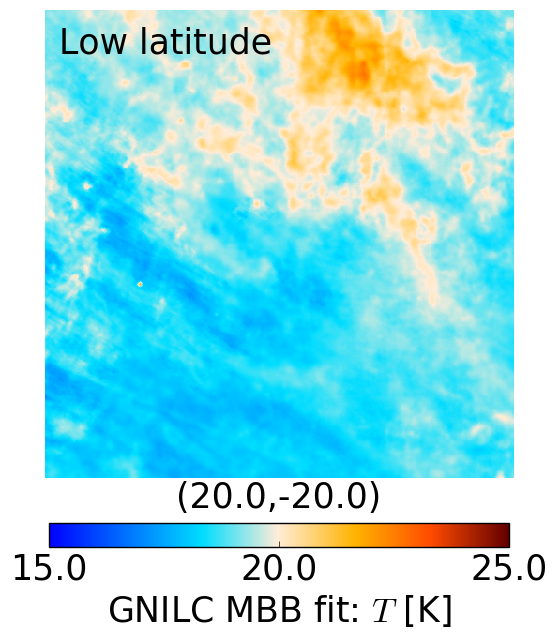
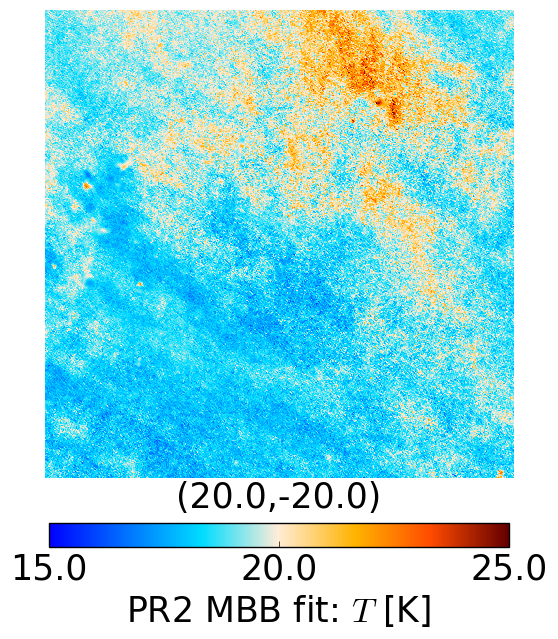
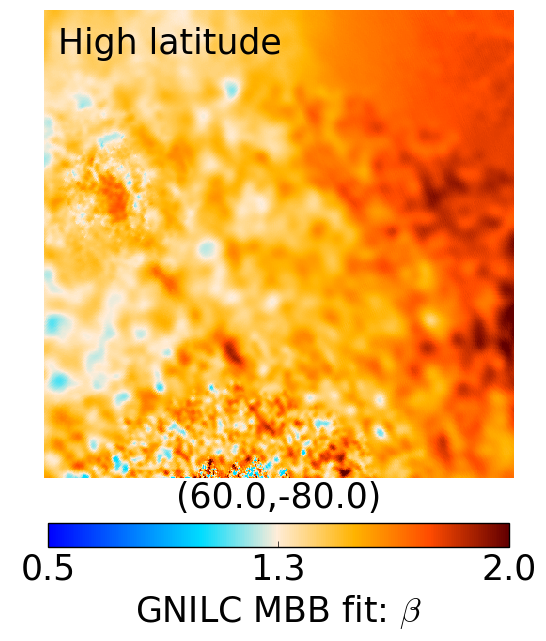
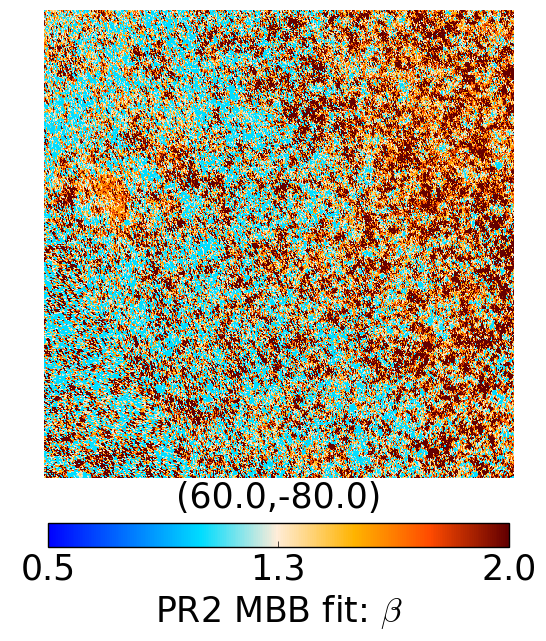
The results of the MBB fit to the GNILC dust maps are shown on the left panels of Fig. 7. The estimated GNILC temperature map and GNILC spectral index map are compared to the PR2 MBB fit temperature map and the PR2 MBB fit spectral index map at resolution. The PR2 MBB fit is similar to the dust model P13 of Planck Collaboration XI (2014), i.e., the CIB anisotropies have not been filtered out, except that the model fitting is applied to the PR2 data instead of the PR1 data and not performed in two steps, but carried out simultaneously for the three dust parameters at resolution. The impact of the CIB contamination on the measurement of the dust temperature and dust spectral index is particularly significant at high latitude in the PR2 MBB fit.
In the bottom panels of Fig. 7, we plot the resulting map of both the GNILC MBB fit and the PR2 MBB fit. This provides a direct measurement of the goodness-of-fit. The reason for some reduced values being smaller than unity is mostly due to the fact that calibration uncertainties are included per pixel in the fit, to give less weight to data points with larger uncertainty (Planck Collaboration XI 2014). However, the exact scale of is not relevant here, what is important is that the pixel-to-pixel differences in the goodness-of-fit are strongly reduced for the GNILC MBB fit because of the removal of the CIB contamination in the GNILC dust maps. Clearly, the CIB-filtered GNILC maps lead to a better fitting of the MBB model over the sky than the unfiltered PR2 maps. Near the Galactic plane, the values between the GNILC MBB fit and the unfiltered PR2 MBB fit are consistent because the CIB contamination plays a negligible role where the dust emission is bright. For a given spectral model of thermal dust, here a single MBB model, because of the removal of CIB fluctuations prior to fitting, the GNILC maps provide higher precision than the unfiltered PR2 maps. However, the MBB model might not be the best parametrization of the thermal dust emission in the inner Galactic plane region, which shows high values of the statistic for both PR2 and GNILC fits. It is likely that multiple MBB components of dust might contribute to the emission along the line of sight, in which case the exact parametrization of the thermal dust spectral energy distribution in the inner Galactic plane region is not trivial and might need more than three effective parameters.
In Figs. 8 and 9 we compare the GNILC and PR2 MBB fit for temperature and spectral index respectively, at low and high latitudes in the sky. The improvement from GNILC in terms of the reduction of the CIB contamination is particularly visible at high latitude for both temperature and spectral index.
In Fig. 10 we define low- and high-latitude areas of the sky to look at the evolution of the distribution of the dust temperature and spectral index with respect to latitude. Figure 11 shows the normalized histograms of the temperature map, , and the spectral index map, , for three different fits: GNILC (red contours); PR2 MBB fit a la model P13 (green contours); and dust model P15 (blue contours). Note that the dust model P15 is a low-resolution Bayesian fit at resolution with Gaussian priors on ( K) and (). We distinguish three areas in the sky: the high-latitude area defined in Fig. 10, covering % of the sky (top panels); the low-latitude area defined in Fig. 10, covering % of the sky (middle panels); and the whole sky (bottom panels). As a complement to Fig. 11, Table 1 summarizes the mean best-fit values of the dust parameters, along with their errors, for the three different products (GNILC MBB fit, PR2 MBB fit similar to the dust model P13, and dust model P15) in the three different areas of the sky. The histograms in Fig. 11 highlight the impact of the CIB anisotropies on the dust spectral parameters: at high latitude the CIB contamination increases the scatter in the temperature and spectral index distributions. The removal of the CIB anisotropies with GNILC reduces the dispersion in the dust temperature by % at high latitude ( % on the whole sky) with respect to the PR2 MBB fit and by % with respect to the dust model P15 (Table 1), even though the P15 temperature fit is smoothed to resolution. The impact of the CIB removal with GNILC is even more significant for the dust spectral index, with the dispersion reduced by % at high latitude ( % on the whole sky) with respect to the PR2 MBB fit. The error on the P15 spectral index has a lowest value of 0.05 in any area of the sky for two reasons: first, the resolution of the P15 spectral index is much lower (); second, a tight prior has been imposed on in the Commander fit (Planck Collaboration X 2016). With GNILC we find a dust temperature of K and a dust spectral index of as the best-fit values on the whole sky, where the error bars show the dispersion over the sky of the parameter values.
5 GNILC results on the CIB
5.1 CIB maps
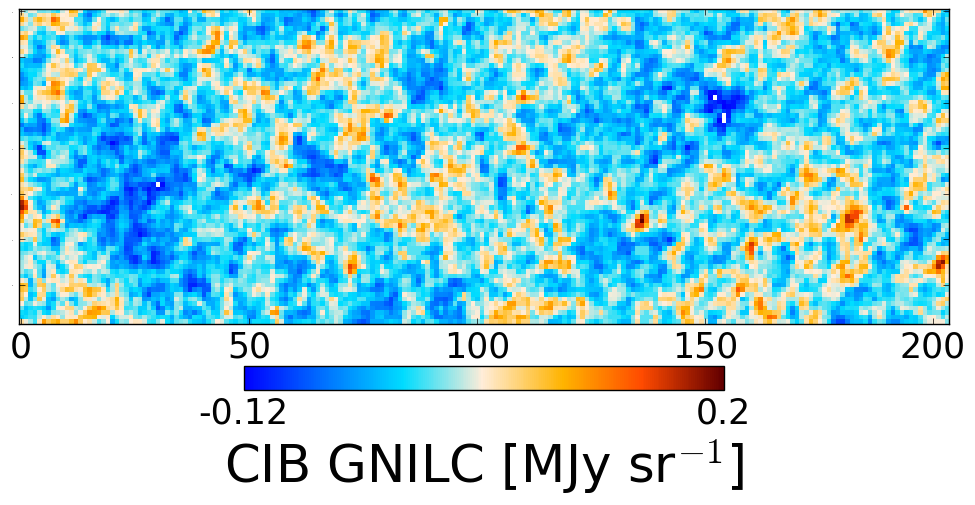


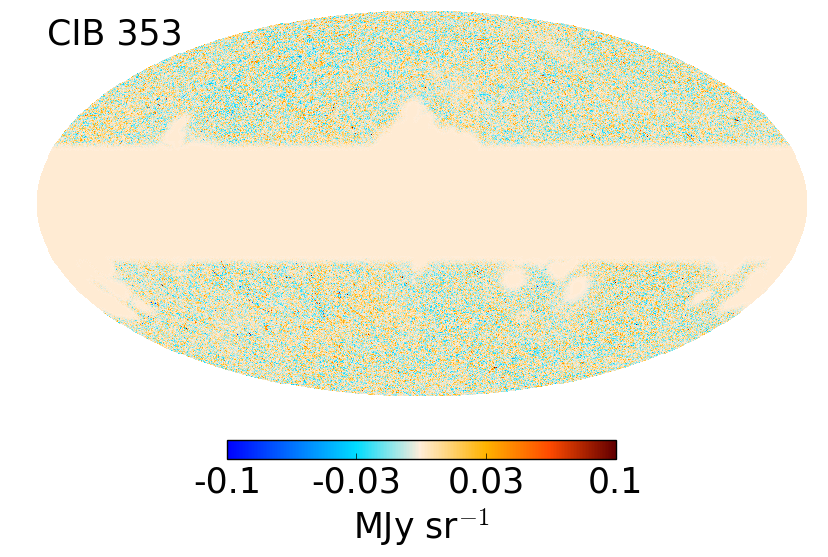
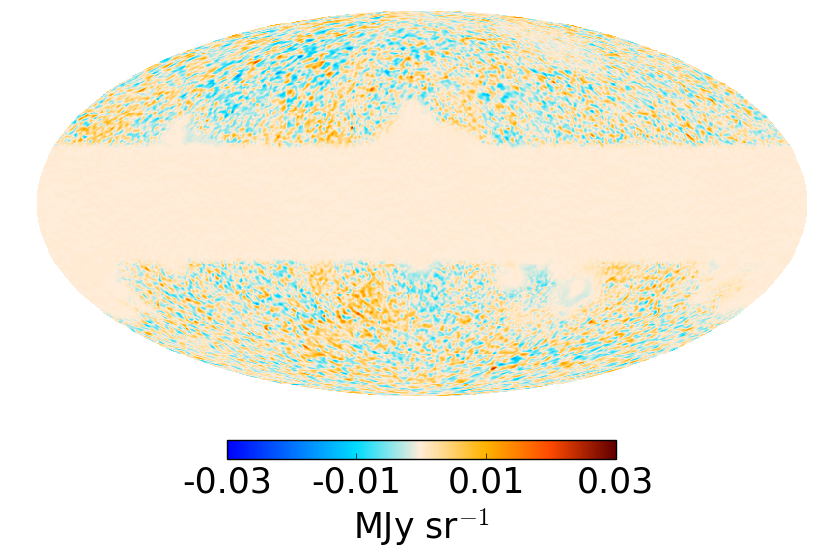
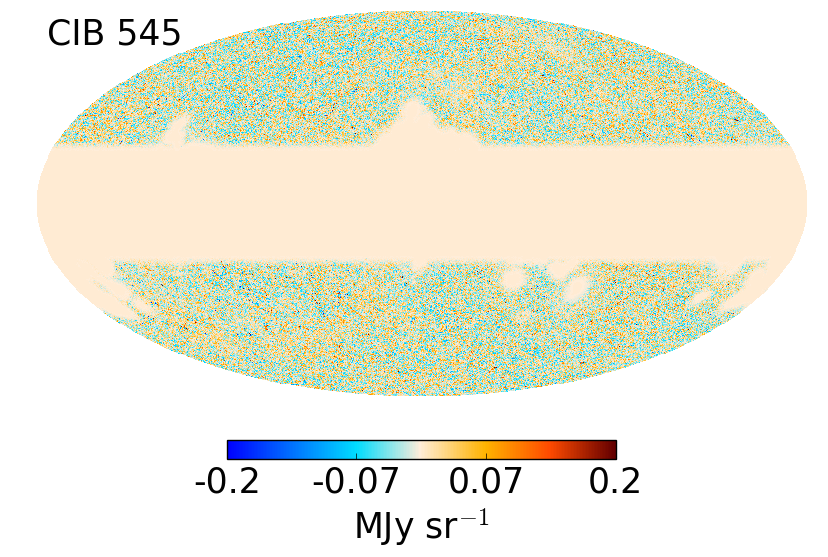
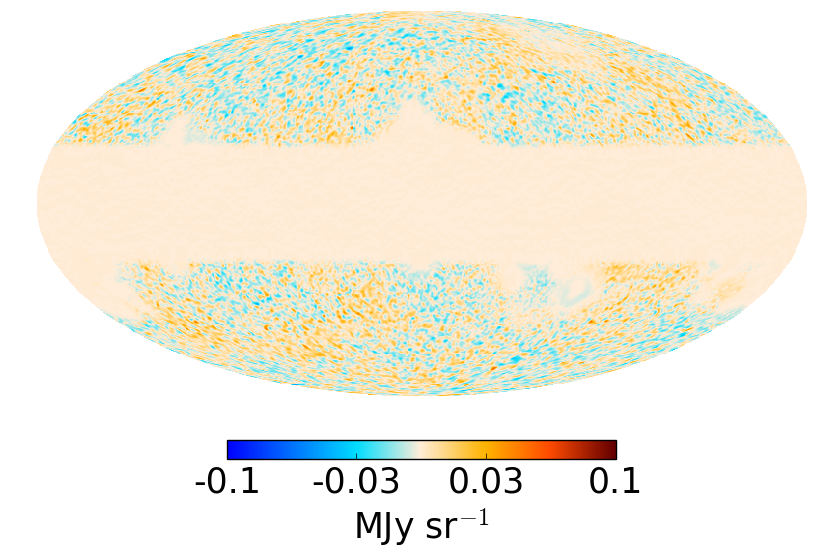
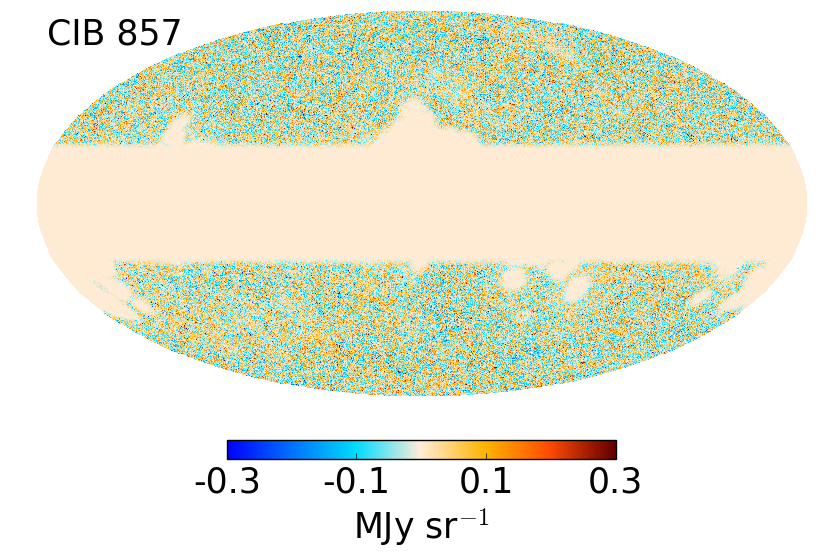
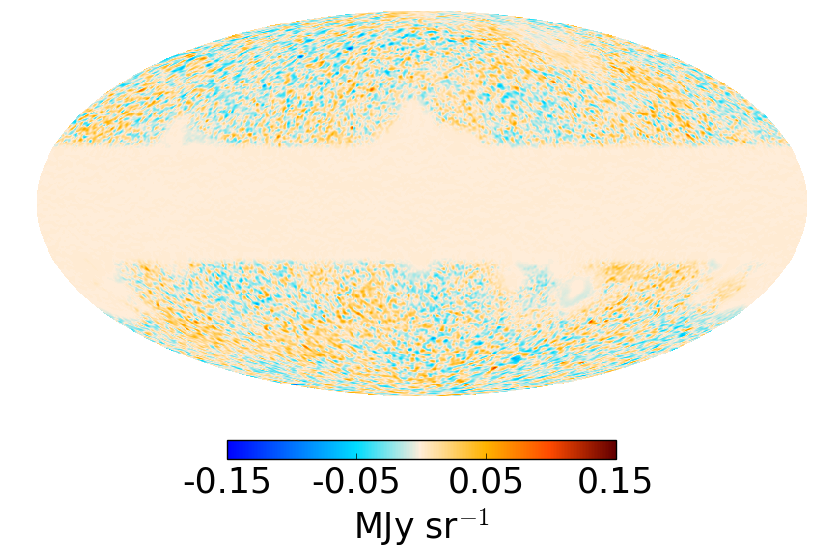
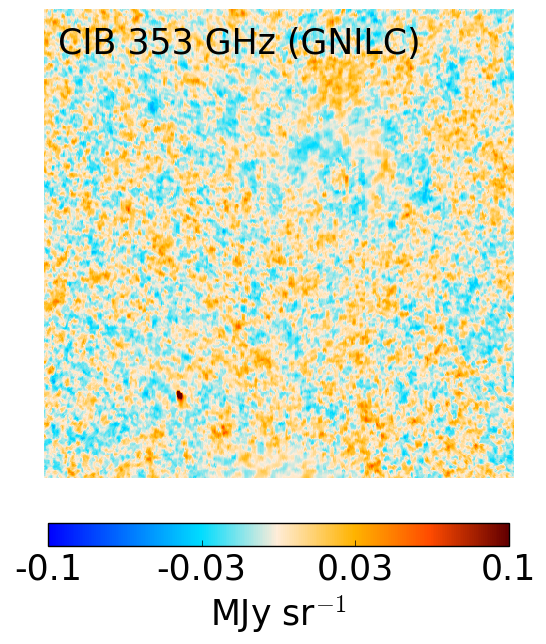
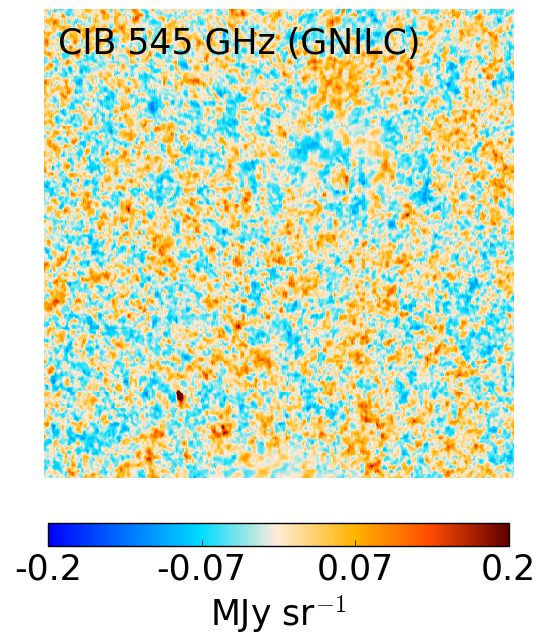
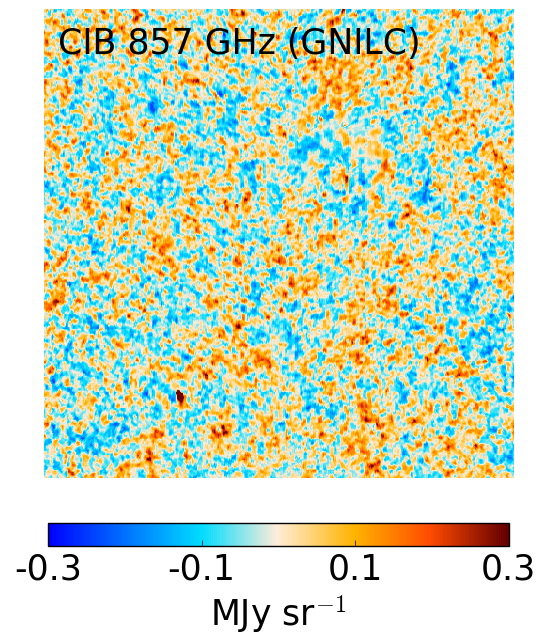
The GNILC method is flexible by allowing either the recovery of the dust map with the CIB-plus-CMB-plus-noise filtered out (shown in this paper) or the recovery of the dust-plus-CIB map with the removal of the CMB-plus-noise only, depending on whether or not one uses the prior on the CIB power spectrum. Therefore, from the difference between the unfiltered GNILC dust-plus-CIB map and the CIB-filtered GNILC dust map we are able to reveal the CIB anisotropies at different frequencies over a large area of the sky. The resulting GNILC CIB maps at , , and GHz, reconstructed over a large fraction of the sky, are shown in Fig. 12, both at full resolution and smoothed to resolution. We can see residual zodiacal light emission along the ecliptic plane in the low-resolution CIB maps. This residual comes from the combination by GNILC of different data sets, namely the Planck, IRAS, and SFD maps, in which the zodiacal light has been corrected differently. The zodiacal light emission has been reduced in Planck data to a negligible level compared to the CMB and dust emissions but is still at a level comparable to the amplitude of the CIB emission.
The GNILC products give us access to the CIB anisotropies on a much larger fraction of the sky (approximately 57 %) than the Planck CIB maps produced in Planck Collaboration XXX (2014). The GNILC CIB maps can be used as tracers of the dark matter distribution because they allow for an exploration over large areas of the sky of the cross-correlations between CIB and CMB lensing fields (Planck Collaboration XVIII 2014) or between CIB and other tracers of large-scale structure (Serra et al. 2014).
In Fig. 13 we show the GNILC CIB maps at , , and GHz in a high-latitude region of the sky centred at . The partial spatial correlation of the CIB anisotropies between pairs of frequencies decreases when the ratio between the two frequencies is further from unity, as expected from the redshift distribution of the CIB anisotropies (Planck Collaboration XXX 2014).
5.2 GNILC CIB versus CIB 2013 in small fields
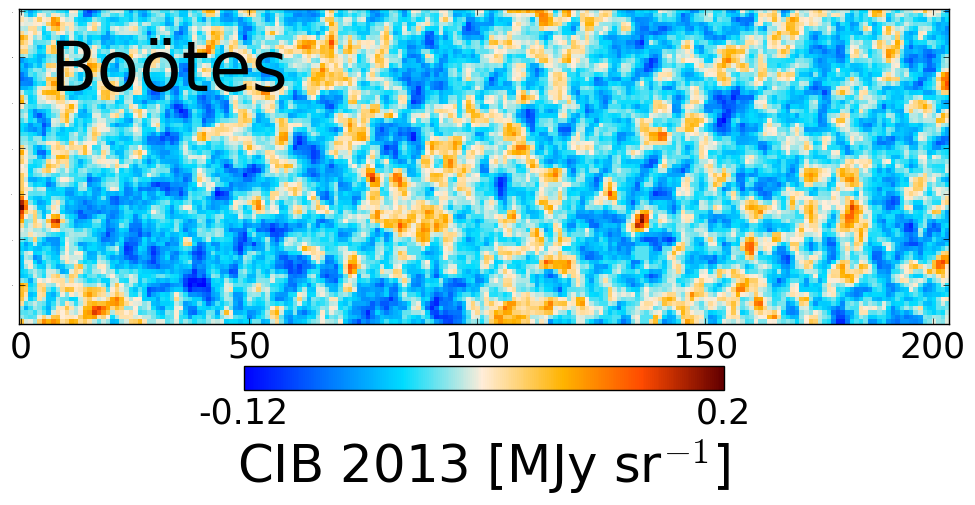
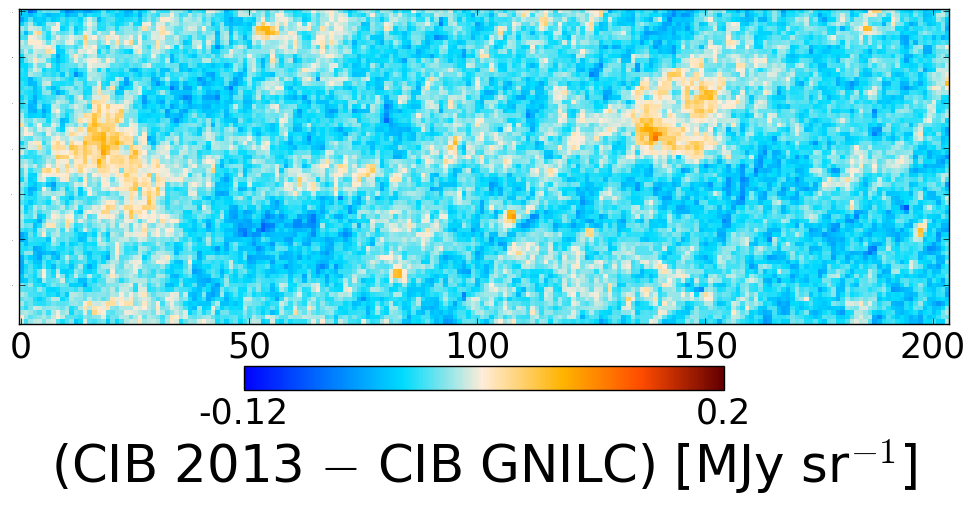
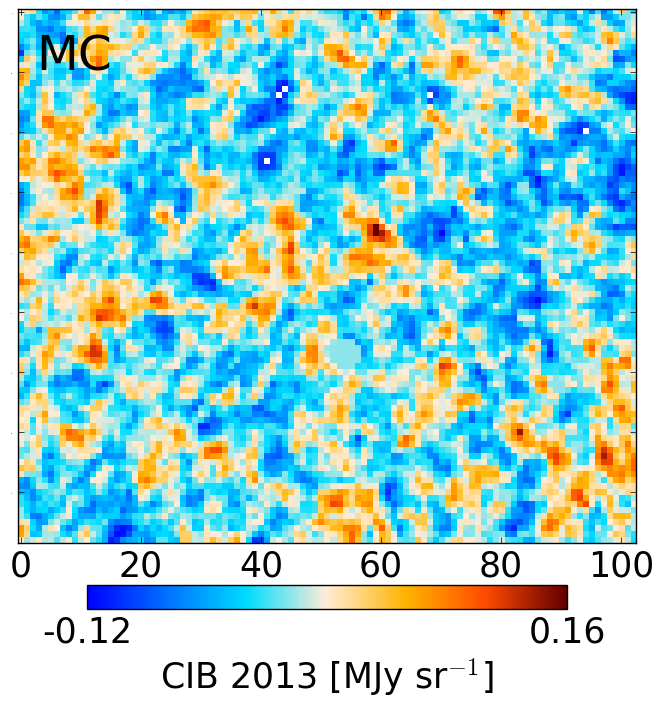
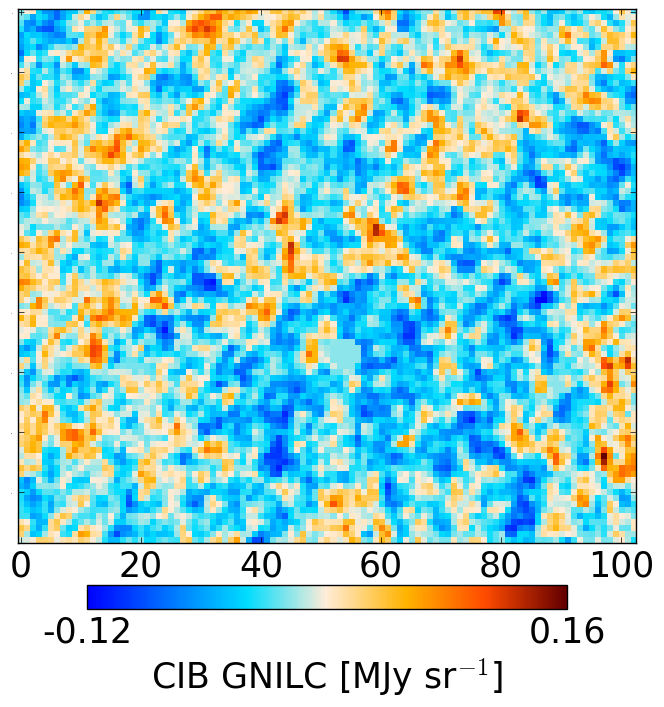
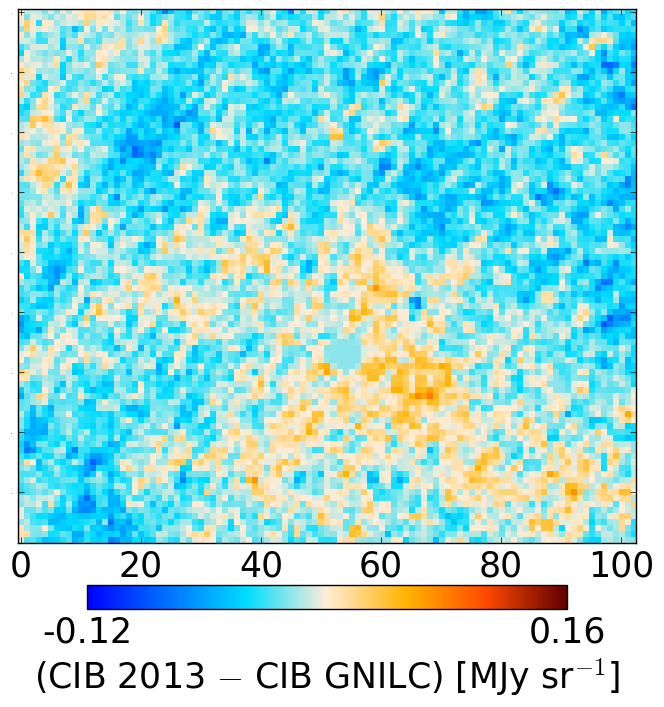
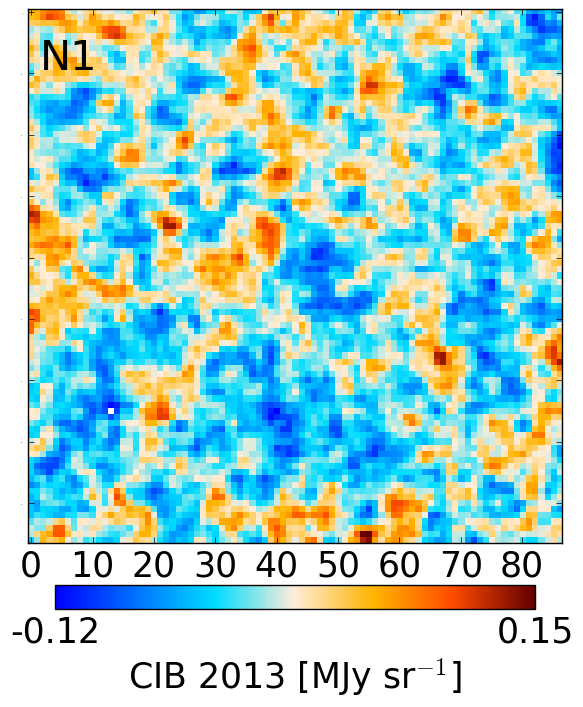
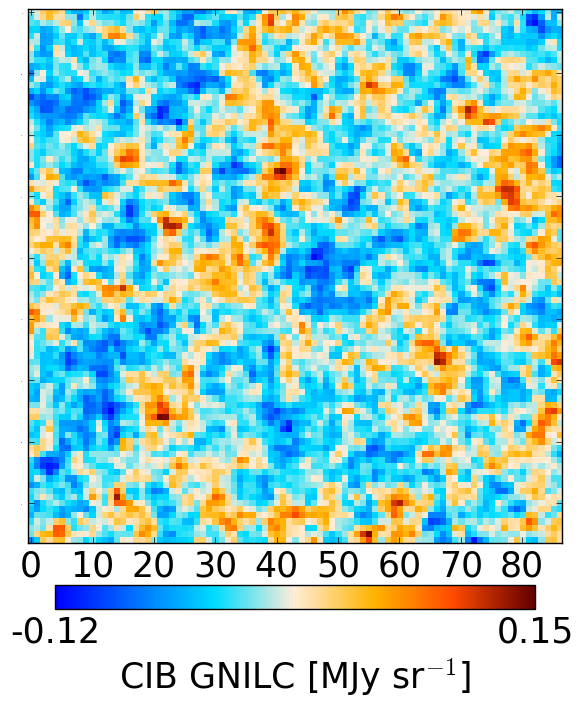
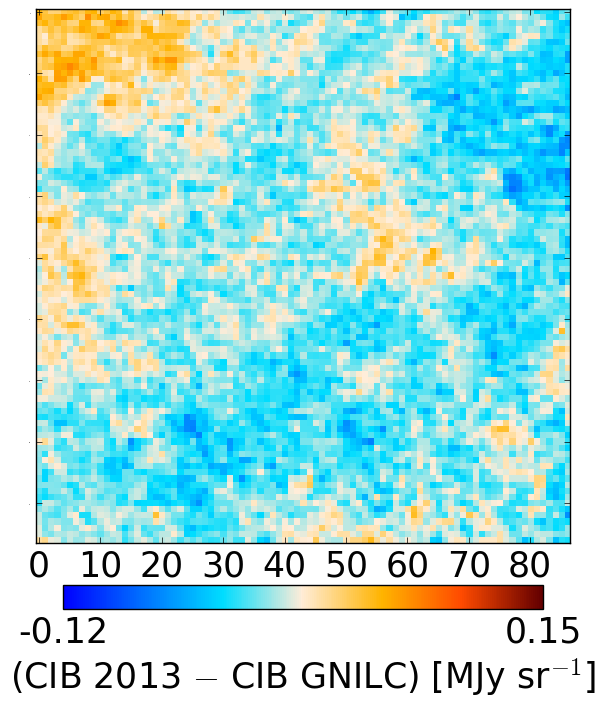
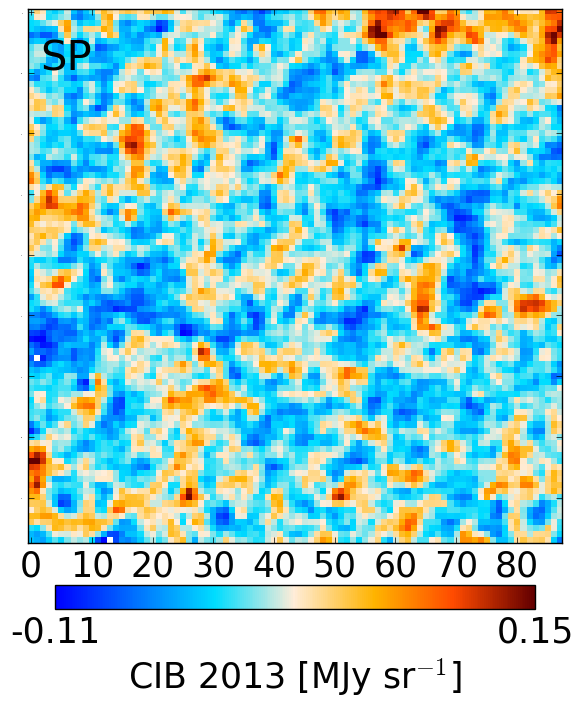
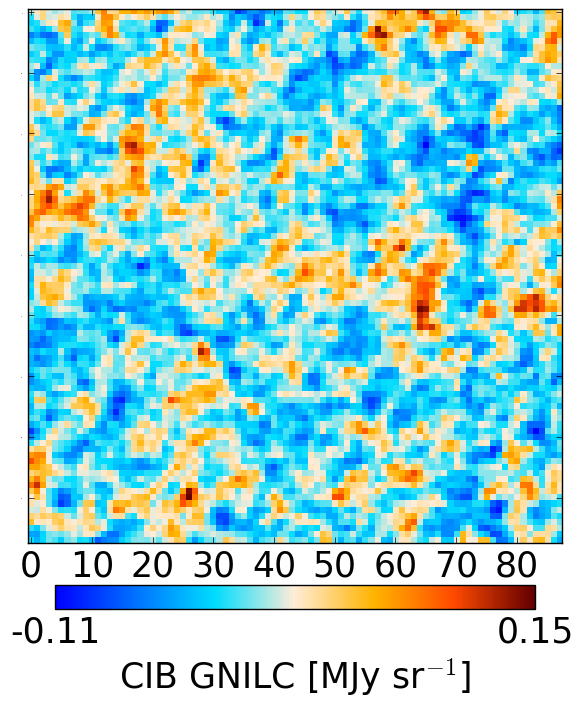
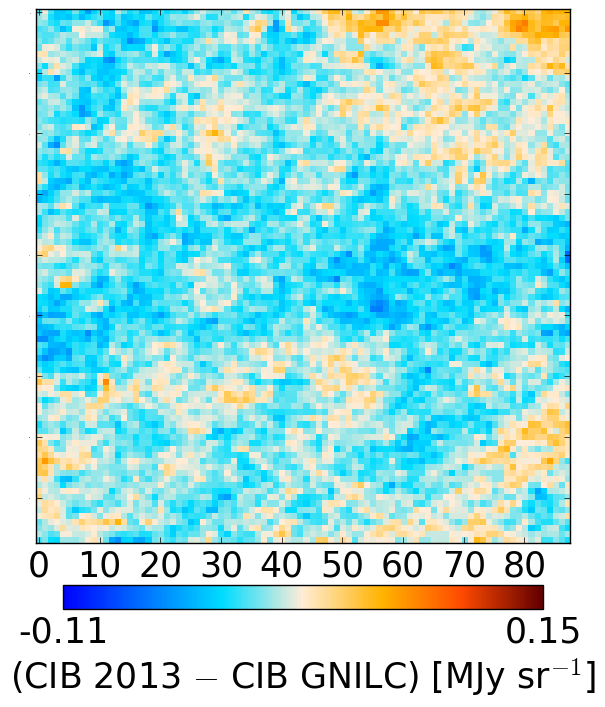
We now check the consistency between the new GNILC CIB maps and the CIB 2013 maps from Planck Collaboration XXX (2014). In Fig. 14, we compare the GNILC CIB map at GHz with the CIB 2013 map at GHz in four different fields of the Green Bank Telescope H i Intermediate Galactic Latitude Survey (GHIGLS) defined in Martin et al. (2015): Boötes, MC, N1, and SP. The difference map (CIB 2013 GNILC CIB) is also shown within the same fields. In Fig. 15 we plot the – correlation between the GNILC CIB map and the CIB 2013 map in the common fields. We have used a least-squares bisector linear regression (Isobe et al. 1990) for computing the correlation coefficient between both products.
Figures 14 and 15 show that the GNILC CIB maps are consistent with the CIB 2013 maps within the fields considered. In particular the Pearson correlation coefficient between the GNILC CIB maps and the CIB 2013 maps is larger than in all fields, with a – slope of in the Boötes field, in the MC field, in the N1 field, and in the SP field. Despite the high correlation between the GNILC CIB maps and the CIB 2013 maps within the GHIGLS fields, the correlation is not perfect because both sets of maps were produced from different data releases, respectively PR2 and PR1, for which there have been changes in the calibration coefficients. In addition, estimates of the optical beam resolution have slightly changed between both data releases, therefore not guaranteeing the exact same resolution of both CIB products.
6 Correlations of the CIB and dust maps with the H i map
In the diffuse interstellar medium the dust emission is tightly correlated with the line emission of neutral hydrogen (H i). In this respect, as a tracer of the Galactic dust emission the H i emission map can be used to detect any residual Galactic dust emission in the GNILC CIB maps.
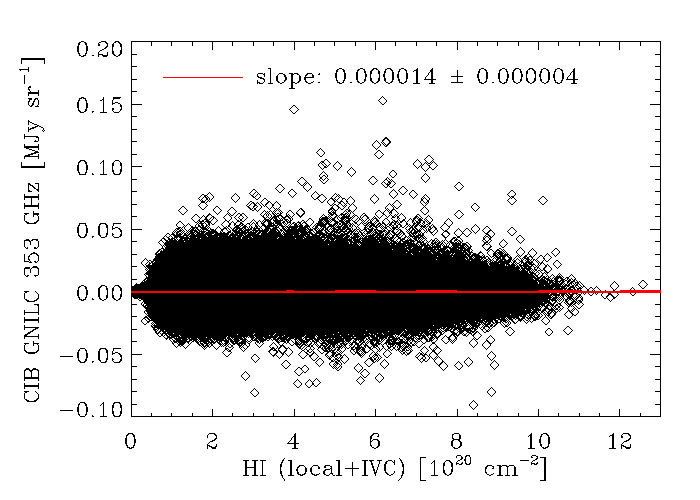
We compute the – correlation between the H i map (local plus intermediate velocity clouds) of the LAB survey (Kalberla et al. 2005; Land & Slosar 2007) and the GNILC CIB maps in order to detect any Galactic residual in the reconstructed CIB maps. Figure 16 shows that the correlation between the GNILC CIB map at GHz and the H i map is consistent with zero (Pearson correlation coefficient of ), therefore showing no significant residual Galactic emission in the GNILC CIB map.
We also compute the – correlation between the dust map at GHz and the H i map at high Galactic latitude. The high latitude region is defined as the area of the sky where the local beam FWHM of the GNILC dust map is larger than (Fig. 2). The maps are degraded to HEALPix .
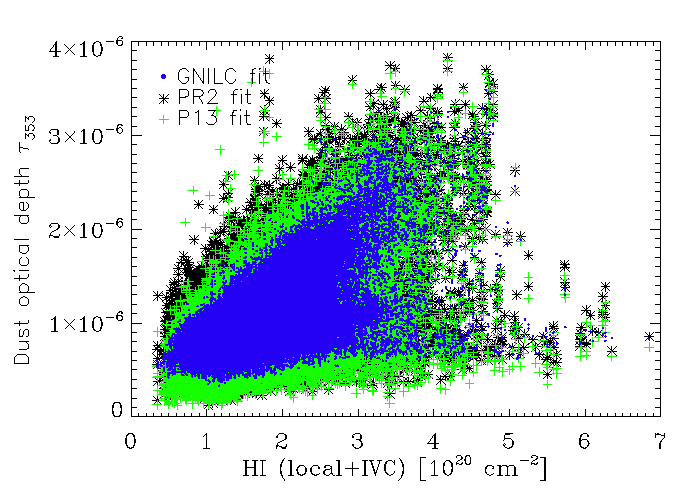
Figure 17 shows the scatter plot between the H i map and the dust optical depth map for the dust model P13 (green), the PR2 MBB fit (black), and the CIB-filtered GNILC MBB fit (blue). The PR2 MBB fit shows larger scatter than the dust model P13 because in the former the fit is performed in one step at resolution for all three dust parameters, while in the latter the fit was performed in two steps, with the spectral index first fitted at lower resolution (), which slightly reduces the scatter due to CIB contamination. Due to the large reduction of the CIB contamination in the GNILC maps, the correlation with the H i shows the most reduced scatter.
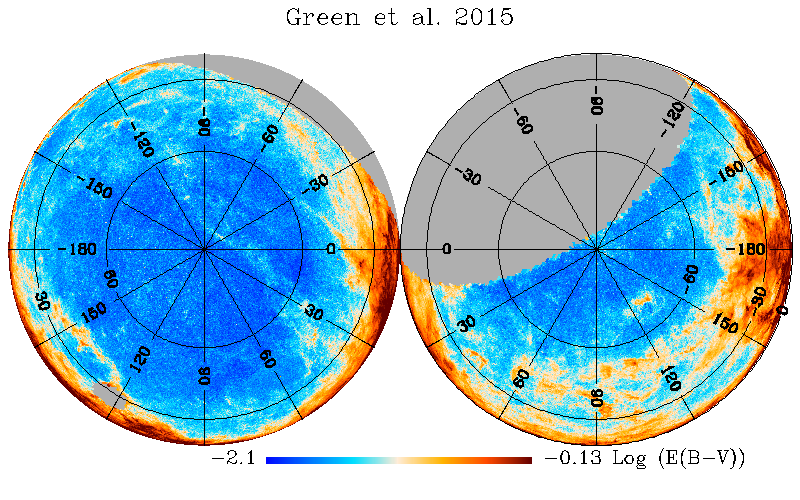
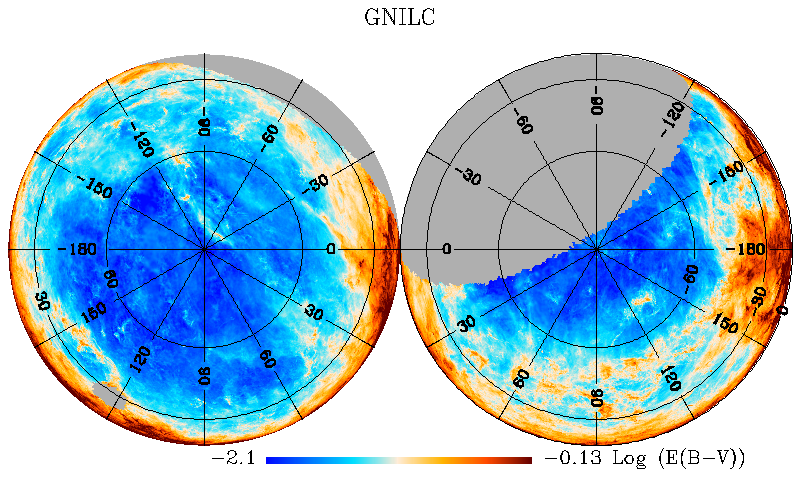

The particles producing thermal dust emission also cause extinction of the light from stars and quasars, which is quantified by Galactic reddening, . We develop a GNILC reddening map by multiplying the GNILC dust optical depth map, , by the factor mag derived in Planck Collaboration XI (2014) from the correlation between the reddening of quasars and dust optical depth along the same line of sight. Recently, Green et al. (2015) have produced a three-dimensional dust reddening map based on stars in the Pan-STARRS 1 survey. We projected their three-dimensional dust reddening into a two-dimensional map by computing the median reddening in the farthest distance bin. Figure 18 compares this with the GNILC map, focusing on common area in the north and south Galactic caps where the gas column density is low. Although it shows spatial structure similar to the GNILC map, the map from Green et al. (2015) is noisier. Just as there is a good correlation of and the H i gas column density, , the correlation of reddening and has been long established (e.g., Savage & Jenkins 1972). To explore this further for the low column density area of the sky defined in Fig. 10, in Fig. 19 we plot the ratio binned with respect to for both GNILC and the reddening map from Green et al. (2015). For GNILC the trend with is quite flat; the horizontal line plotted is compatible with the behaviour for the opacity found in Planck Collaboration XI (2014) over the same range in (see their Figure 20). On the other hand, for the map from Green et al. (2015) we see a strong dependence of the ratio on , i.e., a lack of linearity between this measure of and . The binned results from the map of Green et al. (2015) also show a larger dispersion. From these three perspectives, the GNILC optical depth map appears to provide a better template for studies. Note that both products show an excess ratio at the lowest column densities (); this could be the signature of dust mixed with ionized hydrogen, which is not traced by neutral H i emission (see discussion in Planck Collaboration XI 2014).
7 Conclusions
We have produced a significantly improved all-sky map of the Galactic thermal dust emission from the Planck data and the IRAS 100 m map. We have fitted a modified blackbody model in each pixel to the GNILC dust maps produced at 353, 545, 857, and 3000 GHz. The new Planck GNILC dust model has been compared with the dust models P13 and P15 and has been shown to be significantly less contaminated by CIB and noise.
By exploiting the distinct signature of Galactic dust and extragalactic CIB angular power spectra, the GNILC method successfully separates the Galactic thermal dust emission from the CIB anisotropies in the Planck PR2 maps.
We have reduced the dispersion due to CIB contamination of the estimated dust temperature and spectral index in the GNILC dust map with respect to the P13 dust map by a factor 1.3 for on the whole sky (1.6 at high latitude) and a factor 2.1 for on the whole sky (2.6 at high latitude).
The GNILC dust map at GHz has already been implemented as the thermal dust model in the released Planck simulations of the sky (Planck Collaboration XII 2016).
The GNILC method, presented in this work, also gives access to the CIB anisotropies over a large fraction of the sky. Within the small fields considered in Planck Collaboration XXX (2014), the GNILC CIB maps and the CIB 2013 maps are found to be consistent with a Pearson correlation coefficient larger than . The GNILC CIB maps can be very useful as indirect tracers of the dark matter over a large area of the sky and they are recommended for the investigation of cross-correlations with galaxy weak lensing data and other tracers of large-scale structure.
The new Planck GNILC products are made publicly available on the Planck Legacy Archive.333http://pla.esac.esa.int/pla They include:
-
•
the CIB-removed GNILC thermal dust maps at , , and GHz;
-
•
the GNILC CIB maps at , , and GHz;
-
•
the GNILC dust optical depth map;
-
•
the GNILC dust spectral index map;
-
•
the GNILC dust temperature map;
-
•
the GNILC effective beam map for the thermal dust.
Acknowledgements.
The Planck Collaboration acknowledges the support of: ESA; CNES, and CNRS/INSU-IN2P3-INP (France); ASI, CNR, and INAF (Italy); NASA and DoE (USA); STFC and UKSA (UK); CSIC, MINECO, JA, and RES (Spain); Tekes, AoF, and CSC (Finland); DLR and MPG (Germany); CSA (Canada); DTU Space (Denmark); SER/SSO (Switzerland); RCN (Norway); SFI (Ireland); FCT/MCTES (Portugal); ERC and PRACE (EU). A description of the Planck Collaboration and a list of its members, indicating which technical or scientific activities they have been involved in, can be found at http://www.cosmos.esa.int/web/planck/planck-collaboration. Some of the results in this paper have been derived using the HEALPix package. The research leading to these results has received funding from the ERC Grant no. 307209.References
- Akaike (1974) Akaike, H., A New Look at the Statistical Model Identification. 1974, IEEE Transactions on Automatic Control, 19, 716
- Basak & Delabrouille (2012) Basak, S. & Delabrouille, J., A needlet internal linear combination analysis of WMAP 7-year data: estimation of CMB temperature map and power spectrum. 2012, MNRAS, 419, 1163, 1106.5383
- Basak & Delabrouille (2013) Basak, S. & Delabrouille, J., A needlet ILC analysis of WMAP 9-year polarization data: CMB polarization power spectra. 2013, MNRAS, 435, 18
- Bennett et al. (2003) Bennett, C. L., Hill, R. S., Hinshaw, G., et al., First-Year Wilkinson Microwave Anisotropy Probe (WMAP) Observations: Foreground Emission. 2003, ApJS, 148, 97, astro-ph/0302208
- BICEP2/Keck Array and Planck Collaborations (2015) BICEP2/Keck Array and Planck Collaborations, Joint Analysis of BICEP2/Keck Array and Planck Data. 2015, Phys. Rev. Lett., 114, 101301, 1502.00612
- Cardoso et al. (2008) Cardoso, J., Martin, M., Delabrouille, J., Betoule, M., & Patanchon, G., Component separation with flexible models. Application to the separation of astrophysical emissions. 2008, IEEE Journal of Selected Topics in Signal Processing, 2, 735, special issue on Signal Processing for Astronomical and Space Research Applications
- Delabrouille et al. (2013) Delabrouille, J., Betoule, M., Melin, J.-B., et al., The pre-launch Planck Sky Model: a model of sky emission at submillimetre to centimetre wavelengths. 2013, A&A, 553, A96, 1207.3675
- Delabrouille et al. (2009) Delabrouille, J., Cardoso, J., Le Jeune, M., et al., A full sky, low foreground, high resolution CMB map from WMAP. 2009, A&A, 493, 835, 0807.0773
- Delabrouille et al. (2003) Delabrouille, J., Cardoso, J.-F., & Patanchon, G., Multidetector multicomponent spectral matching and applications for cosmic microwave background data analysis. 2003, MNRAS, 346, 1089, astro-ph/0211504
- Draine & Li (2007) Draine, B. T. & Li, A., Infrared Emission from Interstellar Dust. IV. The Silicate-Graphite-PAH Model in the Post-Spitzer Era. 2007, ApJ, 657, 810, astro-ph/0608003
- Eriksen et al. (2008) Eriksen, H. K., Jewell, J. B., Dickinson, C., et al., Joint Bayesian Component Separation and CMB Power Spectrum Estimation. 2008, ApJ, 676, 10, 0709.1058
- Gispert et al. (2000) Gispert, R., Lagache, G., & Puget, J. L., Implications of the cosmic infrared background for light production and the star formation history in the Universe. 2000, A&A, 360, 1, astro-ph/0005554
- Górski et al. (2005) Górski, K. M., Hivon, E., Banday, A. J., et al., HEALPix: A Framework for High-Resolution Discretization and Fast Analysis of Data Distributed on the Sphere. 2005, ApJ, 622, 759, astro-ph/0409513
- Green et al. (2015) Green, G. M., Schlafly, E. F., Finkbeiner, D. P., et al., A Three-dimensional Map of Milky Way Dust. 2015, ApJ, 810, 25, 1507.01005
- Guilloux et al. (2009) Guilloux, F., Faÿ, G., & Cardoso, J.-F., Practical wavelet design on the sphere. 2009, Appl. Comput. Harmon. Anal., 26, 143
- Isobe et al. (1990) Isobe, T., Feigelson, E. D., Akritas, M. G., & Babu, G. J., Linear regression in astronomy. 1990, ApJ, 364, 104
- Kalberla et al. (2005) Kalberla, P. M. W., Burton, W. B., Hartmann, D., et al., The Leiden/Argentine/Bonn (LAB) Survey of Galactic HI. Final data release of the combined LDS and IAR surveys with improved stray-radiation corrections. 2005, A&A, 440, 775, astro-ph/0504140
- Kelsall et al. (1998) Kelsall, T., Weiland, J. L., Franz, B. A., et al., The COBE Diffuse Infrared Background Experiment Search for the Cosmic Infrared Background. II. Model of the Interplanetary Dust Cloud. 1998, ApJ, 508, 44, astro-ph/9806250
- Kullback (1968) Kullback, S. 1968, Information theory and statistics
- Lagache et al. (2005) Lagache, G., Puget, J.-L., & Dole, H., Dusty Infrared Galaxies: Sources of the Cosmic Infrared Background. 2005, ARA&A, 43, 727, astro-ph/0507298
- Land & Slosar (2007) Land, K. & Slosar, A., Correlation between galactic HI and the cosmic microwave background. 2007, Phys. Rev. D, 76, 087301, 0706.1703
- Martin et al. (2015) Martin, P. G., Blagrave, K. P. M., Lockman, F. J., et al., GHIGLS: H I Mapping at Intermediate Galactic Latitude Using the Green Bank Telescope. 2015, ApJ, 809, 153, 1504.07723
- Miville-Deschênes & Lagache (2005) Miville-Deschênes, M.-A. & Lagache, G., IRIS: A New Generation of IRAS Maps. 2005, ApJS, 157, 302, astro-ph/0412216
- Narcowich et al. (2006) Narcowich, F., Petrushev, P., & Ward, J. 2006, SIAM J. Math. Anal., 38, 574
- Olivari et al. (2016) Olivari, L. C., Remazeilles, M., & Dickinson, C., Extracting H I cosmological signal with generalized needlet internal linear combination. 2016, MNRAS, 456, 2749, 1509.00742
- Onaka et al. (2008) Onaka, P., Tonry, J. L., Isani, S., et al. 2008, in Proc. SPIE, Vol. 7014, Ground-based and Airborne Instrumentation for Astronomy II, 70140D
- Planck Collaboration XVIII (2011) Planck Collaboration XVIII, Planck early results. XVIII. The power spectrum of cosmic infrared background anisotropies. 2011, A&A, 536, A18, 1101.2028
- Planck Collaboration XIX (2011) Planck Collaboration XIX, Planck early results. XIX. All-sky temperature and dust optical depth from Planck and IRAS. Constraints on the “dark gas” in our Galaxy. 2011, A&A, 536, A19, 1101.2029
- Planck Collaboration XI (2014) Planck Collaboration XI, Planck 2013 results. XI. All-sky model of thermal dust emission. 2014, A&A, 571, A11, 1312.1300
- Planck Collaboration XII (2014) Planck Collaboration XII, Planck 2013 results. XII. Diffuse component separation. 2014, A&A, 571, A12, 1303.5072
- Planck Collaboration XIV (2014) Planck Collaboration XIV, Planck 2013 results. XIV. Zodiacal emission. 2014, A&A, 571, A14, 1303.5074
- Planck Collaboration XV (2014) Planck Collaboration XV, Planck 2013 results. XV. CMB power spectra and likelihood. 2014, A&A, 571, A15, 1303.5075
- Planck Collaboration XVIII (2014) Planck Collaboration XVIII, Planck 2013 results. XVIII. The gravitational lensing-infrared background correlation. 2014, A&A, 571, A18, 1303.5078
- Planck Collaboration XXX (2014) Planck Collaboration XXX, Planck 2013 results. XXX. Cosmic infrared background measurements and implications for star formation. 2014, A&A, 571, A30, 1309.0382
- Planck Collaboration VI (2016) Planck Collaboration VI, Planck 2015 results. VI. LFI maps. 2016, A&A, in press, 1502.01585
- Planck Collaboration VIII (2016) Planck Collaboration VIII, Planck 2015 results. VIII. High Frequency Instrument data processing: Calibration and maps. 2016, A&A, in press, 1502.01587
- Planck Collaboration X (2016) Planck Collaboration X, Planck 2015 results. X. Diffuse component separation: Foreground maps. 2016, A&A, in press, 1502.01588
- Planck Collaboration XII (2016) Planck Collaboration XII, Planck 2015 results. XII. Full Focal Plane simulations. 2016, A&A, in press, 1509.06348
- Planck Collaboration XXII (2016) Planck Collaboration XXII, Planck 2015 results. XXII. A map of the thermal Sunyaev-Zeldovich effect. 2016, A&A, in press, 1502.01596
- Planck Collaboration XXVI (2016) Planck Collaboration XXVI, Planck 2015 results. XXVI. The Second Planck Catalogue of Compact Sources. 2016, A&A, in press, 1507.02058
- Planck Collaboration Int. XVII (2014) Planck Collaboration Int. XVII, Planck intermediate results. XVII. Emission of dust in the diffuse interstellar medium from the far-infrared to microwave frequencies. 2014, A&A, 566, A55, 1312.5446
- Planck Collaboration Int. XXVIII (2015) Planck Collaboration Int. XXVIII, Planck intermediate results. XXVIII. Interstellar gas and dust in the Chamaeleon clouds as seen by Fermi LAT and Planck. 2015, A&A, 582, A31, 1409.3268
- Planck Collaboration Int. XXX (2016) Planck Collaboration Int. XXX, Planck intermediate results. XXX. The angular power spectrum of polarized dust emission at intermediate and high Galactic latitudes. 2016, A&A, 586, A133, 1409.5738
- Planck Collaboration Int. XXXII (2016) Planck Collaboration Int. XXXII, Planck intermediate results. XXXII. The relative orientation between the magnetic field and structures traced by interstellar dust. 2016, A&A, 586, A135, 1409.6728
- Puget et al. (1996) Puget, J.-L., Abergel, A., Bernard, J.-P., et al., Tentative detection of a cosmic far-infrared background with COBE. 1996, A&A, 308, L5
- Remazeilles et al. (2013) Remazeilles, M., Aghanim, N., & Douspis, M., Reconstruction of high-resolution Sunyaev-Zeldovich maps from heterogeneous data sets using needlets. 2013, MNRAS, 430, 370, 1207.4683
- Remazeilles et al. (2011a) Remazeilles, M., Delabrouille, J., & Cardoso, J.-F., CMB and SZ effect separation with constrained Internal Linear Combinations. 2011a, MNRAS, 410, 2481, 1006.5599
- Remazeilles et al. (2011b) Remazeilles, M., Delabrouille, J., & Cardoso, J.-F., Foreground component separation with generalized Internal Linear Combination. 2011b, MNRAS, 418, 467, 1103.1166
- Remazeilles et al. (2015) Remazeilles, M., Dickinson, C., Banday, A. J., Bigot-Sazy, M.-A., & Ghosh, T., An improved source-subtracted and destriped 408-MHz all-sky map. 2015, MNRAS, 451, 4311, 1411.3628
- Remazeilles et al. (2016) Remazeilles, M., Dickinson, C., Eriksen, H. K. K., & Wehus, I. K., Sensitivity and foreground modelling for large-scale cosmic microwave background B-mode polarization satellite missions. 2016, MNRAS, 458, 2032, 1509.04714
- Riess et al. (1996) Riess, A. G., Press, W. H., & Kirshner, R. P., Is the Dust Obscuring Supernovae in Distant Galaxies the Same as Dust in the Milky Way? 1996, ApJ, 473, 588
- Savage & Jenkins (1972) Savage, B. D. & Jenkins, E. B., A Survey of Local Interstellar Hydrogen from OAO-2 Observations of Lyman Alpha Absorption. 1972, ApJ, 172, 491
- Schlegel et al. (1998) Schlegel, D. J., Finkbeiner, D. P., & Davis, M., Maps of Dust Infrared Emission for Use in Estimation of Reddening and Cosmic Microwave Background Radiation Foregrounds. 1998, ApJ, 500, 525, astro-ph/9710327
- Serra et al. (2014) Serra, P., Lagache, G., Doré, O., Pullen, A., & White, M., Cross-correlation of cosmic far-infrared background anisotropies with large scale structures. 2014, A&A, 570, A98, 1404.1933
Appendix A Description of the GNILC method
The generalized needlet internal linear combination, GNILC (Remazeilles et al. 2011b), is a component-separation method designed to reconstruct the diffuse emission of a complex component originating from multiple correlated sources of emission, such as the Galactic foreground emission or the cosmic infrared background radiation.
GNILC is a multi-dimensional generalization (Sect. A.1) of the standard internal linear combination (ILC) method, which has been extensively used to reconstruct one-dimensional components such as the CMB emission (Bennett et al. 2003; Planck Collaboration XII 2014) or the Sunyaev-Zeldovich (SZ) signal (Remazeilles et al. 2013; Planck Collaboration XXII 2016). A two-dimensional extension of the ILC, the so-called Constrained ILC, was first developed by Remazeilles et al. (2011a) to reconstruct both maps of the CMB and the SZ components, with vanishing contamination from one into the other. GNILC is a further generalization in which the dimension of the ILC filter, which is related to the dimension of the signal subspace, is no longer fixed, but varies with both the direction in the sky and the angular scale, depending on the effective local signal-to-noise ratio, i.e., the local conditions of contamination in both real space and harmonic space.
In this work, the signal is Galactic and the noise contributions consist of the CIB, the CMB, and the instrumental noise. The effective signal-to-noise ratio is determined locally both over the sky and over different angular scales by decomposing the data onto a wavelet (needlet) frame and by making use of a prior on the CIB power spectrum (Sect. A.2). The dimension of the Galactic signal is estimated locally in each wavelet domain through a modified principal component analysis (PCA) constrained by the power spectrum of the CIB (Sect. A.3). The effective dimension of the Galactic subspace, given by the local number of principal components, is not determined ad hoc but through a statistical model selection by the Akaike Information Criterion (Sect. A.4). The prior of the CIB power spectrum is only used at the stage of determining the number of principal components, i.e. the dimension of the Galactic signal subspace. There is no prior assumption about the Galactic signal.
A.1 Multi-dimensional Internal Linear Combination
We model the sky observation, , at frequency channel and in the direction in the sky (pixel), as the combination of the Galactic foreground emission, the CIB emission, the CMB emission, and the instrumental noise:
| (12) |
assuming no correlations between the different components of emission. Equation (12) can be recast in the vector form, where is the number of frequency channels:
| (13) |
Here collects the observation maps, each of them being a mixture of the Galactic foreground emission, (i.e., the thermal dust emission at high frequencies), the CIB emission, , the CMB emission, , scaling with a known spectral distribution, , and the instrumental noise, .
The frequency-frequency covariance matrix of the sky observations, , is
| (14) |
where is the covariance matrix of the Galactic signal, the covariance matrix of the CIB, the covariance matrix of the CMB, and the covariance matrix of the noise.
The Galactic foreground signal, , is a complex multi-component emission emanating from various physical processes (e.g., thermal dust emission, synchrotron emission, and free-free emission) with spectral properties varying over the sky. The number of degrees of freedom of the Galactic foreground signal would be infinite in the case of an infinitely narrow beam. However, in practice the beam is finite and the observations are limited by the number of frequency channels and the level of noise so that the effective number of Galactic degrees of freedom required to describe the Galactic emission is finite. In addition, the various physical components of the diffuse Galactic emission are correlated, therefore the Galactic signal, , can be represented as the superposition of a relatively small number, , of independent (not physical) templates, :
| (15) |
where is an mixing matrix giving the contribution from the templates in each frequency channel. Therefore, the covariance matrix of the Galactic signal is an matrix of rank :
| (16) |
where is a full-rank matrix.
We now address the problem of estimating the set of maps, , i.e., determining a “catch-all” foreground component comprising the emission of the diffuse Galactic interstellar medium. The objective is to construct estimated maps, , that are good matches to what would be observed by the instrument in the absence of CMB, CIB, and noise.
For extracting such an emission component from multi-frequency observations, we propose to generalize the internal linear combination (ILC) method to address the case of such a “multi-dimensional component” (–dimensional, with ). We consider the estimation of by a weighted linear operation
| (17) |
where the weight matrix, , is designed to offer unit response to the Galactic foreground emission while minimizing the total variance of the vector estimate . Stated otherwise, the matrix is the minimizer of under the constraint . The weights matrix, , thus solves the following constrained variance minimization problem
| (18) |
where is the covariance matrix of the observations, . This problem can be solved by introducing a Lagrange multiplier matrix, , and the Lagrangian
| (19) |
By differentiating Eq. (19) with respect to , one finds that is solved by
| (20) |
By imposing the constraint on Eq. (20), one then finds that . Hence, the solution of the Eq. (18) is given by the ILC weight matrix
| (21) |
Multi-dimensional ILC appears as a direct generalization of the one-dimensional ILC of Bennett et al. (2003). The mixing matrix, , of the Galactic signal and its dimension, , are the unknowns of the problem. However, it is important to notice that expression (21) for is invariant if is changed into for any invertible matrix . Hence, implementing the multi-dimensional ILC filter (21) only requires that the foreground mixing matrix, , be known up to right multiplication by an invertible factor (Remazeilles et al. 2011b). In other words, the only meaningful and mandatory quantity for implementing a multi-dimensional ILC is not the “true” mixing matrix but the column space of , i.e. the dimension, , of the Galactic signal subspace. This is the purpose of the Sects. A.3 and A.4.
The frequency-frequency covariance matrix of the observations, , can be estimated from the observation maps across the frequency channels. The coefficients of the covariance matrix of the observations for the pair of frequencies is computed empirically as follows:
| (22) |
where is a domain of pixels centred around the pixel . In this work, the pixel domain, , is defined by smoothing the product map with a Gaussian window in pixel space.
A.2 Nuisance covariance matrix
We define the “nuisance” covariance matrix, , as the sum of the CIB covariance matrix, the CMB covariance matrix, and the noise covariance matrix:
| (23) |
Therefore,
| (24) |
Our aim is to obtain an estimate, , of the nuisance covariance matrix. In combination with the estimate of the full covariance matrix, (Eq. 22), the nuisance covariance matrix, , allows us to constrain the Galactic signal subspace.
The noise covariance matrix, , can be estimated from the covariance of the half-difference maps between the HM1 and the HM2 half-mission surveys of Planck (Planck Collaboration VIII 2016), since the sky emission cancels out in the difference while the noise does not. The half-difference map for frequency channel is
| (25) |
where and are the Planck HM1 map and the Planck HM2 map, respectively. Similarly to the full covariance matrix in Eq. (22), the noise covariance matrix is then estimated empirically:
| (26) |
The Planck CMB best-fit CDM model (Planck Collaboration XV 2014) and the Planck CIB best-fit models (Planck Collaboration XXX 2014) are used as priors to estimate: (i) the CMB covariance matrix, ; and (ii) the CIB covariance matrix, , in pixel space.
We first simulate a Gaussian CMB map, , having a power spectrum given by the Planck CMB best-fit , and we scale it across frequencies through the known CMB spectral distribution, . In harmonic space, the cross-power spectrum of the simulated CMB maps is given by
| (27) |
where is the Planck CMB best-fit. From the simulated CMB maps, , we are able to compute the CMB covariance matrix in pixel space, , in the same way as in Eqs. (22) and (26).
From the Planck CIB best-fit cross-and auto-power spectra, , we simulate correlated Gaussian maps,444It could be argued that the non-Gaussianity of the CIB anisotropies should be taken into account in the statistics, in order to make the separation of Galactic foregrounds and CIB more accurate. However, the non-Gaussianity of the CIB is negligible compared to the non-Gaussianity of the Galactic foregrounds, so that Gaussian statistics is a sufficient approximation for separating the thermal dust and the CIB. , having a correlation matrix in harmonic space given by
| (28) |
where are the Planck CIB best-fits. From the simulated correlated CIB maps, , we can compute the CIB covariance matrix in pixel space, , in the same way as in Eqs. (22) and (26). Note that, for all GHz, the coefficients of are set to zero, because there is no Planck measurement of the CIB at those low frequencies, and therefore they are considered negligible.
A.3 Determining the Galactic signal subspace with a constrained PCA
Once both the observation covariance matrix, , and the nuisance covariance matrix, , have been computed, we can “whiten” the Planck data by making the transformation
| (29) |
such that the covariance matrix of the transformed Planck observations is now given by
| (30) |
Assuming that the prior CIB covariance matrix, , is close the real CIB covariance matrix, , we have that
| (31) |
where is the identity matrix. In this way, from Eq. (24) the covariance matrix of the transformed Planck observations becomes
| (32) |
such that the power of all the nuisance contamination, including CIB, CMB, and noise, is encoded in the matrix , which is close to an identity matrix. Typically, the coefficients of the transformed observation covariance matrix (Eq. 32) provide the signal-to-noise ratio over the sky, i.e., the power of the Galactic signal divided by the overall power of the CIB-plus-CMB-plus-noise.
Therefore, by diagonalizing the transformed observation covariance matrix (Eq. 32), we obtain the following eigenstructure:
| (44) |
In such a representation, the eigenvalues of the covariance matrix that are close to unity do not contain any relevant power of the Galactic signal and the signal is dominated by the CIB, the CMB, and the noise. The corresponding eigenvectors span the nuisance subspace characterized by the number of degrees of freedom, , of the CIB plus CMB plus noise only. Conversely, the subset of eigenvectors collected in the matrix , for which the eigenvalues of significantly depart from unity, span the Galactic signal subspace (principal components). The number of eigenvalues, , that are much larger than unity corresponds to the dimension of the Galactic signal subspace, i.e., the number of independent (unphysical) templates contributing to the Galactic signal. This is a constrained principal component analysis (PCA), in the sense that the PCA is driven by the local signal-to-noise ratio.

The diagonalization of the transformed Planck covariance matrix of Eq. (44) can be written in a compact form as
| (46) |
where
| (47) |
is a diagonal matrix and is an orthonormal matrix collecting all the eigenvectors of . Using Eq. (46) and the orthonormality condition, , the covariance matrix of the Galactic signal can be written as
| (48) | |||||
| (49) | |||||
| (50) |
This is the power that “best matches” what would be observed by the instrument in the absence of CIB, CMB, and noise. Therefore, we estimate the Galactic signal, , by
| (51) |
where
| (52) |
is an mixing matrix estimate, and is an vector of independent templates whose covariance matrix is given by
| (53) |
The estimate, , is the only useful information for implementing the multi-dimensional ILC filter of Eq. (21). It can be different from the true mixing matrix, , of the Galactic signal as long as the column space is the same: let be some invertible matrix and consider the transformed matrices and . These transformed matrices are an alternate factorization of the covariance matrix of the Galactic signal, , but they are equivalent, since by construction, . The ILC weights of Eq. (21) are unchanged under right multiplication by an invertible matrix. Therefore, the independent templates, , can be replaced by any other linear combination, , as long as we are interested in reconstructing the overall Galactic signal, .
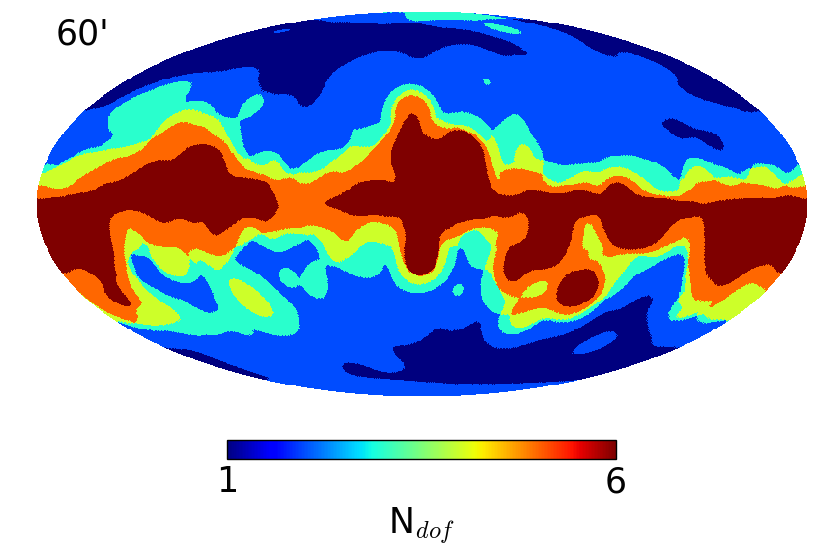
The number, , of principal components in Eq. (44), or the effective dimension of the Galactic signal subspace, can vary over the sky, depending on the local signal-to-noise ratio. In particular, at high Galactic latitudes this number decreases because the contributions of the CIB, the CMB, and the noise starts dominating the Galactic signal (Fig. 20). The dimension of the Galactic signal subspace is also expected to vary with angular scale, because at small angular scales the power of the Galactic signal becomes dominated by the power of the noise and the CIB. Therefore, for the accurate separation of the Galactic and CIB signals we find it useful to estimate the dimension of the Galactic subspace locally both in space and in scale. This is achieved by decomposing the data on a wavelet frame.
In this work, the analysis is performed on a needlet frame (see e.g., Delabrouille et al. (2009), Remazeilles et al. (2013) for the use of needlets in component separation). Basically, the spherical harmonic transforms of the maps, , are bandpass filtered in harmonic space, then transformed back into real space, therefore conserving a specific range of angular scales in the map. The result is called a needlet map, characterized by a given range of angular scales. The multi-dimensional ILC Eq. (17) is performed on the needlet maps independently for each range of scale, and the synthesized map is obtained by co-adding the ILC estimates at the various scales. The wavelet decomposition allows for estimating the dimension, , of the Galactic signal subspace locally over the sky and over the angular scales, depending on the local conditions of contamination. In this work, the needlet bandpass windows (Fig. 21) are defined in harmonic space from the difference of successive Gaussian beam transfer functions:
| (54) | |||||
| (55) | |||||
| (56) |
where
| (57) |
and
| (58) |
with . In this way we have
| (59) |
such that there is no effective filtering of any power at any scale in the final maps synthesized from the different needlet scales after component separation.
A.4 Model selection with the Akaike information criterion
In Remazeilles et al. (2011b), the effective number, , of Galactic components in each needlet domain was estimated by rejecting the eigenvalues in Eq. (44) that are smaller than , i.e., for which the “noise” contributes to the observation by more than . This criterion is somewhat arbitrary. In the present work, we propose instead to use a statistical criterion to discriminate between the “large” eigenvalues, tracing the Galactic signal, and the “noisy” eigenvalues () to be rejected; the effective rank of the covariance matrix of the Galactic signal is estimated by statistical model selection through the Akaike information criterion (Akaike 1974).
For a given dimension, or model, , if we assume that the data, , are independent and identically distributed according to the Gaussian distribution , with , then the likelihood reads as
where is the number of modes in the (needlet) domain considered. The log-likelihood can be written as
| (61) | |||||
| (62) |
where is the Kullback-Leibler divergence (Kullback 1968), measuring the spectral mismatch between the model covariance matrix, , and the data covariance matrix, :
| (63) |
At this stage, it is interesting to note that the estimate of the Galactic covariance matrix, computed in Eq. (48), is nothing other than the maximum likelihood estimate, i.e., the minimizer of the Kullback-Leibler divergence of Eq. (63), as in SMICA (Delabrouille et al. 2003; Cardoso et al. 2008). The proof is given in Sect. A.5.
In the region of the sky and the range of angular scales considered, we select the best rank value, , among the class of models, , by minimizing the AIC
| (64) |
Through the penalty, , the AIC makes a trade-off between the goodness of fit and the complexity of the model. Let us denote the diagonalization of the transformed data covariance matrix, where
| (67) |
Since the maximum likelihood is reached when , we have
| (68) | |||||
| (69) | |||||
| (70) | |||||
| (75) | |||||
| (80) | |||||
| (81) | |||||
| (82) |
where are the eigenvalues of the transformed data covariance matrix, , collected in the matrix , and
| (83) |
This convex function is minimum for .
Therefore, the AIC criterion reduces to the simple analytical form:
| (84) |
and the dimension of the Galactic signal subspace is estimated by minimizing Eq. (84) in each region considered:
| (85) |
Minimizing the AIC criterion (Eq. 84) in each needlet domain (i.e., in each region of the sky and each range of angular scales) allows for estimating the effective dimension of the Galactic signal subspace locally, given the level of contamination by noise, CIB, and CMB in this region. The multi-dimensional ILC then adapts the filtering to the effective local dimension of the Galactic signal. In this respect, the GNILC method goes beyond the SMICA method by relaxing any prior assumption on the number of Galactic components.
Figure 20 shows the local dimension of the Galactic signal subspace over the sky, for three different ranges of angular scales, which we have estimated by minimizing the AIC criterion (Eq. 84) on the Planck data. In practice, the dimension of the Galactic signal subspace (equivalently, the number of Galactic degrees of freedom) clearly depends on the local signal-to-noise ratio, where the “noise” here includes the instrumental noise, the CIB, and the CMB signals. As expected, at high latitude and small angular scales (bottom panel in Fig. 20) this number decreases because the CIB and the instrumental noise become dominant in the observations.
A.5 Minimization of the Kullback-Leibler divergence
To close this appendix, we show that the GNILC estimates of the covariance matrix (Eq. 48) and the mixing matrix (Eq. 52) are the maximum likelihood solution that minimizes the Kullback-Leibler divergence (Eq. 63). For the sake of simplicity, we will assume that the data have been whitened so that the nuisance covariance matrix is represented by an identity matrix, .
Let us consider a foreground model with a fixed number, , of independent templates in the domain being considered. The foreground covariance matrix can therefore be modelled as a rank– matrix
| (86) |
and the full data covariance matrix as
| (87) |
where is an diagonal matrix collecting the non-null eigenvalues of and is an matrix collecting the corresponding eigenvectors. In other words, the eigendecomposition of the foreground covariance matrix is given by
| (90) |
The maximum likelihood estimate, , minimizing the Kullback-Leibler divergence, must satisfy for all
| (91) | |||||
| (92) | |||||
| (93) | |||||
| (94) |
Therefore, the maximum likelihood estimate, , is solution of
| (95) |
where is an identity matrix. If we consider the eigenvalue decomposition of the full data covariance matrix as
| (98) |
where is the diagonal matrix collecting the largest eigenvalues of , and is an matrix collecting the corresponding eigenvectors, then the maximum likelihood solution of Eq. (95) is given by
| (99) | |||||
| (100) |
A.6 Test on Planck simulations
We apply the GNILC algorithm to the public555http://crd.lbl.gov/cmb-data Planck full focal plane simulations (FFP8) from Planck Collaboration XII (2016) in order to validate the component-separation method.
We still adopt as a prior for GNILC the Planck 2013 CIB best-fit power spectra, although the simulations of the CIB components in FFP8 do not follow the exact same statistics, since the FFP8 CIB maps are generated across frequencies from simulated dark matter shells in Planck Collaboration XII (2016). The imperfect agreement between the prior and the actual CIB power spectrum enables us to test the robustness of GNILC when the knowledge of the CIB power spectrum is not perfect.
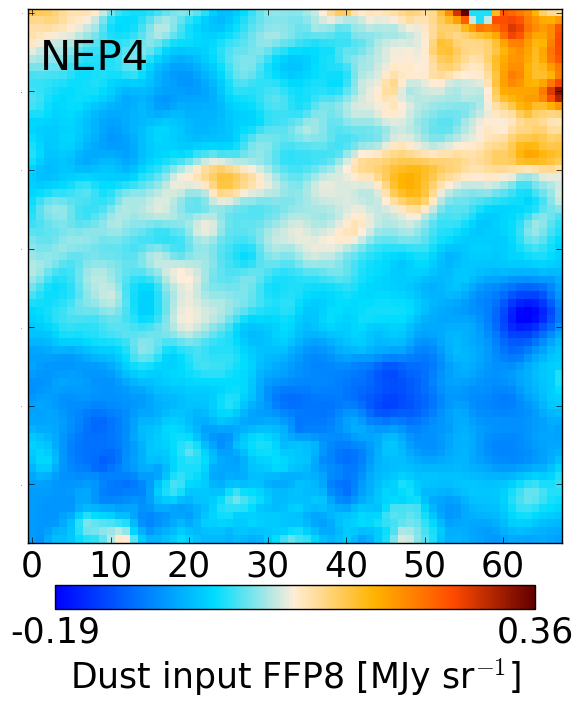
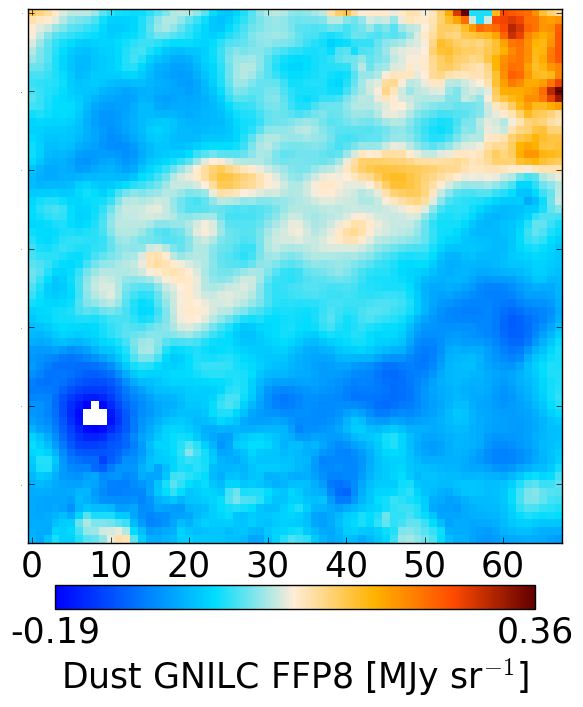
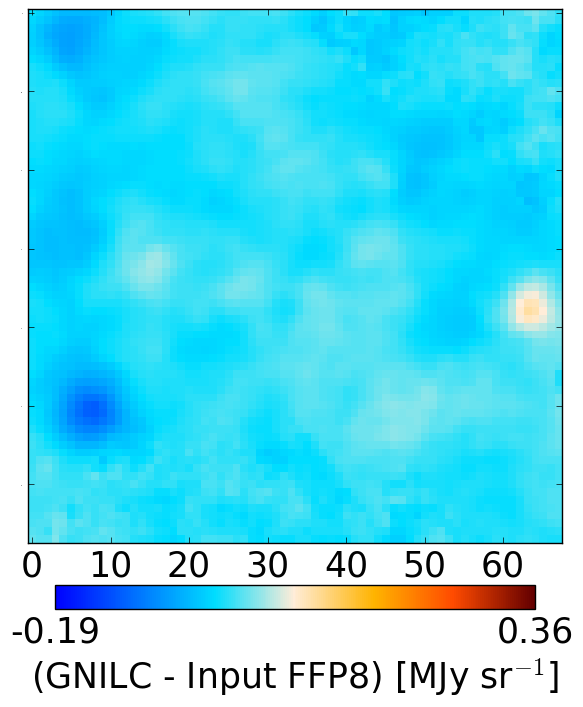
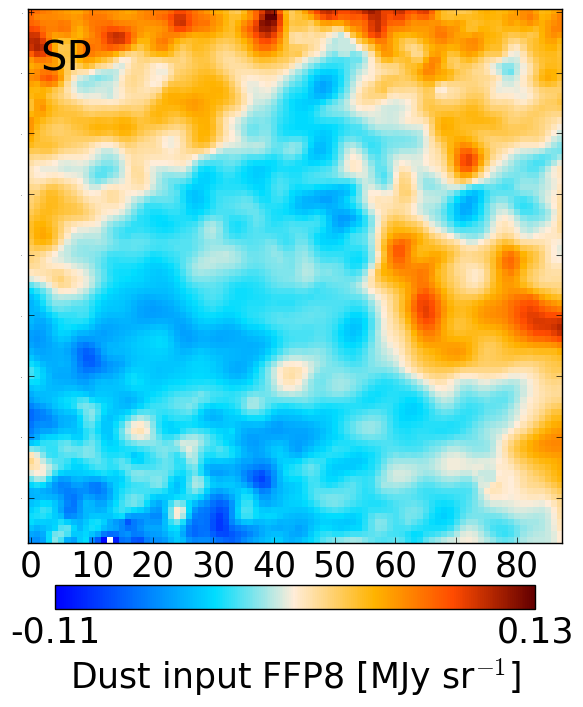
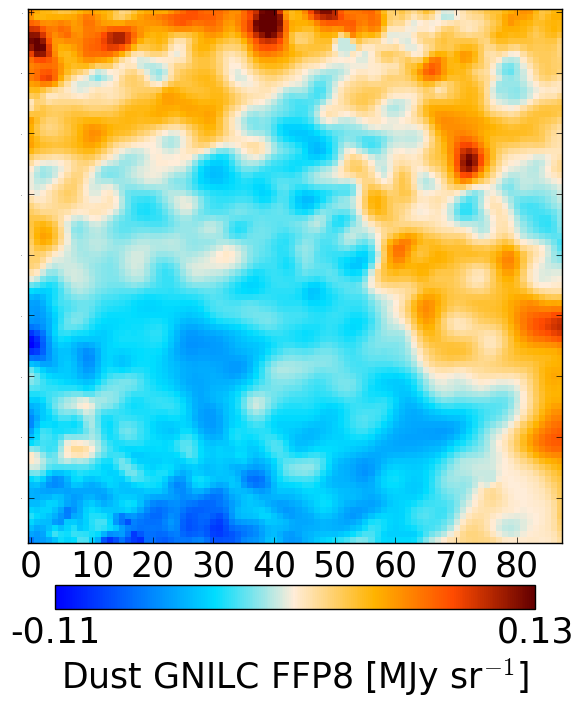
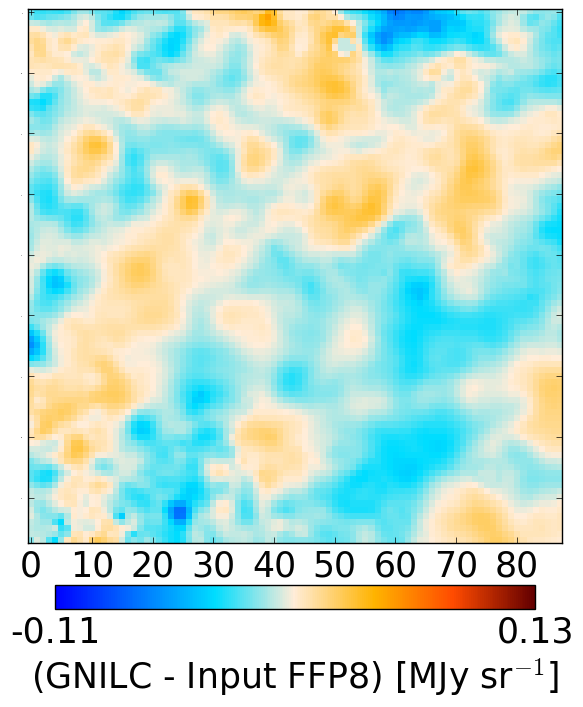
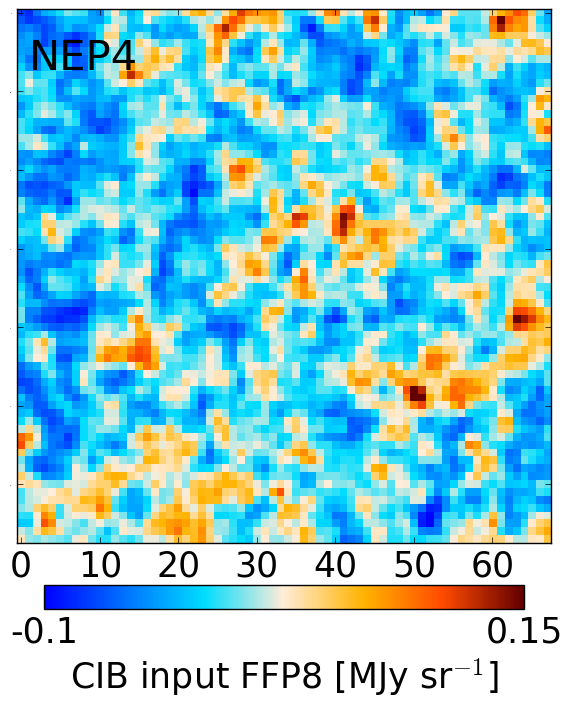
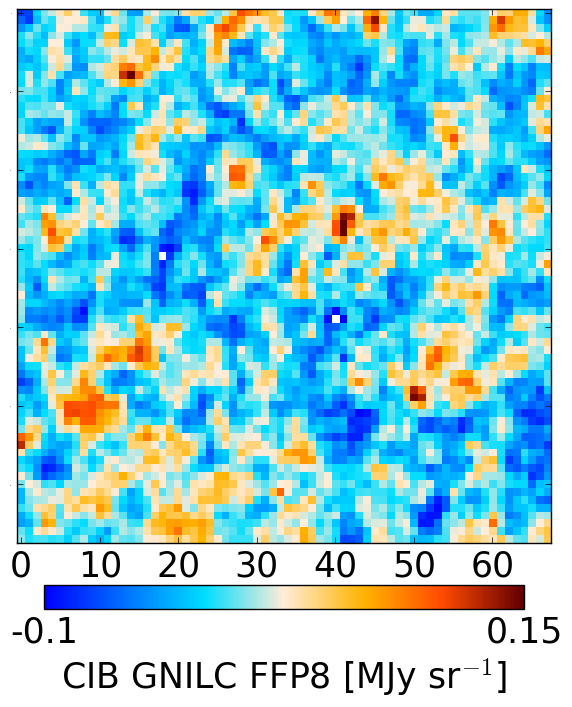
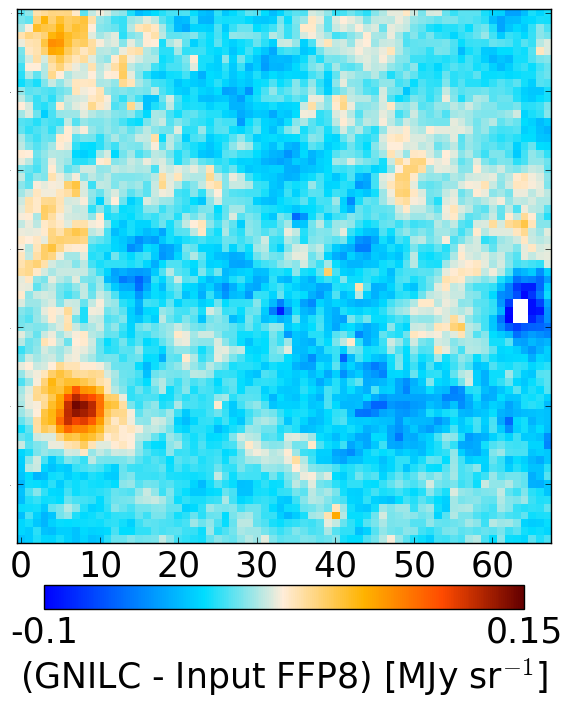
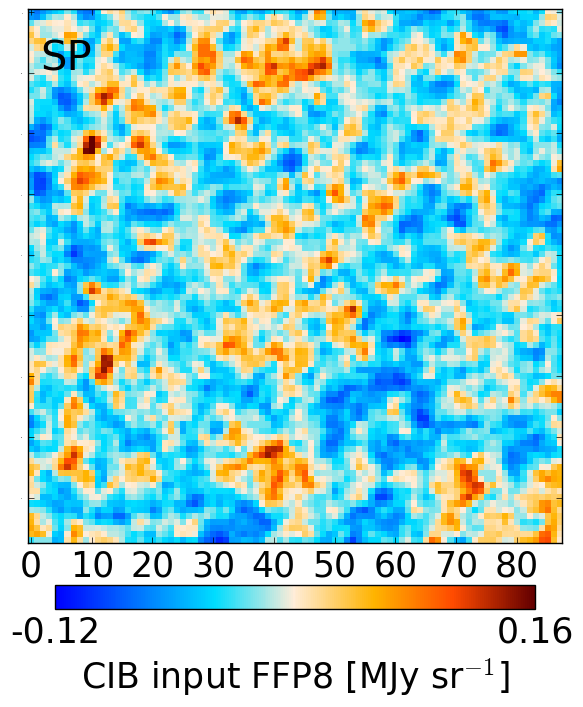
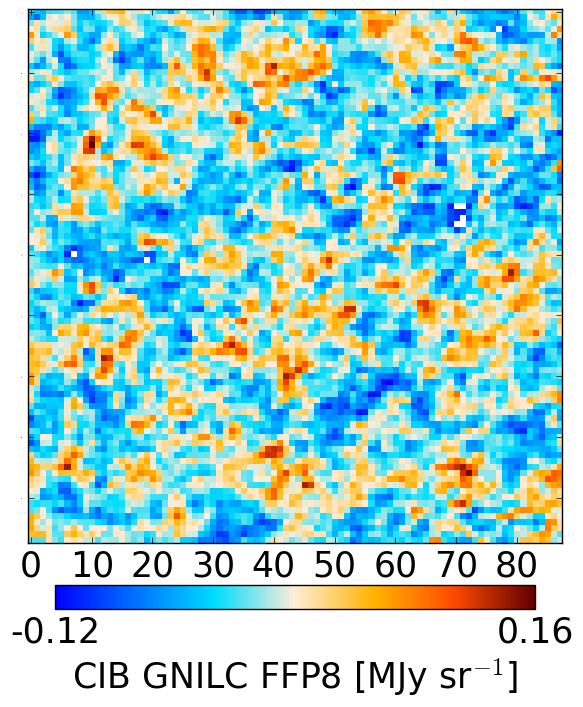
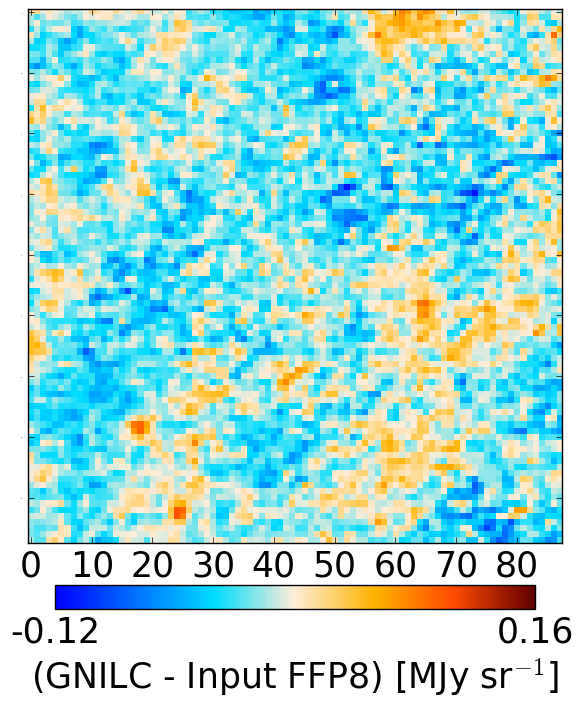
In Fig. 22 we compare the reconstructed GNILC dust map with the input FFP8 dust map within some small CIB fields of Planck Collaboration XXX (2014), where the dust is faint, namely NEP4 (part of the GHIGLS NEP field) and SP. The difference between the GNILC dust map and the input dust map is also shown. In Fig. 23, we compare the reconstructed GNILC CIB map with the input FFP8 CIB map. The difference between the GNILC CIB and the input CIB is shown in the third column of Fig. 23.
The – correlation between the GNILC output dust and the FFP8 input dust is plotted in Fig. 24. The – correlation between the GNILC output CIB and the FFP8 input CIB is plotted in Fig. 25. In the NEP4 field, the slope of the – scatter plots is for the dust and for the CIB. In the SP field, the slope of the – scatter plots is for the dust and for the CIB. In both fields, the Pearson correlation coefficient between the input and the GNILC reconstruction is found larger than for the dust and larger than for the CIB.
The successful reconstruction of dust and CIB shows that the GNILC method is robust to imperfect prior assumptions on the CIB angular power spectra. As shown in Olivari et al. (2016), it is not the exact morphology of the CIB power spectrum but the overall slope that matters for enabling GNILC to discriminate between dust and CIB. The prior power spectrum in GNILC is only intended to estimate the dimension of the dust and CIB component subspaces (Sect. A.3) not the amplitude of these components (Sect. A.1).
