∎
22email: romanova@astro.cornell.edu 33institutetext: Stanley P. Owocki 44institutetext: Department of Physics & Astronomy, University of Delaware, Newark, DE 19716 USA
44email: owocki@udel.edu
Accretion, Outflows, and Winds of Magnetized Stars
Abstract
Many types of stars have strong magnetic fields that can dynamically influence the flow of circumstellar matter. In stars with accretion disks, the stellar magnetic field can truncate the inner disk and determine the paths that matter can take to flow onto the star. These paths are different in stars with different magnetospheres and periods of rotation. External field lines of the magnetosphere may inflate and produce favorable conditions for outflows from the disk-magnetosphere boundary. Outflows can be particularly strong in the propeller regime, wherein a star rotates more rapidly than the inner disk. Outflows may also form at the disk-magnetosphere boundary of slowly rotating stars, if the magnetosphere is compressed by the accreting matter. In isolated, strongly magnetized stars, the magnetic field can influence formation and/or propagation of stellar wind outflows. Winds from low-mass, solar-type stars may be either thermally or magnetically driven, while winds from massive, luminous O and B type stars are radiatively driven. In all of these cases, the magnetic field influences matter flow from the stars and determines many observational properties. In this chapter we review recent studies of accretion, outflows, and winds of magnetized stars with a focus on three main topics: (1) accretion onto magnetized stars; (2) outflows from the disk-magnetosphere boundary; and (3) winds from isolated massive magnetized stars. We show results obtained from global magnetohydrodynamic simulations and, in a number of cases compare global simulations with observations.
Keywords:
stars magnetic field accretion disks stellar winds magnetohydrodynamics1 Introduction
Magnetic fields play important and distinct roles in the dynamics of gas flow around disk-accreting and isolated magnetized stars. In Sec. 1.1 and 1.2, we review different types of disk-accreting magnetized stars, for which the magnetic field determines the processes of accretion and outflow. In Sec. 1.3 we review isolated magnetized stars, where the magnetic field drives or shapes the winds from these stars.
1.1 Accretion onto magnetized stars
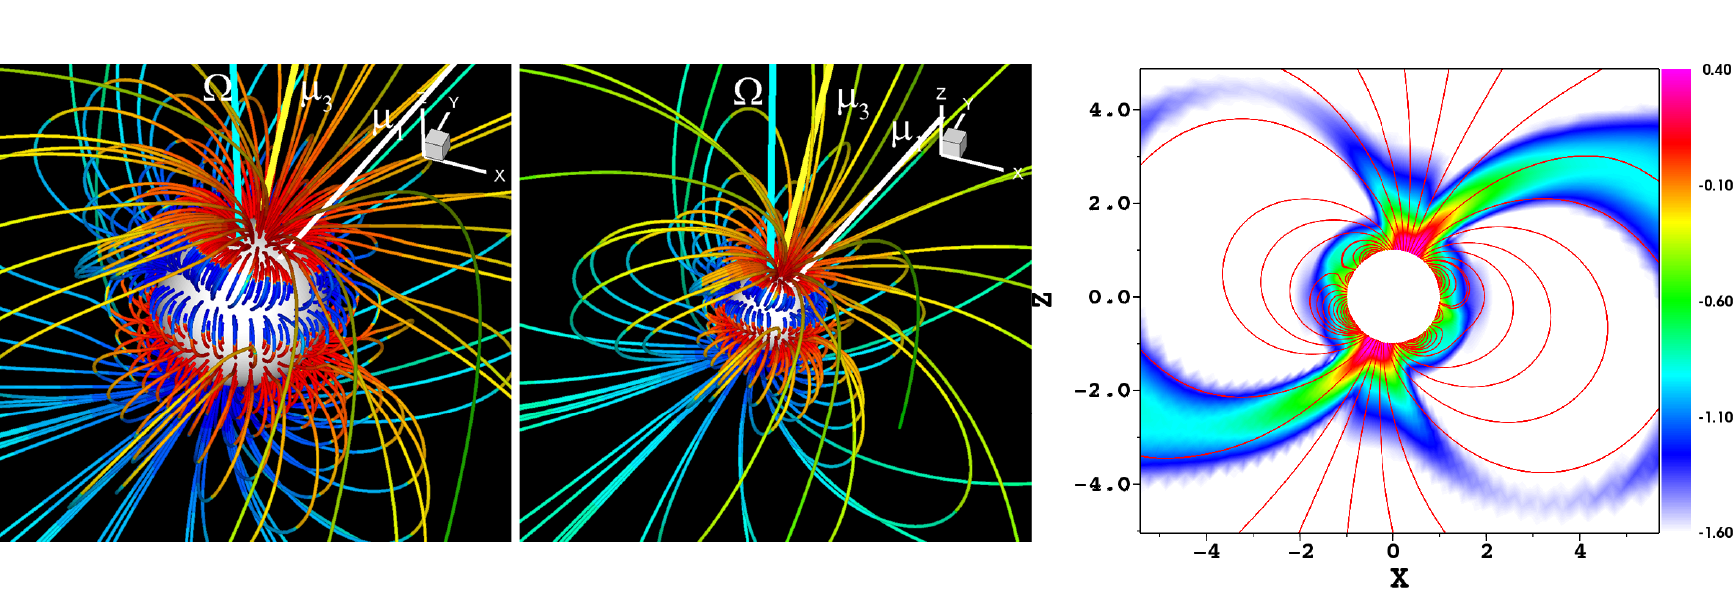
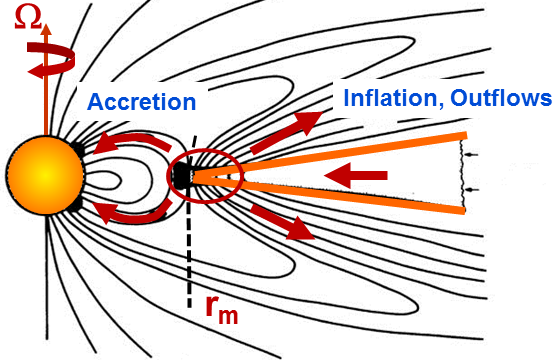
Different types of disk-accreting stars have dynamically important magnetic fields. Some of them are very young and are at the stage of gravitational contraction; others are very old, compact stars. Young ( years) low-mass () stars have significant magnetic fields of a few kG (Donati et al., 2007; Johns-Krull, 2007), which is thousands of times stronger than the globally averaged field of the Sun. Some of these stars (called Classical T Tauri Stars, or CTTSs) are surrounded by accretion disks, and their fields are strong enough to truncate the disks (see Fig. 1). The truncation (or magnetospheric) radius is determined by the balance between the magnetic stress in the magnetosphere and the matter stress in the disk 111We further discuss the disk-magnetosphere interaction and the magnetospheric radius in Sec. 2.2. For a number of CTTSs, the truncation radii are estimated to be of a few stellar radii. The light curves from such CTTSs show complex patterns of periodic, quasi-periodic, or irregular variability (see Fig. 2; see also Herbst et al. 1994; Stauffer et al. 2014), which are probably connected with complex paths of matter flow around the magnetosphere and rotations of the hot spots that form as a result of the gravitational impact of the free-falling matter to the stellar surface (see, e.g., review by Bouvier et al. 2007a).
Old, compact stars (i.e., white dwarfs, neutron stars) have even stronger magnetic fields, originating from the collapse of a main sequence star under the conservation of magnetic flux. In some white dwarfs, called ‘polars,’ the magnetic field is so strong, ( G) that an accretion disk does not form, and matter from the secondary star accretes directly to the large magnetosphere. In white dwarfs known as ‘intermediate polars’ (IPs), with strong, but less extreme, fields ( G) an accretion disk forms (e.g., Warner et al. 1995; Hellier 2001). This accretion disk is truncated at large distances from the star, with . Such IPs show periodic variability associated with the channelling of disk matter onto the magnetic poles of the star.
Accreting neutron stars in binary systems may have very strong magnetic fields, G, with accretion disks that interact with huge magnetospheres, . Due to their large magnetospheres, neutron stars have relatively long periods of order seconds. There is also a sub-class of neutron stars called accreting millisecond X-ray pulsars (AMXPs, e.g., Wijnands & van der Klis 1998), where the field has decayed to G and the neutron star has spun up due to disk accretion in binary systems (e.g., Bisnovatyi-Kogan & Komberg 1974; Alpar et al. 1982; Patruno & Watts 2012). In these stars, as in CTTSs, the disk is truncated at a few stellar radii and the magnetospheric accretion is expected. . However, due to the much smaller size of the neutron star, the dynamical time-scale at the truncation radius is only a few milliseconds. In spite of the large difference in size between young CTTSs (about cm) and millisecond-period neutron stars (about cm), the physics of the disk-magnetosphere interaction is quite similar: the accretion-induced pulsations are observed in X-ray, which are associated with the rotating hot spots. In addition, high-frequency quasi-periodic oscillations (QPOs) are observed which carry information about processes in the inner disk (e.g., van der Klis 2000; Patruno & Watts 2012). Section 2 discusses different aspects of accretion onto magnetized stars.
1.2 Outflows from the disk-magnetosphere boundary
The field lines of the external parts of the magnetosphere may inflate due to the differences in angular velocities of the foot-points of the magnetic loops connecting the star and the disk (Aly & Kuijpers, 1990; Camenzind, 1990; Shu et al., 1994; Lovelace et al., 1995; Uzdensky et al., 2002). Different signs of episodic inflation are observed in CTTSs (see, e.g., review by Bouvier et al. 2007a). Inflation creates favorable conditions for outflows from the disk-magnetosphere boundary, at which the magnetic field of the star participates in driving outflows (see Fig. 1). Collimated outflows are observed from a number of CTTSs (e.g., Ray et al. 2007). A significant number of CTTSs show signs of outflows in spectral lines, particularly in the near-infrared He I 10830Å line, for which two distinct components of outflows had been found (e.g., Edwards et al. 2006). Outflows are also observed from accreting compact stars such as accreting white dwarfs in symbiotic binaries (e.g., Sokoloski et al. 2008), as well as from the vicinity of neutron stars (e.g., Fender et al. 2004; Heinz et al. 2007). The origin of these outflows is not yet clear. One of attractive possibilities is that they may originate at the disk-magnetosphere boundary (e.g., Shu et al. 1994; Romanova et al. 2009). In Sec. 3 we discuss different types of outflows from the disk-magnetosphere boundary.
1.3 Winds from isolated magnetized stars
Many stars are isolated, some of them having significant magnetic fields. The magnetic field of the Sun is relatively small - a few Gauss on average. Nonetheless, it plays an important role in the heating of the corona and in the formation of the wind, which is driven by gas pressure. Powerful events of inflation and reconnection of the solar field lines lead to coronal mass ejections (CMEs), which enhance the wind density and induce storms in the Earth’s magnetosphere (e.g., Boiko et al. 2012).
In young low-mass stars, the magnetic field is thousands of times stronger than that of the Sun, and much stronger winds and CMEs are expected. These winds can be either thermally or magnetically driven (e.g., Weber & Davis 1967; Lovelace et al. 2008; Vidotto et al. 2009, 2011). In magnetically driven winds, the pressure gradient of the magnetic field determines the acceleration of matter to the wind. This is possible when, for gas pressure and magnetic field , the plasma parameter at the base of the wind (Lovelace et al., 2008; Vidotto et al., 2011). In more massive stars () of O, B and A types, powerful winds are driven by the star’s radiation pressure. About 10 percent of O and B stars harbor large-scale, organized (often predominantly dipolar) magnetic fields, ranging in dipolar strength from a few hundred to tens of thousands Gauss. This field can influence matter flow in the wind and can determine many observational properties of these stars. It can channel wind material or trap the wind, forming wind-fed magnetospheres that develop from closed magnetic loops (e.g., ud-Doula et al. 2013; Owocki et al. 2014).
Section 4 discusses in greater detail the wind-fed magnetospheres from magnetized massive stars along with corresponding observational properties associated with the magnetic field.
The problems of the disk-magnetosphere interaction, outflows and winds from magnetized stars are multidimensional and require global axisymmetric or three-dimensional (3D) numerical simulations. Below, we describe results of recent numerical simulations of accretion and outflows from disk-accreting magnetized stars, wind-fed magnetospheres of isolated massive stars, and show examples of comparisons of models with observations.
 |
2 MAGNETOSPHERIC ACCRETION
Magnetospheric accretion is a complex process, in which the inner disk matter interacts with the magnetosphere of the star. The result of such an interaction depends on a number of factors, such as the period of stellar rotation, the structure of the magnetic field of the star, the size of the magnetosphere, the diffusivity at the disk-magnetosphere boundary, properties of the accretion disk, and other factors. We start from a brief overview of studies the magnetospheric accretion.
2.1 Different studies of the magnetospheric accretion
The disk-magnetosphere interaction has been studied in a number of theoretical works (e.g., Pringle & Rees 1972; Lamb et al. 1973; Ghosh & Lamb 1978; Spruit & Taam 1990; Königl 1991; Campbell 1992; Koldoba et al. 2002a). It was predicted that the disk should be truncated by the magnetosphere of the star, and matter should flow above and below the magnetosphere in the funnel flow. Some authors also predicted that the magnetic field lines of the external parts of the magnetosphere may inflate and open due to the differential rotation of the foot-points of the field lines of the external magnetosphere (e.g., Aly & Kuijpers 1990), and outflows are possible along the field lines of the inflated magnetosphere (e.g., Camenzind 1990; Shu et al. 1994; Lovelace et al. 1995).
A number of numerical simulations have been also performed. The process of the disk-magnetosphere interaction is internally multi-dimensional, so that two or three-dimensional simulations are required for investigation of this process. Early axisymmetric simulations (e.g., Hayashi et al. 1996; Miller & Stone 1997; Hirose et al. 1997) were relatively brief, only a few Keplerian rotations at the inner disk. Rapid, almost free-fall accretion has been observed due to the initial magnetic braking of the Keplerian disk by the magnetic field of the non-rotating magnetosphere. Strong inflation of the field lines and one-time episode of outflows has been observed. These simulations did show inflation of the field lines and outflows. They also have shown brief events of the magnetospheric accretion; however, the magnetospheric accretion has not been studied due to non-stationary nature of the process. Goodson et al. (1997) has been able to perform longer simulation runs and obtained a few episodes of accretion, inflation and outflows from the disk-magnetosphere boundary. Their simulations confirmed the suggestion of Aly & Kuijpers (1990) about the possibility of the cyclic inflation of the field lines of the external magnetosphere and formation of outflows along the field lines threading the inner disk (Lovelace et al., 1995). However, these authors investigated only the case of a rapidly rotating young star (with period of 1.8 days) in the regime which is close to the propeller regime (e.g., Illarionov & Sunyaev 1975; Lovelace et al. 1999). In subsequent simulations (Goodson et al., 1999; Matt et al., 2002) only rapidly-rotating stars were considered. It is not clear whether these results are general, that is can be applied to any disk-accreting magnetized stars.
Development of quasi-equilibrium initial conditions for the disk-magnetosphere configuration helped to obtain a slow accretion in the disk, and to investigate accretion through the funnel flows (Romanova et al., 2002).222In these initial conditions the corona above the disk rotates with the angular velocity of the disk, so that the magnetic field lines do not experience discontinuity at the disk-magnetosphere boundary, and there is no initial magnetic breaking. There is also an initial balance between the gravitation, pressure and centrifugal forces in each point of the simulation region.. Simulations confirmed many aspects of the disk-magnetosphere interaction predicted theoretically, such as the truncation of the accretion disk by the stellar magnetosphere, formation of the funnel flow, and angular momentum flow between the disk and the star. However, in these simulations, the corona above the disk is relatively heavy so that the inflation and outflows were suppressed in most of simulation runs. Simulations with the lower-density corona confirmed accretion through funnel flows and the inflation of the field lines; however, no outflows were observed (Long et al., 2005). Similar simulations were performed by Bessolaz et al. (2008) who also compared the position of the truncation radius of the disk observed in simulations with magnetospheric radii derived from different theoretical studies. Long et al. (2005) studied the angular momentum flow between the disk, star and corona and found conditions for the rotational equilibrium state at which a star neither spins-up, nor spins-down. They found, that in this state, a star rotates somewhat more slowly than the inner disk, because part of angular momentum flows from the star to corona along inflated and partially-inflated field lines. More recently, Zanni & Ferreira (2013) observed many cycles of inflation and reconnection in the external magnetosphere with ejection of matter along the inflated field lines. Simulations show that outflows are strongly enhanced in the propeller regime of accretion (e.g., Romanova et al. 2005b; Ustyugova et al. 2006), or in cases where the accretion disk compresses the magnetic field of the external magnetosphere (Romanova et al., 2009). These axisymmetric simulations helped to understand many elements of the disk-magnetosphere interaction. They are particularly valuable for investigation of the inflation and outflows in the external magnetosphere, because the coronal density should be low enough for modeling these processes.
 |
The disk-magnetosphere interaction also depends on the properties of an accretion disk. In many studies it is suggested that the outward transport of angular momentum is provided by viscosity, and the viscosity coefficient is proportional to parameter , where (Shakura & Sunyaev, 1973). This approach has been successfully used in many studies of accretion disks and also has been used in most of modelings of the magnetospheric accretion (e.g., Goodson et al. 1997; Long et al. 2005; Zanni & Ferreira 2013; Romanova et al. 2014). The viscosity plays an important role in bringing matter toward the magnetosphere in steady rate. On the other hand, viscosity mimics some more complex processes in the disk, such as magnetic turbulence (Shakura & Sunyaev, 1973). A significant progress has been made in understanding turbulent disks where the turbulence is driven by the magneto-rotational instability (e.g., Balbus & Hawley 1991, 1998). MRI-driven turbulence has been extensively studied in axisymmetric and local/global 3D MHD simulations (e.g., Hawley et al. 1995; Brandenburg et al. 1995; Stone et al. 1996; Armitage 1998; Hawley 2000; Beckwith, et al. 2009; Flock, et al. 2011; 2011; McKinney et al. 2014). In most of simulations the central object is non-magnetized, usually a black hole. Accretion onto a magnetized star has been studied in much fewer simulations (Romanova et al., 2011a, 2012). Simulations show that many properties of the magnetospheric accretion are similar in cases of the turbulent and laminar, disks, in particular, in cases of the small-scale turbulence.
To model most realistic situation, the disk-magnetosphere interaction should be considered in three dimensions. One of the main issues is that the inner disk matter is expected to penetrate through through the magnetosphere (the effective diffusivity) in non-axisymmetric, 3D instabilities, such as the Rayleigh-Taylor and Kelvin-Helmholtz instabilities (e.g., Arons & Lea 1976). Such a penetration will determine the effective “diffusivity” at the disk-magnetosphere boundary and thus the level of interaction between the disk and the star. On the other hand, the dipole magnetic moment may be tilted about the rotational axis of the star, or the magnetic field may be more complex than the dipole field. Therefore, it is important to study the disk-magnetosphere interaction in global 3D simulations. A special “Cubed Sphere” 3D MHD Godunov-type code has been developed for this purpose (Koldoba et al., 2002b) and different 3D simulations were performed for the first time. In this section, we describe mainly the results of the global 3D simulations of the disk-magnetosphere interaction. In particular, we show results of accretion onto a star with a tilted dipole magnetosphere (see Sec. 2.3); accretion through 3D instabilities (see Sec. 2.4); accretion onto stars with relatively large magnetospheres (see Sec. 2.5), and accretion onto stars with complex magnetic fields (see Sec. 2.6). Finally, the 3D MHD models have been developed for CTTS stars with realistic parameters, and results of simulations were compared with observations of these stars (see Sec. 2.7 and 2.8).
[width=60mm]funnel-1
2.2 Truncation of the disk by the magnetosphere, and characteristic radii
If the magnetic field of the star is sufficiently strong, then it truncates the accretion disk at a radius where the magnetic stress in the magnetosphere matches the matter stress in the disk. In the disk, the largest stress is connected with the azimuthal components of the stress tensor: , where , , , are the local density, gas pressure, total and azimuthal magnetic field in the disk, respectively. At the innermost edge of the disk, and the truncation radius can be found from the condition . However, it is better to include the total ram pressure which acts in all three directions and to compare the total matter pressure with the total magnetic pressure
| (1) |
Here, is the generalized plasma parameter, which includes both thermal and ram pressure (Romanova et al., 2002). It is analogous to the standard plasma parameter , but takes into account the ram pressure of the matter flow in the disk. Axisymmetric and global 3D MHD simulations show that the condition is useful for finding the magnetospheric radius (e.g., Kulkarni & Romanova 2013). This radius usually corresponds to the innermost edge of the disk, where the density drops sharply towards the low-density magnetosphere (in which magnetic pressure is dominant). This formula can be used to find in many situations, including those that are non-stationary. There is also no restriction on the geometry of the magnetic field of the star (see also Sec. 2.6) 333Sometimes, the condition is used to find the magnetospheric radius (e.g., Bessolaz et al. 2008). This condition, however, yields somewhat a larger radius at which the matter flows from the disk to the funnel stream.. Fig. 3 shows a snapshot from 3D simulations of a laminar, disk. The vertical dashed line shows the magnetospheric radius calculated from the stress balance Eq. 1.
In earlier theoretical studies (e.g., Pringle & Rees 1972; Lamb et al. 1973) the magnetospheric radius was estimated from the balance between the largest components of the stresses, assuming a dipole field from the star and Keplerian orbital speed in the disk; this gives
| (2) |
where is the magnetic moment of the star with a surface field , is the disk accretion rate, and and are the mass and radius of the star, respectively. Axisymmetric disk-accretion simulations by, e.g., Long et al. (2005) found that eqs. 1 and 2 give similar values of if (Long et al., 2005). Bessolaz et al. (2008) compared different approaches for estimating the magnetospheric radius, and found that all give similar values, essentially set by the steep () decline of the magnetic stress, which dominates over the much more gradual variation of the disk matter stress.
From a series of 3D MHD simulations, Kulkarni & Romanova (2013) fit a scaling for the magnetospheric radius,
| (3) |
that is somewhat flatter than the scaling of eqn. (2). This difference can be attributed to the non-dipole form of the magnetic field, which results from the compression of the magnetosphere by the accretion disk (see Fig. 5, middle panel). Despite this modest difference in dependencies, the formula (2) with coefficient still describes the position of the magnetospheric radius with accuracy sufficient in many astrophysical situations. But note that this scaling has only been tested for accretion onto relatively small magnetospheres, ; accretion onto stars with larger magnetospheres has not yet been studied systematically 444Simulations of accretion onto stars with larger magnetosphere require much longer computing time. Test simulations of such accretion are described in Sec. 2.5. However, to obtain a formula for magnetospheric radius, multiple simulations are needed. 555The compression of the magnetosphere is probably connected with the ram pressure in the radial direction and so may depend on the value of the radial velocity (which is proportional to parameter of viscosity). The above described simulations were performed for . The possible dependence of the compression on parameter should be studied in a separate set of simulations..
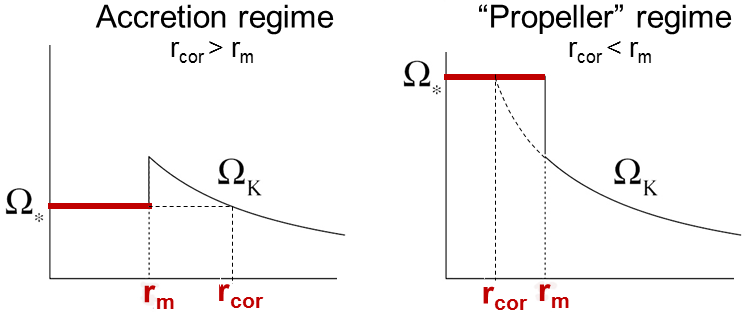 |
Another important radius is the corotation radius, at which the angular velocity of the star matches the Keplerian angular velocity of the disk: :
| (4) |
As illustrated in fig. 4, the condition characterizes the boundary between “accretion” vs. “propeller” regimes. The left panel demonstrates the case favorable for accretion, in which , and the inner disk rotates more rapidly than the magnetosphere of the star; the accreting matter interacts with the magnetosphere, loses some of its angular momentum, and accretes onto the star. The right panel of Fig. 4 shows the opposite situation, in which and the matter of the inner disk gains angular momentum; this regime is called the “propeller” regime (e.g., Illarionov & Sunyaev 1975; Alpar & Shaham 1985; Lovelace et al. 1999), in which the inner disk matter can be pushed away by the rapidly-rotating magnetosphere, while some of the matter can be ejected as a wind. This situation will be considered in greater detail in Sec. 3.1.

|
It is also convenient to characterize the state of the accreting magnetized star with the fastness parameter, , which is defined as the ratio between the angular velocity of the star, and Keplerian velocity of the inner disk at :
| (5) |
This parameter efficiently characterizes different states of the accreting magnetized star (e.g., Ghosh 2007). In the following sections we show that many processes at the disk-magnetosphere boundary can be characterized by this parameter.
2.3 Accretion onto stars with a tilted dipole magnetic field
The magnetic axis of the dipole moment, , can be tilted by an angle, , about the rotational axis, , of the star. The rotational axis of the star is fixed, and it coincides with the rotational axis of the disk. In general, the rotational axis of the star may be also tilted about the rotational axis of the disk, and this leads to secular warping and precession of the inner disk (e.g., Lipunov & Shakura 1980; Lai 1999). In this Chapter, however, we consider only cases in which the rotational axes of the star and disk coincide.
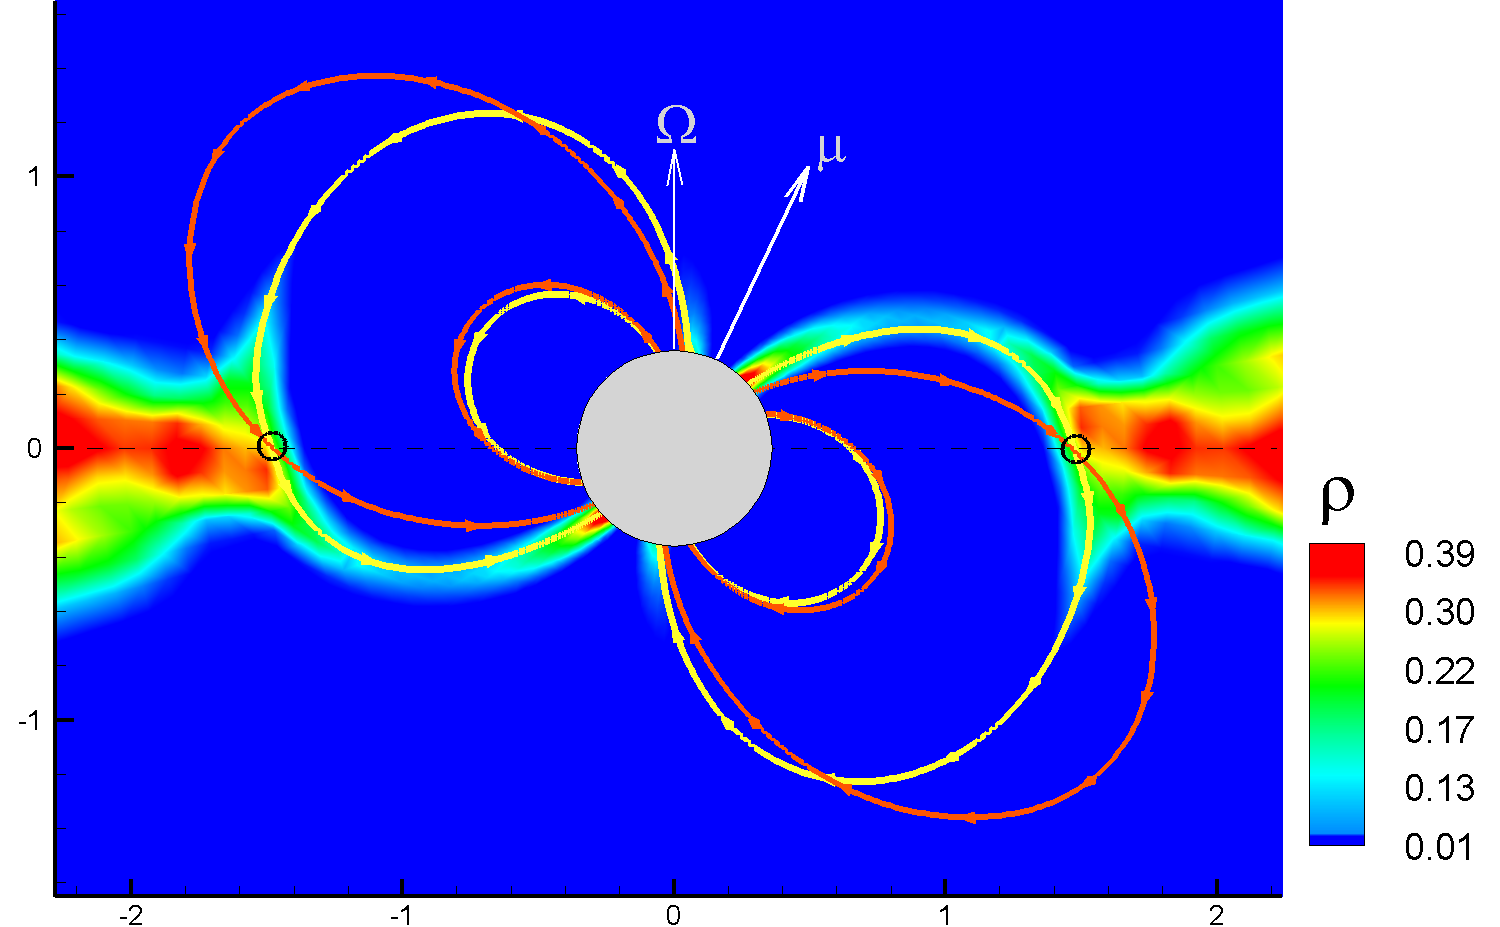
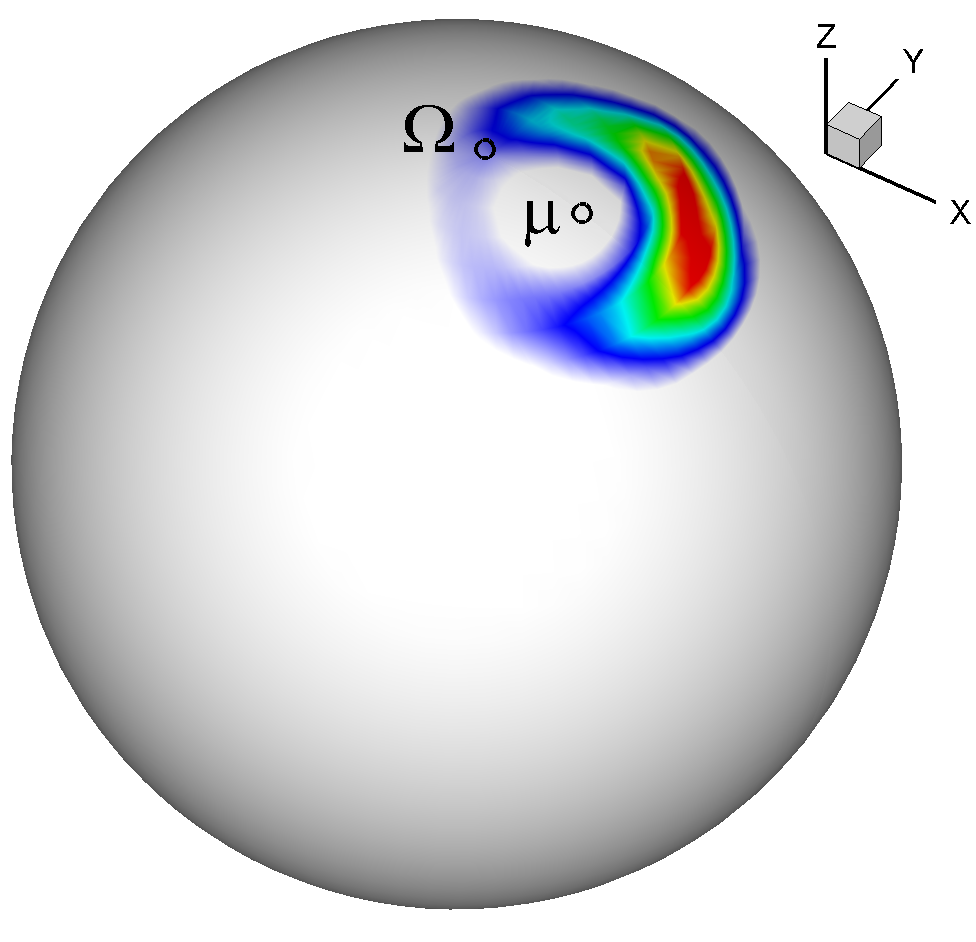
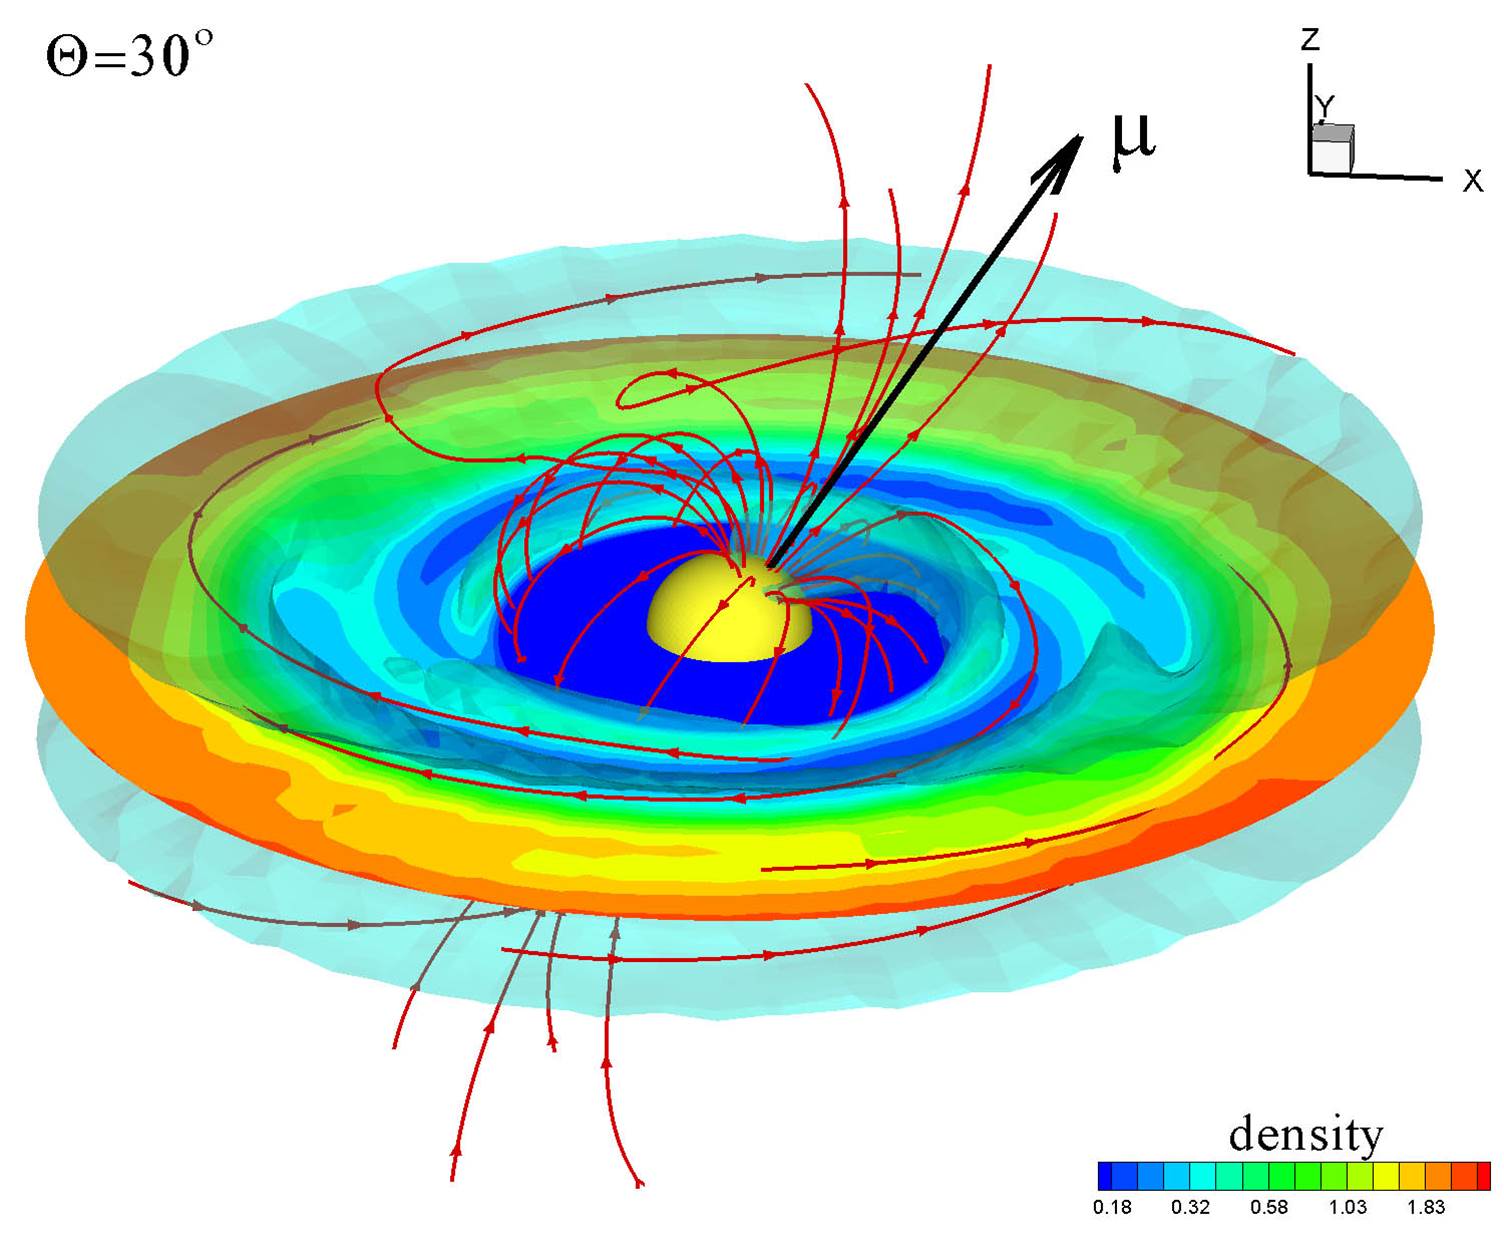
Global 3D MHD simulations of accretion onto stars with different tilt angles of the dipole field, , show that matter flows onto the star via two funnel streams (Romanova et al., 2003, 2004). The matter in the funnel streams is pulled towards the star by the gravitational force. Numerical simulations have shown for the first time the structure and shape of the funnel streams. They have shown that funnel streams are wide in the meridional direction (see left panel of Fig. 5) and narrow in the vertical direction (see slice of the density distribution in the middle panel of Fig. 5). They also show that the low-density matter blankets the whole magnetosphere, while the funnel streams represent the denser parts of the flow (see Fig. 7). The slice in the middle of Fig. 5 shows both the dipole field lines, and the field lines during the funnel accretion 666We should note that simulations of other groups also show a strong compression of the magnetosphere (e.g., Bessolaz et al. 2008; Zanni & Ferreira 2013).. It is still not clear how important such compression will be in stars with much larger magnetospheres, i.e. with . But we can speculate that the field compression might become less significant in such cases, because only the external parts of the magnetosphere interact with the disk, while the larger part of the magnetosphere is strongly magnetically dominated and so has a nearly dipole structure.
|
2.3.1 Properties of the funnel streams and hot spots
The gravitational attraction from the star accelerates the matter in the funnel streams. This, in turn, causes the formation of two hot spots where the matter hits the surface of the star. Numerical simulations helped for the first time to show the likely shape and structure of the hot spots. Results indicate they tend to be crescent-shaped, with densities and temperatures highest near the spot center (see right panel of Fig. 5). This numerical finding led to prediction for the wavelength dependence of the spot radiation, with a different spot size at different wavelengths. For example, in CTTSs, the innermost small region of the spot can radiate in X-rays, while an increasingly larger area radiates in the UV, optical, and IR. In fact, the measurements of the spot sizes in several CTTSs show that the area covered by the hot spots in optical wavelengths is relatively large, about of the stellar surface (Donati et al., 2007, 2008, 2011). On the other hand, in models of the UV radiation by the accretion shock, the best match with observations is reached if spots cover from less than up to a few percents of the stellar surface (e.g., Calvet & Gullbring 1998; Gullbring et al. 2000). More generally, observations point to smaller sizes of spots in higher versus lower energy bands. The inhomogeneous structure of the hot spots discovered in 3D simulations (Romanova et al., 2004) can potentially explain these observational results. Before these simulations, hot spots were assumed to have a homogeneous density and temperature distribution. These simulations thus opened a path for understanding the properties of hot spots in different wavebands.
These 3D numerical simulations also have shown for the first time how the shape of the hot spots depends on the tilt of the magnetic axis (Romanova et al., 2004); at small the spots have crescent shape, while as increases to larger values, the spots acquire a bar shape (see also Kulkarni & Romanova 2005). The different shapes predict corresponding differences in the light curves (Romanova et al., 2004), but these also depend on other factors like observer viewing angle. The differences from light curves obtained with the homogeneous, round spots of previous, simplified models is modest, e.g. within in test runs of accreting neutron stars (where relativistic effects were taken into account, Kulkarni & Romanova 2005). While such simple round spots thus provide a reasonable first approximation, a more accurate model of the position and shape of the spot can be important, for example in studies of accreting neutron stars, where the mass and radius (or, their ratio) can be found from relativistically-corrected light-curves (see, e.g., review by Patruno & Watts 2012). For convenience in application, an analytic formula has been obtained from multiple 3D simulation runs, with the shape and position of the spots given as a function of the magnetospheric size and the the ratio , which characterizes the level of stellar rotation (Kulkarni & Romanova, 2013).
[width=80mm]funnel-level-2
2.3.2 Moving spots: phase shifts and possible QPOs
Simulations show that the hot spots on the stellar surface are not fixed, but instead move about some preferred position. This motion leads to phase shifts in the light curves (Romanova et al., 2003; Kulkarni & Romanova, 2013). In young stars, this results in the phenomenon of “drifting period” which is frequently observed in CTTSs, where the sets of observations are usually brief (only a few stellar rotations). Recent observations by the space instrument MOST indicate that the CTTS star TW Hya shows systematic variation of its “period” (Rucinski et al., 2008), which may be connected with the drifting spot on the stellar surface, as found in earlier 3D simulations.
In millisecond pulsars, moving spots may lead to phase shifts in light-curves (Papitto et al., 2007; Patruno et al., 2009) and to timing noise (e.g., Poutanen et al. 2009; Lamb et al. 2009). Papitto et al. (2007) found a correlation between the pulse phase shifts and the X-ray flux in millisecond pulsar XTE J1814-338 (see also Patruno et al. 2009). The authors argued that the observed phase shifts were due to movements of the hot spot in response to variation in accretion rate. This phenomenon can be explained by the correlation between the hot spot longitude and the location of the magnetospheric radius as shown by Kulkarni & Romanova (2013).
In the case of very small tilts of the dipole moment, , the funnel streams can be dragged by the inner disk and the spot may systematically rotate faster or slower than the star. This can lead to the phenomenon of the quasi-periodic oscillations (QPOs) in the frequency spectrum and may possibly explain some of QPOs observed in AMXPs. Usually, one or two main high-frequency QPO peaks are observed in AMXPs (see an example in Fig. 8). The observed QPO frequencies show significant temporal variation, but the difference between peaks often corresponds to either the stellar rotation frequency , or its half-value 777This phenomenon can be possibly explained by the beat-frequency model (e.g., Miller et al. 1998).(e.g., van der Klis 2000). In many cases, however, the frequency difference is nearly fixed at a value, Hz, that does not correlate with the frequency of the star (Boutloukos et al., 2006; Méndez & Belloni, 2007). The origin of these QPOs has not yet been understood. One of QPO peaks may originate at the disk-magnetosphere boundary. The origin of the second peak is less clear, but an interesting, spot-based model has been developed by Bachetti et al. (2010). They performed systematic 3D simulations of accretion onto neutron stars with very small tilts, , and showed that these rotating spots may possibly explain one of two QPO frequencies in AMXPs, where the difference between QPO frequencies does not vary much in time and is Hz. Bachetti et al. (2010) found that the lower of two of QPO frequencies is connected with the rotation of the funnel stream, while the the higher QPO frequency is connected with unstable tongues that rotate with the frequency of the inner disk (see Sec. 2.4). Simulations show that the frequency associated with the rotating funnel streams is about Hz lower, and both QPOs move in parallel, which is in accord with observations (Méndez & Belloni, 2007). This model, however, is applicable only to stars with small , .
[width=70mm]qpo-wijnands
2.3.3 Tilted magnetosphere and waves in the disk
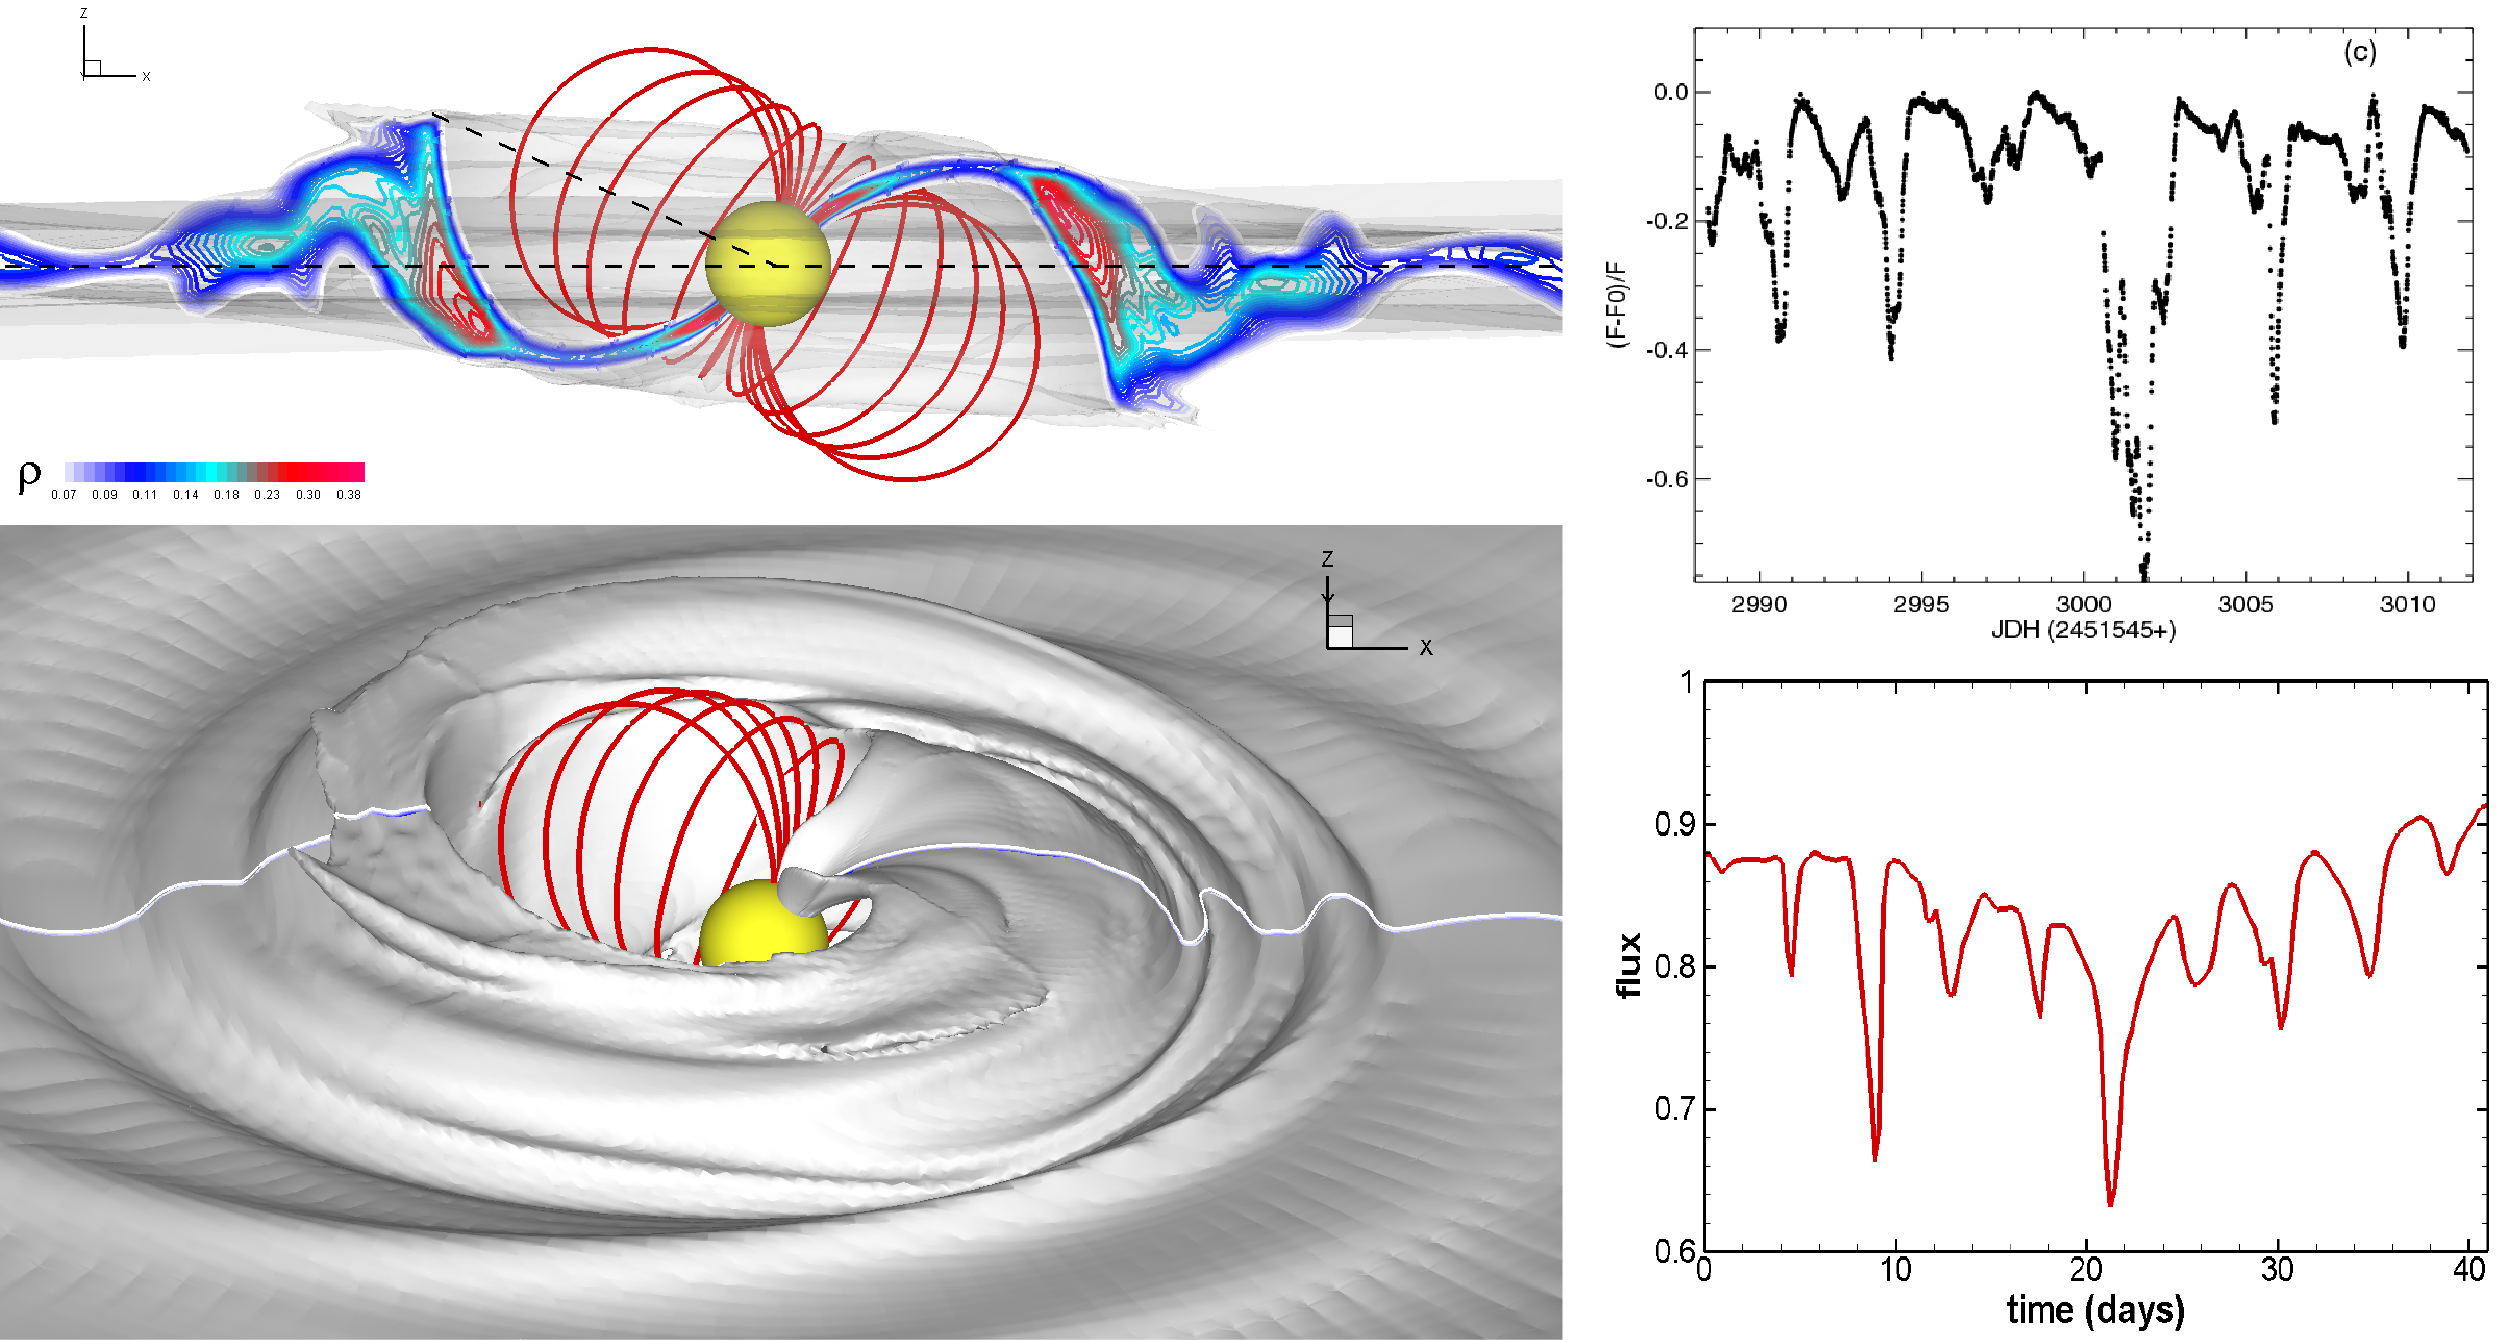
Various types of waves can propagate in accretion disks (e.g, Kato et al. 1998; Kato 2004, 2007). A star with a tilted dipole magnetosphere excites bending and density waves through the action of magnetic forces on the inner disk (see, e.g., theoretical studies by Lipunov & Shakura 1980; Lai 1999; Terquem & Papaloizou 2000 and global 3D simulations by Romanova et al. 2013). Global simulations show that, if the angular velocity of the inner disk is close to the angular velocity of the magnetosphere (fastness ), a strong bending wave forms at the disk-magnetosphere boundary. Figure 9 shows a snapshot from such a simulation, where a one-armed bending wave forms at the inner edge of the disk 888Simulations also show that if a star rotates more slowly than the inner disk, then bending waves are excited at larger distances from the star.. This bending wave may occult or reflect light from the star.
For example, Bouvier et al. (1999) noticed that CTTS AA Tau has dips in the light-curve and, interpreted these as stemming from occultation of the stellar light by a dusty disk-warp (see also Bouvier et al. 2003, 2007b). These dips are quasi-periodic with QPO period of approximately days , comparable to the expected rotation period of the star. Doppler tomography observations of AA Tau show that the dominant component of the field is a kG dipole field that is tilted at relative to the rotational axis. At this field strength the magnetospheric radius is close to the corotation radius, (Donati et al., 2010). Simulations show that in this situation a large amplitude warp forms and rotates with the frequency of the star, and so could well explain the observed dips (Romanova et al., 2013).
More recently, Alencar et al. (2010) analyzed the photometric variability of CTTSs in the young cluster NGC 2264 using data obtained by the CoRoT satellite; they concluded that AA Tau-like light curves are fairly common, and are present in at least of young stars with inner dusty disks (see also Carpenter et al. 2001; Stauffer et al. 2014, 2015). Fig. 9 compares observed and simulated light curves, for a case in which the star is occulted by the dusty warp. Overall, results indicate that the warps can produce dips if the dipole magnetosphere is tilted at sufficiently larger angle, , relative to the rotational axis.
There are also two persistent density waves which form in the inner disk and rotate with the frequency which is lower than the Keplerian frequency of the inner disk. These waves are good candidates for explanation of the one of two QPO frequencies observed in AMXPs. It was frequently suggested that one of QPO frequencies is associated with some inhomogeneities in the inner disk, though the nature of inhomogeneities has not been understood (van der Klis, 2006). Numerical simulations show that these inhomogeneities may be associated with persistent density waves at the inner disk (Romanova et al., 2013).
 |
2.3.4 Magnetospheric accretion from turbulent disks
The full dynamical structure of accretion disks is still uncertain. It is commonly inferred that the disks are turbulent and the turbulence can be initiated and supported by the MRI instability. MRI-driven turbulence has been extensively studied in axisymmetric and local/global 3D MHD simulations (e.g., Hawley et al. 1995; Brandenburg et al. 1995; Stone et al. 1996; Armitage 1998; Hawley 2000; Beckwith, et al. 2009; Flock, et al. 2011; 2011). In most of simulations the central object is non-magnetized, usually a black hole.
Accretion from MRI-driven turbulent disks onto a magnetized star has been investigated numerically in both axisymmetric and 3D simulations (Romanova et al., 2011b, 2012). These simulations have shown that the main aspects of magnetospheric accretion are similar: the turbulent disk is truncated by the magnetosphere and matter flows to the star along funnel streams.
It is important to note that the position of the magnetospheric radius does not depend much on the weak magnetic field associated with the MRI-driven turbulence. Its magnetic stress is responsible for the angular momentum transport, but the associated magnetic pressure is smaller than gas pressure, and the ram pressure is much larger than gas or magnetic pressure. This is why the formula in Eq. 1 provides accurately the position of the truncation radius in turbulent disks as well.
The main difference between accretion from the laminar disk and turbulent disk is that accretion of the individual cells may lead to variability in the light-curve. The variability time-scale depends on the scale of the turbulent cells . If it is small compared with the thickness of the disk, , then the disk acts as a laminar disk and only small-amplitude variability is expected, as found in axisymmetric simulations (Romanova et al., 2011b)999Many axisymmetric simulations also show strong spikes which are connected with very low (only small numerical) diffusivity in the code, and episodic accumulation of matter at the disk-magnetosphere boundary.. For the largest-scale turbulent cells, , much rarer but higher amplitude flares are expected in light-curves (Romanova et al., 2013). Observations of CTTSs show that many stars have irregular light-curves with variability observed at different time-scales (e.g., Stauffer et al. 2014). Fig. 10 (left panel) shows an example of 3D simulations from the disk with a large-scale turbulence, while the left two panels show sample light curves at two different time-scales. Simulations of turbulent accretion with different scales of the turbulence, together with comparisons between modeled and observed light-curves, may help us understand the nature of turbulence in the disk.
 |
2.3.5 Inflation of the field lines
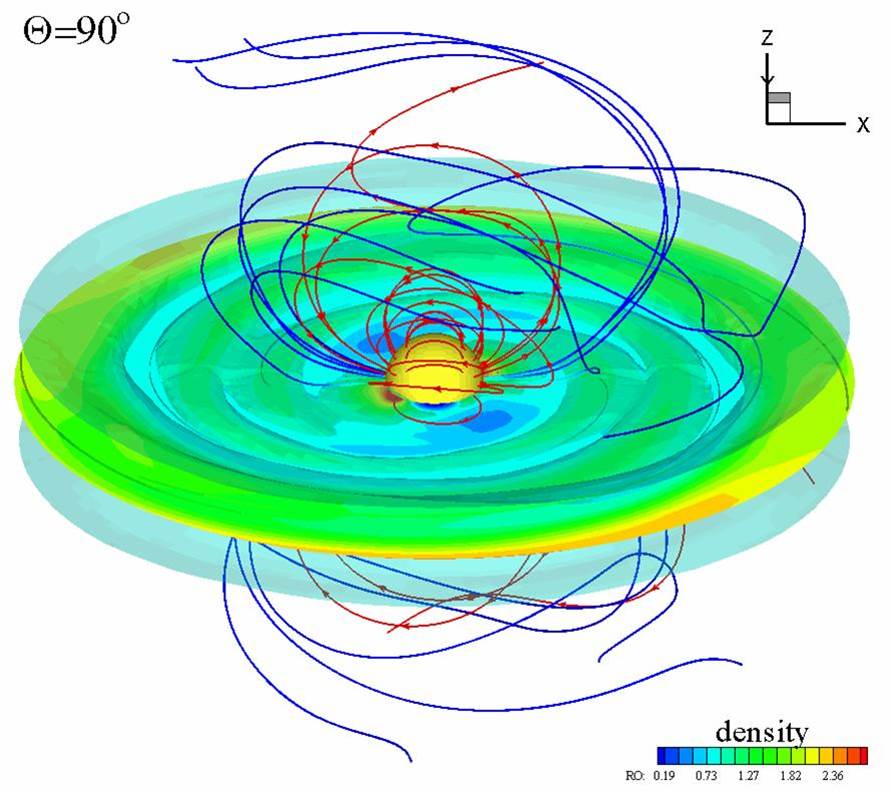
Three-dimensional simulations show that the field lines of the external magnetosphere inflate due to the disk-magnetosphere interaction. Fig. 6 (left panel) shows a snapshot from a simulation in which . One can see that the field lines of the inner magnetosphere are closed; this is the region in which magnetic energy dominates. Some field lines are trapped in the disk and are azimuthally wrapped by the disk matter. The field lines connecting the polar regions of the star with the disk inflate and wrap around the rotational axis forming a magnetic tower. There is a set of the partially inflated field lines that thread the inner parts of the disk, and transfer the angular momentum between the star and the disk and between the star and corona (see also Zanni & Ferreira 2013). In 3D simulations, a magnetic tower forms, however, most simulation runs show little or no outflow101010This is the main restriction of the current 3D simulations, where the main computing power is used for resolving the low-density closed magnetosphere and the disk, while the density in the corona is relatively high, and matter pressure dominates the magnetic pressure, suppressing magnetic or magneto-centrifugally driven outflows.. The inflation of the field lines is observed at different tilts of the dipole magnetosphere, including the extreme case of very large tilt of the magnetosphere, , where the magnetic axis is located in the equatorial plane of the disk. The right panel of Fig. 6 shows that the magnetic field lines of the external magnetosphere inflate, and also have a tendency to leave the disk and to expand into the corona above and below the disk. Simulations show that the magnetic field lines always wrap around the rotational axis, independent of of the tilt angle . However, it is not yet clear whether the outflows represent a common feature of accreting magnetized stars, or whether they are more typical for the case of the rapidly-rotating stars (see Sec. 3.1). Outflows were investigated in greater detail in 2.5D (axisymmetric) simulations, where the density in the corona is lower compared with the 3D simulation cases (see Sec. 3.1).
2.3.6 Stellar spinup/spindown from angular momentum gain/loss
A star may spin up or spin down, depending on the total angular momentum flux onto the star. The net angular momentum flux to or from the surface of the star, , is composed of two parts: the angular momentum flux carried by the matter () and that carried by the magnetic field () :
| (6) |
where the fluxes are integrated along the surface of the star; and are the poloidal velocity and the poloidal magnetic field.
Simulations show that the disk and the star exchange angular momentum mainly through the funnel streams. Near the disk, the angular momentum in the funnel stream is carried by the matter, and the matter then slightly twists the field lines threading the funnel streams; this twist determines the torque on the star (e.g., Romanova et al. 2002; Long et al. 2005; Zanni & Ferreira 2013). The sign of the term (more precisely, the sign of the component at the stellar surface) determines whether the star spins up or down. At the stellar surface, the angular momentum carried by the field, is much larger than that carried by matter, .
Long et al. (2005) performed a set of 2D simulation runs at different angular velocities of the star, , to find the critical value of the fastness parameter , corresponding to the rotational equilibrium state (i.e., when ). He found that, in the rotational equilibrium state , that is the fastness parameter . They found that the inner disk rotates more rapidly than the magnetosphere, because the star loses some angular momentum to the corona along the inflated or partially-inflated field lines. This negative torque is compensated by a positive torque from the inner disk. Therefore, the fastness parameter corresponding to the rotational equilibrium state, , strongly depends on the amount of angular momentum that flows to the inflated or partially-inflated field lines 111111This angular momentum depends on the coronal density: it can be larger in case of young stars, which can have strong stellar winds, and smaller in cases of neutron stars..
3D simulations also show that a star can spin up, spins down, or be in a rotational equilibrium state. It is interesting to note that the matter fluxes onto the stellar surface, as well as the torques on the star, are similar across different values of (e.g., Romanova et al. 2003). This is because the magnetospheric radius is approximately the same for different .
In case of steady long-lasting accretion, a magnetized star is expected to be in the rotational equilibrium state. Probably many CTTSs are in this state (see, e.g., review by Bouvier et al. 2007a). In accreting millisecond pulsars, the situation is more complex, because accretion occurs during episodes of accretion outbursts, where the accretion rate increases a few orders of magnitude, then decreases back to small values (see reviews by van der Klis 2006; Patruno & Watts 2012). A propeller stage and spinning-down of a neutron star is expected during the rise and decline of the outburst (e.g., Patruno et al. 2009), while the magnetospheric accretion and spinning-up is expected during period of the high accretion rate. These issues are further discussed in Sec. 3.1.
 |


2.4 The unstable regime of accretion due to Rayleigh-Taylor instability
A new regime of accretion has been found in 3D simulations of stars whose dipole moment is only slightly tilted relative to the rotational axis (). These simulations were performed in order to better understand AMXPs, for which the tilt of the dipole magnetosphere is expected to be small. The simulations show that, in the unstable accretion regime, the magnetic Rayleigh-Taylor (R- T) instability enables matter to penetrate the magnetosphere via several chaotically-formed “tongues” (Kulkarni & Romanova, 2008; Romanova et al., 2008; Bachetti et al., 2010; Kurosawa & Romanova, 2013). In earlier studies, it was suggested that the instabilities at the disk-magnetosphere boundary may lead to the mixing of plasma with the field in the external layers of the magnetosphere (Arons & Lea, 1976). However, global 3D MHD simulations show that the unstable tongues can deeply penetrate into the magnetosphere. The fact that the magnetic field is not an obstacle for the Rayleigh-Taylor instability has been also shown by Stone & Gardiner (2007a, b) who performed local (in the box) 3D simulations wherein the homogeneous magnetic field is placed at different orientations relative to the boundary between the light and heavy fluids. These simulations and earlier ones by Wang & Robertson (1984, 1985); Rastätter & Schindler (1999) show that the Rayleigh-Taylor instability leads to the formation of small-scale waves and filaments that merge to form much larger filaments, which then deeply penetrate into the magnetically-dominated, low-density regions.
The matter in the randomly-forming tongues is accelerated by gravity and is deposited onto the stellar surface as hot spots with irregular shape and random position. The light curves from these spots are often irregular, with several peaks per rotational period. Fig. 11 (two left panels) compares 3d views of matter flow in the stable and unstable regimes, as well as the light curves from the hot spots.
Observations of CTTSs show that many CTTSs exhibit irregular, chaotic-looking light curves (Herbst et al., 1994; Alencar et al., 2010; Cody et al., 2014; Stauffer et al., 2014). The right panel of Fig. 11 shows the chaotic-looking light curve of the CTTS TW Hya obtained with the MOST satellite (Rucinski et al., 2008). The characteristic time-scale between flares (a few events per rotational period) corresponds to that expected in the unstable regime of accretion.
Fig. 12 shows an example of accretion through instabilities. The panels show that matter of the disk pushes the magnetic field lines aside, and penetrates deep onto the magnetosphere, where it is stopped and channeled into the funnel streams. These usually do not live long, less than period of rotation at the inner disk. After depositing matter onto the star, they become weaker and are destroyed by interaction with the magnetosphere. Fig. 13 (top panels) shows several consecutive slices of the density distribution. One can see that the number and the position of tongues varies in time. The light-curve calculated from the hot spots (at an observer’s angle ) shows somewhat chaotic behavior (see bottom left panel of the same figure). Fourier analysis of this light curve shows several frequencies that are associated with chaotic hot spots, as well as the rotational period of the star. Wavelet analysis shows at which interval the instabilities are stronger.
2.4.1 Theoretical background for Rayleigh-Taylor instability
According to theoretical studies (e.g., Chandrasekhar 1961), a magnetic field that is parallel to the boundary between the heavy and light fluids is not an obstacle for the development of R-T unstable modes at the boundary. The sketch in Fig. 14 demonstrates that the situation at the disk-magnetosphere boundary is similar to that considered by Chandrasekhar (1961). In the case of a rotating disk, the inner disk can be unstable if the effective gravitational acceleration is negative: , where and are gravitational and centrifugal accelerations, respectively.
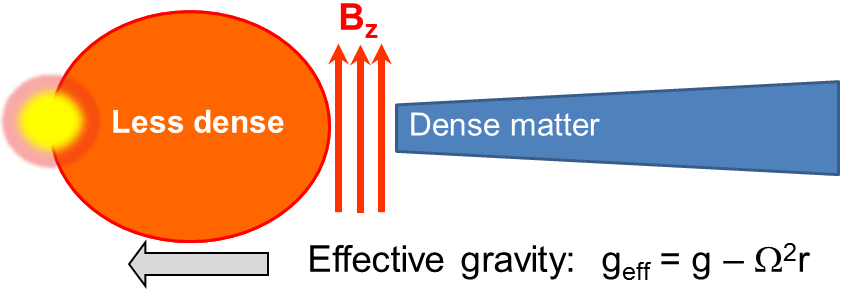 |
There are a few factors that can suppress the instability, however. Specifically, the radial shear of the angular velocity, , can do so by smearing out the perturbations. Spruit et al. (1995) performed a general analysis of disk stability in the thin disk approximation, taking the velocity shear into account (see also earlier work by Kaisig, Tajima and Lovelace 1992). The disk has a surface density and is threaded by a magnetic field with a vertical component, . Their analytical criterion for the development of instability is:
| (7) |
One can see that the sign and value of the effective gravitational acceleration are important in this criterion. Namely, the disk-magnetosphere boundary is unstable if is negative (i.e., when the effective acceleration is directed towards the star). The term characterizes the level of compression of the surface density and magnetic field in the disk. Instability occurs if the product of and is large enough to overcome the stabilizing effect of the velocity shear, . Simulations show that this criterion, developed for a disk, also works well for the disk-magnetosphere boundary (e.g., Kulkarni & Romanova 2008, 2009; Blinova et al. 2016).
2.4.2 The boundary between the stable and unstable accretion regimes
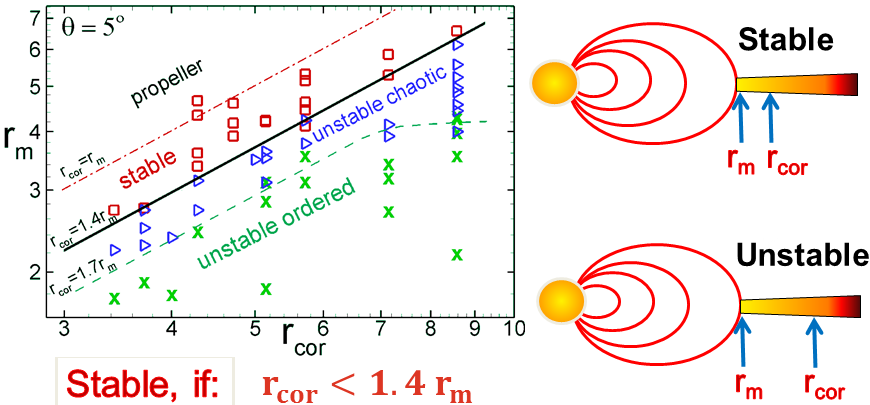
It is important to identify the boundary between the stable and unstable regimes of accretion. Recent studies show that this boundary occurs at a critical ratio of magnetospheric to corotation radii , corresponding to a fastness parameter (Blinova et al., 2016). Fig. 15 shows the results of multiple simulation runs (symbols). The black solid line shows the boundary between the stable and unstable accretion regimes; accretion is unstable below the line and stable above the line. The instability becomes stronger further away from the line, and it is mildly strong near the line. The red dashed line shows the boundary (), above which the propeller regime is expected. These simulations were performed for stars with and small viscosity parameter, .
Test simulations with larger values of parameter of viscosity (i.e., ), show that the instability is stronger, and the transition to the unstable regime is expected at the larger values of the fastness parameter, (i.e., closer to the propeller line , compared with the lower viscosity, , case. This can be explained by the fact that, at larger values of , the compression factor is larger, and thus the instability starts more readily (Blinova et al., 2016)121212The effective parameter can be estimated from comparisons of observations with models of accretion. For example, Bisnovatyi-Kogan, Klepnef, & Giovannelli (2014) derived the value for outburst of accretion in X-ray transient A0535+26/HDE245770.. In addition, a course grid resolution suppresses the instability: comparisons of simulations at different grid resolutions show that the instability starts at larger values of in case of the finer grid, implying that the courser grid effectively acts to suppress the instability (Blinova et al., 2016). This leads to the question whether the boundary between regimes may be located at the line , if the grid is sufficiently fine ? Addressing this will require a systematic set of studies at even higher grid resolution.
An interesting phenomenon has been recently observed in the AMXP SAX J1808.4-3658, where the rotation frequency of the star is known ( Hz), and where the two main QPO frequencies vary between values lower and higher than this stellar rotation frequency (see Fig. 8). It has often been suggested that one of frequencies is associated with the frequency of the Keplerian rotation at the inner disk, but clear evidence for this has been lacking. Recent studies (Bult & van der Klis, 2015) found that the pulse fraction (which is associated with the magnetospheric accretion onto the surface of the neutron star) strongly decreases when the QPO frequency increases up to the frequency of the star, that is when the inner disk rotates more rapidly than the magnetosphere of the star. At the end of the outburst, when the accretion rate decreases, the QPO frequency decreases, and when it passes the stellar frequency, the pulse fraction increases back to large value. This phenomenon provides evidence that this QPO is associated with the inner disk, and that the transition of the inner disk through the point leads to change in the magnetospheric accretion. One possibility is that accretion becomes unstable and therefore the pulse fraction decreases when the inner disk reaches the radius and moves closer to the star (van der Klis, privet comm.). If true, then the boundary line between stable and unstable regimes should be at . To substantiate this hypothesis, more work is needed in both numerical modeling and observations of different AMXPs.
Modeling of accretion onto stars with larger tilts of the dipole magnetosphere (i.e., and ) shows that the instability develops, however more matter accretes in funnel streams above the magnetosphere. The hot spots associated with these streams provide the sinusoidal component of the light curve, while the chaotic hot spots provide the irregular component in the light curve. The amplitude of this irregular component is high for , but it decreases for models with larger (Blinova et al., 2016).


2.4.3 The ordered unstable regime
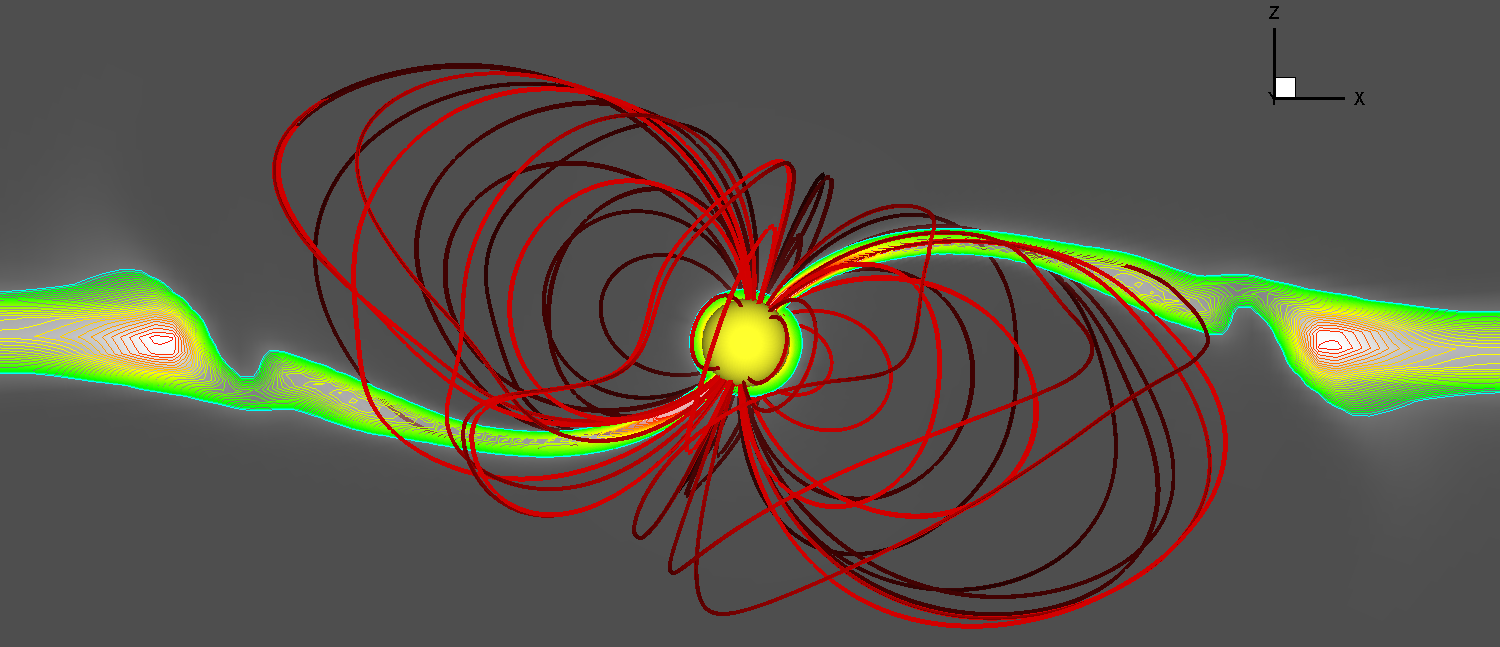
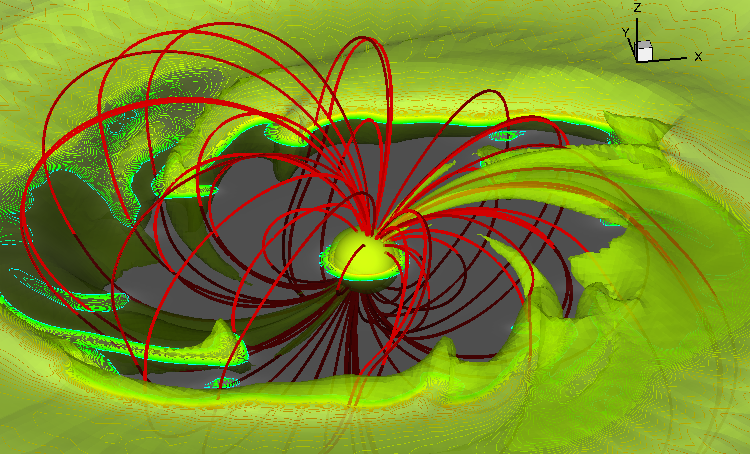
Another important regime of accretion has been found in simulations of accretion onto slowly rotating stars, when the condition has been satisfied (Blinova et al., 2016). In this regime, one or two ordered tongues form and rotate with the angular velocity of the inner disk. Fig. 16 shows an example of accretion in this ordered unstable regime. The top panels of Fig. 17 show equatorial slices, and the bottom panels show the light curve associated with rotating hot spots, as well as Fourier and wavelet analysis of this light curve. The period associated with this instability dominates in both the Fourier and wavelet spectra. This boundary between chaotic and this newly found ordered unstable regimes is shown in Fig. 15 as the green dashed line. It corresponds to the fastness parameter .
The frequency of oscillations in the ordered unstable regime depends on the accretion rate. When the accretion rate increases, the inner disk moves closer to the star, and the frequency of oscillations increases (and vice versa). This mechanism may be important for understanding the high-frequency oscillations in AMXPs, for which a frequency-luminosity correlation has been observed (e.g., Papitto et al. 2007). Ordered rotation of “tongues” probably reflects an ordered rotation of the density waves in the inner disk; however this issue should be studied further. The QPO radiation may come from the inner disk waves, from the ordered tongues, or from the rapidly-rotating hot spots which glide along the surface of the slower-rotating star.
In the chaotic unstable regime, the whole system of chaotic-looking tongues rotates with the angular velocity of the inner disk. This phenomenon could be detected in AMXPs, where the observations cover many rotational periods of the neutron star. This ordered rotation of the system of chaotic spots could induce a QPO with a frequency that increases when the inner disk moves inward. During this motion, the unstable tongues become more and more ordered, and the AMXP switches gradually to the ordered regime of unstable accretion. During this process, the quality factor increases. In fact observations do indicate that the quality factor of QPOs usually increases with the frequency of QPO (e.g., Barret et al. 2007).
In young stars accretion in the ordered unstable regime is expected during periods of enhanced accretion rate, that is, during EXor and FUor stages of evolution (see ,e.g., review by Audard et al. 2014). Any short-period oscillations may be connected with rotation of the hot spots associated with ordered unstable tongues. Recent X-ray observations of the young star V1647 Ori during two accretion outbursts revealed a 1 day period that is very short for a young star, and corresponds almost to the stellar rotation break-up period (Hamaguchi et al., 2012). Numerical models suggest that this type of variability could be connected with the ordered unstable regime of accretion. Future search of the short-term variability in young stars would be helpful for understanding processes during their accretion outburst, like in FUors and EXors.
In the above simulations the unstable regime has been investigated in case of disks. In the future, similar studies should be performed with the MRI-driven turbulent disks.
 |
 |
2.5 Accretion onto stars with larger magnetospheres
The simulations described in the above sections are relevant to stars with relatively small magnetospheres, such as CTTSs and AMXPs, where the size of the magnetosphere is only a few times larger than the radius of the star. However, the magnetospheres are larger for intermediate polars, , and much larger for X-ray pulsars. A special set of simulations has been performed to investigate the disk-magnetosphere interaction in systems with larger stellar magnetospheres, where the magnetospheric radius (Romanova et al., 2014). Much larger values of the stellar magnetic moments were taken for these simulations.
The slice of the density distribution in Fig. 18 shows that the disk matter stops at the distance and flows onto the star in two funnel streams, which are narrow in the vertical direction. Fig. 19, on the other hand, shows that the funnel stream is wide in the horizontal direction. The corotation radius is large compared to the magnetospheric radius, , and accretion through R-T instabilities is expected. Simulations show that the matter in the inner disk penetrates through the external layers of the magnetosphere due to the R-T instability, and this instability is observed at the disk-magnetosphere boundary. However, the unstable tongues only penetrate the outer parts of the external magnetosphere, while the matter flows onto the star in two ordered funnel streams. Each funnel stream may split into several streams, because matter flows into the funnel stream from higher-density regions (i.e., from the unstable tongues; see Fig. 19).
2.6 Accretion onto stars with complex magnetic fields
Measurements of the surface magnetic fields of CTTSs indicate that they have a complex structure (e.g., Johns-Krull et al. 1999; Johns-Krull 2007). Furthermore, measurements of the magnetic fields of nearby low-mass stars using the Zeeman-Doppler technique show that their fields are, also, often complex (e.g., Donati and Collier Cameron 1997; Donati et al. 1999; Jardine et al. 2002). The observed surface magnetic field is often approximated with a set of multipoles whose magnetic moments have different misalignment angles relative to the rotational axis (i.e., different tilts), as well as different phases in the longitudinal direction (e.g., Jardine et al. 2002). The surface magnetic field of a star with a complex magnetic field can be approximated by a superposition of tilted dipole, quadrupole, octupole, and higher order multipoles: .
A star with a quadrupole or octupole magnetic field will also truncate the disk, albeit at smaller distances from the star (compared to that of a pure dipole field). The magnetospheric radius can be derived in analogy with the case of a pure dipole field (see Eq. 2). For simplicity, we assume that the primary axis of the multipolar field is aligned with the rotation axis, and therefore that the th multipolar component of the magnetic field can be written in the form . From the balance of the largest stresses , and taking , we obtain:
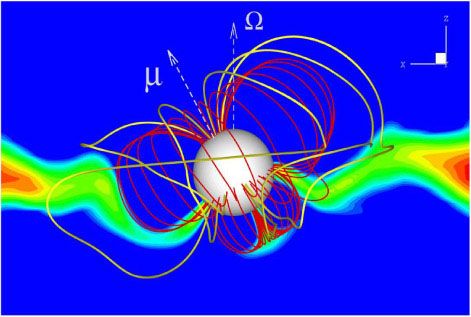
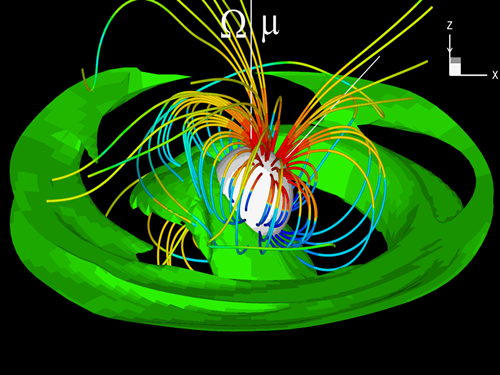
|
| (8) |
where is a coefficient that can be different for different multipoles. This formula can be applied in the cases of aligned multipoles, and it can also be used for estimates of the magnetospheric radius in the more general case in which the multipole is not aligned with the rotational axis. We should note that the in the disk plane for aligned fields of -th order multipoles, such as a quadrupole field (Long et al., 2007), and matter could flow directly onto the star in the disk plane. So does not reflect where the inflowing matter stops, but only the size of the magnetosphere. Gregory (2011) studied accretion onto stars with the complex magnetic fields semi-analytically, suggesting a fixed configuration of the field and showed that complex paths of matter flow are expected.
[width=60mm]octupole-slice
A number of global 3D MHD simulations have been performed with the goal of better understanding accretion onto stars with complex, non-dipole magnetic fields. Initial simulations were performed to study the superposition of the dipole and quadrupole fields (Long et al., 2007, 2008). These simulations show that matter partially accretes onto the star near the magnetic poles, and partially to the ring associated with the quadrupole component of the field. Fig. 20 shows an example of simulations where the dipole and quadrupole moments are aligned (left panel) and misaligned (right panel). In the misaligned case, the magnetic field looks more complex than in the aligned case.
In the case of a superposition of the dipole and octupole fields, usually even a small dipole field determines the magnetospheric accretion, because the octupole field decreases with the distance rapidly (). That is why, to demonstrate accretion onto a star with octupolar field, the dipole component has been taken to be very small for demonstration (see Fig. 21; Long et al. 2012). In this case, the matter accretion forms two equatorial belts.
Recent measurements of the surface magnetic field in CTTSs have shown that, in several stars, the dominant components of the field are dipole and octupole, while quadrupole and higher-order components are smaller (Donati et al., 2007, 2008). Using stellar parameters obtained from these observations, the modeling of accretion onto the observed stars was somewhat simplified. Figures 22 and 23 show 3D MHD simulation results for two observed CTTSs : BP Tau, where the octupole component is small (Long et al., 2011), and V2129 Oph, where the octupole component is relatively large (Romanova et al., 2011b).

2.7 Modelling accretion onto the CTTS BP Tau
The surface distribution of the magnetic field of the CTTS BP Tau has been measured with the Doppler spectro-polarimetry technique (Donati et al., 2008). The observed surface magnetic field has been decomposed into spherical harmonics, and it was found that the field is mainly poloidal with only of the total magnetic energy contained within the toroidal field. The poloidal component can be approximated by dipole () and octupole () moments, which each comprise and of the magnetic energy, respectively. Other multipoles (up to ) have only of the total magnetic energy. Donati et al. (2008) concluded that the magnetic field of BP Tau is primarily composed of dipole and octupole moments, with kG () and kG (), respectively.
Long et al. (2011) performed global 3D MHD simulations of accretion onto a model star with parameters close to those of BP Tau: , , and a rotational period of days (corresponding to a corotation radius of ). In this 3D model, the magnetic field has been approximated using superposed tilted dipole and octupole moments, with polar magnetic field amplitudes of 1.2 kG and 1.6 kG, respectively. Comparison of the dipole and octupole fields (using Eqn. 8) shows that, in BP Tau, the dipole field dominates almost up to the surface of the star.
Fig. 22 shows the distribution of the magnetic field near the star (left panel) and at larger distances from the star (middle panel). The right panel shows that matter flows from the disk onto the star in two funnel streams. However, near the stellar surface, the octupole component slightly alters the funnel streams such that matter is deposited closer to the magnetic poles than those originating from a pure dipole. Moreover, the hot spots are rounder relative to the crescent-shaped hot spots associated with the pure dipole case. The shape and position of hot spots obtained in numerical simulations were in good agreement with those obtained from observations (Long et al., 2011).
2.8 Modelling accretion onto V2129 Oph, and comparisons of spectra
In another example, accretion onto a modeled star with parameters close to CTTS V2129 Oph has been investigated (Romanova et al., 2011b). This star has a mass of , a radius of , and a rotational period of days. The magnetic field of this star is dominated by a dipole component of kG and octupole component of kG, both of which are tilted at small angles about the rotational axis (Donati et al., 2011).
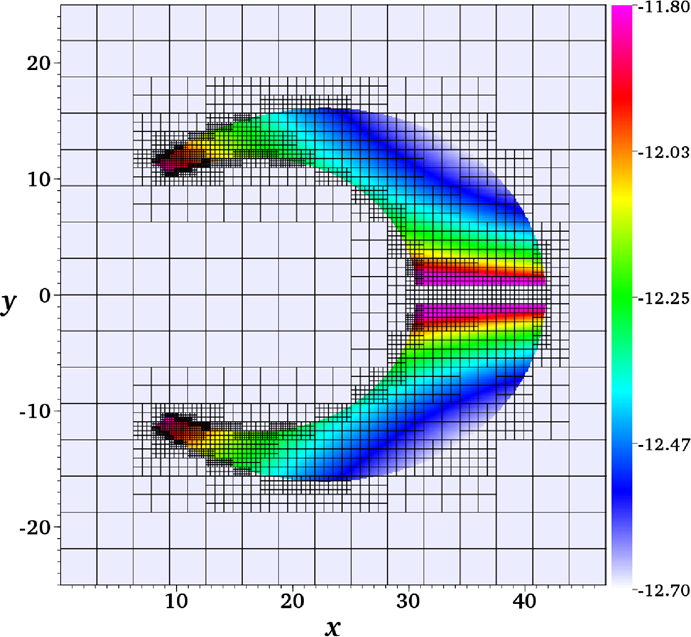
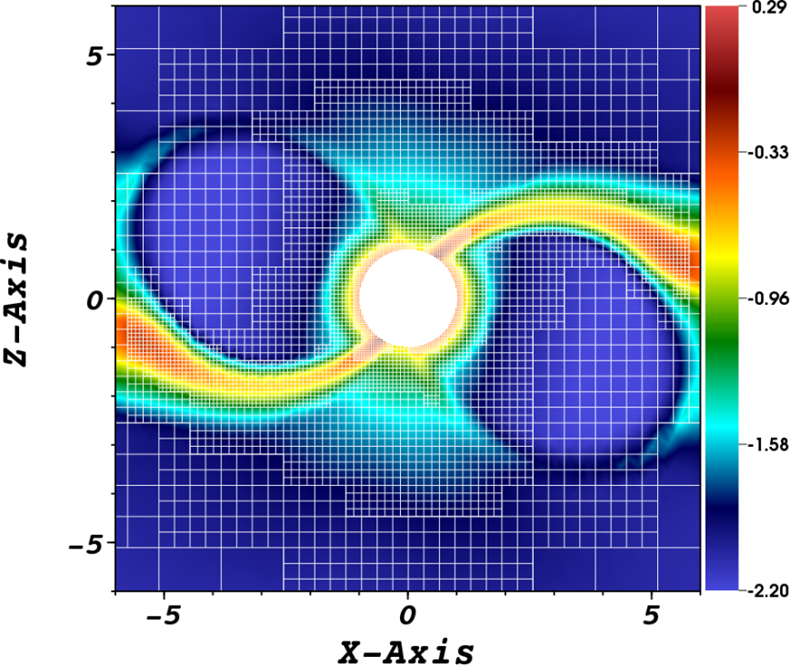
Fig. 23 (left two panels) shows the initial distribution of the magnetic field. The octupole component of the field dominates near the star, while the dipole component dominates at larger distances. The dipole and octupole fields are equal at approximately . Simulations show that matter flows onto the star in two funnel streams above and below the dipole component of the magnetosphere (see the slice of the density distribution in the right panel of Fig. 23). However, in the region where the octupole field dominates, the streams are redirected by the octupolar field toward higher latitudes on the surface of the star
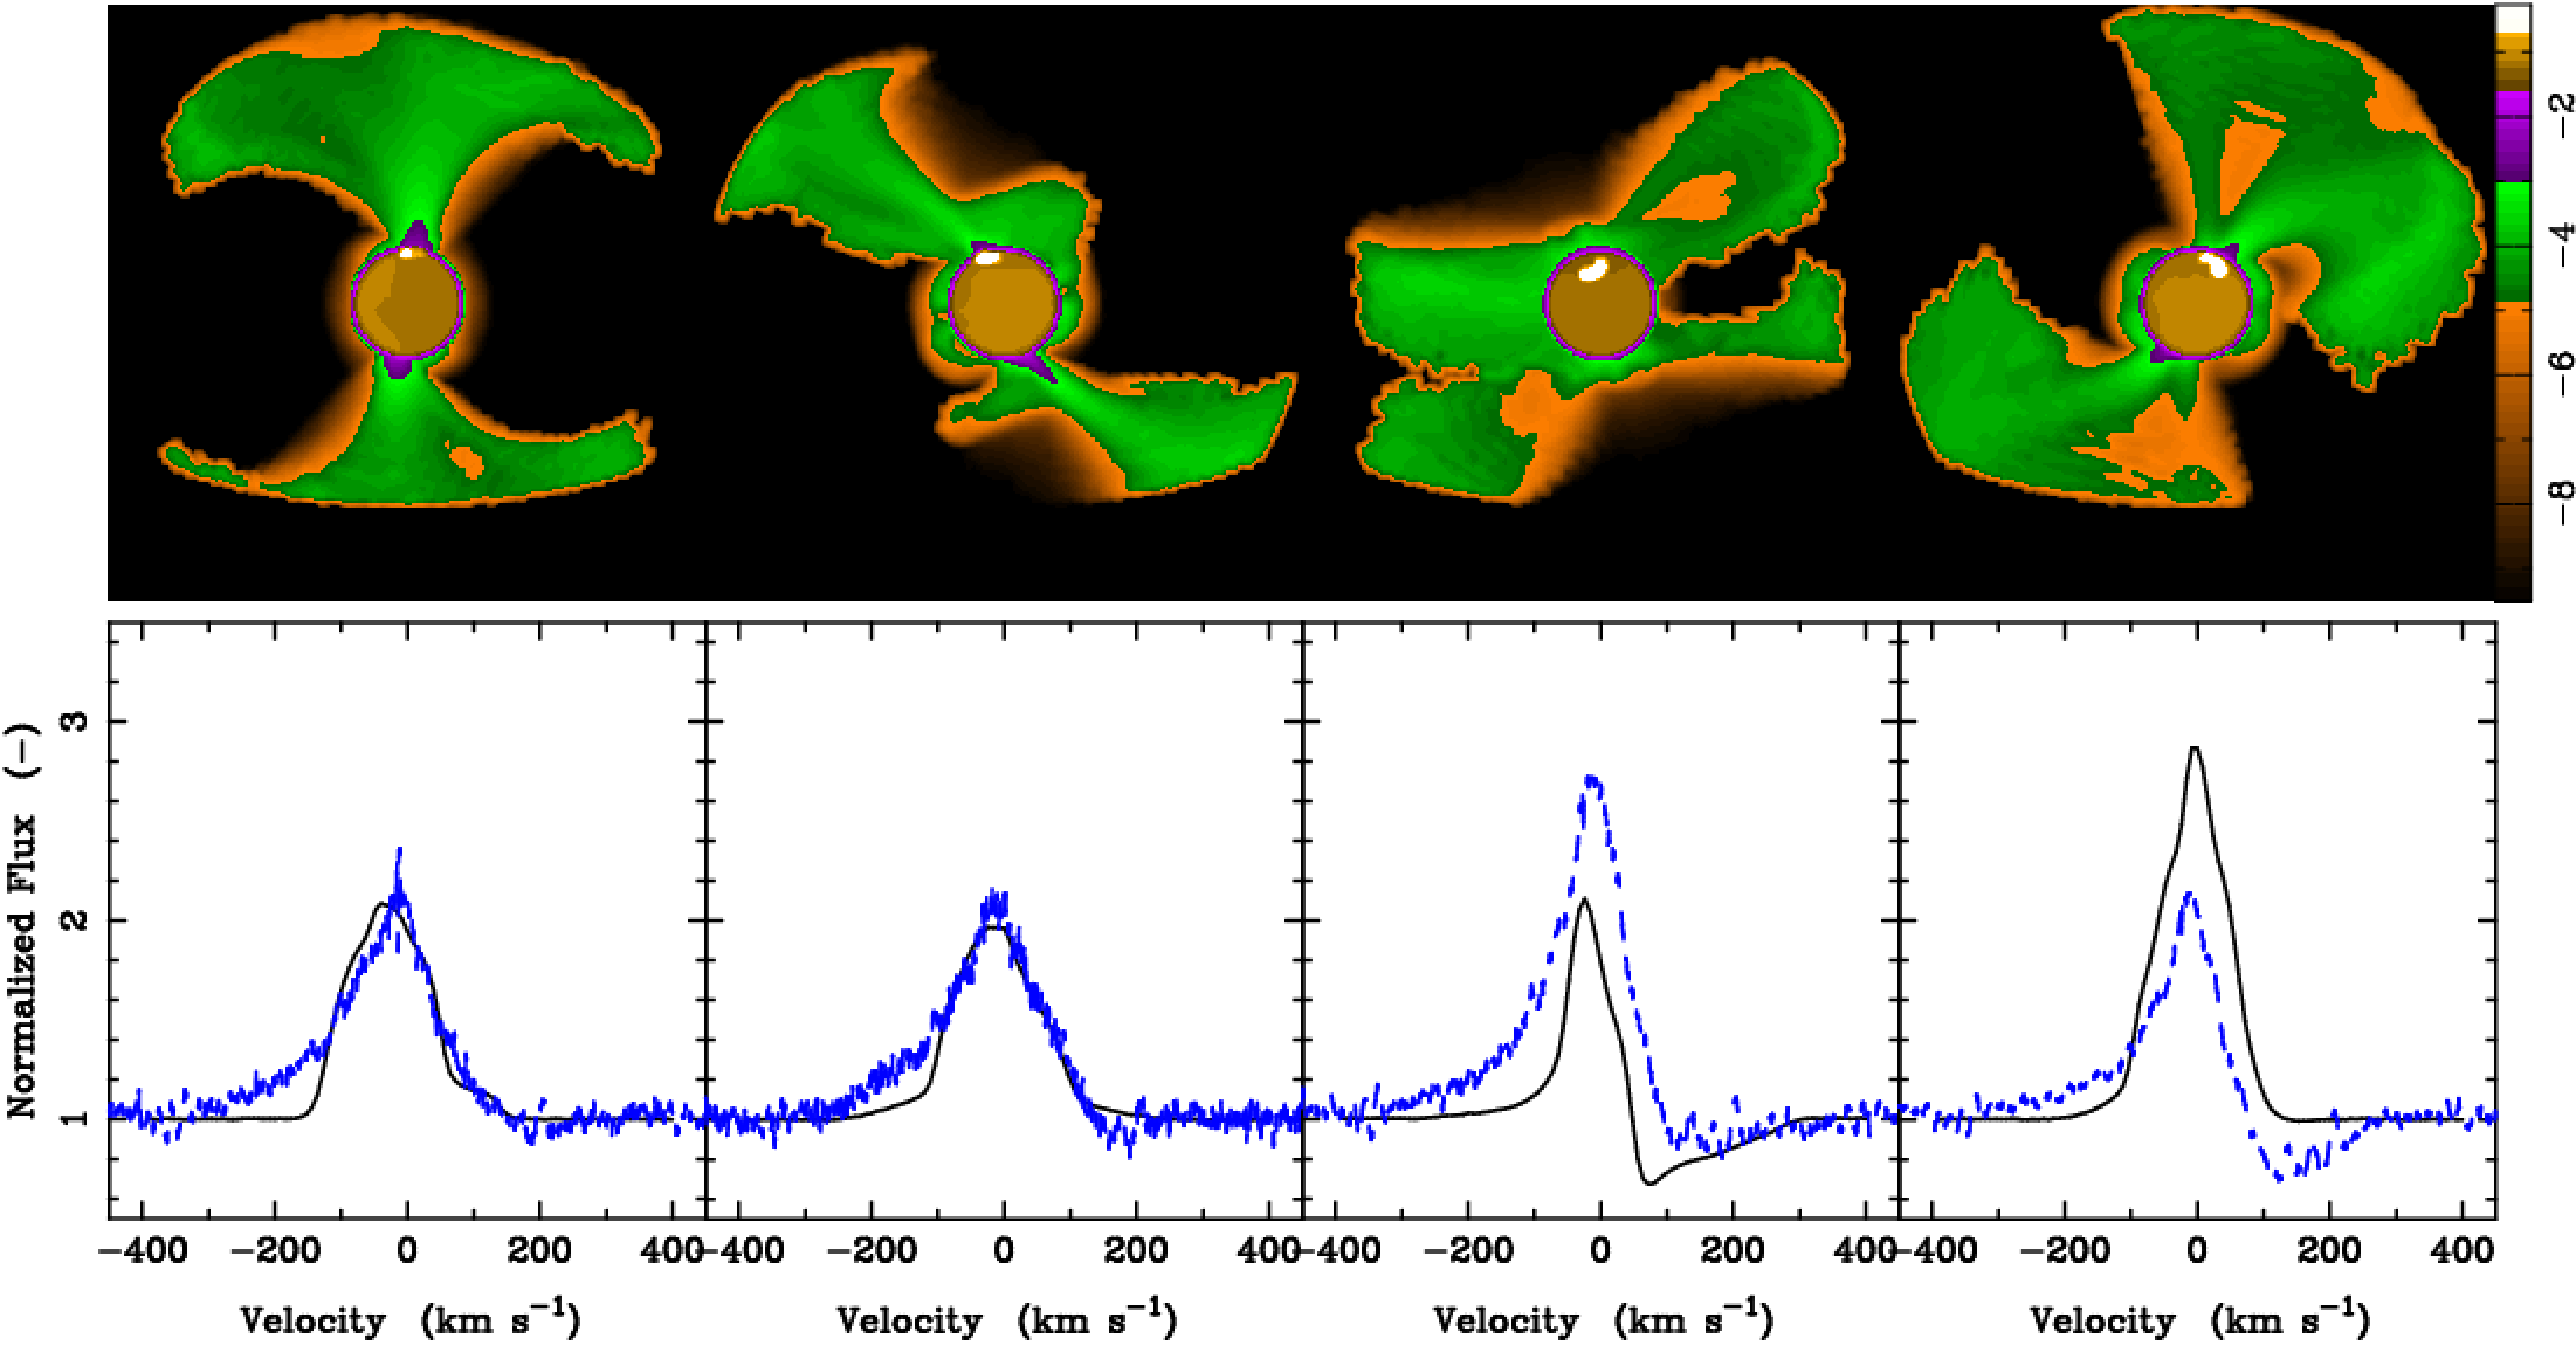 |
Three-dimensional simulations provide us with the dynamical characteristics of matter flow around magnetized stars (the distribution of, e.g., density, velocity, temperature). However, for comparisons with observations, it is important to calculate the spectrum of the modeled star. To calculate the radiation from the modeled matter flow and, subsequently, the spectrum in the Hydrogen lines, the 3D Monte Carlo radiative transfer code TORUS has been used (e.g., Harries 2000; Kurosawa et al. 2004, 2008). The results of 3D MHD simulations (density, velocity etc. distribution) were projected onto the adaptive mesh refinement grid of the TORUS code (see Fig. 24). Fig.25 (top panels) shows the emission of the funnel streams calculated in the H spectral line shown for different phases of stellar rotation. The bottom panel of the same figure compares the modeled and observed spectra of the H line. The plot shows that the observed and modeled spectra are in good agreement (Alencar et al., 2012). This is an exciting example where a 3D MHD model, combined with a 3D stellar radiative transfer model, with realistic parameters has been compared with detailed observations and resulted in a good match. This model shows that global 3D simulations can properly describe realistic matter flow in CTTSs, and that the 3D radiative transfer code TORUS can provide realistic spectra. These comparisons of simulations with observations also act as a “proof of concept” of the magnetospheric accretion paradigm, suggested earlier theoretically (e.g., Camenzind 1990; Königl 1991). Of course, this is an example of stable accretion, for which the magnetospheric and corotation radii are similar in value, which is typical for the stable accretion case.
Simulations also predict the magnetic configuration of V2129 Oph on a larger scale (see Fig. 26). The disk-magnetosphere interaction leads to the winding and inflation of the external magnetic field lines, which thread the disk at radii . The figure shows that a strong azimuthal component of the field is present, and that magnetic tower structures form about the rotational axis.
 |
2.9 Summary and future outlook on magnetospheric accretion
As discussed in the above subsections, 3D simulations have shown, for the first time, how matter flows onto stars with a tilted dipole, and onto stars with the complex magnetic field. This has allowed direct modeling of the structure of the funnel stream, and the position and shapes of the hot spots. Specific simulations were performed for CTT stars with realistic parameters, BP Tau and V2129 Oph, and the spectrum has been calculated for V2129 Oph using the 3D radiative transfer code TORUS. Comparisons with observations have shown excellent match, providing a strong substantiation of the magnetospheric accretion paradigm.
Numerical simulations also led to discovery of two distinct states, characterized by stable vs. unstable regimes of accretion. The unstable regime may help explain the short-term variability, with characteristic time of a few events per rotational period, that is observed in a significant number of CTTSs.
The above research concentrated on the processes at the disk-magnetosphere boundary and the magnetospheric accretion. Inflation of the field lines is also modeled, but the high coronal density assumed means it is matter-dominated, effectively suppressing possible magneto-centrifugal mechanisms for driving outflows. Future 3D simulations should concentrate on regimes with density low enough to allow magnetically driven outflows. Future simulations can also aim at modeling of stars with larger magnetospheres, in order to better understand accretion onto intermediate polars, as well as X-ray pulsars. Both steps would require more computing power, because larger parts of the simulation region will be covered by both a magnetically dominated corona, and a magnetically dominated, large-scale magnetosphere. Within more computationally tractable 2.5D (axisymmetric) simulations, the next sections describe such investigations of outflows from disk-accreting magnetized stars.
 |
3 OUTFLOWS FROM THE DISK-MAGNETOSPHERE BOUNDARY
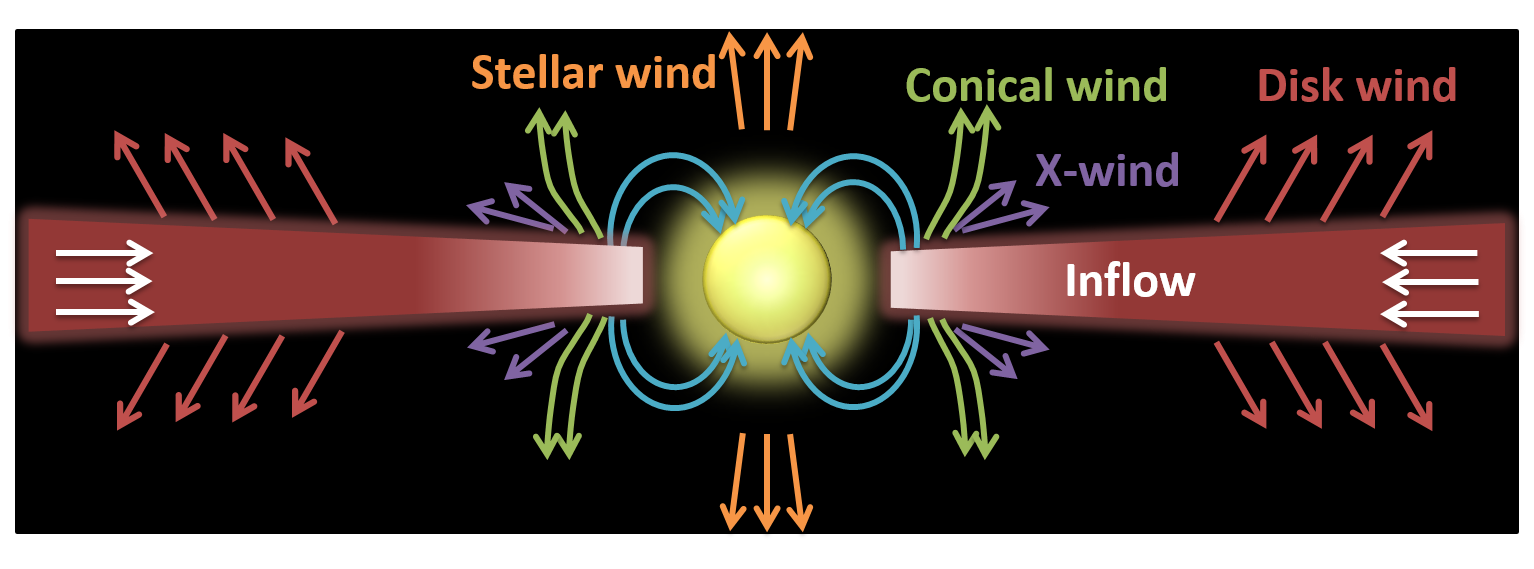
Different theoretical models have been proposed to explain the winds and jets from accreting stars (see review by Ferreira et al. 2006). Fig. 27 demonstrates a few different possibilities. Outflows can be accelerated by a magneto-centrifugal mechanism along the field lines threading the disk at different distances from the star and tilted by about the axis (e.g., Blandford & Payne 1982); or they can originate at the disk-magnetosphere boundary (Shu et al., 1994; Romanova et al., 2009). Stellar winds may also contribute to an outflow if part of the accreting matter is redirected into a stellar wind (Matt & Pudritz, 2005, 2008).
In this section, we concentrate on outflows from the disk-magnetosphere boundary. We show results from two scenarios: (1) when the star rotates rapidly in the propeller regime and the rapidly rotating magnetosphere drives outflows; and (2) when the star rotates slowly but the field lines are bunched up at the disk-magnetosphere boundary during episodes of enhanced accretion, in which case the matter flows into a conically shaped wind (e.g., Romanova et al. 2009).
 |
3.1 Propeller-driven outflows
The propeller regime, wherein , was studied in 2.5D MHD simulations in the cases of disks (Romanova et al., 2005b, 2009; Ustyugova et al., 2006) and turbulent disks (Lii et al., 2014), in which the turbulence is driven by the magneto-rotational instability (MRI, Balbus & Hawley 1991, 1998). We consider these cases in Sec. 3.1.1 and Sec. 29.
3.1.1 Propeller regime studied with disks
The propeller regime has been initially modelled in terms of disks, assuming both axisymmetry and north-south symmetry, using a code with spherical coordinates. In most simulation runs, the viscosity parameter is taken to be , which allows a relatively high rate of matter flow toward the propelling magnetosphere. Magnetic diffusivity is also incorporated, using a formalism analogous to viscous diffusion, now proportional to a diffusivity parameter (e.g., Bisnovatyi-Kogan & Ruzmaikin 1976). Such a diffusivity mimics more complex processes, such as 3D instabilities at the disk-magnetosphere boundary, and is important because it allows penetration of inner disk matter onto field lines of the external magnetosphere. Most simulations (Romanova et al., 2005b, 2009; Ustyugova et al., 2006). take a diffusivity coefficient ; the dependence on has been studied in a special set of simulation runs by Ustyugova et al. (2006).
The propeller may be “strong” – where the magnetosphere rotates much more rapidly than the inner disk (fastness parameter ) –, or weak – where the angular velocities of the magnetosphere and the disk are comparable (). For a weak propeller, most of matter accretes onto the star, while the angular momentum is transferred outward along the disk by viscosity (e.g., Sunyaev & Shakura 1977; Spruit & Taam 1993). For a strong propeller, significant amounts of matter can be redirected from the inner disk to a direct outflow (Illarionov & Sunyaev, 1975; Lovelace et al., 1999). For a case of very strong propeller (with fastness parameter is , and ; Romanova et al. 2009), Fig. 28 (left panel) shows a simulation snapshot during an outflow episode. Analysis of forces shows that the conical part of outflow is centrifugally driven, while magnetic forces also drive a smaller mass flux into a magnetically-dominated, better-collimated Poynting jet (Lovelace et al., 1991, 2002). Some accretion is also possible, due to the 2D nature of the propeller regime, wherein matter may flow around the centrifugally-rotating magnetosphere.
Propeller-driven outflows are expected at the early stages of stellar evolution, wherein the star still rotates rapidly and retains a strong magnetic field. A strong propeller may redirect most of the disk matter into the outflows. It is possible that the powerful jets from young (Classes 0 and I) stars are connected with such a propeller stage in young star evolution. These stars are usually hidden inside dusty envelopes of forming stars, and it is presently difficult to test this hypothesis. It is also possible that the outflows observed in class II young stars (CTTSs) can also be connected with the propeller regime of accretion. Observations of jets from CTTSs show that they have an “onion-skin” velocity distribution, for which the outflow velocity is higher in the axial regions and decreases away from the axis (e.g., Bacciotti et al. 1999; Dougados et al. 2000). Similar onion-skin structure is seen in simulations of outflows from propelling star (see Fig. 28, right panel), and in simulations by Goodson et al. (1997).
3.1.2 Propeller regime in case of accretion from turbulent disks
In the case of MRI-driven turbulent disks, the inward disk accretion can be conveniently provided by this turbulence. However, the MRI-driven turbulence does not provide the diffusivity at the disk-magnetosphere boundary. Some matter penetration is associated with the reconnection events between the stellar field lines and the field lines of the turbulent cells (Romanova et al., 2011b), but this does not provide significant diffusivity. Therefore, in axisymmetric simulations an type diffusivity is often added, but only to the region where the disk interacts with the magnetosphere (Lii et al., 2014). Actually, most simulation runs of Lii et al. (2014) assume no explicit diffusivity (), so that only the very small numerical diffusivity provides the interaction between the disk and magnetosphere. Such small diffusivity leads to long episodes of the matter accumulation at the disk-magnetosphere boundary, punctuated by rare events of accretion onto the star. Fig. 29 shows an example of outflow for the strong propeller case, with and . Along with the strong episodic outflows are evident, intervals of matter accumulation and accretion are also evident. Matter accumulates and accretes when a sufficient amount of matter reaches the corotation radius. As discussed in Sec. 2.3.4, the MRI-driven disk behaves as matter-dominated disk. In this propeller case, matter of the disk simply flows above the rapidly rotating magnetosphere of the star. In these propeller simuations, top-bottom symmetry was not assumed, thus allowing matter to flow both above or below the rapidly-rotating magnetosphere, while pushing the magnetosphere in the opposite direction (see also analysis of this phenomenon in Romanova et al. 2011b). The direction of the outflows also changes episodically.
In test simulations with larger diffusivity () in the disk-magnetosphere region, the interaction between the disk and the magnetosphere is stronger, and more matter is ejected to the outflows, while smaller amount of matter accretes onto the star (Lii et al., 2014). In both types of simulations of the propeller regime, the disk-magnetosphere interaction has a cyclic character. Initially, the inner disk matter accumulates, then diffusively penetrates the inner parts of the magnetosphere, where it acquires angular momentum; some of the matter is then ejected to a centrifugally-driven wind, while some accretes onto the star. After this, the magnetosphere expands, and the cycle repeats (see also Goodson et al. 1997; Goodson & Winglee 1999). Compared with Goodson et al. (1997), simulations show many more oscillation cycles. This cyclic oscillations are different from cyclic accretion discussed for dead disks, where only weak propellers are considered, and where the excess of angular momentum flows into the dead disk (e.g., Spruit & Taam 1993; D’Angelo & Spruit 2010). There are also similarities: accretion occurs when the inner disk reaches the corotation radius. However, the propeller-driven oscillations are expected on much smaller time-scales compared with the dead disk oscillations, because in the propeller-driven oscillations only the inner part of the disk oscillates, while in dead disks much larger parts of the disk are usually involved.
[width=100mm]mri-prop-burst
In cases of both turbulent and -type disks, the strength of the propeller strongly depends on the fastness parameter . The estimated value of is only approximate, because the inner disk strongly oscillates, causing the values of and to vary in time. The range of strengths of the propellers varies depending on the fastness parameter. When is a few times larger than unity, then the propeller is strong and most of the disk matter can be ejected into outflows. When , the propeller is weak and most of the matter accretes onto the star.
The outcome of the propeller regime also strongly depends on the diffusivity at the disk-magnetosphere boundary. The diffusivity should be sufficiently high, so that the matter of the inner disk can interact with the magnetosphere. When the diffusivity is very low, the rapidly-rotating magnetosphere and slowly-rotating disks do not exchange angular momentum, and outflows are not possible. We suggest that, in more realistic 3D simulations, the diffusivity is not very small, because three-dimensional instabilities such as Kelvin-Helmholtz and magnetic interchange instabilities will lead to mixing of the disk matter with the magnetosphere.
 |
3.1.3 Matter fluxes and oscillation of the inner disk
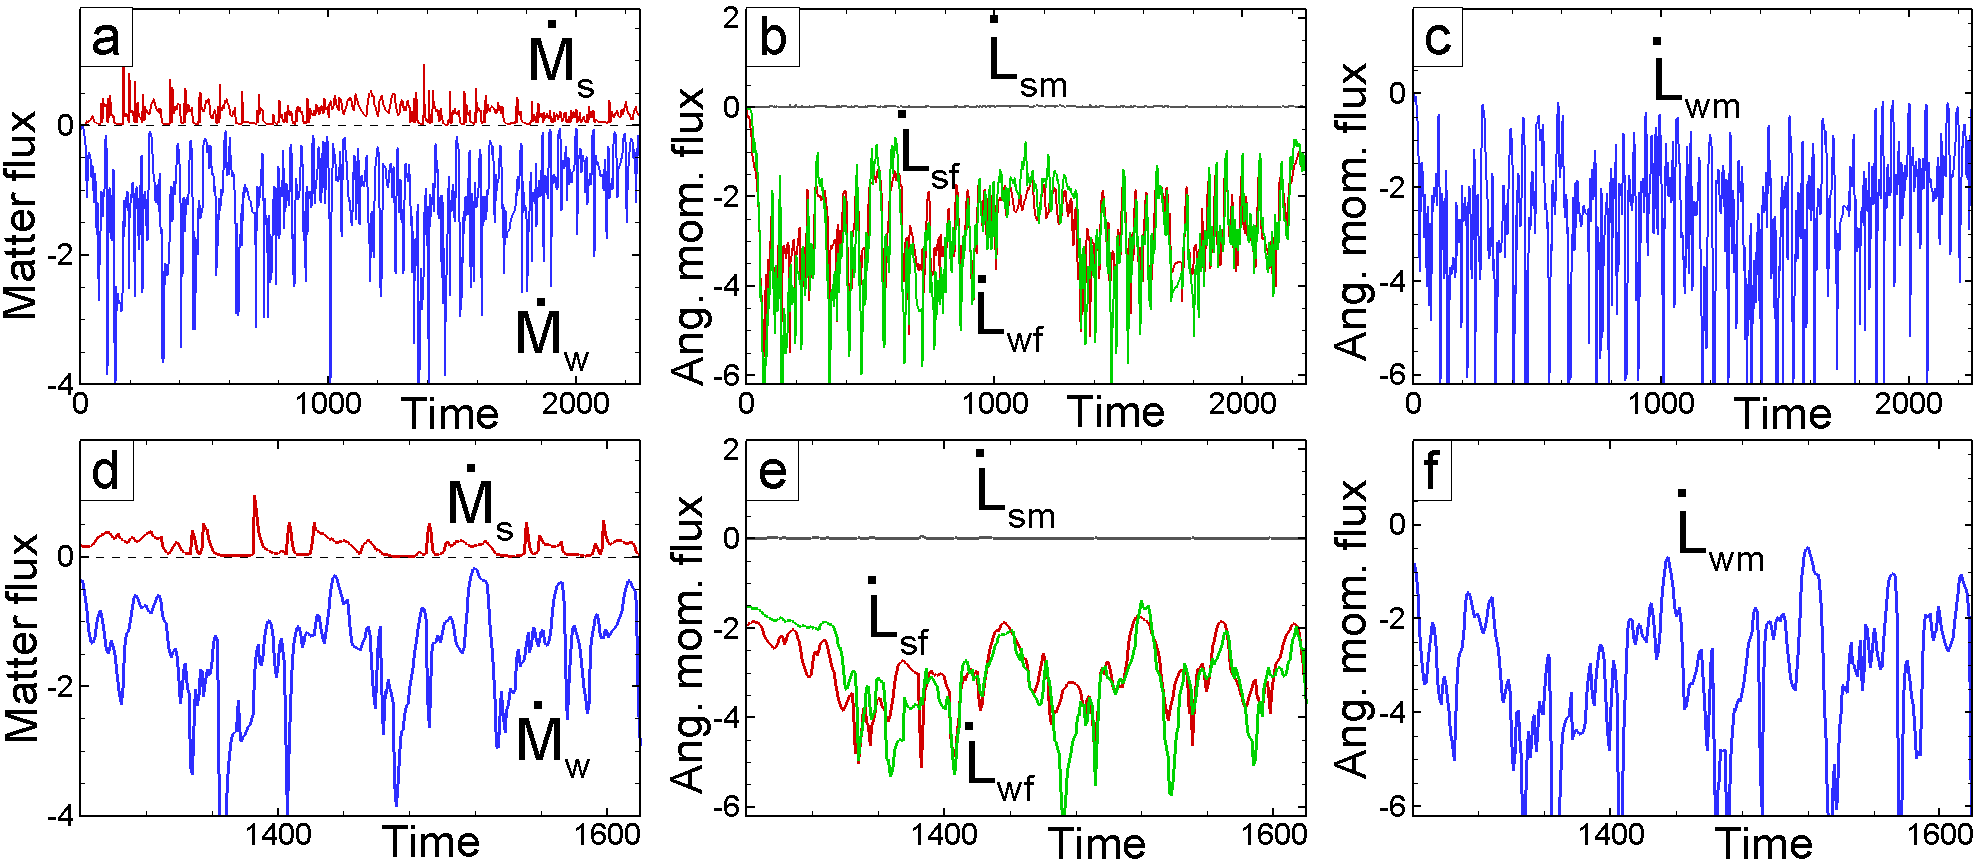
The amounts of matter flowing onto the star and into the winds varies according to the strength of the propeller. Fig. 30 shows an example of these fluxes in the case of a strong propeller, calculated in the case of an disk. Fig. 30 (panel a) shows the matter fluxes onto the star, , and into the winds, , integrated over a surface with radius . The matter flux into the wind is much larger than that onto the star, , implying that almost all of the disk matter is ejected from the system into the outflows. If the star rotates more slowly, then the fraction of the matter flux going into the wind decreases, and a larger portion of the matter accretes onto the star (see Ustyugova et al. 2006 for dependences of matter fluxes on , , , and ).
Both fluxes strongly vary and show episodic enhancement of accretion and outflows. The interval between the strongest outbursts increases when the diffusivity coefficient decreases (Ustyugova et al., 2006). The bottom panels of Fig. 30 show the same fluxes as the top panels, but “zoomed in” to focus on a particular time period in the simulation. The time interval between the strongest outbursts in the propeller regime is (in dimensionless units). For protostars and CTTSs ( days), this time corresponds to days. In some young stars (e.g., CTTS HH30 / XZ Tau), the outbursts into the jet occur at intervals of a few months. This implies that episodic ejections to the propeller wind may be responsible for some of the outbursts. In application to accreting neutron stars (AMXPs), we take into account the reference time-scale ms (see Tab. 1) and obtain the dimensional time-scale ms. Therefore, rapid variability on this and smaller time-scales is expected in AMXPs in the propeller regime. This time-scale is larger, if the diffusivity at the disk-magnetosphere boundary is smaller, and vice versa. The longer time scale between bursts is also expected in case of the larger fastness of the propeller.
| CTTSs | White dwarfs | Neutron stars | |
|---|---|---|---|
| 0.8 | 1 | 1.4 | |
| 5000 km | 10 km | ||
| (cm) | |||
| (cm s-1) | |||
| days | s | ms | |
| (G) | |||
| (g cm-3) | |||
| (yr-1) | |||
| (erg s-1) |
3.1.4 Angular momentum outflow and spinning-down of young stars
A star in the propeller regime loses its angular momentum along the field lines that originate at the surface of the star. Some of these field lines are strongly inflated and a part of the angular momentum flows into the magnetically-dominated Poynting flux jet (e.g., Ustyugova et al. 2006). The other set of field lines originating on the star connect the star to the disk and are only partially inflated. A fraction of the angular momentum can also flow out of the star along these field lines (see also Zanni & Ferreira 2013). The middle panels of Fig. 30 show the dimensionless values of the angular momentum fluxes out of the star, calculated at the stellar surface. The angular momentum is primarily carried by the Poynting stresses of the magnetic field (see the red curve for in the middle panels), while the direct angular momentum carried by the matter is negligibly small (see the black curve for , also in the middle panels). Panels b and c also shows the angular momentum fluxes to the outflows (calculated at the radius from the star) carried by the field , , and by the matter, . The angular momentum carried by the field to the outflow, , is approximately equal to the angular momentum out of the surface of the star, .
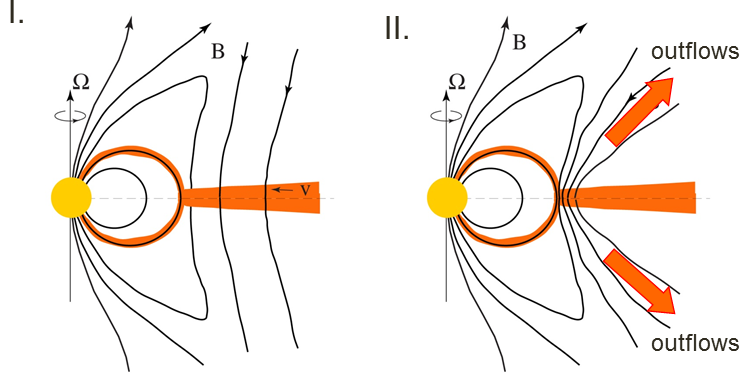 |
In young solar-type stars, the propeller mechanism may be responsible for their spinning down from near critical rotation, which is expected right after their formation, to less than 10% of this speed, observed in CTTSs (e.g., Romanova et al. 2005b). If a rapidly rotating protostar has a magnetic field strength of a few kG, then it is in the strong propeller regime and can rapidly lose angular momentum. Estimations show that if a protostar rotates initially with period of day and has a magnetic field of G, then it will lose most of its angular momentum to propeller outflows during the time scale of years. If the magnetic field is kG, then this time-scale increases up to years. This is shorter than typical lifetime of CTTSs, which is years. Therefore, if the magnetic field of protostars is sufficiently strong, then the propeller mechanism may be responsible for the fast spinning-down of these protostars to the slow rotation speeds observed in CTTSs.
3.1.5 Propeller regime in transitional millisecond pulsars
In accreting neutron stars the propeller regime is expected at the end of the accretion outburst, when the accretion rate decreases, and the truncation radius of the disk can be larger than the corotation radius. For example, in AMXP SAX J1808.4-3658, 1Hz flaring oscillations have been observed at the end of an outburst (van Straaten et al., 2005). These oscillations may be caused by the inner disk oscillations in the propeller regime (Patruno et al., 2009; Patruno & D’Angelo, 2013). For the typical AMXP, the time-scale of spinning down is estimated to be years. This time scale is shorter than the expected lifetime of the accreting millisecond pulsars. However, these stars spend relatively little time in the propeller regime.
Recently discovered ‘transitional millisecond pulsars’, which switch between an accretion stage and a radiopulsar stage (e.g., Papitto et al. 2013; Ferrigno et al. 2014; Linares 2014), support the earlier suggested scenario that millisecond radiopulsars represent recycled pulsars that are re-spun-up by disk accretion in the binary system (Alpar et al., 1982; Bisnovatyi-Kogan & Komberg, 1974). Such pulsars are observed as accreting millisecond X-ray pulsars during periods of high accretion rate, and as radiopulsars during periods of low accretion rate. In these stars, the propeller stage is inevitable and is expected between these two regimes. In fact, strong rapid oscillations in X-ray have been observed in the transitional pulsar AMXP IGR J18245-2452, which may be associated with the propeller regime (Ferrigno et al., 2014). Similar oscillations have been observed in another transitional pulsar PSR J1023+0038 (e.g., Patruno et al. 2014). At the same time, enhanced radiation in the radio band has been observed during this stage, which is interpreted as possible outflow from the system. Strong oscillations of the inner disk and outflows were predicted earlier in theoretical and numerical models (e.g., Lovelace et al. 1999; Romanova et al. 2005b; Ustyugova et al. 2006; Lii et al. 2014).
These new discoveries present an opportunity to compare models with observations, both to test and constrain the models and open up a new puzzles. For example, X-ray pulsations were found in PSR J1023+0038 during its very dim state, when the X-ray luminosity was about factor 100 lower than during the main accretion state, when the pulsar is expected to be in the propeller regime (e.g., Archibald et al. 2015; Papitto & Torres 2015). Different explanations were proposed to solve this puzzle (see Archibald et al. 2015). But one key point is that the formal condition for the propeller regime, only applies to an idealized, one-dimensional picture, wherein vertical centrifugal barrier prevents any accretion onto propelling star. In an axisymmetric, two-dimensional approach, the centrifugal barrier is restricted by the closed magnetosphere of the star. In other parts of the simulation region, matter of the corona rotates more slowly, and therefore disk material can flow above/below this rapidly-rotating magnetosphere and accrete onto the stellar surface. In addition, a small amount of coronal matter may precipitate onto the star along the inflated coronal field lines. Such residual 2D accretion represents an important difference from the idealized 1D picture the propeller regime: Of course, more matter accretes in case of the weaker propeller regime, but even in a strong propeller regime, some matter accretes onto the star (see Fig. 30). This may explain X-ray pulsations of PSR J1023+0038 during very dim state. Detailed comparisons of axisymmetric simulations with observations may explain variability and other features of transitional pulsars at their propeller stage. However, even more advanced, three-dimensional simulations of the propeller regime are required to model this properly. On the other hand, current X-ray telescopes do not yet provide sufficient temporal resolution (about 10 ms) to detect the time variability found in such models.
Similar flaring oscillations have been observed in a few cataclysmic variables, e.g., in AE Aqr (e.g., Mauche 2006) which indicated that these stars may also be in the propeller regime during a part of their life-time. It is often suggested that this CV periods of accretion alternate with periods of ejection (e.g. Wynn et al. 1997).
3.2 Conical winds from the disk-magnetosphere boundary
Recent numerical simulations reveal a new type of wind that can be important in stars with any rotation rate, if the magnetic flux of the star is compressed by the disk matter at the disk-magnetosphere boundary (see Fig. 31.) This situation is possible, if the inward radial velocity of the disk matter is larger than velocity of the diffusive penetration of the disk matter through the field lines of the magnetosphere (Romanova et al., 2009; Königl et al., 2011; Lii et al., 2012). Simulations show that if the incoming matter compresses the magnetosphere of the star, the field lines inflate due to the differential rotation between the disk and the star, and conically shaped winds flow out of the inner disk. These winds are driven by the magnetic force, (see Fig. 32), which arises from the wrapping of the field lines above the disk (Lovelace et al., 1991). The wind is also gradually collimated by the magnetic hoop-stress, and it can be strongly collimated when the accretion rate is large (Lii et al., 2012).
Conical winds model differ from earlier proposed X-winds model (Shu et al., 1994) in several respects 131313(1) In the X-wind model, one of the necessary requirements is the condition , that is the inner disk should rotate with the angular velocity of the magnetosphere. In conical winds model, there is no such restriction: a star may rotate much more slowly than the inner disk, with . (2) In the X-wind model matter is driven by the centrifugal force and overall situation is closer to the weak propeller regime; in conical winds model the driving force is mainly the magnetic pressure arising from the winding of the magnetic field lines above the inner parts of the disk..
[width=60mm]conical-current.png
Conical winds are expected in stars where the accretion rate strongly increases during the accretion outburst episodes, such as in AMXPs, and in sub-classes of young stars EXors and FUors, where the accretion rate in the disk increases dramatically (see review by Audard et al. 2014). In fact, in FU Ori itself, Hα shows a strong blueshifted absorption, providing direct evidence for outflows. The conical wind model has been applied to FU Ori star and compared with the empirical model based on the spectral analysis of the winds in FU Ori (Calvet et al., 1993). A reasonably good agreement has been found between these models (Königl et al., 2011). Therefore, the conical winds represent an attractive model to explain outflows in stars wherein the accretion rate strongly increases in time. However, this model should be tested in 3D simulations to check the role of 3D instabilities at the disk-magnetosphere boundary. The strength of the winds will probably depend on the ratio between the inward penetration of matter through instabilities (as discussed in Sec. 2.4), and outward flow of matter due to the winding of the field lines and action of the magnetic pressure force. Both processes are expected to occur on the time-scale comparable with the Keplerian time-scale. Global 3D simulation are required to further investigate conical winds.
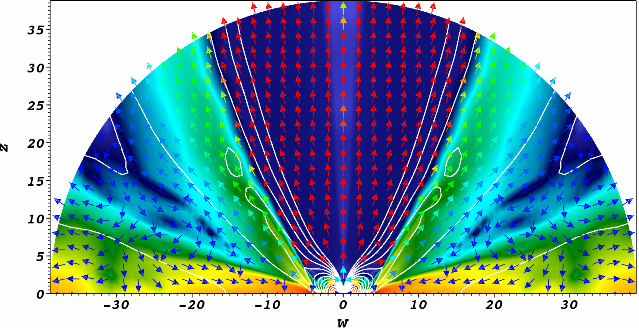
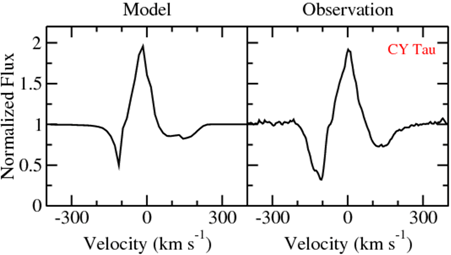
The observational properties of conical winds, applied to CTTSs, were investigated by Kurosawa et al. (2011) and Kurosawa & Romanova (2012). In these studies, the spectra of the H and He lines were calculated using the radiative transfer code TORUS. These simulations show that conical winds produce a narrow blue absorption component in the spectrum (see Fig. 33). Such a blue component is frequently observed in the spectra of CTTSs (e.g., Edwards et al. 2006).
Conical winds were also studied in test global 3D simulations where the magnetic axis of the stellar dipolar field has been tilted by the angle about the rotational axis (Romanova et al., 2009). These simulations show that, in spite of the tilted magnetosphere, the winds form a conical structure about the rotational axis. However, the interaction of the inner disk with the tilted magnetosphere develops a spiral pattern within the cone-shaped wind (see Fig. 34).
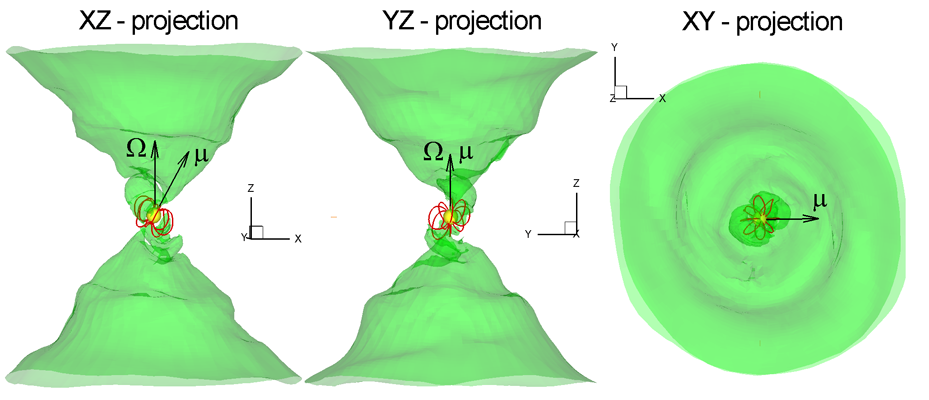
3.3 Asymmetric and one-sided outflows
In stars with a complex magnetic field, outflows may be asymmetric due to the top-bottom asymmetry of the magnetic field (e.g., Wang et al. 1992). For example, the superposition of an axisymmetric dipole field with a quadrupole field leads to a configuration in which the magnetic flux is larger on one side of the equatorial plane than the other (see Fig. 35, right panel). Axisymmetric simulations of the propeller regime show that stronger outflows are observed on the side where the magnetic flux is larger (see left panel of Fig. 35). In this case, the matter and energy fluxes will be systematically higher in one direction and lower in the other direction. One-sided outflows are observed in a number of young stars (e.g., Bacciotti et al. 1999).
Axisymmetric simulations of the entire region also show that, even in the case of a pure dipole field, outflows are usually one-sided. However, the direction of the outflows switches frequently, and therefore the averaged matter and energy fluxes of the outflows above and below the equatorial plane are expected to be approximately equal in both directions (Lovelace et al., 2010). Recent simulations of the propeller regime in the case of MRI-driven accretion have also shown that the outflows are one-sided, but that the wind switches sides much less frequently (Lii et al., 2014).
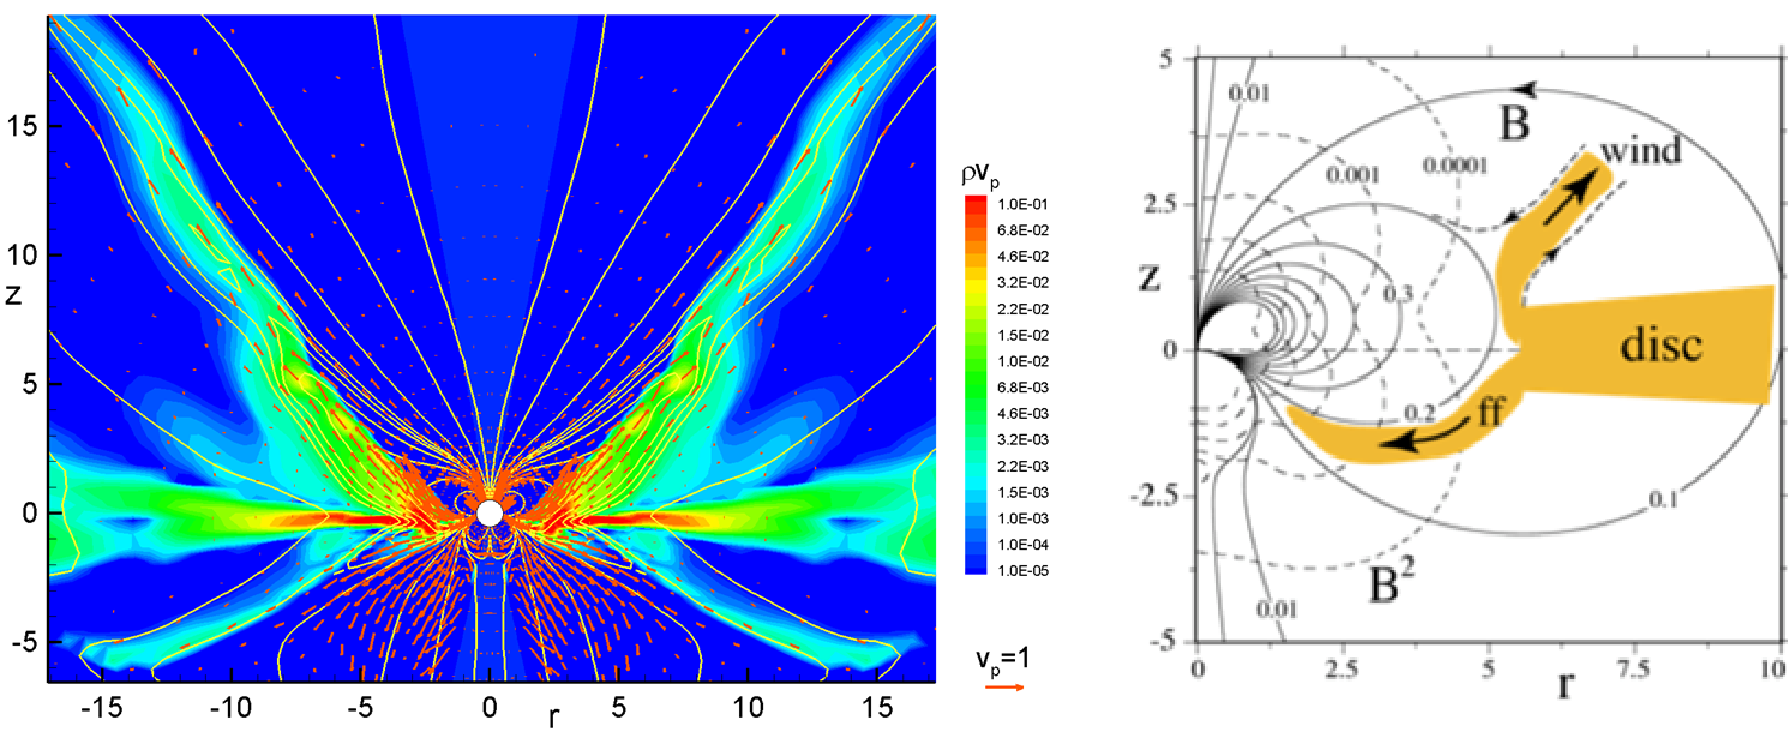 |
3.4 Future outlook on outflows from the disk-magnetosphere boundary
In the above subsections, outflows from the disk-magnetosphere boundary were modeled in two scenarios for which matter flows from the disk-magnetosphere boundary: rapidly rotating stars in the propeller regime and slowly-rotating stars (conical winds). Most of the simulations described were performed using an axisymmetric approximation. Future simulations should expand to full three dimensions, so that the disk-magnetosphere interaction through instabilities can be taken into account. Also, outflows at larger scales should be further studied.
4 WIND-FED MAGNETOSPHERES FROM MAGNETIZED MASSIVE STARS
Massive, luminous, hot stars lack the hydrogen recombination convection zone that induces the magnetic dynamo cycle of cooler, solar-type stars. Nonetheless, modern spectropolarimetry has revealed that about 10% of O, B and A-type stars harbor large-scale, organized (often predominantly dipolar) magnetic fields ranging in dipolar strength from a few hundred to tens of thousand Gauss. (Petit et al.2013) recently compiled an exhaustive list of 64 confirmed magnetic OB stars with kK, along with their physical, rotational and magnetic properties; see figure 38 below.
This section summarizes efforts to develop dynamical models for the effects of such large-scale surface fields on the radiatively driven mass outflow from such OB stars. The focus is on the properties and observational signatures (e.g. in X-ray and Balmer line emission) of the resulting wind-fed magnetospheres in closed loop regions, and on the stellar rotation spindown that results from the angular momentum loss associated with magnetically torqued wind outflow from open field regions. In this way magnetic fields can have a profound effect on the star’s rotational evolution, giving rotation periods ranging from weeks to even decades, in strong contrast to the day-timescale periods of non-magnetic massive stars.
The inside-out building of these wind-fed magnetospheres is in some way complementary to the outside-in nature of the accretion-fed magnetospheres discussed in previous sections. But there are also some interesting similarities in the role of the characteristic magnetospheric and corotation radii, which in this case are identified below (see equations (9) and (10) in Sections 4.1 and 4.2) as the Alfvén radius and the Kepler radius . In particular, the relative sizes of these radii again plays a key role in determining the magnetospheric characteristics, in this case leading to dynamical magnetopheres (DM) when , and centrifugal magnetopheres (CM) when . The trapping of high-speed wind outflow also leads to strong shocks and so X-ray emission that can be much harder and stronger than generally seen for cases of non-degenerate stellar accretion.

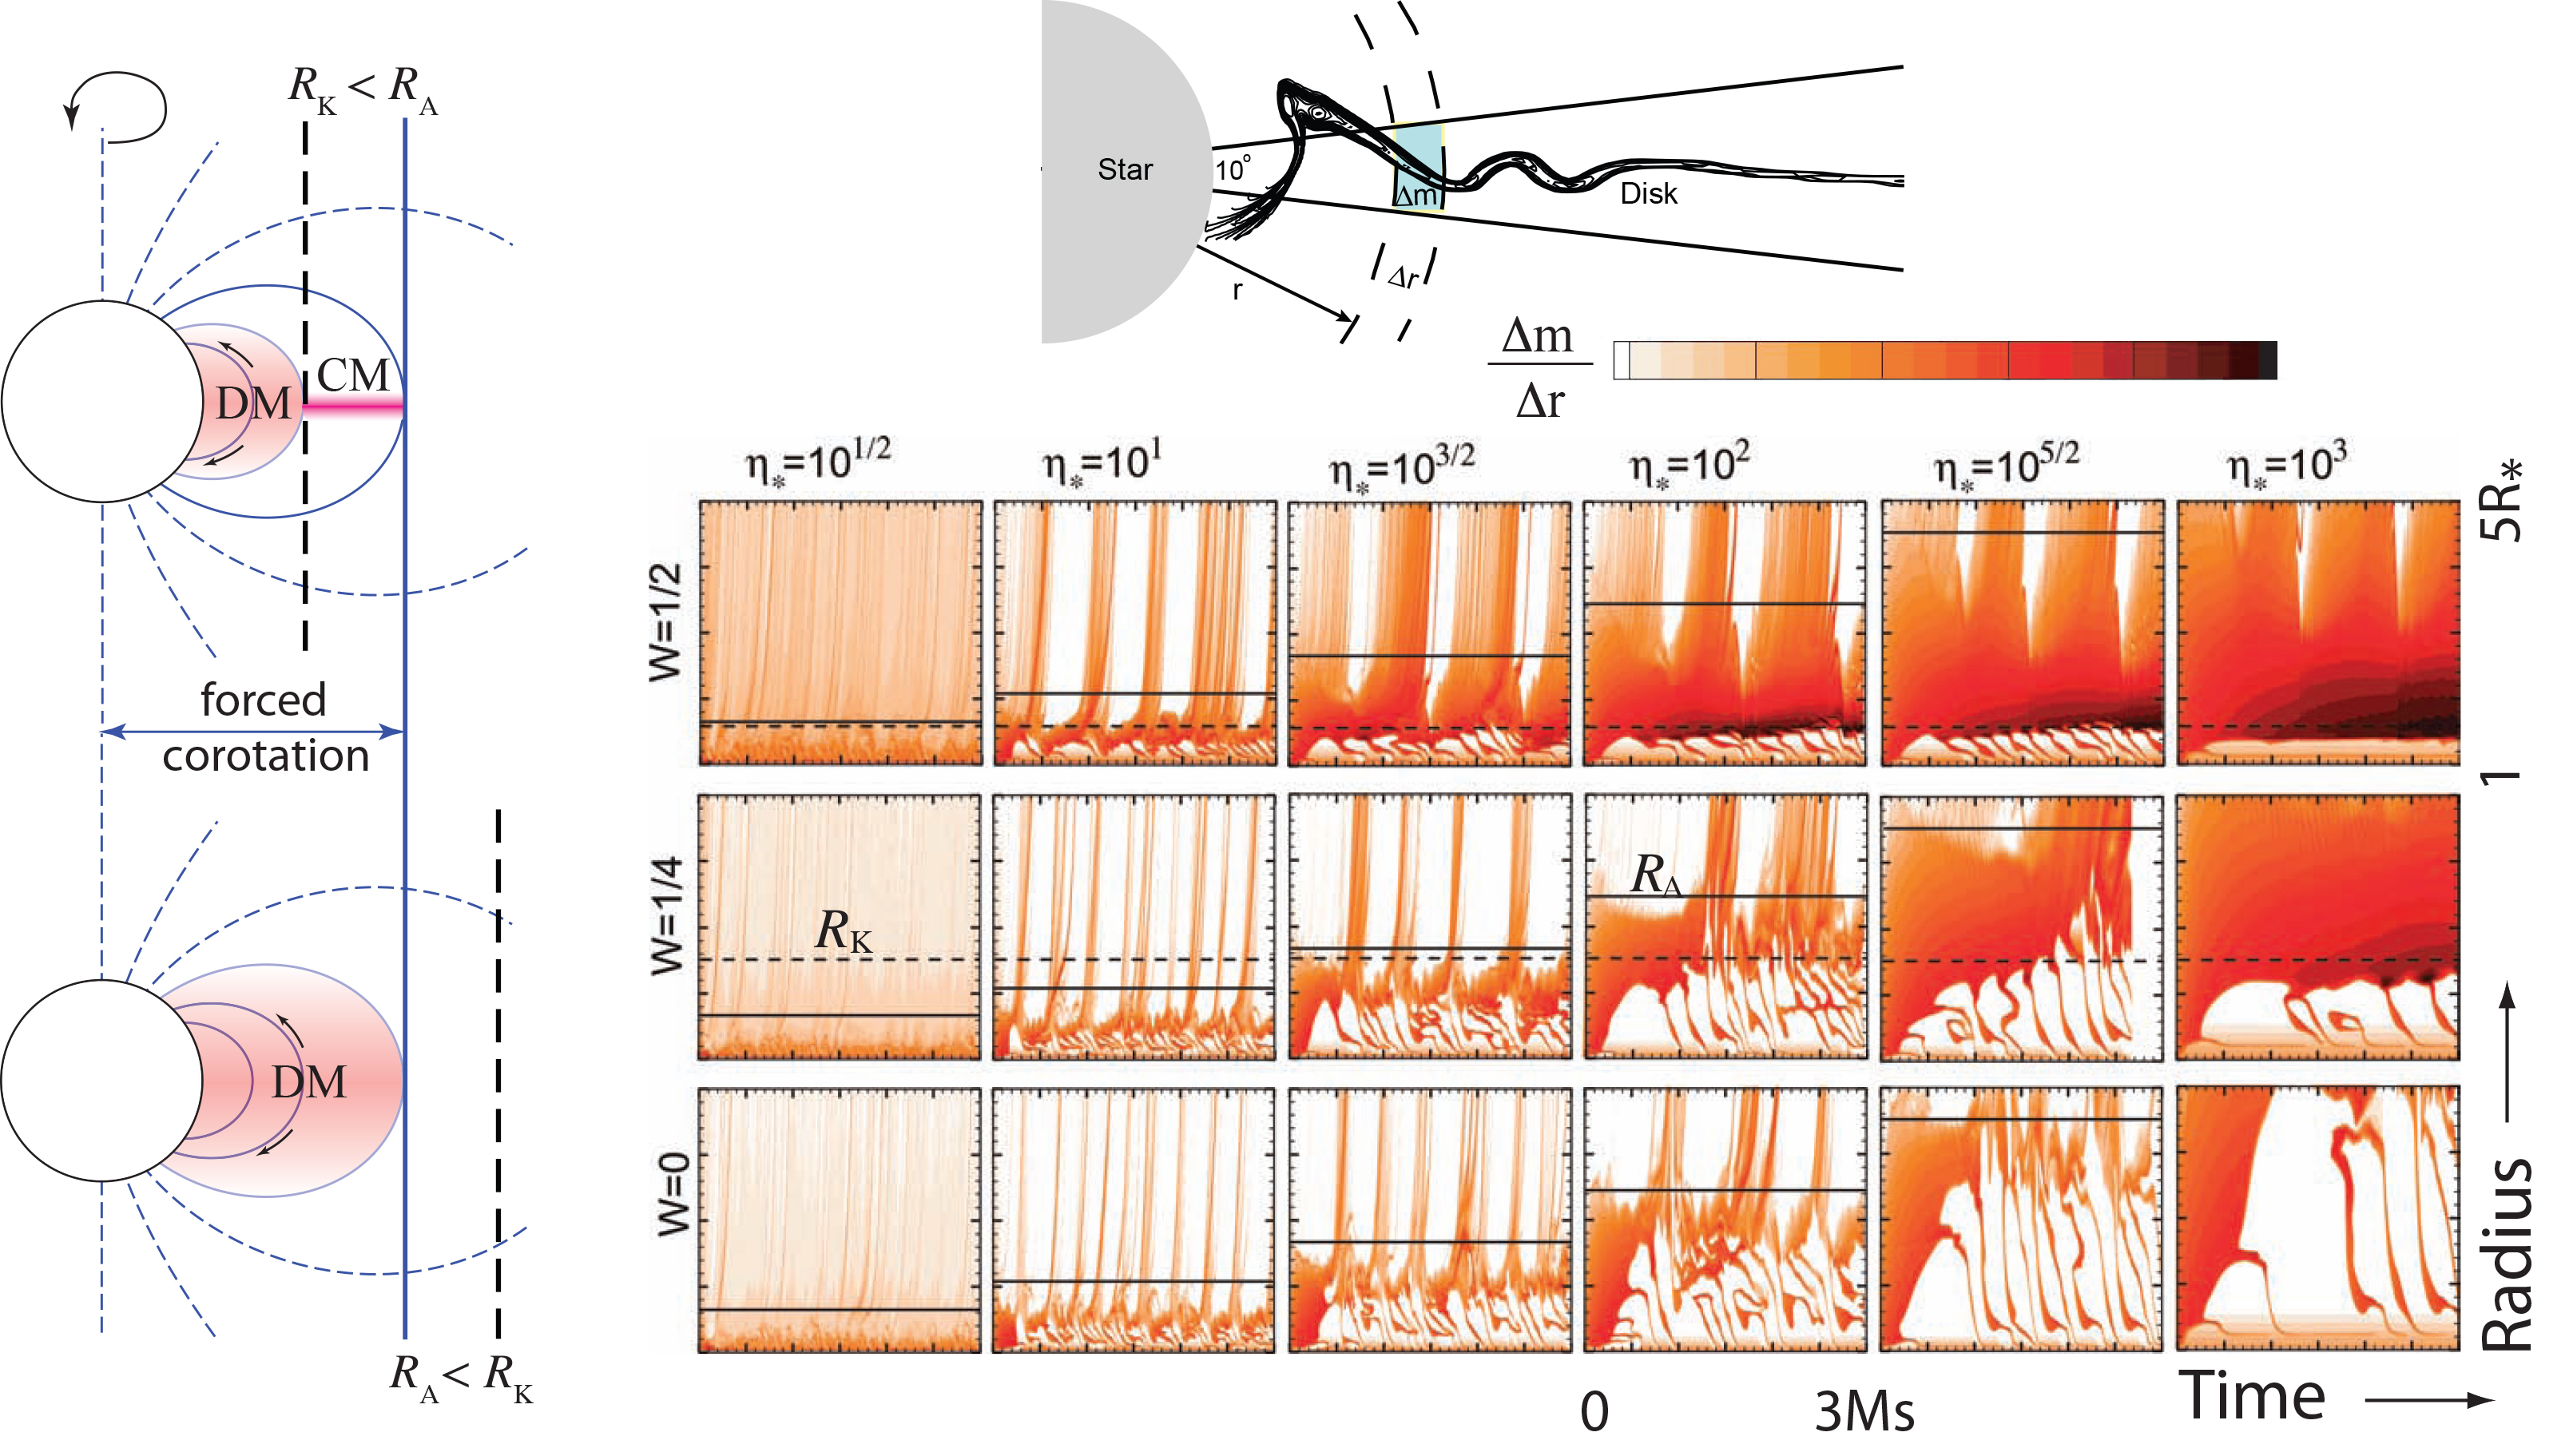
4.1 Wind magnetic confinement parameter and Alfvén radius
MHD simulation studies (e.g., ud-Doula & Owocki, 2002; ud-Doula et al., 2008) show that the overall net effect of a large-scale, dipole magnetic field in diverting such a hot-star wind can be well characterized by a single wind magnetic confinement parameter and its associated Alfvén radius,
| (9) |
where is the field strength at the magnetic equatorial surface radius , and and are the fiducial mass-loss rate and terminal speed that the star would have in the absence of any magnetic field. This confinement parameter sets the scaling for the ratio of the magnetic to wind kinetic energy density. For a dipole field, the radial decline of magnetic energy density is much steeper than the decline of the wind’s mass and energy density; this means the wind always dominates beyond the Alfvén radius, which scales as in the limit of strong confinement.
As shown in figure 36, magnetic loops extending above are drawn open by the wind, while those with an apex below remain closed. Indeed, the trapping of wind upflow from opposite footpoints of closed magnetic loops leads to strong collisions that form X-ray emitting, magnetically confined wind shocks (MCWS; Babel & Montmerle 1997a,b). The post-shock temperatures MK are sufficient to produce the moderately hard ( keV) X-rays observed in the prototypical magnetic O-star Ori C (Gagné et al., 2005). As illustrated by the downward arrows in the density plot at a simulation time ksec, once this material cools back to near the stellar effective temperature, the high-density trapped material falls back onto the star over a dynamical timescale.
4.2 Orbital rotation fraction and Kepler co-rotation radius
The dynamical effects of rotation can be analogously parameterized (ud-Doula et al., 2008) in terms of the orbital rotation fraction, and its associated Kepler corotation radius,
| (10) |
which depend on the ratio of the star’s equatorial rotation speed to the speed to reach orbit near the equatorial surface radius . Insofar as the field within the Alfvén radius is strong enough to maintain rigid-body rotation, the Kepler corotation radius identifies where the centrifugal force for rigid-body rotation exactly balances the gravity in the equatorial plane. If , then material trapped in closed loops will again eventually fall back to the surface, forming a dynamical magnetosphere (DM). But if , then wind material located between and can remain in static equilibrium, forming a centrifugal magnetosphere (CM) that is supported against gravity by the magnetically enforced co-rotation. As illustrated in the upper left schematic in figure 37, the much longer confinement time allows material in this CM region to build up to a much higher density than in a DM region.


For full 2D MHD simulations in the axisymmetric case of a rotation-axis aligned dipole, the mosaic of color plots in figure 37 shows the time vs. height variation of the equatorial mass distribution for various combinations of rotation fraction and wind confinement that respectively increase upward and to the right. This illustrates vividly the DM infall for material trapped below and , vs. the dense accumulation of a CM from confined material near and above , but below .
4.3 Comparison with Observations of Confirmed Magnetic Hot-stars
For the 64 observationally confirmed magnetic hot-stars ( kK) compiled by (Petit et al.2013), figure 38 plots positions in a log-log plane of vs. . The vertical solid line representing separates the domain of non-magnetized or weakly magnetized winds to left, from the domain of stellar magnetospheres to the right. The diagonal line representing divides the domain of centrifugal magnetospheres (CM) to the upper right from that for dynamical magnetospheres (DM) to the lower left. Let us now consider how these distinctions in magnetospheric properties organize their observational characteristics.
4.3.1 Balmer- line emission from DM and CM
Figure 39 plots these observed magnetic stars in a diagram comparing the ratio vs. stellar luminosity, with now the symbol coded to mark the presence (light shading) or absence (black) of magnetospheric H emission. The horizontal solid line marks the transition between the CM domain above and the DM domain below, while the vertical dashed line marks the divide between O- and B-type main sequence stars. Note that all O-stars show emission, with all but one (Plaskett’s star, which has likely been spun-up by mass exchange from its close binary companion; (Grunhut et al., 2013).) located among the slow rotators with a DM. By contrast, most B-type stars only show emission if they are well above the horizontal line, implying a relatively fast rotation and strong confinement that leads to a CM.
The basic explanation for this dichotomy is straightforward. The stronger winds driven by the higher luminosity O-stars can accumulate even within a relatively short dynamical timescale to a sufficient density to give the strong emission in a DM, while the weaker winds of lower luminosity B-stars require the longer confinement and buildup of a CM to reach densities for such emission. This general picture is confirmed by the detailed dynamical models of DM and CM emission that motivated this empirical classification.

For the slowly rotating O-stars HD 191612 and Ori C (here with respective ID numbers 4 and 3), both 2D and 3D MHD simulations (Sundqvist et al. 2012; ud-Doula et al. 2013) of the wind-fed DM reproduce quite well the rotational variation of H emission. For the 3D simulations of Ori C, figure 40 shows how wind material trapped in closed loops over the magnetic equator (left panel) leads to circumstellar emission that is strongest during rotational phases corresponding to pole-on views (middle panel). For a pure dipole with the inferred magnetic tilt , an observer with the inferred inclination has perspectives that vary from magnetic pole to equator, leading in the 3D model to the rotational phase variations in H equivalent width shown in the right panel (shaded circles). This matches quite well both the modulation and random fluctuation of the observed equivalent width (black dots), though accounting for the asymmetry about minimum will require future, more detailed models that include a secondary, higher-order (non-dipole) component of the inferred surface field.

4.3.2 The Rigidly Rotating Magnetosphere (RRM) model
In modeling the CM of more rapidly rotating, strongly magnetic B-stars like Ori E, a key challenge stems from the fact that their wind magnetic confinement parameters are generally of order or more, far beyond the maximum achieved with direct MHD simulations, which are limited by the Courant stability criterion. As an alternative for this strong-field limit, Townsend & Owocki (2005) developed a Rigidly Rotating Magnetosphere (RRM) model that uses a semi-analytical prescription for the 3D magnetospheric plasma distribution, based on the form and minima of the total gravitationa l-plus-centrifugal potential along each separate field line. Townsend et al. (2005) applied this RRM model to synthesize the emission from material trapped in the associated CM of Ori E. Figure 41 compares the predicted variation of the dynamic emission spectrum over the 1.2 day rotational period with that obtained from echelle observations of the star. The agreement is again very good, providing strong general support for this RRM model for H emission from the CM of Ori E.
The basic RRM concept has been further developed in a successor Rigid Field Hydrodynamics (RFHD) model (Townsend et al. 2007), wherein the time-dependent flow along each individual field line is simulated using a 1D hydro code. By piecing together independent simulations of many different field lines (typically, several thousand!), a 3D picture of a star’s magnetosphere can be constructed at modest computational cost, leading in turn to predictions for not only H but also for X-ray emission (and other wind-related observables) of magnetospheres in the strong-field limit, as shown figure 42. A powerful aspect of both the RRM and RFHD models is that, within the strong field limit, they are in principle applicable to arbitrary field topologies, not just the oblique dipole configurations considered so far. Thus, for example, they could be used to model the magnetosphere of HD 37776, which harbors high-order multipoles (Kochukhov et al. 2011).


4.3.3 MHD scalings for X-ray luminosity from MCWS
For the DM cases without dynamically significant rotation, ud-Doula et al. (2014) carried out a MHD simulation parameter study with a full energy equation to compute the X-ray luminosity that results from magnetically confined wind shocks (MCWS). The central panel of figure 43 plots the ratio vs. the bolometric luminosity for models with magnetic confinement and . The dashed curves assume the post-shock cooling is purely by radiative emission, while the solid curves account also for the effects of inverse Compton cooling. For the most luminous stars, scales in proportion to the wind mass loss rate, which for line-driven winds follows ; but at lower , the lower means the radiative cooling becomes inefficient. As illustrated in the left vs. right schematic panels of figure 43, the larger cooling layer forces a “shock retreat” back to lower, slower wind outflow, leading to weaker shocks, and so lower, softer X-ray emission.
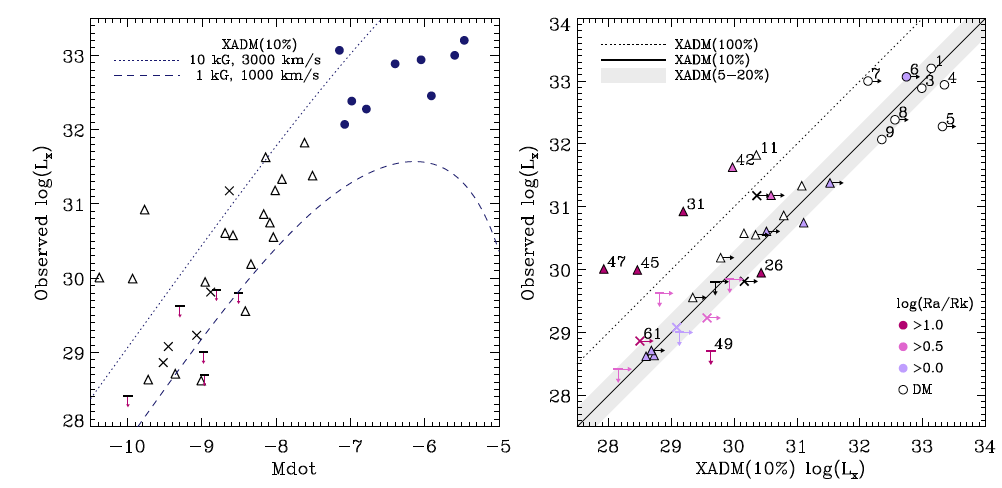
These MHD simulation results of ud-Doula et al. (2014) were also used to calibrate an ‘X-ray Analytic Dynamical Magnetosphere’ (XADM) analysis for how the overall X-ray luminosity scales with stellar magnetic field strength and wind mass loss rate. For the subset of relatively slowly rotating magnetic OB stars modeled in these MHD simulations, figure 44 shows that, when modified by an overall duty cycle efficiency factor to account for extended intervals of infall of trapped material without much X-ray emission, this XADM scaling gives remarkably close agreement with empirical trends inferred by Nazé et al. (2014).
4.4 Magnetic wind braking, spindown time, and spindown age
Let us now turn to the issue of rotational spindown from magnetic wind braking. In this regard, the case of Ori E provides a key testbed, because extended photometric monitoring of the timing of magnetospheric clouds transiting in front of the star (Townsend et al. 2008; see also lower right panel of figure 41) has allowed a direct measurement of the change in rotation period, yielding a spindown time of 1.34 Myr (Townsend et al. 2010). This is remarkably close to the spindown time predicted previously by ud-Doula et al. (2009), based on the same 2D MHD aligned-dipole parameter study used for figure 37.
This MHD study showed that the angular momentum carried out by a magnetically torqued stellar wind follows the same simple, split-monopole scaling law derived for the Sun by Weber and Davis (1967), – with, however, the Alfvén radius now given by the dipole scaling , instead the oft-quoted, stronger scaling () for a split monopole. This leads to an associated general formula for the rotational braking timescale,
| (11) |
Here is the stellar mass loss timescale, and is a dimensionless measure of the star’s moment of inertia .
If we assume for simplicity a fixed radius and moment of inertia factor , as well as a constant angular momentum loss rate , then the stellar rotation period will simply increase exponentially with age from its initial value, . This can be used to define a star’s spindown age, , in terms of the spindown time , and its inferred present-day critical rotation fraction relative to its initial rotation fraction , . Taking the initial rotation to be critical, , yields a simple upper limit to the spindown age,
| (12) |
If the initial rotation is subcritical, , then the actual spindown age is shorter by a time .
In figure 38 the upper axis gives the spindown timescale (normalized by the value in a non-magnetized wind), while the right axis gives the maximum spindown age (normalized by the spindown time). Stars above the horizontal dotted line have a maximum spindown age that is less than a single spindown time. Together with the vs. luminosity plot in figure 39, we can identify some important features and trends:
-
•
All the most rapidly rotating stars are cooler B-type with weak winds, and thus weak braking, despite their strong field. The two most extreme examples (ID 45 and 47) may be very close to critical rotation, and so provide a potential link to Be stars, which have not been found to have strong ordered fields, but for which rapid rotation is linked to decretion into an orbiting Keplerian disk.
-
•
The only rapidly rotating O-star is Plaskett’s star (ID 6), which has likely been spun up by mass exchange with its close binary companion (Grunhut et al., 2013). Many O-stars have very long rotation period, e.g. 538 days for the field star HD 191612 (ID 4), suggesting substantial main-sequence spindown by wind magnetic braking, with a spindown age comparable to its estimated main-sequence age.
-
•
In contrast, the young Orion cluster star Ori C (ID 3) has a moderately slow (15.4-day period) rotation, but is generally thought to be about 1 Myr old (Hillenbrand, 1997; Scandariato et al., 2012), much less than its maximum spindown age Myr. Thus its zero-age main-sequence (ZAMS) rotation was likely already quite slow, suggesting significant pre-main-sequence braking, e.g. by pre-main-sequence (PMS) disk-locking, or through a PMS jet and/or wind, as discussed in Section 3.1.2 above.
To reinforce the last point, the recent survey of Herbig Ae/Be stars by Alecian et al. (2013a, b) concludes that magnetic HeAeBe stars have a slower rotation than those without a detected field. Among their sample of non-magnetic stars they further find that those with lower mass evolve toward the ZAMS with a constant angular momentum, whereas higher mass () stars show evidence of angular momentum loss during their PMS evolution, most likely as a result of their stronger, radiatively driven mass loss.
4.5 Future Outlook
The above shows there has been substantial progress in our efforts to understand the physical and observational properties of massive-star magnetospheres. But there are still important gaps in this understanding and key limitations to the physical realism of the models developed. The following lists some specific areas for future work:
-
•
3D MHD of Non-Axisymmetric Cases: Thus far all MHD simulations, whether run in 2D or 3D, have been restricted to cases with an underlying axial symmetry, assuming a purely dipole field either without dynamically significant rotation, or with rotation that is taken to be aligned with the magnetic dipole axis. Fully 3D simulations are needed for both the many stars with an oblique dipole, as well as cases with more complex, higher-order multi-pole fields.
-
•
Spindown from oblique dipoles or higher-order multipoles: An important application of these 3D MHD models will be to analyze the angular momentum loss from oblique dipole fields, as well as from higher-order fields. This will allow determination of generalized spindown scalings for complex fields, and provide the basis for interpreting anticipated future direct measurements of magnetic braking in stars with tilted-dipole or higher multi-pole fields.
-
•
Non-Ideal MHD and magnetospheric leakage: In MHD simulations of slowly rotating magnetic stars with a DM, the dynamical infall of material back to the star balances the mass feeding from the stellar wind, yielding an overall mass and density that is in quite good agreement with absorption and emission diagnostics. By contrast, in CM simulations the much longer confinement and mass buildup is limited only by eventual centrifugal breakout of regions beyond the Kepler radius (Townsend & Owocki, 2005), and this now leads to an overall predicted CM mass and density that significantly exceeds values inferred by observational diagnostics. To understand better the mass budget of CM’s, it will be necessary to investigate additional plasma leakage mechanisms, such as the field line interchange transport that is thought to be key to mass balance of planetary magnetospheres (Kivelson & Southwood, 2005). In addition to comparison with emission diagnostics of individual stars, this should aim to derive general scaling laws that can explain the trends for Balmer emission seen in Figure 39, particularly the boundary between H emission and absorption in B-type stars.
-
•
Rapid rotation and gravity darkening: To model the rapidly rotating magnetic B-stars with , there is a need to generalize the lower boundary condition for both MHD and RFHD models to account for stellar oblateness, while also including the effect of gravity darkening for the wind radiative driving. This will also allow a link to Be stars, to constrain upper limits on the dynamical role of (undetected) magnetic fields in their quite distinctively Keplerian (vs. rigid-body) decretion disks. This will also provide a basis for applying such MHD models to PMS disks of HeAeBe stars.
Acknowledgements.
We thank the organizers of ISSI Workshop The Strongest Magnetic Fields in the Universe for excellent meeting and hospitality. Resources supporting this work were provided by the NASA High-End Computing (HEC). MMR acknowledges support by NASA grant NNX14AP30G and NSF grant AST-1211318, and contributions of different collaborators, particularly A.V. Koldoba, G.V. Ustyugova, R. Kurosawa, A.A. Blinova and R.V.E. Lovelace. MMR thanks M. Comins for editing the manuscript. SPO acknowledges support by NASA ATP Grants NNX11AC40G and NNX12AC72G, respectively to University of Delaware and University of Wisconsin, and extensive contributions of collaborators in the MiMeS project, particularly D. Cohen, V. Petit, J. Sundqvist, R. Townsend, A. ud-Doula, and G. Wade.References
- Alecian et al. (2013a) Alecian, E., Wade, G. A., Catala, C., et al. 2013a, MNRAS, 429, 1001
- Alecian et al. (2013b) Alecian, E., Wade, G. A., Catala, C., et al. 2013b, MNRAS, 429, 1027
- Alencar et al. (2010) Alencar, S. H. P., Teixeira, P. S., Guimaräes, M. M., McGinnis, P. T., Gameiro, J. F., et al., 2010, A&A, 519, A88
- Alencar et al. (2012) Alencar S.H.P., Bouvier, J, Walter, F.M., Dougados, C., Donati, J.F., Kurosawa, R., Romanova, M.M. et al. 2012, A&A, 541, A116
- Alpar et al. (1982) Alpar, M.A., Cheng, A.F., Ruderman, M.A., Shaham, J. 1982, Nature, 300, 728
- Alpar & Shaham (1985) Alpar, M.A., & Shaham, J. 1985, Nature, 316, 239
- Aly & Kuijpers (1990) Aly, J. J., & Kuijpers, J. 1990, A&A, 227, 473
- Archibald et al. (2015) Archibald, A.M., Bogdanov, S., Patruno, A., Hessels, J.W.T., Deller, A.T., Bassa, C., et al. 2015, ApJ, 807, 62
- Armitage (1998) Armitage, P., 1998, ApJ, 501, L189
- Arons & Lea (1976) Arons, J. & Lea, S.M. 1976, ApJ, 207, 914
- Audard et al. (2014) Audard, M., Ábrahám, P., Dunham, M. M., Green, J.D., Grosso, N. et al. 2014, Protostars and Planets VI, University of Arizona Press (2014), eds. H. Beuther, R. Klessen, C. Dullemond, Th. Henning
- Babel & Montmerle (1997a) Babel J., Montmerle T., 1997a, ApJ, 485, L29
- Babel & Montmerle (1997b) Babel J., Montmerle T., 1997b, A&A, 323, 121
- Bacciotti et al. (1999) Bacciotti, F., Eisloffel, J., Ray, T.P. 1999, A&A, 350, 917
- Bachetti et al. (2010) Bachetti, M., Romanova, M.M., Kulkarni, A., Burderi, L., di Salvo, T. 2010, MNRAS, 403, 1193
- Balbus & Hawley (1991) Balbus, S.A., & Hawley, J.F. 1991, ApJ, 376, 214
- Balbus & Hawley (1998) Balbus, S.A., & Hawley, J.F. 1998, Rev. Mod. Physics, 70, 1
- Barret et al. (2007) Barret, D., Olive, J,-F,, Miller, M. C. 2007, MNRAS, 376, 1139
- Bessolaz et al. (2008) Bessolaz N., Zanni C., Ferreira J., Keppens R., Bouvier J. 2008, A&A, 478, 155
- Beckwith, et al. (2009) Beckwith, K., Hawley, J.F., & Krolik, J.H. 2009, ApJ, 707, 428
- Bisnovatyi-Kogan & Komberg (1974) Bisnovatyi-Kogan, G.S., & Komberg, B.V. 1974, Soviet Astronomy, 18, 217
- Bisnovatyi-Kogan, Klepnef, & Giovannelli (2014) Bisnovatyi-Kogan, G.S., Klepnef, A.S., & Giovannelli, F. 2014, Proc. High Energy Phenomena in Relativistic Outflows (HEPRO IV) International Journal of Modern Physics: Conference Series Vol. 28, (arXiv:1408.1924)
- Bisnovatyi-Kogan & Ruzmaikin (1976) Bisnovatyi-Kogan, G.S., & Ruzmaikin 1976, Astrophys. and Space Sci., 42, 401
- Blandford & Payne (1982) Blandford, R.D., & Payne, D.G. 1982, MNRAS, 199, 883
- Blinova et al. (2016) Blinova, A.A., Romanova, M.M., & Lovelace, R.V.E. 2016, MNRAS, 459, 2354
- Boutloukos et al. (2006) Boutloukos, S., van der Klis, M., Altamirano, D., et al. 2006, ApJ, 653, 1435
- Bouvier et al. (1999) Bouvier, J., Chelli, A., Allain, S., Carrasco, L., Costero, R., Cruz-Gonzalez, I., Dougados, C., Fern ndez, M. et al. 1999, A&A, 349, 619
- Bouvier et al. (2003) Bouvier, J., Grankin, K. N., Alencar, S. H. P., Dougados, C., Fern ndez, M., Basri, G., Batalha, C., Guenther, E. et al. 2003, A&A, 409, 169
- Bouvier et al. (2007a) Bouvier J., Alencar S. H. P., Harries T. J., Johns-Krull C. M., Romanova M. M. 2007, Protostars and Planets V, Eds. Reipurth B., Jewitt D., Keil K. (University of Arizona Press, Tucson) 479
- Bouvier et al. (2007b) Bouvier, J., Alencar, S. H. P., Boutelier, T., Dougados, C., Balog, Z., Grankin, K., Hodgkin, S. T., Ibrahimov, M. A. 2007b, A&A, 463, 1017
- Boiko et al. (2012) Boiko, A. I., Melnik, V. N., Konovalenko, A. A., et al. 2012, Advances in Astron. and Space Phys., V. 2, 76
- Brandenburg et al. (1995) Brandenburg, A., Nordlund, A,. Stein, R. F., Torkelsson, U. 1995, ApJ, 446, 741
- Bult & van der Klis (2015) Bult, P., van der Klis, M. 2015, ApJ, 798, L29
- Calvet et al. (1993) Calvet N., Hartmann L., Kenyon S. J. 1993, ApJ, 402, 623
- Calvet & Gullbring (1998) Calvet N., & Gullbring, E. 1998, ApJ, 509, 802
- Camenzind (1990) Camenzind, M. 1990, Reviews in Modern Astronomy, 3, 234
- Campbell (1992) Campbell, C.G. 1992, Geophys. Astrophys. Fluid Dynamics, 63, 179
- Carpenter et al. (2001) Carpenter, J.M., Hillenbrand, L.A., & Skrutskie, M.F. 2001, AJ, 121, 3160
- Chandrasekhar (1961) Chandrasekhar, S., 1961, Hydrodynamic and Hydromagnetic Stability. Clarendon, Oxford, p. 466
- Chlebowski et al. (1989) Chlebowski T., Harnden Jr. F. R., Sciortino S., 1989, ApJ, 341, 427
- Cody et al. (2014) Cody, A.M., Stauffer, J., Baglin, A. , et al. 2014, AJ, 147, id. 82, 47 pp
- D’Angelo & Spruit (2010) D’Angelo C. R., & Spruit H. C. 2010, MNRAS, 406, 1208
- Donati and Collier Cameron (1997) Donati J.-F., Collier Cameron A., 1997, MNRAS, 291,1
- Donati et al. (1999) Donati J.-F., Collier Cameron A., Hussain G.A.J., Semel M., 1999, MNRAS, 302, 437
- Donati et al. (2007) Donati, J.-F., Jardine, M. M., Gregory, S. G., Petit, P., Bouvier, J., et al., 2007, MNRAS, 380, 1297
- Donati et al. (2008) Donati J.-F., Jardine M. M., Gregory S. G., Petit, P., et al., 2008, MNRAS, 386, 1234
- Donati et al. (2010) Donati, J.-F., Skelly, M. B., Bouvier, J., Grankin, K. N., Jardine, M. M., et al., 2010, MNRAS, 409, 1347
- Donati et al. (2011) Donati, J.-F., Bouvier, J., Walter, F. M., Gregory, S. G., Skelly, M. B., et al., 2011, MNRAS, 412, 2454
- Dougados et al. (2000) Dougados, C., Cabrit, S., Lavalley, C., & Ménard, F. 2000, A&A, 357, L61
- Edwards et al. (2006) Edwards, S., Fischer, W., Hillenbrand, L., Kwan, J., ApJ 2006, 646, 319
- Fender et al. (2004) Fender, R.P. 2004, Nature, 427, 222
- Ferreira et al. (2006) Ferreira, J., Dougados, C., Cabrit, S. 2006, A&A, 453, 785
- Ferrigno et al. (2014) Ferrigno, C., Bozzo, E., Papitto, A., Rea, N., Pavan, L., et al., 2014,A&A, 567, id.A77, 14 pp. 2008
- Flock, et al. (2011) Flock, M., Dzyurkevich, N., Klahr, H., Turner, N. J., Henning, Th. 2011, ApJ, 735, article id. 122, 16 pp.
- Gagné et al. (2005) Gagné M., Oksala M. E., Cohen D. H., Tonnesen S. K., ud-Doula A., Owocki S. P., Townsend R. H. D., MacFarlane J. J., 2005, ApJ, 628, 986
- Ghosh (2007) Ghosh, P., 2007, Rotation and Accretion Powered Pulsars: World Scientific Series in Astronomy and Astrophysics – Vol. 10. Edited by Pranab Ghosh. Published by World Scientific Publishing Co., Pte. Ltd., Singapore
- Ghosh & Lamb (1978) Ghosh, P., Lamb, F. K. 1978, ApJ, 223, L83
- Goodson et al. (1997) Goodson, A.P., Winglee, R. M., Böhm, K.-H. 1997, ApJ, 489, 199
- Goodson & Winglee (1999) Goodson, A.P., & Winglee, R. M., 1999, ApJ, 524, 159
- Goodson et al. (1999) Goodson, A.P., Böhm, K.-H., Winglee, R. M. 1999, ApJ, 524, 142
- Gregory (2011) Gregory, S. G. 2011, American Journal of Physics, 79, 461
- Gullbring et al. (2000) Gullbring, E., Calvet N., Muzerolle, J., & Hartmann, L. 2000, ApJ, 544, 927
- Grunhut et al. (2013) Grunhut, J. H., Wade, G. A., Leutenegger, M., et al. 2013, MNRAS, 428, 1686
- Hamaguchi et al. (2012) Hamaguchi, K., Grosso, N., Kastner, J. H., et al. 2012, ApJ, 754, 32
- Harries (2000) Harries T. J., 2000, MNRAS, 315, 722
- Hartmann et al. (1994) Hartmann L., Hewett R., Calvet N., 1994, 426, 669
- Hayashi et al. (1996) Hayashi, M. R., Shibata, K., & Matsumoto, R. 1996, 468, L37
- Hawley et al. (1995) Hawley, J.F,, Gammie, C.F., Balbus, S.A. 1995, ApJ, 440, 742
- Hawley (2000) Hawley, J. F. 2000, ApJ, 528, 462
- Heinz et al. (2007) Heinz, S., Schulz, N. S., Brandt, W. N., & Galloway, D. K. 2007, ApJ, 663, L93
- Hellier (2001) Hellier, C. 2001, Cataclysmic variable stars, (Springer, Berlin 2001)
- Herbst et al. (1994) Herbst, W., Herbst, D. K., Grossman, E. J., Weinstein, D. 1994, AJ, 108, 1906
- Hillenbrand (1997) Hillenbrand, L. A. 1997, AJ, 113, 1733
- Hirose et al. (1997) Hirose, S., Uchida, Yu., Shibata, K., & Matsumoto, R. 1997, PASJ, 49, 193
- Illarionov & Sunyaev (1975) Illarionov, A. F., & Sunyaev, R. A. 1975, A&A, 39, 185
- Jardine et al. (2002) Jardine M., Wood K., Collier Cameron A., Donati J.-F., Mackay D.H., 2002, MNRAS, 336, 1364
- Johns-Krull (2007) Johns-Krull C. M., 2007, ApJ, 664, 975
- Johns-Krull et al. (1999) Johns-Krull C., Valenti J.A., Koresko, C., 1999, ApJ, 516, 900
- Ibragimov & Poutanen (2009) Ibragimov, A., & Poutanen, J. 2009, MNRAS, 400, 492
- Kaisig, Tajima and Lovelace (1992) Kaisig, M., Tajima, T., & Lovelace, R. V. E. 1992, ApJ., 386, 83
- Kivelson & Southwood (2005) Kivelson, M. G., Southwood, D. J., 2005, Journal of Geophysical Research (Space Physics), 110, 12209
- Kato et al. (1998) Kato, S., Fukue, J., & Mineshige, S. 1998, “Black-Hole Accretion Disks” (Kyoto University Press: Kyoto Japan)
- Kato (2004) Kato, S. 2004, PASJ, 56, 905
- Kato (2007) Kato, S. 2007, PASJ, 59, 451
- Kochukhov et al. (2011) Kochukhov, O., Lundin, A., Romanyuk, I., & Kudryavtsev, D. 2011, ApJ, 726, 24
- Koldoba et al. (2002a) Koldoba, A. V., Lovelace, R. V. E., Ustyugova, G. V., Romanova, M. M., 2002a, AJ, 123, 2019
- Koldoba et al. (2002b) Koldoba, A. V., Romanova, M. M., Ustyugova, G. V., Lovelace, R. V. E. 2002b, ApJ, 576, L53
- Königl (1991) Königl, A. 1991, ApJ, 370, L39
- Königl et al. (2011) Königl, A., Romanova, M.M., Lovelace, R.V.E. 2011, MNRAS, 416, 757
- Küker et al. (2003) Küker, M., Henning, T., & Rüdiger, G. 2003, ApJ, 589, 397
- Kulkarni & Romanova (2005) Kulkarni, A. K., & Romanova, M. M., 2005, ApJ, 633, 349
- Kulkarni & Romanova (2008) Kulkarni, A., & Romanova, M.M. 2008, ApJ, 386, 673
- Kulkarni & Romanova (2009) Kulkarni, A., & Romanova, M.M. 2009, ApJ, 398, 1105
- Kulkarni & Romanova (2013) Kulkarni, A., & Romanova, M.M. 2013, MNRAS, 433, 3048
- Kurosawa et al. (2004) Kurosawa R., Harries T.J., Bate M.R., Symington N.H., 2004, MNRAS, 351, 1134
- Kurosawa et al. (2008) Kurosawa, R, Romanova, M.M., Harries, T.J. 2008, MNRAS, 385, 1931
- Kurosawa et al. (2011) Kurosawa, R., Romanova, M.M., Harries, T.J. 2011, MNRAS, 416, 2623
- Kurosawa & Romanova (2012) Kurosawa, R., & Romanova, M.M. 2012, MNRAS, 426, 2901
- Kurosawa & Romanova (2013) Kurosawa R. and Romanova M. M. 2013, MNRAS, 431, 2673
- Lai (1999) Lai, D. 1999, ApJ,524, 1030
- Lamb et al. (1973) Lamb, F. K., Pethick, C. J., Pines, D. 1973, ApJ, 184, 271
- Lamb et al. (2009) Lamb, F. K., Boutloukos, S., Van Wassenhove, S. et al. 2009, ApJ, 705, L36
- Lii et al. (2012) Lii, P.S., Romanova, M.M., Ustyugova, G.V., Koldoba, A.V., Lovelace, R.V.E. 2012, MNRAS, 420, 2020
- Lii et al. (2014) Lii, P.S., Romanova, M.M., Ustyugova, G.V., Koldoba, A.V., Lovelace, R.V.E. 2014, MNRAS, 441, 86
- Linares (2014) Linares, M., 2014, ApJ, 795, 72
- Lipunov & Shakura (1980) Lipunov, V.M., & Shakura, N.I. 1980, Soviet Astron. Let., 6, 14
- Long et al. (2005) Long, M., Romanova, M.M., Lovelace, R.V.E. 2005, ApJ, 634, 1214
- Long et al. (2007) Long, M., Romanova, M.M., & Lovelace, R.V.E. 2007, MNRAS, 374, 436
- Long et al. (2008) Long, M., Romanova, M.M., & Lovelace, R.V.E. 2008, MNRAS, 386, 1274
- Long et al. (2011) Long, M., Romanova, M.M., Kulkarni, A.K., Donati, J.-F. 2011, MNRAS, 413, 1061
- Long et al. (2012) Long, M., Romanova, M.M., Lamb, F.K. 2012, New Astronomy, 17, 232
- Lovelace et al. (1991) Lovelace, R.V.E., Berk, H.L., Contopoulos, J. 1991, ApJ, 379, 696
- Lovelace et al. (1995) Lovelace, R.V.E., Romanova, M.M., Bisnovatyi-Kogan, G.S. 1995, MNRAS, 275, 244
- Lovelace et al. (1999) Lovelace, R.V.E., Romanova, M.M., Bisnovatyi-Kogan, G.S. 1999, ApJ, 514, 368
- Lovelace et al. (2002) Lovelace, R.V.E., Li, H., Koldoba, A.V., Ustyugova, G.V., Romanova, M.M. 2002, ApJ, 572, 445
- Lovelace et al. (2008) Lovelace, R. V. E., Romanova, M. M., & Barnard, A.W., 2008, MNRAS, 389, 1233
- Lovelace et al. (2010) Lovelace, R.V.E., Romanova, M.M., Ustyugova, G.V., Koldoba, A.V. 2010, MNRAS, 408, 2083
- Matt et al. (2002) Matt, S., Goodson, A.P., Winglee, Robert M., Böhm, K-H 2002, ApJ, 574, 232
- Matt & Pudritz (2005) Matt, S., & Pudritz, R.E. 2005, ApJ, 632, 135
- Matt & Pudritz (2008) Matt, S., & Pudritz, R.E. 2008, ApJ, 681, 391
- Mauche (2006) Mauche, C.W. 2006, MNRAS, 369, 1983
- McKinney et al. (2014) McKinney, J.C., Tchekhovskoy, A., Blandford, R.D., MNRAS, 423, 3083
- Méndez & Belloni (2007) Méndez, M., & Belloni 2007, MNRAS, 381, 790
- Miller et al. (1998) Miller, M.C., Lamb, F.K., & Psaltis, D. 1998, ApJ, 508, 791
- Miller & Stone (1997) Miller, K.A., & Stone, J.M. 1997, ApJ, 489, 890
- Nazé et al. (2014) Nazé, Y., Petit, V., Rinbrand, M., et al. 2014, ApJS, 215, 10
- Owocki et al. (2014) Owocki, S. P., ud-Doula, A., Townsend, R. H. D., et al. 2014, IAU Symposium, 302, 320
- Papitto et al. (2007) Papitto, A., di Salvo, T., Burderi, L., Menna, M. T., Lavagetto, G., Riggio, A. 2007, MNRAS, 375, 971
- Papitto et al. (2013) Papitto, A., Ferrigno, C., Bozzo, E., Rea, N., Pavan, L., et al., 2013, Nature, 501, Issue 7468, 517
- Papitto & Torres (2015) Papitto, A., & Torres, D.E., 2015, ApJ, 807, article id. 33, 10 pp.
- Patruno et al. (2009) Patruno, A., Watts, A.L., Klein-Walt, M., Wijnands, R., van der Klis, M. 2009, ApJ, 707, 1296
- Patruno & D’Angelo (2013) Patruno, A., & D’Angelo, C. 2013, ApJ, 771, 94
- Patruno & Watts (2012) Review to appear in “Timing neutron stars: pulsations, oscillations and explosions”, T. Belloni, M. Mendez, C.M. Zhang Eds., ASSL, Springer; arxiv1206.2727
- Patruno et al. (2014) Patruno, A., Archibald, A. M., Hessels, J. W. T., Bogdanov, S., Stappers, B. W., Bassa, C. G., et al., ApJ, 781, article id. L3, 5 pp.
- (135) Petit V., Owocki S. P., Wade G. A., Cohen D. H., Sundqvist J. O., Gagné M., Maíz Apellániz J., Oksala M. E., Bohlender D. A., Rivinius T., Henrichs H. F., Alecian E., Townsend R. H. D., ud-Doula A., MiMeS Collaboration 2013, MNRAS, 429, 398
- Pringle & Rees (1972) Pringle, J.E., & Rees, M.J. 1972, A&A, 21, 1
- Poutanen et al. (2009) Poutanen, J., Ibragimov, A., Annala, M. 2009, ApJ, 706, L129
- Rastätter & Schindler (1999) Rastätter, L. & Schindler, K. 1999, ApJ, 524, 361
- Ray et al. (2007) Ray, T., Dougados, C., Bacciotti, F., Eislöffel, J., Chrysostomou, A. 2007, Protostars and Planets V, B. Reipurth, D. Jewitt, and K. Keil (eds.), (University of Arizona Press, Tucson) p. 231
- Romanova et al. (2008) Romanova, M.M., Kulkarni, A.K., Lovelace, R.V.E. 2008, ApJ, 673, L171
- Romanova et al. (2005a) Romanova, M. M., Lovelace, R.V.E., Ustyugova, G. V., Koldoba, A.V. 2005a, Protostars and Planets V. LPI Contribution No. 1286., p.8533
- Romanova et al. (2002) Romanova, M. M., Ustyugova, G. V., Koldoba, A. V., Lovelace, R. V. E., 2002, ApJ, 578, 420
- Romanova et al. (2004) ————- 2004, ApJ, 610, 920
- Romanova et al. (2005b) ————- 2005b, ApJ, 635, 165L
- Romanova et al. (2009) ————- 2009, MNRAS, 399, 1802
- Romanova et al. (2011a) ————- 2011a, MNRAS, 416, 416
- Romanova et al. (2012) ————- 2012, MNRAS, 421, 63
- Romanova et al. (2013) ————- 2013, MNRAS, 430, 699
- Romanova et al. (2003) Romanova, M. M., Ustyugova, G. V., Koldoba, A. V., Wick, J. V., Lovelace, R. V. E., 2003, ApJ, 595, 1009
- Romanova et al. (2011b) Romanova, M. M., Long, M., Lamb, F. K., Kulkarni, A. K., Donati, J.-F. 2011b, MNRAS, 411, 915
- Romanova et al. (2014) Romanova, M. M., Lovelave, R.V.E., Bachetti, M., Blinova, A.A., Koldoba, A.V., et al. 2014, Physics at the Magnetospheric Boundary, Geneva, Switzerland, Edited by E. Bozzo; P. Kretschmar; M. Audard; M. Falanga; C. Ferrigno; EPJ Web of Conferences, Volume 64, id.05001
- Rucinski et al. (2008) Rucinski, S. M., et al. 2008, MNRAS, 391, 1913
- Scandariato et al. (2012) Scandariato, G., Da Rio, N., Robberto, M., Pagano, I., & Stassun, K. 2012, A&A, 545, A19
- Shakura & Sunyaev (1973) Shakura, N.I., & Sunyaev, R.A. 1973, A&A, 24, 337
- Sunyaev & Shakura (1977) Sunyaev, R.A. & Shakura, N.I. 1977, Pisma Astron. Zh., 3, 262
- Shu et al. (1994) Shu, F., Najita, J., Ostriker, E., Wilkin, F., Ruden, S., Lizano, S. 1994, ApJ, 429, 781
- (157) Simon, J.B., Hawley, J.F., & Beckwith, K. 2011, ApJ, 730, 94
- Sokoloski et al. (2008) Sokoloski, J. L., Rupen, M. P., Mioduszewski, A.J., 2008, ApJ, 685, L137
- Spruit et al. (1995) Spruit H. C., Stehle R., Papaloizou J. C. B. 1995, MNRAS, 275, 1223
- Spruit & Taam (1990) Spruit H. C., Taam, R. E. 1990, ApJ, 229, 475
- Spruit & Taam (1993) Spruit H. C., Taam, R. E. 1993, ApJ, 402, 393
- Stone et al. (1996) Stone, J.M., Hawley, J.F., Balbus, S.A., Gammie, C.F. 1996, ApJ, 463, 656
- Stauffer et al. (2014) Stauffer, J., Cody, A.M., Baglin, A. , et al. 2014, AJ, 147, id. 83, 34 pp
- Stauffer et al. (2015) Stauffer, J., Cody, A.M., McGinnis. , Rebull, L., Lillenbrand, L.A. et al. 2015, AJ, 149, id. 130, 30 pp
- Stone & Gardiner (2007a) Stone J. M., Gardiner T. A., 2007a, Phys. Fluids, 19, 4104
- Stone & Gardiner (2007b) Stone J. M., Gardiner T. A., 2007b, ApJ, 671, 1726
- Sundqvist et al. (2012) Sundqvist, J. O., ud-Doula, A., Owocki, S. P., Townsend, R. H. D., Howarth, I. D., Wade, G. A., 2012, MNRAS, 423, L21
- Terquem & Papaloizou (2000) Terquem, C., Papaloizou, J. C. B. 2000, A&A, 360, 1031
- Townsend (2008) Townsend, R. H. D., 2008, MNRAS, 389, 559
- Townsend et al. (2010) Townsend, R. H. D., Oksala, M. E., Cohen, D. H., Owocki, S. P., ud-Doula, A., 2010, ApJ, 714, L318
- Townsend & Owocki (2005) Townsend, R. H. D., Owocki, S. P., 2005, MNRAS, 357, 251
- Townsend et al. (2005) Townsend, R. H. D., Owocki, S. P., Groote, D., 2005, ApJ, 630, L81
- Townsend et al. (2007) Townsend, R. H. D., Owocki, S. P., ud-Doula, A., 2007, MNRAS, 382, 139
- ud-Doula & Owocki (2002) ud-Doula, A., & Owocki, S. P. 2002, ApJ, 576, 413
- ud-Doula et al. (2008) ud-Doula A., Owocki S. P., Townsend R. H. D., 2008, MNRAS, 385, 97
- ud-Doula et al. (2009) ud-Doula A., Owocki S. P., Townsend R. H. D., 2009, MNRAS, 392, 1022
- ud-Doula et al. (2013) ud-Doula A., Sundqvist J. O., Owocki S. P., Petit V., Townsend R. H. D., 2013, MNRAS, 428, 2723
- ud-Doula et al. (2014) ud-Doula, A., Owocki, S., Townsend, R., Petit, V., & Cohen, D. 2014, MNRAS, 441, 3600
- Ustyugova et al. (2006) Ustyugova, G.V., Koldoba, A.V., Romanova, M.M., Lovelace, R.V.E. 2006, ApJ, 646, 304
- Uzdensky et al. (2002) Uzdensky, D.A., Kn̈igl, A., & Litwin, C. 2002, ApJ, 565, 1205
- van der Klis (2000) Van der Klis, M. 2000, Ann. Rev. Astron. Astrophys., 38, 717
- van der Klis (2006) van der Klis M. 2006, Compact Stellar X-Ray Sources, Eds. Lewin W. H. G. and van der Klis M. (Cambridge Univ. Press, Cambridge) 39
- Vidotto et al. (2009) Vidotto, A. A., Opher, M., Jatenco-Pereira, Gombosi, V. T. I., 2009, ApJ, 703, 1734
- Vidotto et al. (2011) Vidotto, A. A., Jardine, M., Opher, M., Donati, J. F., Gombosi, T. I., 2011, MNRAS, 412, 351
- van Straaten et al. (2005) van Straaten, S., van der Klis, M., Wijnands, R. 2005, ApJ, 619, 455
- Vink et al. (2000) Vink, J. S., de Koter, A., & Lamers, H. J. G. L. M. 2000, A&A, 362, 295
- Wang & Robertson (1984) Wang, Y.-M. & Robertson, J.A. 1984, A&A, 139, 93
- Wang & Robertson (1985) Wang, Y.-M. & Robertson, J.A. 1985, ApJ, 299, 85
- Wang et al. (1992) Wang, J.C.L., Sulkanen, M.E., Lovelace, R.V.E. 1992, ApJ, 390, 46
- Warner et al. (1995) Warner B., 1995, Cataclysmic variable stars, (CUP, Cambridge 1995)
- Weber & Davis (1967) Weber E. J., Davis L., 1967, ApJ, 148, 217
- Wijnands & van der Klis (1998) Wijnands, R., & van der Klis, M. 1998, Nature, 394, 344
- Wijnands et al. (2003) Wijnands, R., van der Klis, M., Homan, J., et al. 2003, Nature, 424, 44
- Wynn et al. (1997) Wynn, G. A., King, A. R., & Horne, K. 1997, MNRAS, 286, 436
- Zanni & Ferreira (2013) Zanni, C., & Ferreira, J. 2013, A&A , 550, A99
