![[Uncaptioned image]](/html/1605.03500/assets/x1.png)
HMI Synoptic Maps Produced by NSO/NISP
Abstract
Recently, the National Solar Observatory (NSO) Solar-atmosphere Pipeline Working Group (PWG) has undertaken the production of synoptic maps from Helioseismic and Magnetic Imager (HMI) magnetograms. A set of maps has been processed spanning the data available for 2010-2015 using twice daily images (taken at UT midnight and noon) and running them through the same algorithms used to produce SOLIS/VSM 6302l mean-magnetic and spatial-variance maps. The contents of this document provide an overview of what these maps look like, and the processing steps used to generate them from the original HMI input data.
Technical Report No. NSO/NISP-2016-002
1 Basic Product: Integral Carrington Maps
The goal of this project has been to create a series of integral magnetic synoptic maps using HMI data (Schou, et al., 2012) and run using the same algorithms as those that produce the spatial-variance synoptic maps outlined in Bertello, et al. (2014) and derived from NSO SOLIS (Synoptic Optical Long-term Investigations of the Sun) VSM (Vector Spectromagnetograph) 630.2 nm data.
The HMI synoptic maps that we have produced are all integral synoptic maps (spanning 0-360∘ of a single Carrington rotation), in Carrington-longitude–by–sine(latitude) binning, and in NSO-low-resolution format (360x180 map bins, where contributing observations are weighted by cosine4(longitude) relative to the observed longitude of central meridian).
Unlike the SOLIS/VSM spatial-variance maps produced to date, the HMI synoptic maps have been run using both longitudinal- and vector-observed magnetograms, where the final data-products for each are detailed in §1.1 and §1.2, below. At a minimum, each FITS-file map set includes a frame for:
- the mean photospheric radial magnetic flux,
- the spatial variance of the mean photospheric radial magnetic flux,
- the sum-of-weights from all observations contributing to a given map set.
1.1 Pseudo-radial Maps from LOS Data
For the HMI-longitudinal synoptic maps, we have used data from the HMI m_720s series (longitudinal magnetograms covering a 12-minute integration window, Scherrer, et al. (2012)). In order to produce maps of radial magnetic flux, we have projected the line-of-sight flux values into pseudo-radial values using the assumption of a perfectly radial magnetic field at the photosphere:
| (1) |
where is the observed LOS flux, and is the center-to-limb (or heliocentric) angle between the line-of-sight vector and the local vertical.
Additionally, with the reasonable levels of quiet-sun sensitivity provided by longitudinal observations, basic methods for filling in unobservable or poorly observed polar fields become viable. Therefore, for the HMI-LOS derived maps, we have provided a pole-filled version of the mean–pseudo-radial–flux map as an additional frame. Some methods of pole-filling interpolate spatially and temporally across the pole from well-observed dates/latitudes (Sun, et al., 2011). In our case, the polar fields are filled in using a cubic-polynomial surface fit to the currently observed fields at neighboring latitudes. The fit is performed on a polar-projection of the map using low standard-deviation-to-fit measurements only, and the high-latitude fit is then integrated into the observed synoptic map, weighting toward the pole.
A set of example maps derived from HMI-longitudinal magnetograms is shown in Figure 1,
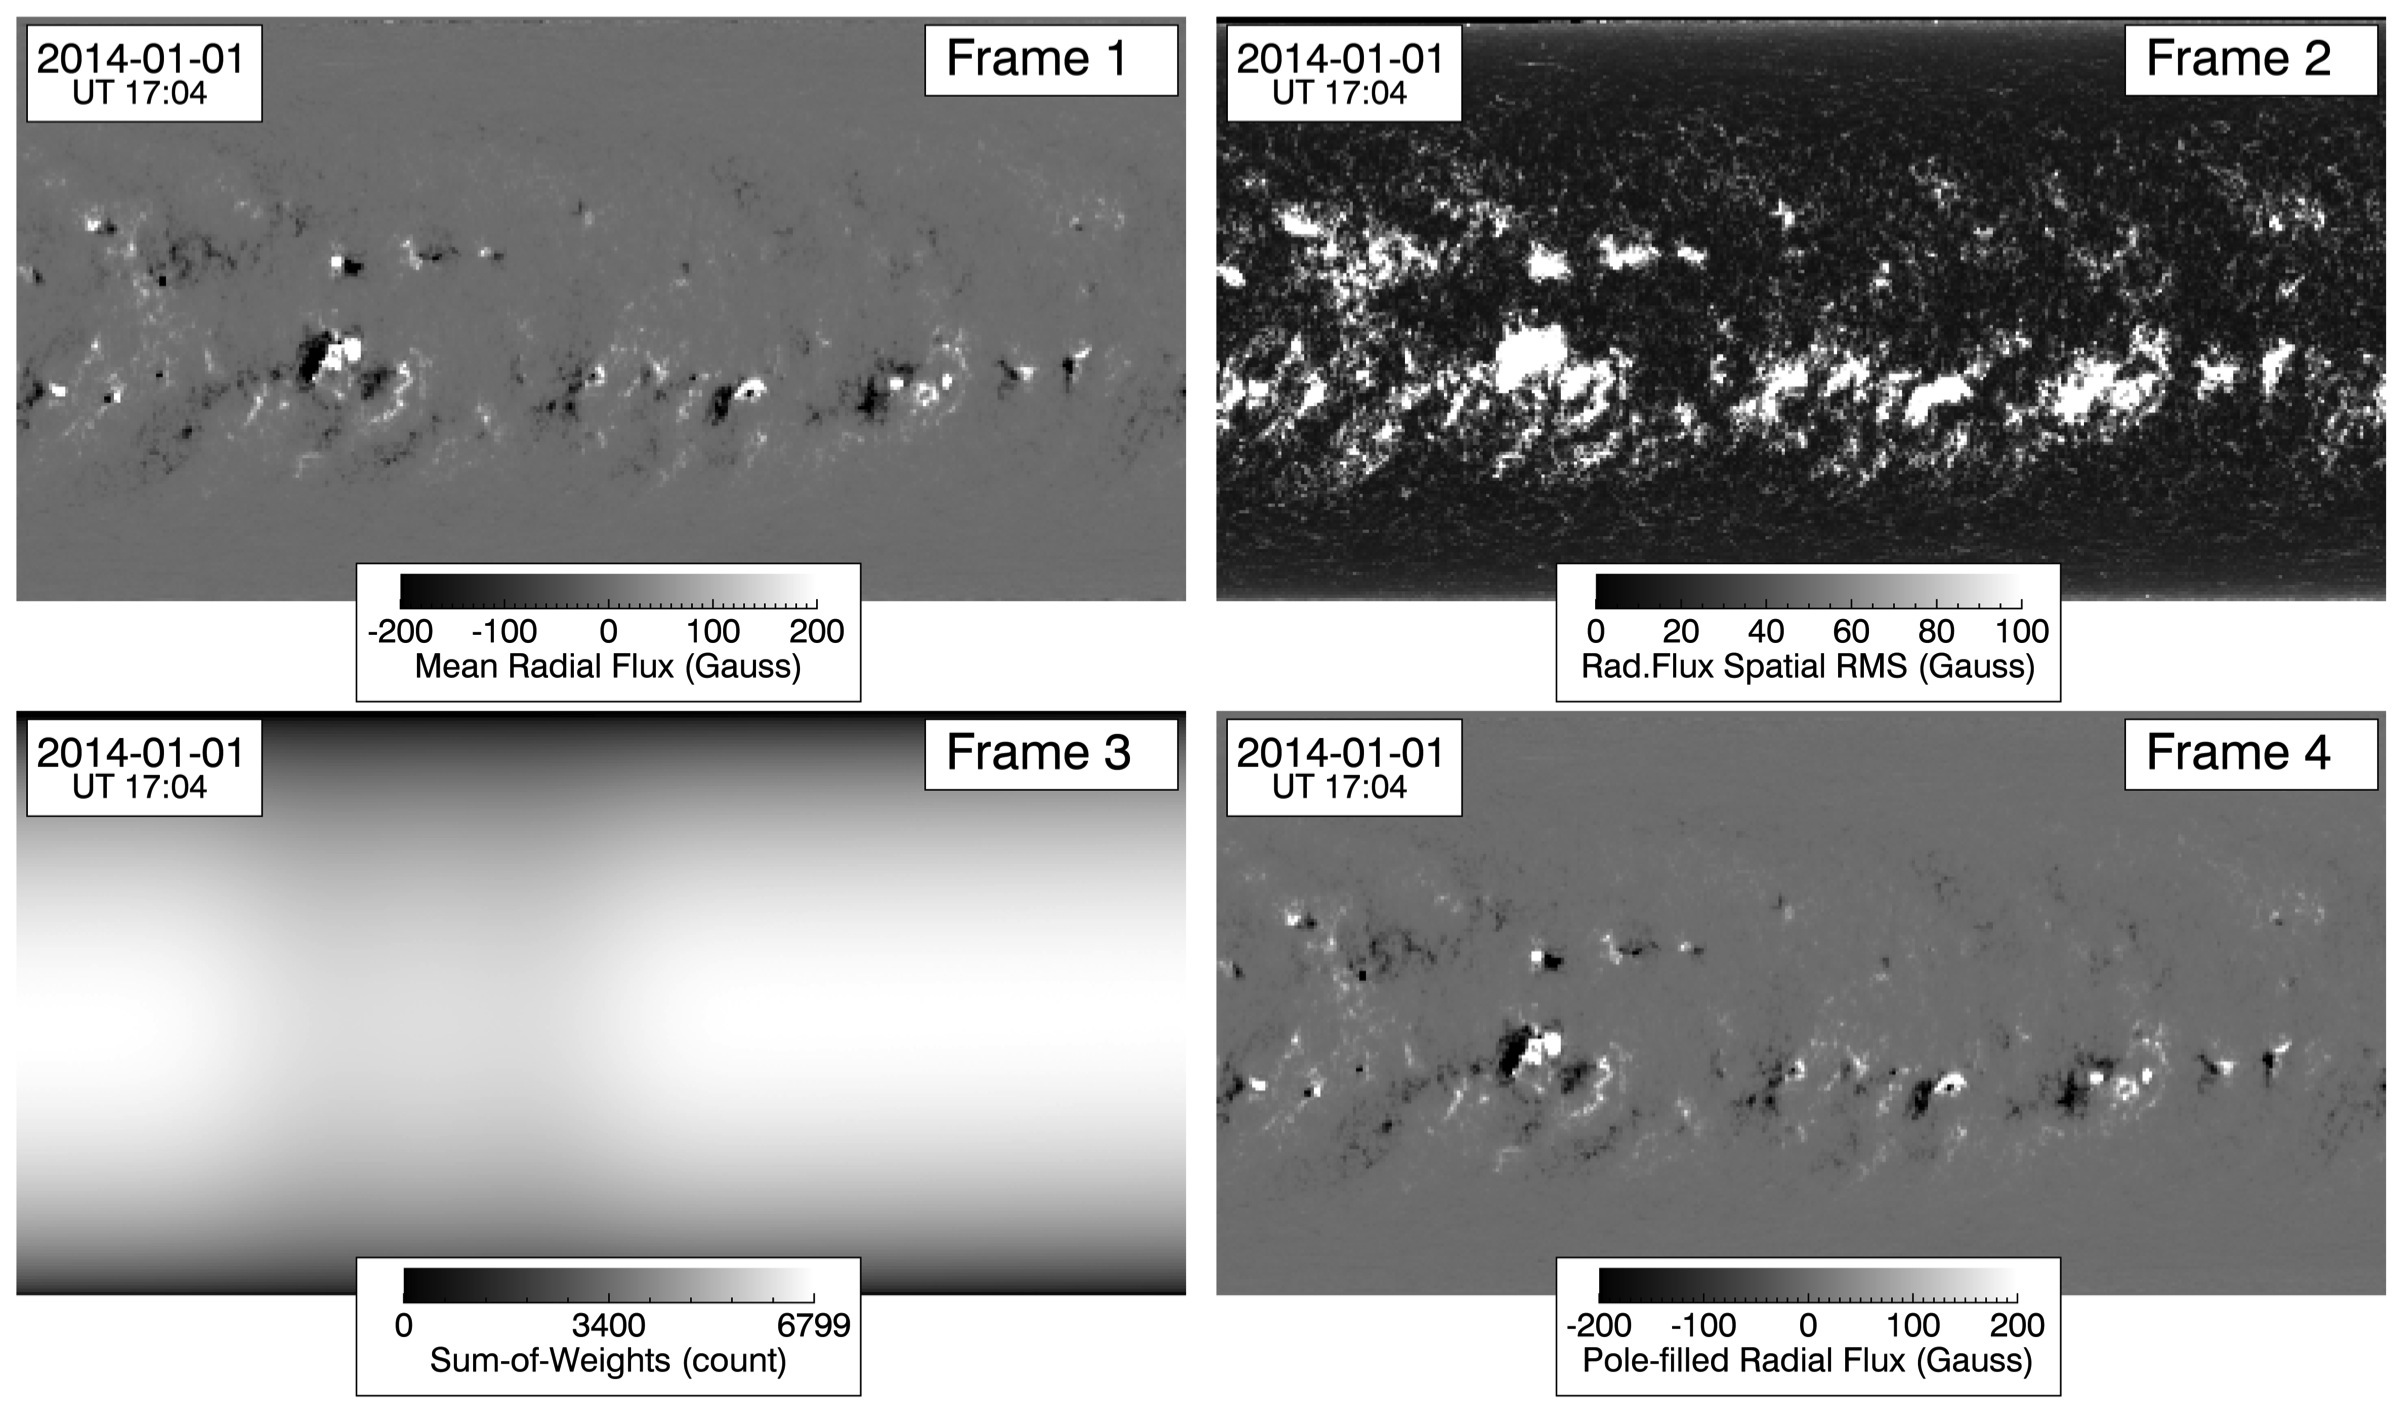
while the file-name structure that we have used and the specifics of the FITS-file frame contents are outlined below.
Filename Structure:
‘xbx73YYMMDDtHHMMcCCCC_000_int-err_dim-180_source-SDO-HMI.fits.gz’
-
‘xbx73’: This is the product code that denotes HMI synoptic maps derived from photospheric longitudinal magnetograms.
-
‘YYMMDDtHHMM’: This is the time-stamp assigned to the map. For Integral synoptic maps, NSO uses the date and time corresponding to the midpoint of a given Carrington rotation.
-
‘cCCCC_000’: This denotes the Carrington rotation mapped as well as the Carrington longitude at the left map edge. As Integral synoptic maps always run from 0 to 360 degrees, the filenames for these maps will always have ‘_000’ for the longitude.
FITS-frame Contents:
frame
units
title / description
1
Gauss
Weighted-mean Radial Flux Density:
The mean value of the radially-projected HMI-LOS magnetograms for each longitude-sine(latitude) map bin. Each input observation is spatially weighted to emphasize contributions observed near the central meridian.
2
Gauss
Spatial RMS Estimate:
The weighted statistical variance of all radially-projected HMI-LOS-magnetogram-values contributing to a given longitude-sine(latitude) bin (corresponding to the mean-flux values in Frame 1).
3
counts
Sum-of-Weights:
The sum of weights into each map bin. This includes both the longitude–versus–central-meridian weighting applied across each input observation, as well as the count of sky-image pixels contributing to each observed longitude-sine(latitude) bin.
4
Gauss
Pole-filled Mean Radial Flux Density:
The pole-filled version of Frame 1.
1.2 3-Component Maps from Vector Data
For the HMI-vector synoptic maps, we have used data from the HMI b_720s series (fully disambiguated vector magnetograms, Hoeksema, et al. (2014)), choosing to apply the results of the Radial-accute disambiguation for the regions of quiet sun (Metcalf, et al., 2006; Leka, et al., 2009). As this is vector data, the mean-radial-flux map in these files is for true-radial flux. Additionally, we have mapped the values for the mean poloidal and toroidal fluxes, and computed the spatial-variance of these quantities. For these additional-component maps, we have used the same cosine4(longitude) weighting that broadly emphasizes fluxes observed near central meridian.
A set of example maps derived from the HMI-vector magnetograms is shown in Figure 2,
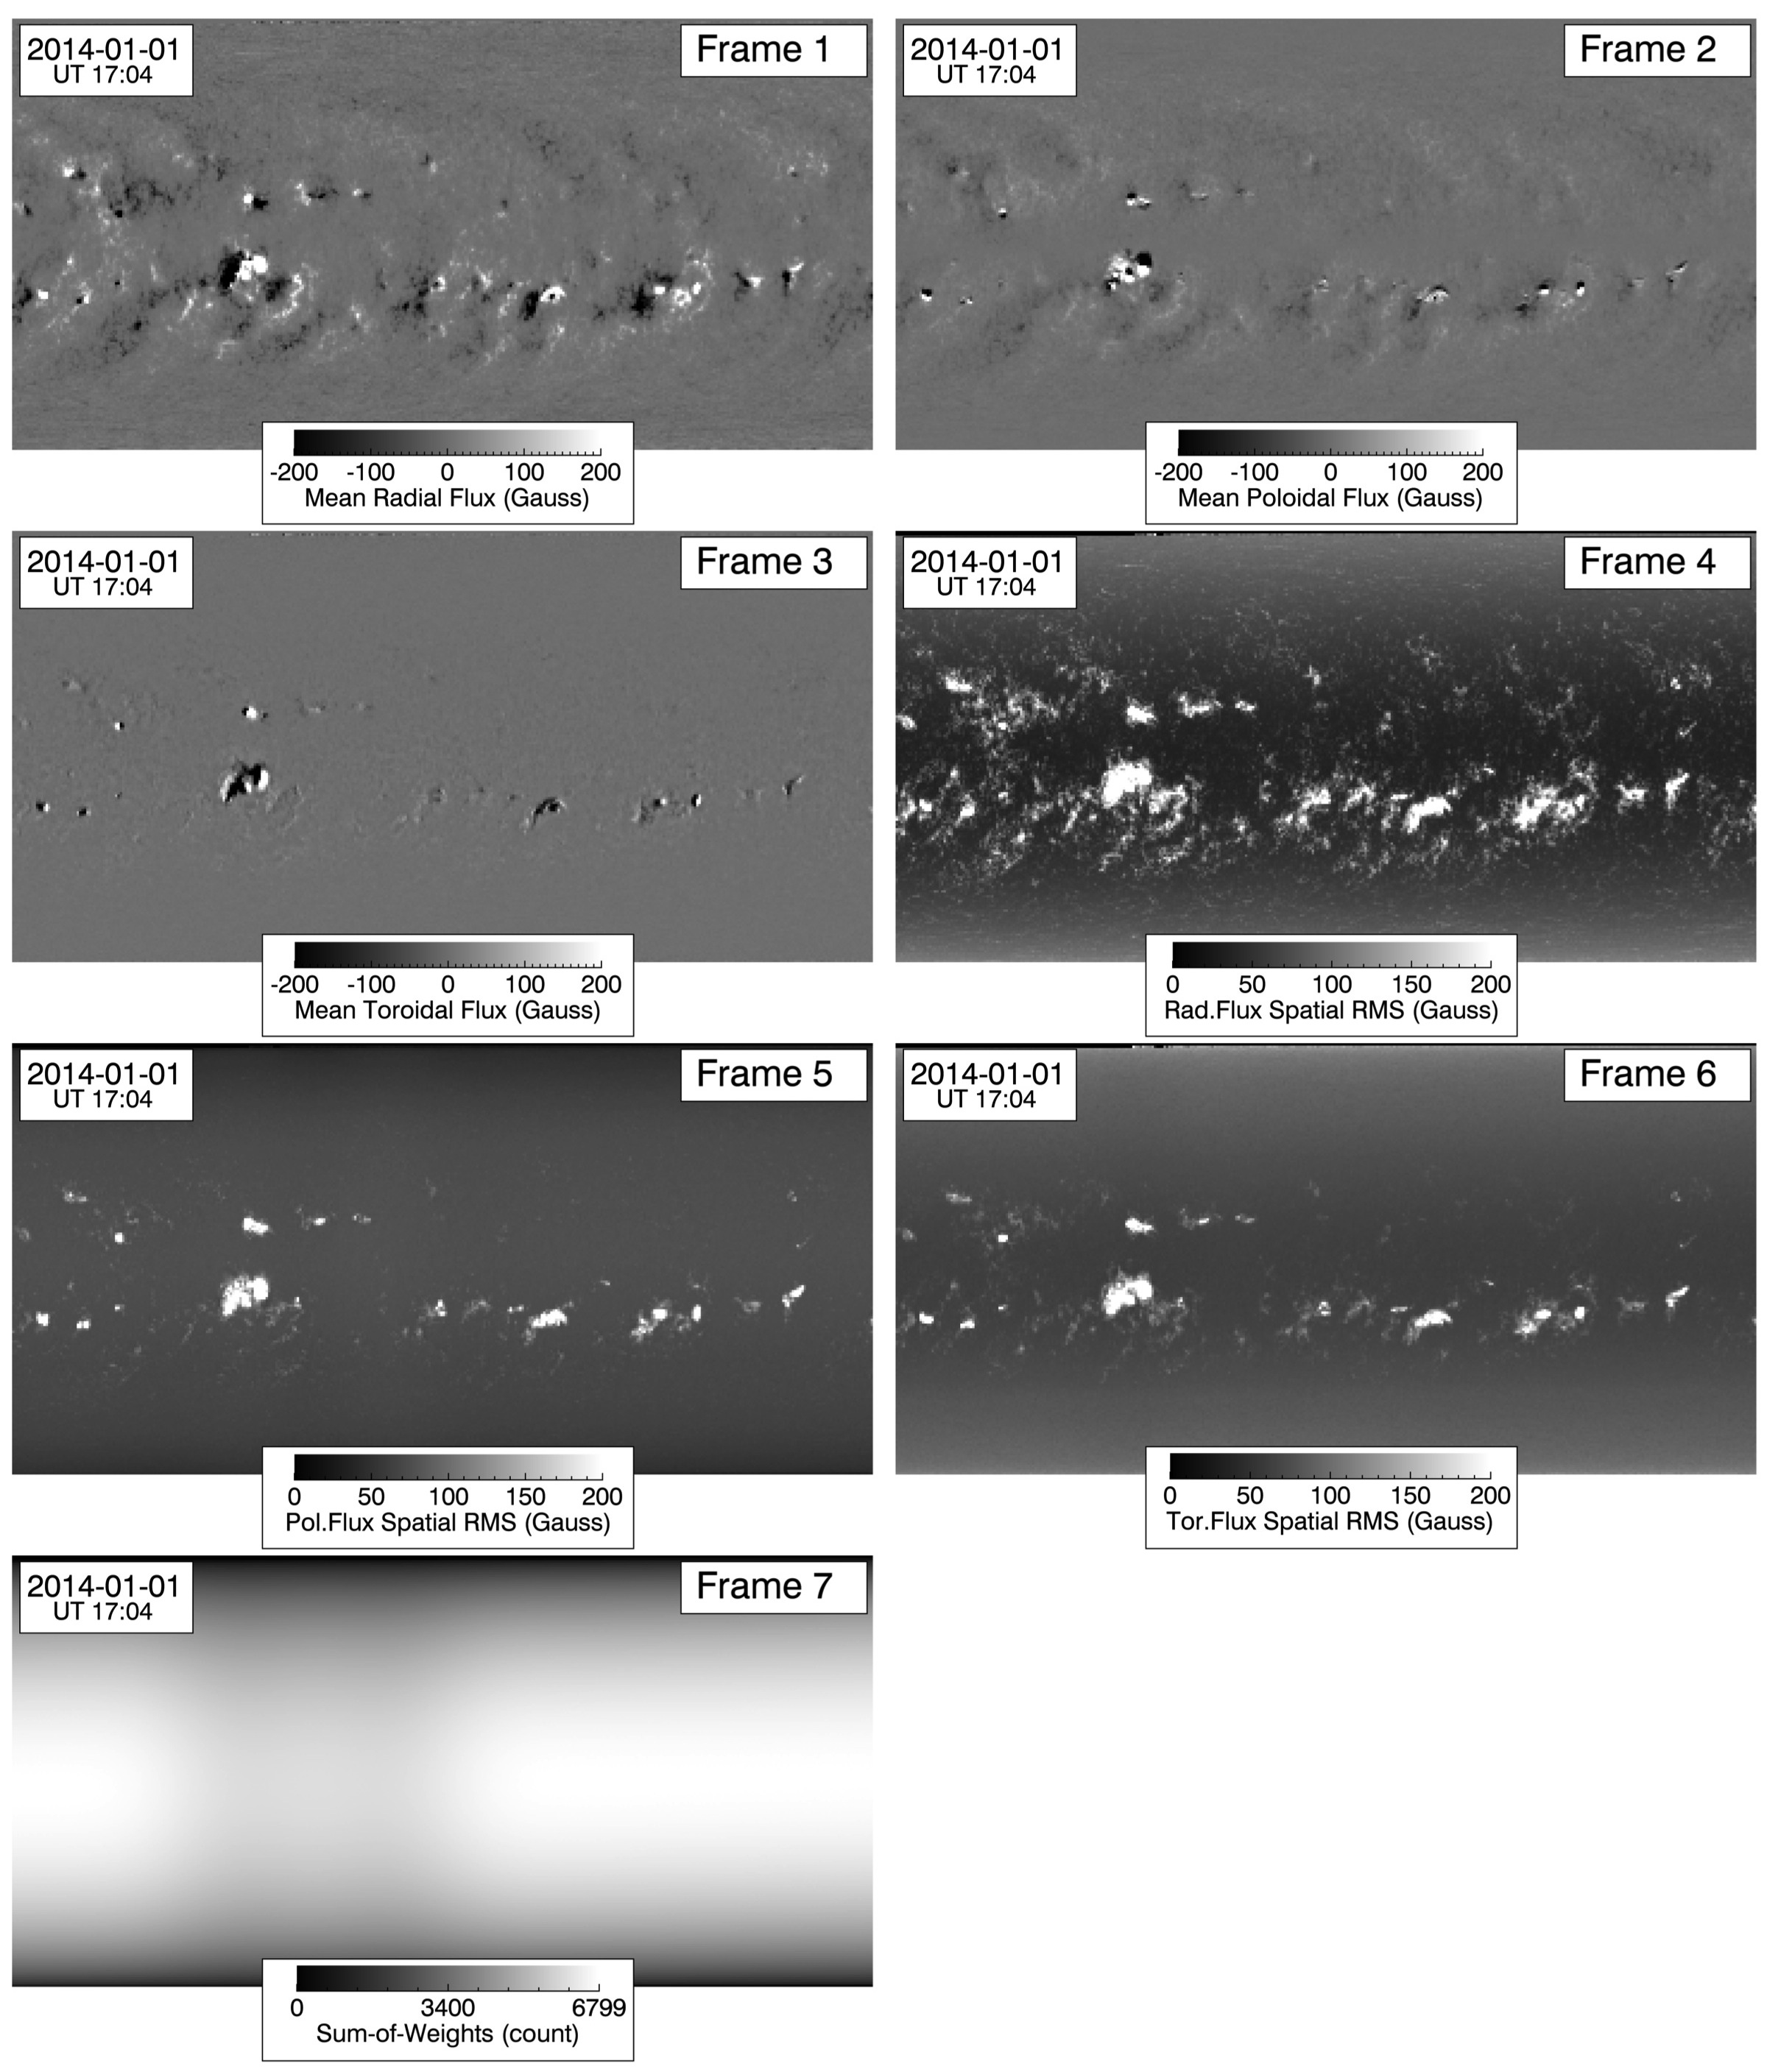
while the file-name structure that we have used and the specifics of the FITS-file frame contents are outlined below.
Filename Structure:
‘xbx93YYMMDDtHHMMcCCC_000_int-err_dim-180_source-SDO-HMI.fits.gz’
-
‘xbx93’: This is the product code that denotes HMI synoptic maps derived from photospheric vector magnetograms.
-
‘YYMMDDtHHMM’: As in §1.1, this is the time-stamp assigned to the map.
-
‘cCCCC_000’: As in §1.1, this denotes the Carrington rotation mapped as well as the Carrington longitude at the left map edge.
FITS-frame Contents:
frame
units
title / description
1
Gauss
Weighted-mean Radial Flux Density:
The mean value of the radial (outward) flux (measured from HMI vector magnetograms) for each longitude-sine(latitude) bin. Each input observation is spatially weighted to emphasize contributions observed near the central meridian.
2
Gauss
Weighted-mean Poloidal Flux Density:
The mean value of the poloidal (southward) flux (measured from HMI vector magnetograms) for each longitude-sine(latitude) bin. Each input observation is spatially weighted to emphasize contributions observed near the central meridian.
3
Gauss
Weighted-mean Toroidal Flux Density:
The mean value of the toroidal (+longitude-ward) flux (measured from HMI vector magnetograms) for each longitude-sine(latitude) bin. Each input observation is spatially weighted to emphasize contributions observed near the central meridian.
4
Gauss
Radial-flux Spatial RMS Estimate:
The weighted statistical variance of all HMI-vector radial-flux magnetogram-values contributing to a given longitude-sine(latitude) bin (corresponding to the mean-flux values in Frame 1).
5
Gauss
Poloidal-flux Spatial RMS Estimate:
The weighted statistical variance of all HMI-vector poloidal-flux magnetogram-values contributing to a given longitude-sine(latitude) bin (corresponding to the mean-flux values in Frame 2).
6
Gauss
Toroidal-flux Spatial RMS Estimate:
The weighted statistical variance of all HMI-vector toroidal-flux magnetogram-values contributing to a given longitude-sine(latitude) bin (corresponding to the mean-flux values in Frame 3).
7
counts
Sum-of-Weights:
The sum of weights into each map bin. This includes both the longitude–versus–central-meridian weighting applied across each input observation, as well as the count of sky-image pixels contributing to each observed longitude-sine(latitude) bin.
2 Processing Stages and Code Layout
The following sub-sections provide a basic map of the various processing stages required to ingest HMI sky-image magnetograms and output SOLIS–spatial-variance–style synoptic maps. These stages include:
2.1 Ingest of Sky Images
In order to prepare the HMI magnetograms for heliographic and synoptic mapping, a few things need to happen, including: download the magnetograms from the Joint Science Operations Center (JSOC) site, update the image orientation and a few FITS-header keywords to comply with SOLIS-pipeline expectations, and — in the case of the vector magnetograms — calculate the heliographic magnetic-vector components from the HMI input frames. The layout of the code calls looks like this:
-
1.
Call backfillMagnetograms.sh N1 N2:
-
-
For each day N1 to N2 days ago, requests a download of the UT 00:00 and UT 12:00 magnetograms from JSOC and places the results in an NSO-accessible data-keep directory.
-
-
-
2.
Call hmi_serrmaps_intake2fits_BatchRun.sh [-v] START STOP OUTDIR:
-
-
For each day from START to STOP:
-
Searches for available downloaded JSOC files, INFILEs.
-
Calls hmi_serrmaps_intake2fits [-v] INFILE OUTDIR
-
Opens the rice-compressed INFILE file.
-
Rotates the FITS image by 180∘ to place Solar-north at the top.
-
Re-writes the FITS header using SOLIS-style sectioning.
-
Adds (primarily duplicate) keywords to the FITS header to account for the updated image geometry and allow for data read-in by SOLIS downstream processing.
-
Outputs the results to a gzipped file placed in a data keep within OUTDIR and using the NSO-style file-naming conventions.
-
-
-
-
-
3.
IF(vector): Call hmi_serrmaps_intakevbundle_BatchRun.sh START STOP:
-
-
For each day from START to STOP:
-
Searches for available ingested gzipped FITS files with flavor tag ‘_type-b-720s-field’, FIELDFILEs.
-
In IDL, calls hmi_serrmaps_intakevbundle, FIELDFILE:
-
Using input FIELDFILE filename to extrapolate, reads in the full file set necessary (‘-field’, ‘-inclination’, ‘-azimuth’, ‘-disambig’) to compute magnetic-flux vector components.
-
Applies the disambiguation results (Radial-accute in the quiet sun) to the azimuth image by adding 180∘ to all pixels where disambig is true.
-
Calls chcoord3.pro to define the heliographic coordinates of each image pixel.
-
Computes the line-of-site and transverse magnetic-vector components, then rotates them into the local-surface heliographic plane(s).
-
Outputs the three frames of heliographic vector components into a FITS file with the flavor tag ‘_type-b-720s-helio’.
-
-
-
-
LOS magnetograms: For the LOS magnetograms, an example output image (from step 2) is shown in Figure 3.

These FITS files have only a single image frame, containing the LOS magnetic flux measured by HMI. They are given file names with the structure:
‘x4x72YYMMDDtHHMMSS_source-SDO-HMI_type-m-720s.fits.gz’
-
‘x4x72’: This is the product code that denotes HMI sky images of photospheric longitudinal magnetograms.
-
‘YYMMDDtHHMMSS’: This is the observation’s time-stamp.
-
‘_type-m-720s’: This indicates HMI–line-of-sight–magnetogram source data, regardless of image type.
Vector magnetograms: For the vector magnetograms, an example file set of ingested (output from step 2) data are shown in Figure 4. In the ‘-azimuth’ file, angles are measured from the +y image axis and increase counter-clockwise. In the ‘-disambig’ file, true values for the Radial-acute disambiguation are indicated with integer values 4,5,6 and 7 (for Random disambiguation: 2,3,6,7; for Potential-acute disambiguation: 1,3,5,7).
The frames for the corresponding heliocentric–magnetic-vector–components file (output from step 3) are shown in Figure 5. These final-vector sky-image output FITS files have naming structures and frame contents as outlined below.


Filename Structure:
‘x4x92YYMMDDtHHMMSS_source-SDO-HMI_type-b-720s-helio.fits.gz’
-
‘x4x92’: This is the product code that denotes HMI sky images of photospheric vector magnetograms.
-
‘YYMMDDtHHMMSS’: This is the observation’s time-stamp.
-
‘_type-b-720s-helio’: Regardless of image type, this indicates HMI-vector-magnetogram source data mapped into heliocentric vector components.
FITS-frame Contents:
frame
units
title / description
1
Gauss
Radial flux (outward):
HMI b_720s magnetogram radial-flux vector component.
2
Gauss
Poloidal flux (southward):
HMI b_720s magnetogram poloidal-flux vector component.
3
Gauss
Toroidal flux (+longitude-ward):
HMI b_720s magnetogram toroidal-flux vector component.
2.2 Heliographic Remaps
Once the HMI sky images have been prepared for ingest into SOLIS synoptic-map processing (§2.1), the next step is to map each image into a grid of longitude-sine(latitude) heliographic coordinates, as follows:
-
4.
Call hmi_serrmaps_remap_BatchRun.sh [-v] START STOP OUTDIR:
-
-
For each day from START to STOP:
-
Searches for available prepped sky images, SKYFILEs.
-
In IDL, calls hmi_serrmaps_remap, SKYFILE, OUTDIR, /tokeep, /sinlat:
-
Reads in the SKYFILE image frame(s).
-
Calls chcoord3.pro to define the heliographic coordinates of each image pixel, and for all four corners of each pixel.
-
IF(longitudinal): Projects the line-of-sight flux values into purely radial flux values (as per Equation 1).
-
Defines the Carrington-longitude bounds for the observation to set the bins for the heliographic output map.
-
Sorts all on-disk image pixels into weighted longitude-sine(latitude) bins. Pixels that cover multiple heliographic bins may be broken up into as many as 25 (5x5) sub-pixels for heliographic binning. (Note: This matches the spatial resolution of the SOLIS spatial-variance-map sub-pixel binning, where image pixels are broken up into 10x10 sub-pixels but derive from observations of half the spatial resolution as HMI.)
-
For each heliographic bin, computes:
-
the sum-of-weights (number of contributing pixels)
-
the mean magnetic flux
-
the RMS flux variance
-
the sum of squared weights
-
the mean of squared fluxes
-
Note: For vector magnetograms, the mean, RMS, and mean-squared fluxes are computed individually for all three vector components.
-
-
Outputs the resulting heliographic maps of computed quantities into a FITS file using the NSO-style file-naming convention and placed in a data keep in OUTDIR.
-
-
-
-
Pseudo-radial Heliographic Maps: An example of the frames output for a pseudo-radial heliographic map are shown in Figure 6.
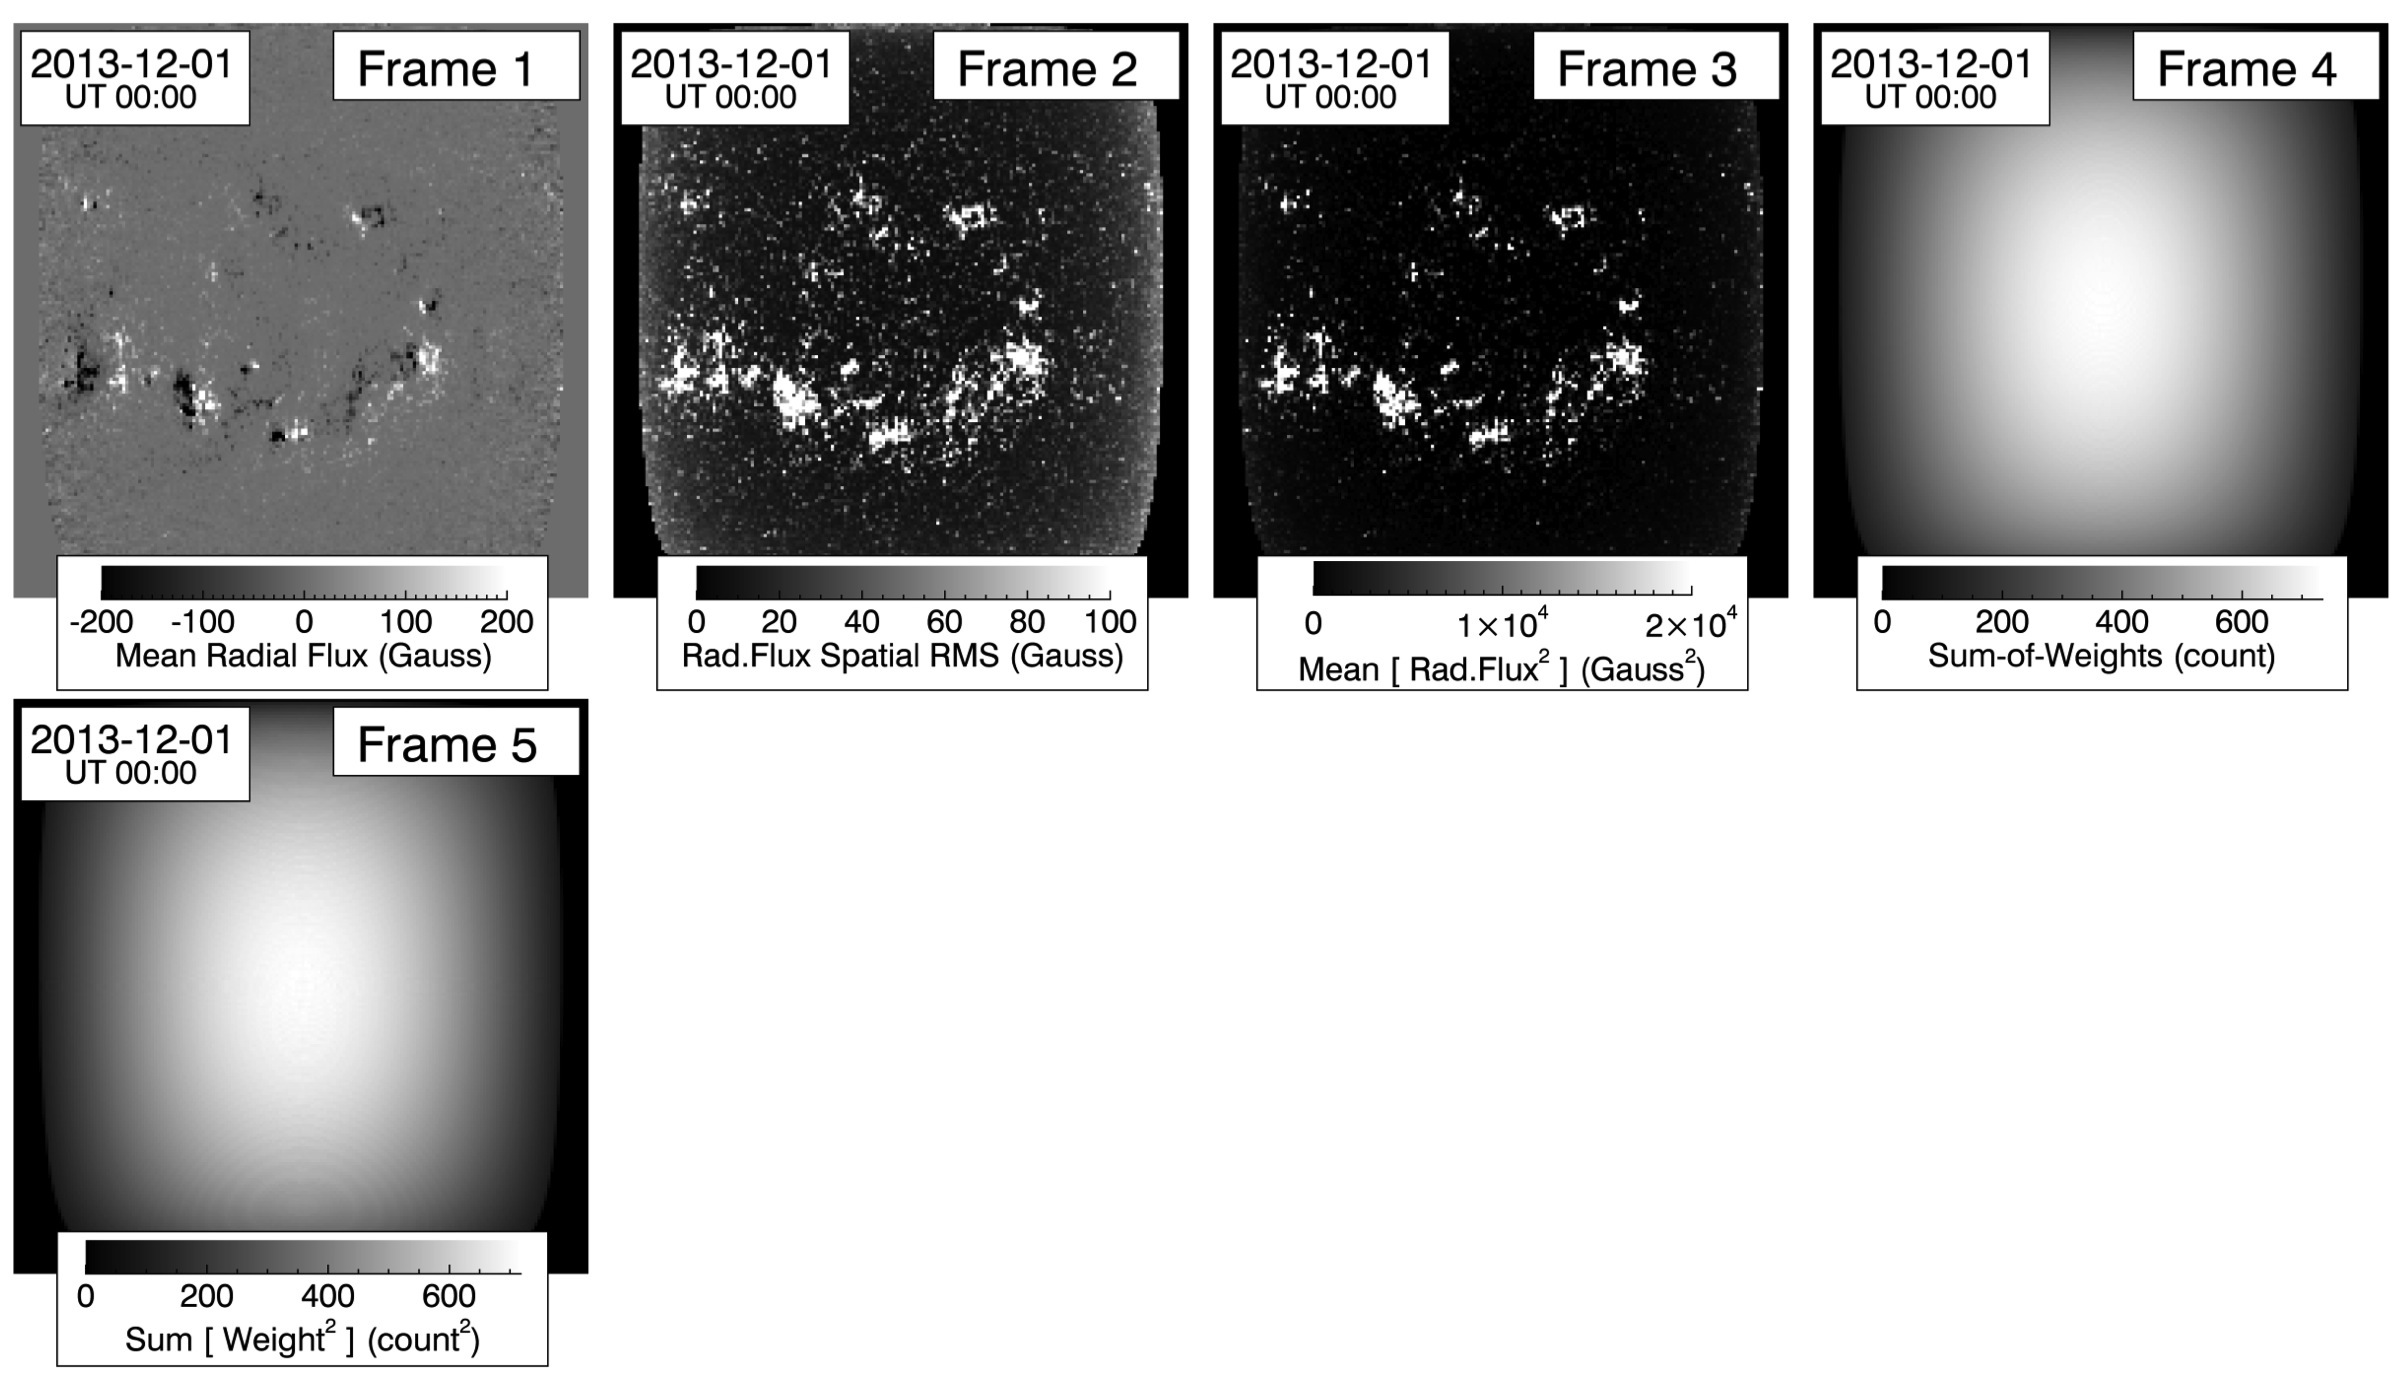
These FITS files have naming structures and frame contents as outlined below.
Filename Structure:
‘x9x73YYMMDDtHHMMSS_map-err_dim-180_source-SDO-HMI_type-m-720s.fits.gz’
-
‘x9x73’: This is the product code that denotes HMI heliographic remaps of photospheric longitudinal data.
-
‘YYMMDDtHHMMSS’: This is the observation’s time-stamp.
-
‘_type-m-720s’: Regardless of image type, this indicates HMI–line-of-sight–magnetogram source data.
FITS-frame Contents:
frame
units
title / description
1
Gauss
Weighted-mean Radial Flux Density:
Mean of radially-projected HMI-LOS magnetic flux at each heliographic bin.
2
Gauss
Spatial RMS Estimate:
Statistical variance of all radially-projected HMI-LOS-flux values at each heliographic bin.
3
Gauss2
Mean squared-Radial Flux:
Mean of squared pseudo-radial flux values at each heliographic bin.
4
counts
Sum-of-Weights:
Sum of weights (image-pixel fractions) into each heliographic bin.
5
counts2
Sum-of-squared-Weights:
Sum of squared-weights into each heliographic bin.
Vector Heliographic Maps: An example of the frames output for a vector heliographic map are shown in Figure 7.
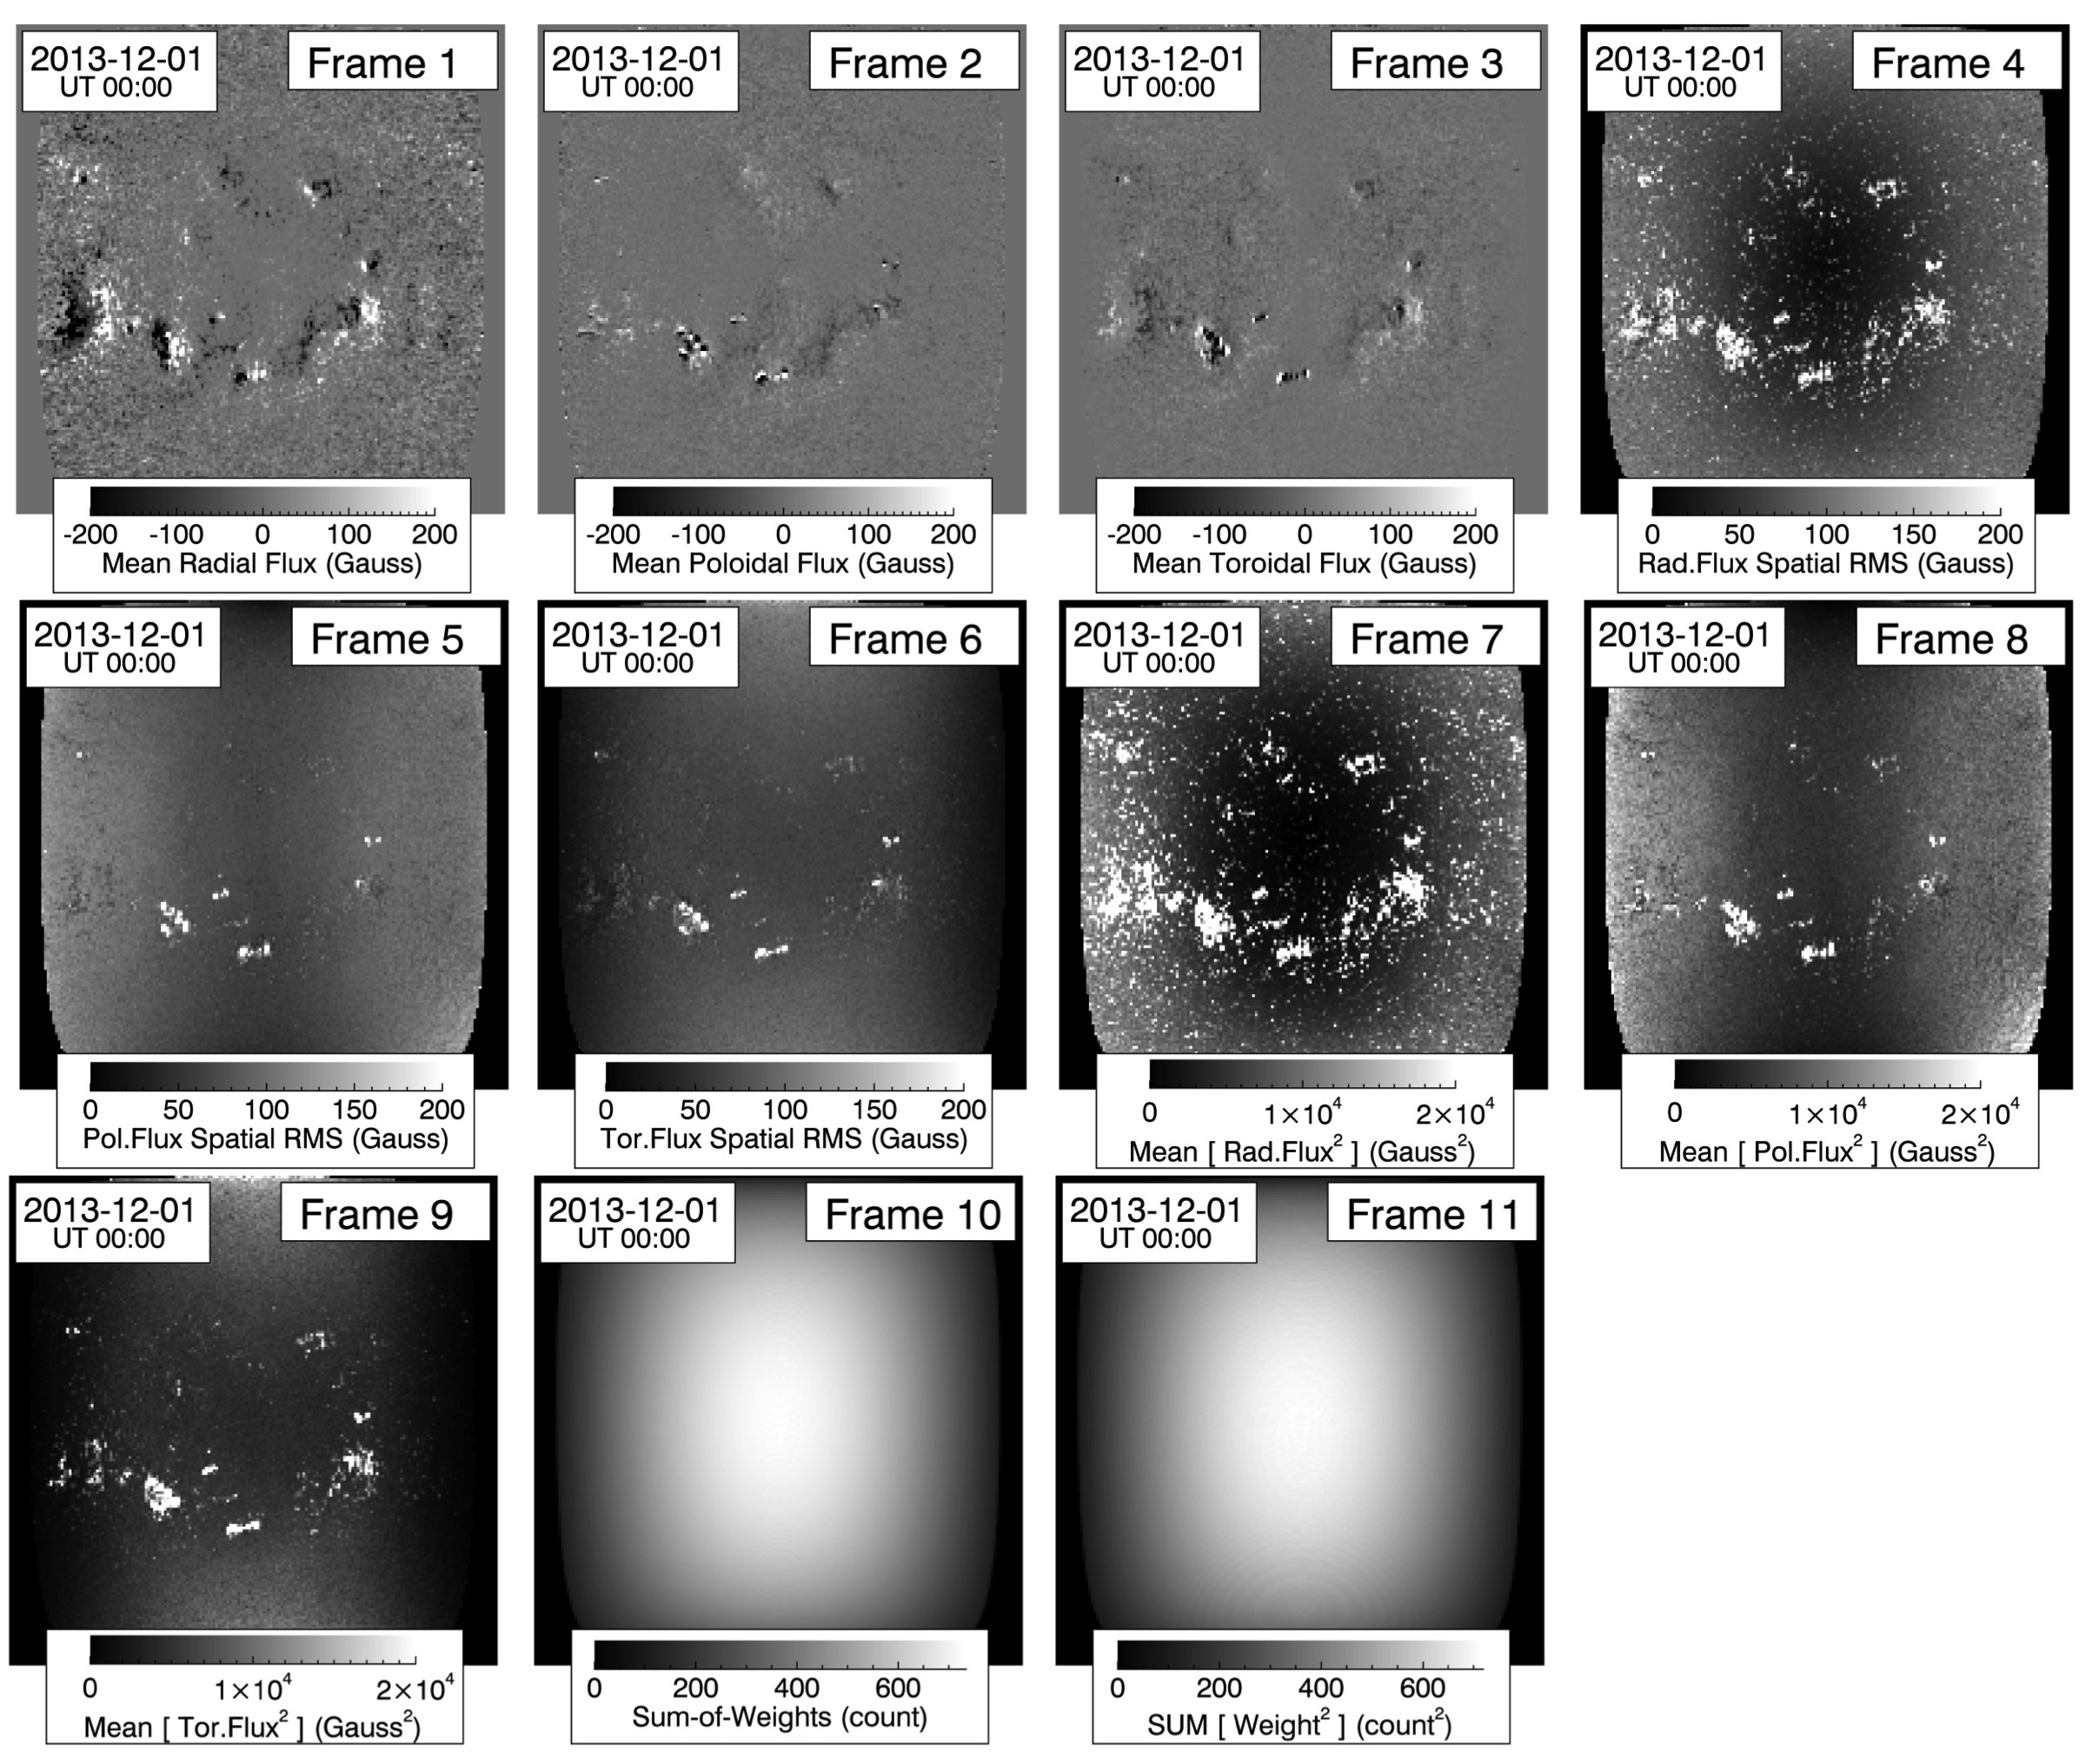
These FITS files have naming structures and frame contents as outlined below.
Filename Structure:
‘x9x93YYMMDDtHHMMSS_map-err_dim-180_source-SDO-HMI_type-b-720s-helio.fits.gz’
-
‘x9x93’: This is the product code that denotes HMI heliographic maps of photospheric vector magnetograms.
-
‘YYMMDDtHHMMSS’: This is the observation’s time-stamp.
-
‘_type-b-720s-helio’: Regardless of image type, this indicates HMI-vector-magnetogram source data mapped into heliocentric vector components.
FITS-frame Contents:
frame
units
title / description
1
Gauss
Mean Radial (outward) Flux Density:
Mean of HMI-vector radial flux at each heliographic-coordinate bin.
2
Gauss
Mean Poloidal (southward) Flux Density:
Mean of HMI-vector poloidal flux at each heliographic-coordinate bin.
3
Gauss
Mean Toroidal (+longitude-ward) Flux Density:
Mean of HMI-vector toroidal flux at each heliographic-coordinate bin.
4
Gauss
Radial-flux Spatial RMS Estimate:
Statistical variance of all HMI-vector radial-flux values into each heliographic-coordinate bin.
5
Gauss
Poloidal-flux Spatial RMS Estimate:
Statistical variance of all HMI-vector poloidal-flux values into each heliographic-coordinate bin.
6
Gauss
Toroidal-flux Spatial RMS Estimate:
Statistical variance of all HMI-vector toroidal-flux values into each heliographic-coordinate bin.
7
Gauss2
Mean squared-Radial Flux:
Mean of squared radial-flux values at each heliographic-coordinate bin.
8
Gauss2
Mean squared-Poloidal Flux:
Mean of squared poloidal-flux values at each heliographic-coordinate bin.
9
Gauss2
Mean squared-Toroidal Flux:
Mean of squared toroidal-flux values at each heliographic-coordinate bin.
10
counts
Sum-of-Weights:
Sum of weights (image-pixel fractions) into each heliographic-coordinate bin.
11
counts2
Sum-of-squared-Weights:
Sum of squared-weights into each heliographic-coordinate bin.
2.3 Compiling Synoptic Maps
Once all of the heliographic remaps have been processed (§2.2), they can be assembled into Integral synoptic maps covering the full 360∘ of Carrington longitude, as follows:
-
5.
Call hmi_serrmaps_synoptic_BatchRun.sh [-v] START STOP CARRFILE:
-
-
Uses CARRFILE to look up the date ranges of the Carrington rotations, CARRNUMs.
-
-
For each CARRNUM ocuring between START and STOP:
-
Calls the IDL routine hmi_serrmaps_synoptic.pro for the specified CARRNUM and data type (HMI-LOS or HMI-Vector):
-
Looks up the date range covered by CARRNUM and searches the data keep for a list of all available heliographic remaps falling within that date range +/- an additional 8 days.
-
Reads in the headers of the listed heliographic files in order to:
-
*
Define the range of longitude bins covered by each heliographic map.
-
*
Discard from the list any heliographic maps that fall entirely outside the 0-360∘ longitude of CARRNUM (e.g., usually discards the maps from observations taken 8 days before and after the Carrington-rotation date bounds).
-
*
Double-check various observation-quality keywords and discard any heliographic maps that fail.
-
*
-
For each heliographic-map file, HRFILE, retained from the file list:
-
*
Reads in the HRFILE image frames.
-
*
Rescales the values in the Weights frame by cosine4(longitude) with respect to the central meridian.
-
*
Places all in-bounds heliographic-map data into the synoptic-map image space. In this step, each heliographicly mapped quantity for this observation (weights, fluxes, etc.) is saved into its own synoptic-map of an nfiles stacked set.
-
*
-
Once all of the heliographic maps have been loaded into the synoptic-map space, computes:
-
the sum of weights in each synoptic-map bin
-
the mean weighted-flux values in each synoptic-map bin
-
the spatial variance of the flux values in each synoptic-map bin
-
Note a: For vector maps, the mean-flux and spatial-variance values are computed individually for all three vector components.
-
Note b: For any synoptic-map bin where the sum-of-weights equals 0, the mean-flux value(s) is set to 0, and the spatial-variance(s) is flagged with the nonsense value -1000.
-
-
IF(HMI-longitudinal): Calls hmi_serrmaps_polefiller_sfit.pro to return a pole-filled version of the radial-flux map.
-
Outputs the final synoptic maps of computed quantities into a FITS file using the NSO-style file-naming convention outlined in §1.
-
-
-
-
This is the final stage of processing, which produces the data-product files described in §1.
3 Notes on HMI Disambiguation
Creation of synoptic maps from HMI magnetograms required a few choices as to the handling of the HMI data, and primary among them was which quiet-sun disambiguation results should be employed to project the observed vector fields into heliographic coordinates.
The -disambig file included with all HMI-vector magnetograms in the b_720s series provides the HMI-disambiguation results as an image of true/false values answering whether the azimuth angle at a given pixel should be rotated by 180∘ relative to the value provided in the -azimuth file (Hoeksema, et al., 2014). For strong-field and near-strong-field pixels, the disambiguation is the result of “annealing” using a minimum-energy algorithm. For weak-field pixels, the -disambig file provides results from three different disambiguation algorithms:
-
1.
A Potential-acute algorithm that works to align the field with a potential field extrapolated from the vertical field component.
-
2.
A Random disambiguation assignation.
-
3.
A Radial-acute algorithm that selects the disambiguation that most closely aligns the field in the purely radial direction.
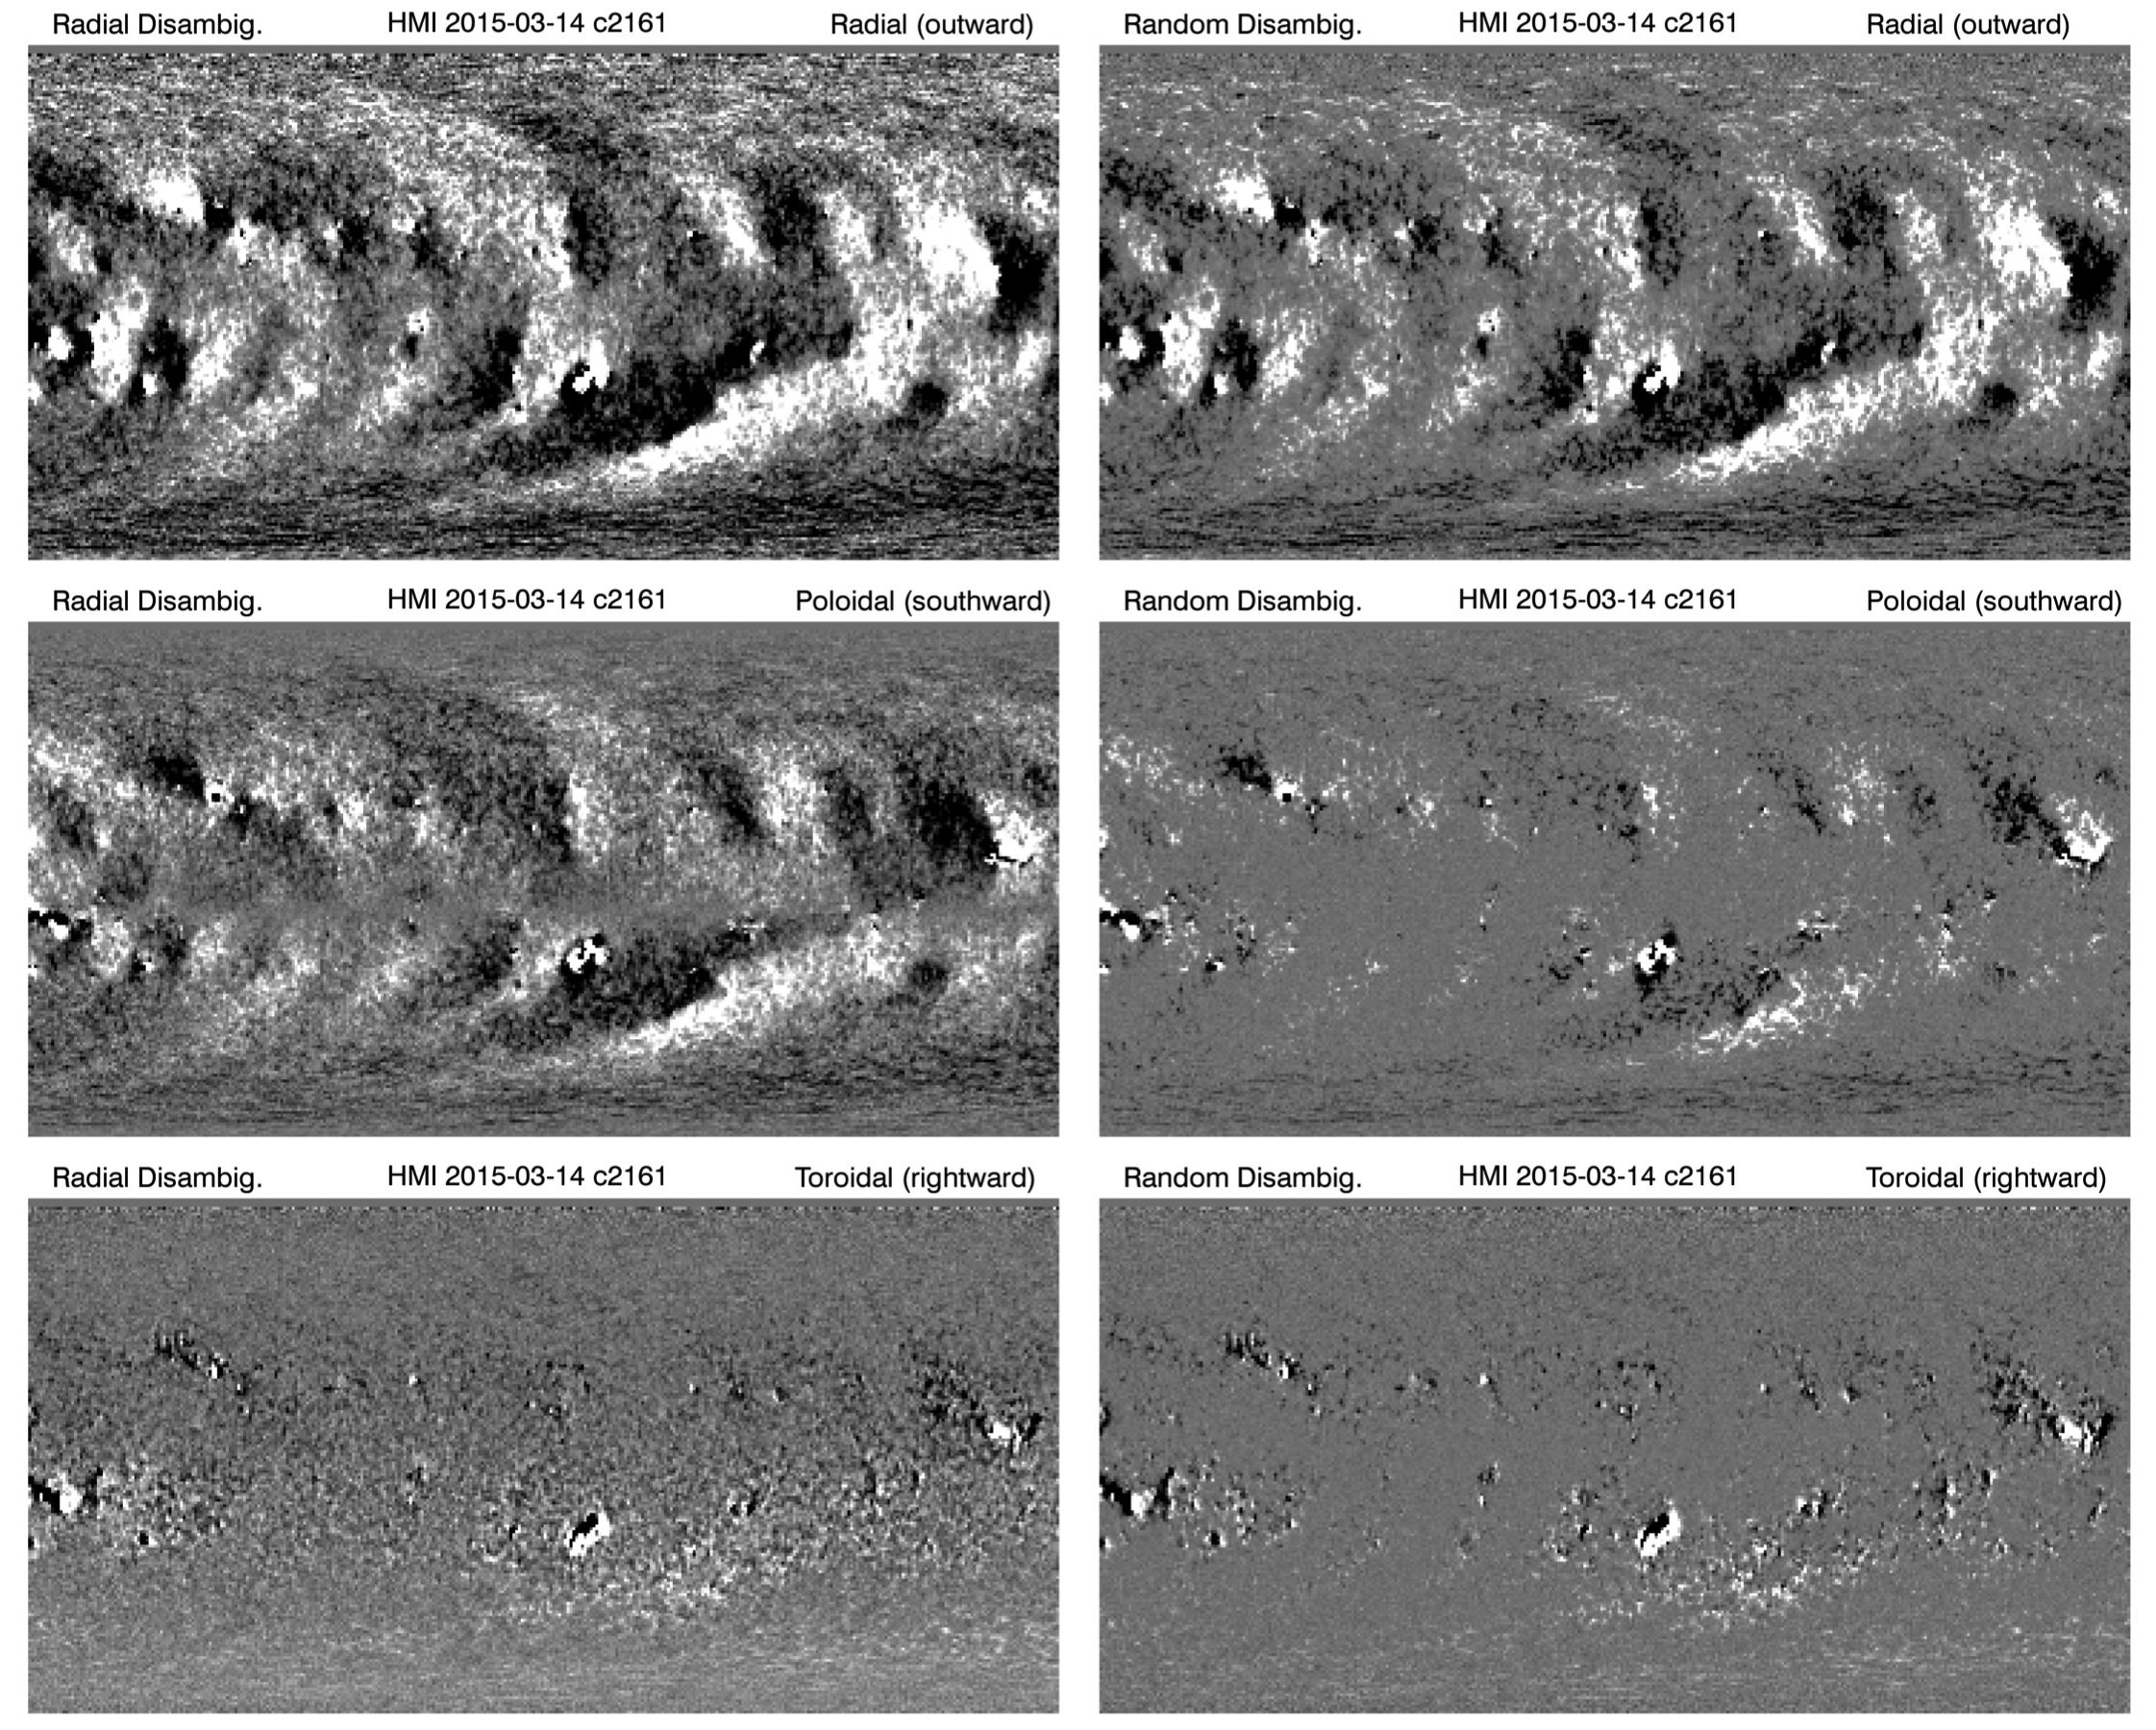
The HMI documentation (JSOC Wiki - Disambiguation, 2014) recommends using #2, where the weak-field disambiguation is randomly assigned. However, for these synoptic maps, we have chosen to employ the radial-acute disambiguation results, which produce clearer signatures of the synoptic magnetic field in the quiet sun, as can be seen in Figure 8.
Acknowledgements
The authors would like to thank Yang Liu for assistance with the appropriate use of HMI FITS-file header keywords. This work was partially supported by NASA grant NNX15AN43G.
References
- Bertello, et al. (2014) Bertello, L., Pevtsov, A. A., Petrie, G. J. D., and Keys, D. 2014. “Uncertainties in Solar Synoptic Magnetic Flux Maps”, Solar Physics, 289, 2419-2431.
- Hoeksema, et al. (2014) Hoeksema, J. T., +11 co-authors 2014. “The Helioseismic and Magnetic Imager (HMI) Vector Magnetic Field Pipeline: Overview and Performance”, Solar Physics, 289, 3483-3530.
- JSOC Wiki - Disambiguation (2014) “JSOC Wiki - Full-Disk Disambiguated Vector Magnetic Field from HMI.” http://jsoc.stanford. edu/jsocwiki/FullDiskDisamb. Joint Science Operations Center, May 2014, Web. 8 Apr. 2016.
- Leka, et al. (2009) Leka, K. D., Barnes, G., Crouch, A. D., Metcalf, T. R., Gary, G. A., Jing, J., and Liu, Y. 2009. “Resolving the 180∘ Ambiguity in Solar Vector Magnetic Field Data: Evaluating the Effects of Noise, Spatial Resolution, and Method Assumptions”, Solar Physics, 260, 83-108.
- Metcalf, et al. (2006) Metcalf, T. R., +14 co-authors 2006. “An overview of existing algorithms for resolving the 180∘ ambiguity in vector magnetic fields: Quantitative tests with synthetic data”, Solar Physics, 237, 267-296.
- Scherrer, et al. (2012) Scherrer, P. H., +12 co-authors 2012. “The Helioseismic and Magnetic Imager (HMI) Investigation for the Solar Dynamics Observatory (SDO)”, Solar Physics, 275, 207-227.
- Schou, et al. (2012) Schou, J., +20 co-authors 2012. “Design and Ground Calibration of the Helioseismic and Magnetic Imager (HMI) Instrument on the Solar Dynamics Observatory (SDO)”, Solar Physics, 275, 229-259.
- Sun, et al. (2011) Sun, X., Liu, Y., Hoeksema, J. T., Hayashi, K., Zhao, X. 2011. “A New Method for Polar Field Interpolation”, Solar Physics, 270, 9-22.