Continuum Observations of M 51 and M 83 at 1.1 mm with
AzTEC
Abstract
We observed the spiral galaxies M 51 and M 83 at 20 spatial resolution with the bolometer array AzTEC on the JCMT in the 1.1 mm continuum, recovering the extended emission out to galactocentric radii of more than 12 kpc in both galaxies. The 1.1 mm-continuum fluxes are and , with associated gas masses estimated at and for M 51 and M 83, respectively. In the interarm regions of both galaxies the (or X-factor) ratios exceed those in the arms by factors of -2. In the inner disks of both galaxies, the X-factor is about . In the outer parts, the CO-dark molecular gas becomes more important.
While the spiral density wave in M 51 appears to influence the interstellar medium and stars in a similar way, the bar potential in M 83 influences the interstellar medium and the stars differently. We confirm the result of Foyle et al. (2010) that the arms merely heighten the star formation rate and the gas surface density in the same proportion. Our maps reveal a threshold gas surface density for an SFR increase by two or more orders of magnitude. In both galaxy centers, the molecular gas depletion time is about 1 Gyr climbing to 10-20 Gyr at radii of 6-8 kpc. This is consistent with an inside-out depletion of the molecular gas in the disks of spiral galaxies.
keywords:
galaxies: ISM – galaxies: spiral – galaxies: individual: M 51, M 831 Introduction
Central to a complete picture of galaxy evolution is the distribution of the interstellar matter (ISM) within each galaxy and how that ISM forms stars. Given that the ISM mass on galactic scales is dominated by molecular and atomic gas, observing the tracers of these gas components is necessary for measuring the ISM distribution within the disks of spiral galaxies. Accordingly, observations of the HI 21-cm line and the CO 2.6-mm line are often used as tracers of the atomic and molecular gas, respectively (see, e.g., Walter et al., 2008; Regan, 2006; Regan et al., 2001; Nishiyama et al., 2001). While conversion of the velocity-integrated brightness temperature of the HI line, or , to atomic gas column density, , is usually straightforward (though not always, e.g., Planck Collaboration, 2011a), the conversion of I(CO) to molecular gas column density is not quite so certain (e.g., Papadopolis et al., 2012; Narayanan et al., 2011, 2012; Shetty, 2011, 2011a; Maloney & Black, 1988; Rickard & Blitz, 1985; Israel, 1988; Wall et al., 1993; Regan, 2000; Paglione et al., 2001; Sodroski et al., 1995; Dahmen et al., 1997, 1998; Wall, 2007), especially given that the CO line is known to be optically thick (e.g., see Evans, 1980; Kutner, 1984; Evans, 1999). Recent observations (Planck Collaboration, 2011a) suggest that the conversion factor, or X-factor, , is roughly constant within the disk of our Galaxy, with , to be abbreviated as ; this or a similar value of is often called the “standard” value. This uniform X-factor value for our Galaxy’s disk now applies to the disks of external galaxies, where is inferred and, on average, is radially non-varying from the inner disk to a galactocentric radius of (Sandstrom et al., 2013). The evidence for CO-dark gas, both theoretically and observationally, is a further complication (see, for example Planck Collaboration, 2011a; Clark et al., 2012; Langer et al., 2014; Saintonge et al., 2012; Smith et al., 2014; Roman-Duval et al., 2010). It is thus advantageous to employ tracers other than CO as independent checks on ISM surface density variations to test recent physical models of (e.g., Papadopolis et al., 2012; Narayanan et al., 2011, 2012; Shetty, 2011, 2011a)
Observed gas column and surface densities can then provide insights into large-scale star formation in galaxies. The Schmidt-Kennicutt (S-K) law, for example, states that star formation rate surface density, , is related to the gas surface density, , by with to (e.g., Schmidt, 1959; Kennicutt, 1989, 1998; Bigiel et al., 2008; Heiderman et al., 2010; Leroy et al., 2013). The index is appealing because the gas depletion time () is constant thoughout the spiral disks. While there is some evidence that on size scales of (e.g. Bigiel et al., 2008; Leroy et al., 2013; Calzetti et al., 2012), there is also evidence of non-linear and even non-universal slopes on such size scales (see, e.g. Santini et al., 2014; Pan et al., 2014; Shetty et al., 2013), especially on the scales of individual giant molecular clouds (GMCs) (Lombardi et al., 2014; Lada et al., 2013). There is also strong evidence for an inside-out formation of galaxies (e.g. González Delgado et al., 2014), which is at odds with a constant gas depletion time and, therefore, with having . Comparison between those results on the large (i.e., galactic) scales with those on GMC scales is problematic. Lada et al. (2013) suggest that the Schmidt law on the scales of GMCs are fundamentally different from the S-K law apparent on larger (i.e. galactic) scales; the latter are not the “result of an underlying physical law of star formation.”
Many of the abovementioned results used observations of the optically thick CO line and adopted a spatially constant . In contrast, millimetre (mm), submillimetre (submm), and far-infrared (far-IR) continuum observations sample optically thin continuum emission from the dust grains that pervade both the atomic and molecular gas. Recently, there have been many papers of the far-IR/submm continuum emission of external galaxies from the Planck and Herschel missions (e.g. Planck Collaboration, 2011; Foyle et al., 2012; Fritz et al., 2012; Foyle et al., 2013; Magnelli et al., 2012; Bourne et al., 2012; Rowlands et al., 2012; Boselli et al., 2012; Smith et al., 2012; Cortese et al., 2014, 2012; Boselli et al., 2010; Eales et al., 2010; Gordon et al., 2010; Roman-Duval et al., 2010; Kirkpatrick et al., 2014). These papers find, for example, that the dust and stellar masses of galaxies are correlated (Bourne et al., 2012; Cortese et al., 2012) and that spiral galaxies and dusty early type galaxies have to of dust (Rowlands et al., 2012).
A major stumbling block to determining accurate surface densities from dust continuum emission is the unknown mass absorption coefficient, , at millimetre wavelengths. Millimetre continuum emission is less temperature sensitive than that at submillimetre and far-IR wavelengths; this provides an important constraint on dust mass and sometimes the spectral emissivity index, , can be constrained as well. Observationally, the relevant quantity determined is the dust optical depth to gas column density ratio, . Planck Collaboration (2011a) and Planck Collaboration (2011b) have found that at 857 GHz (wavelength of 350) in the HI gas in the solar neighbourhood and at 250 (corresponding to at 857 GHz for ) in the HI gas in the Taurus molecular complex. Given that applies to the dust in our Galaxy (see, e.g., Planck Collaboration, 2011a) and that the dust to hydrogen gas mass is about 0.01, those observed correspond to to 0.5 in the dust associated with HI. The dust associated with H2, however, has double that in HI (Planck Collaboration, 2011b). Consequently, estimating and from comparing the observed dust continuum emission against the HI gas emission alone, while useful, must be viewed with caution. The various estimates of suggest that determining the exact total mass of dust within a galaxy is uncertain by a factor of a few.
In spite of the uncertain dust mass absorption coefficient, dust continuum emission can provide estimates of in our Galaxy as well as in external galaxies (see, e.g., Sandstrom et al., 2013; Roman-Duval et al., 2010; Eales et al., 2010; Reach et al., 1998; Planck Collaboration, 2011a; Israel, 1997, 1997a). Such observations have shown that while can be more or less spatially constant in some cases, like in the disk of our Galaxy and other external galaxies (see Sandstrom et al., 2013; Planck Collaboration, 2011a), there can be regions of “dark” gas, H2 with no CO emission, both in our Galaxy and other galaxies (e.g., see Planck Collaboration, 2011a; Baes et al., 2014; Clark et al., 2012; Langer et al., 2014; Pineda et al., 2014; Roman-Duval et al., 2010; Saintonge et al., 2012; Smith et al., 2014). Therefore, observations of dust continuum emission provide a vital check on results inferred from CO observations.
1.1 The Current Work
Even with the many recent advances mentioned above, there are many questions left unanswered. For example, do the inferred X-factor values (i.e. Planck Collaboration, 2011a; Sandstrom et al., 2013) apply to the outer disks of all galaxies? Also, are there systematic differences of the X-factor between arm and inter-arm regions? Can previous methods of observationally inferring the dust mass absorption coefficient at millimetre wavelengths be refined? How do the answers to those questions influence the specific form of the observed S-K law in a given galaxy?
To address these questions and to better understand the gas and dust in spiral galaxies and their relationship to star formation, we observed the grand-design, face-on spiral galaxies M 51 and M 83 with the bolometer-array camera, AzTEC (Aztronomical Thermal Emission Camera), mounted on the 15-m JCMT in Hawaii at a wavelength of 1.1 mm. Both of these galaxies are nearby with distances of less than 10 Mpc (see Table 1 for details) and, hence, the spiral arms in both galaxies are resolved across the arms in the JCMT/AzTEC observations, which have a spatial resolution of 20′′. Both galaxies have been studied extensively at numerous wavelengths (e.g., Rots et al., 1990; Helfer et al., 2003; Kennicutt et al., 2003; Dale et al., 2009; Tilanus & Allen, 1993; Crosthwaite et al., 2002; Blasco-Herrera et al., 2010; Meidt et al., 2013; Hughes et al., 2013; Schinnerer et al., 2013; Colombo et al., 2014).
Recent HERSCHEL observations of M 51 and M 83 at 70, 160, 250, 350, and 500 have provided maps of the dust temperature, surface density, and even spectral emissivity index, (Bendo et al., 2012; Foyle et al., 2012, 2013; Cooper et al., 2012), but with spatial coverage that is slightly more limited than those of the AzTEC 1.1 mm continuum maps presented here; the AzTEC images cover a few more kiloparsecs at the adopted distances given in Table 1. As a result, these AzTEC 1.1 mm continuum images extend both the spatial and the wavelength coverage of the dust emission in both M 51 and M 83.
This greater spatial coverage placed restrictions on the other wavelengths available for comparison with the AzTEC 1.1 mm data; there were no 250, 350, and 500 data towards the outer disks of M 51 and M 83. There are, however, Spitzer 160 data covering both of these galaxies. This wavelength is the longest of the Spitzer data and, along with the AzTEC 1.1 mm data, is the one most likely associated with the dust component(s) that dominate the mass of the dust.
In addition, the surface densities in the current work were estimated from the observational data. Specifically, at was inferred by comparison with the HI column densities and removing upper outliers, because these upper outliers were assumed to represent positions with CO-dark gas. This approach has the advantage that final gas masses inferred were not dependent on dust models.
2 Observations
Both M 51 and M 83 were observed during the nights of 2005 December 6-12 and 2006 January 12-20 on the James Clerk Maxwell Telescope (JCMT) with AzTEC (Aztronomical Thermal Emission Camera), which is a bolometer array for observing continuum emission at 1.1 mm (Wilson et al., 2008). AzTEC has 144 silicon nitride micromesh detectors arranged hexagonally in six “hextants”. The AzTEC foot-print on the sky while mounted on the JCMT was 280′′ wide, where each detector had an 17-18′′ almost circular beam. During the observations, 107 of the 144 AzTEC detectors were fully functional, the faulty detectors found mostly in Hextants 1 and 2 (see Figure 11 of Wilson et al., 2008). The images of M 51 and M 83 were created by raster scanning, so the missing detectors did not affect the coverage of the final images, only their sensitivities.
The fields for both galaxies were originally chosen to be centred on each and were in size. This field size is large enough to accommodate each galaxy with a diameter, and one-half AzTEC foot-print on each side. The actual observations, however, covered nearly for each galaxy. This allows the AzTEC routines to properly remove the large-angular-scale atmospheric emission from the M 51 and M 83 images. Both M 51 and M 83 were raster scanned for many cycles; the total integration time was about 12 hours for M 51 and about 14.5 hours for M 83. Given the long-term stability of the detectors, chopping was not necessary. During the observations, the zenith optical depth at 225 GHz was between about 0.05 and 0.15. The source elevations during the observations were between about 30 and 60 for M 51 and between about 30 and 45 for M 83. These imply that the maximum line-of-sight optical depth at 225 GHz was typically much less than 0.3.
Interleaved between groups of raster scans of the program galaxies were observations of additional sources to focus the AzTEC camera, to check the pointing, and to calibrate the data. Focusing was achieved through repeated jiggle-maps of a few chosen point-like sources to minimize the beam’s angular size and maximize its peak. Focusing was done each night usually on the planet Uranus, but also on the late-type stars CRL618 and IRC10216. Pointing was checked and corrected by small jiggle-maps of QSOs 1308326 and 1334127. The pointing maps were performed before and after many raster scans of the program galaxies, or about every 1 to 1.5 hours. The pointing uncertainty was 2′′ or better. Beam maps of Uranus were made to determine the flux conversion factor which converts the detector output voltages to (see Wilson et al., 2008, for details).
Spectral lines do not contribute appreciably to the AzTEC 1.1-mm bandpass. The strongest line in this bandpass is CO . This is at the edge of the bandpass for the 1.1-mm filter (see Figure 4 of Wilson et al., 2008) and line peak would be attenuated by a factor of due to the low response of the filter at this frequency. In addition, the AzTEC bandwidth at 1.1 mm is about 70 GHz, resulting in a spectral dilution of the line of a factor of . The two effects together dilute the line strength by a factor of . Publicly available CO maps (e.g., Helfer et al., 2003; Crosthwaite et al., 2002) along with adopting a reasonable ratio for the to lines (i.e. 0.7) and applying the peak attenuation, the spectral dilution, and the observed 1.1-mm fluxes of M 51 and M 83 (see Section 4.1) yield a relative contribution of 5-6 by the CO line to the total observed 1.1-mm flux. Including the effects of other spectral lines, even those with peak attenuations closer to unity, are unlikely to add a total flux contribution of more than a few percent to the AzTEC 1.1-mm band.
3 Data Reduction
The emission observed by the telescope in the 1.1 mm continuum is dominated by that of the atmosphere. In fact, such atmospheric emission is roughly a factor of 1- stronger than that from astronomical sources. Hence, considerable data processing is necessary for extracting the faint astronomical signal from the time-series data that will be converted into an astronomical image. This processing assumes that the spatial extent of the atmospheric emission is greater than that of the astronomical sources; this makes it possible, though still difficult, to reconstruct extended structures in the image. Recovering the extended astronomical emission requires an iterative procedure whereby the image from the first iteration is subtracted from the time-series data and these image-subtracted time-series data are used to construct the next iteration image, which is again subtracted from the time-series data and so on, until a suitable convergence is achieved. The algorithm described here is very similar to that for the M 33 observations by Komugi et al. (2011), but with more emphasis on recovering the large-scale structure.
The data reduction starts with the full pipeline routine that removes spikes and calibrates the data, and applies principal component analysis (PCA) to filter out extended emission that largely represents the earth’s atmosphere. Included with the software pipeline output were noise maps that were created by the jack-knifing technique as described in Komugi et al. (2011). Iterations or loops of the algorithm, Flux Recovery Using Iterative Technique or FRUIT, are then applied to the preliminary map in order to recover the missing extended emission. The FRUITloops subtract a preliminary map from the time-series data and a new map is created from those data. The different iteration maps are examined to find the latest iteration that is free of artefacts, such as large patches of negative emission. This is usually the final iteration of FRUITloops. If no iteration map is acceptable, then the parameter values used in the full pipeline and FRUITloops are changed and those routines are run again.
Estimating reasonable parameter values for a reliable reconstruction of the image required creating simulated images. The map from the final iteration of FRUITloops was subtracted from the time-stream data and an input test map was then added into that time-stream. The test map for M 51 was the 24 map of M 51 from Dale et al. (2009) and for M 83 it was the 5 GHz map of M 83 from Neininger et al. (1993). These test maps were placed on the same pixel grid as the corresponding AzTEC maps and were convolved to the 18′′ resolution of those maps. After being added into the time-stream data (now more or less devoid of the AzTEC detected astronomical flux), the data are processed through the full pipeline and then FRUITloops. For each iteration of FRUITloops the difference between the output map and the input map is used to determine a reduced chi-square, . If the new simulation output map is acceptable, then the data processing is re-run on the real data with the new parameter values that were used in the latest simulation. The new real-data map is removed from the time-stream data and the simulations are run again. If, however, there are image artefacts in the simulated maps or the is too large, then the parameter values used in the full pipeline and in FRUITloops are changed and the simulation is re-run. This process continues, going from simulations to real-data processing and back again, until the real and simulated output maps are free of artefacts and the from the simulations is around 1-2.
The final AzTEC maps were converted to units of and smoothed to a final resolution of 20′′ so that the final maps were less choppy. The conversion factor to units of is 8.63 for the original 18′′ beam.
With the help of the simulations, the optimum, or near-optimum, parameter values were determined in the processing of the M 51 and M 83 data sets. The simulations showed a minimum and for M 51 and M 83, respectively. The final map of noise levels, the sigma map, of M 51 was scaled upward by to account for the that was greater than unity. The large-scale emission was faithfully recovered with some minor problems for both galaxies. By differencing the final output map with the initial input map of the simulation, and scaling from simulation output map to real output map, the large-scale surface brightness of the real map was checked.
The simulations tell us that the AzTEC M 51 map underestimates the true surface brightness at an average of 0.3, or the noise level for much of the map. This has a trivial effect locally, but has a non-trivial effect on the large scale. Accordingly, the offset determined here was not added to the final M 51 map, but the simulation input and output maps were still used to check any results derived from the M 51 AzTEC map.
The case of M 83, however, was quite different. Averaged over the entire central 12.2 radius, the true surface brightness is 0.05or 0.25 lower than that of the map. This correction is small enough that using the simulation to correct the results derived for M 83 was unnecessary.
The input and output maps of simulations for M 83 were also compared visually and no strong artefacts were found.
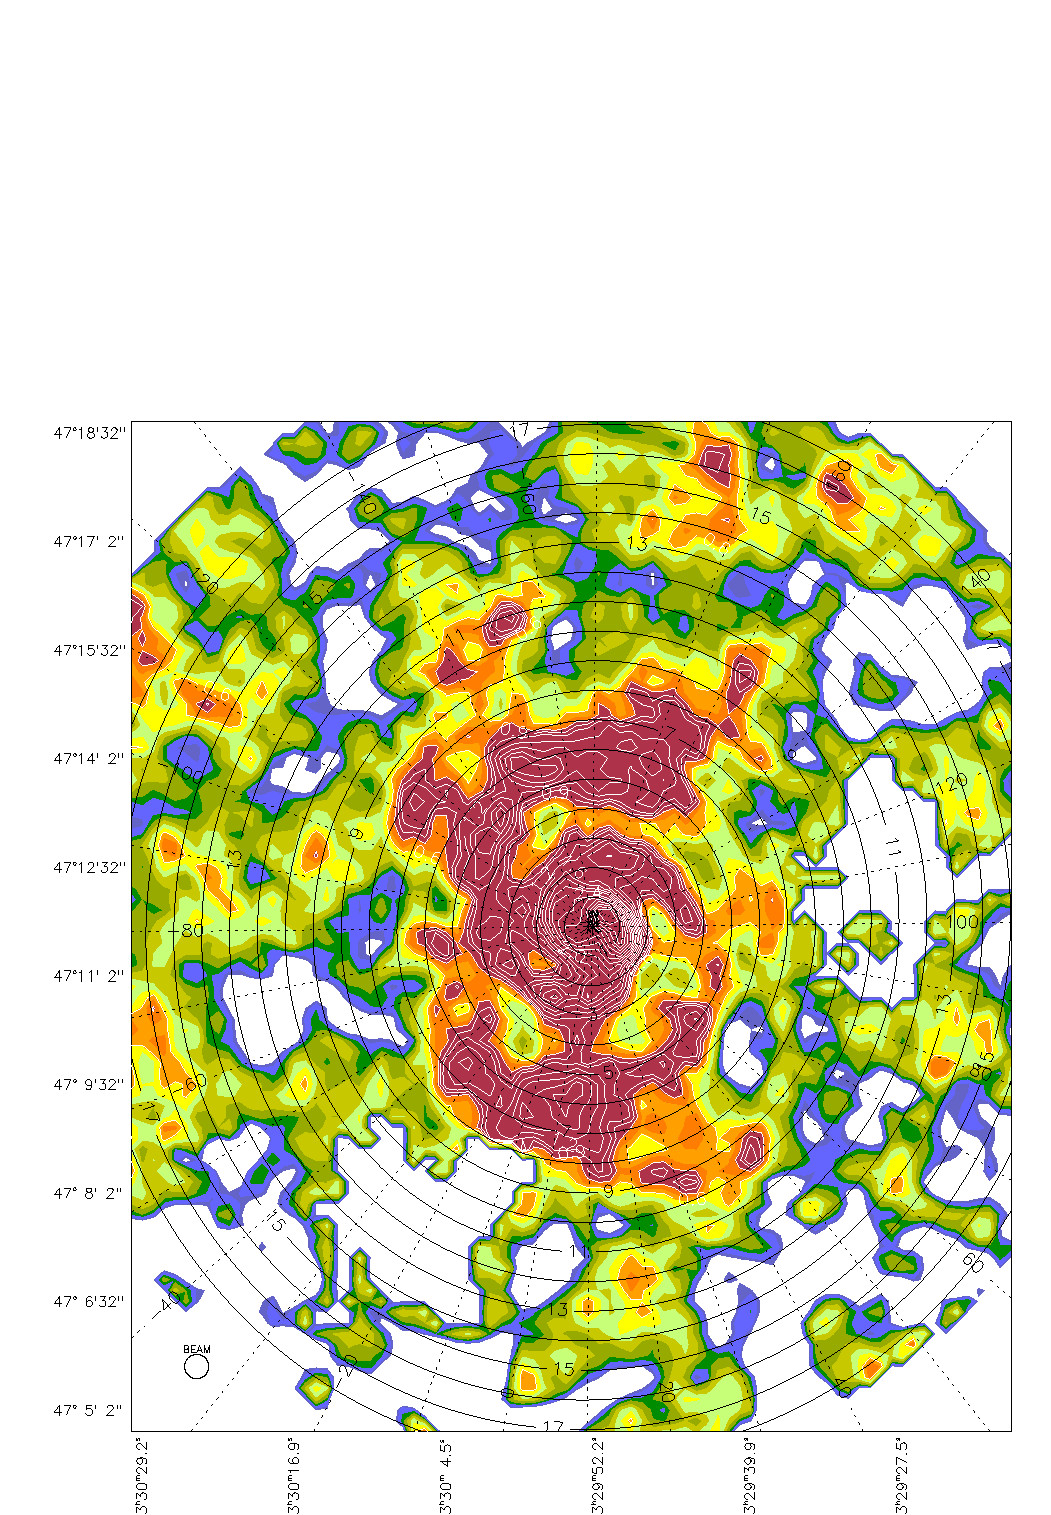
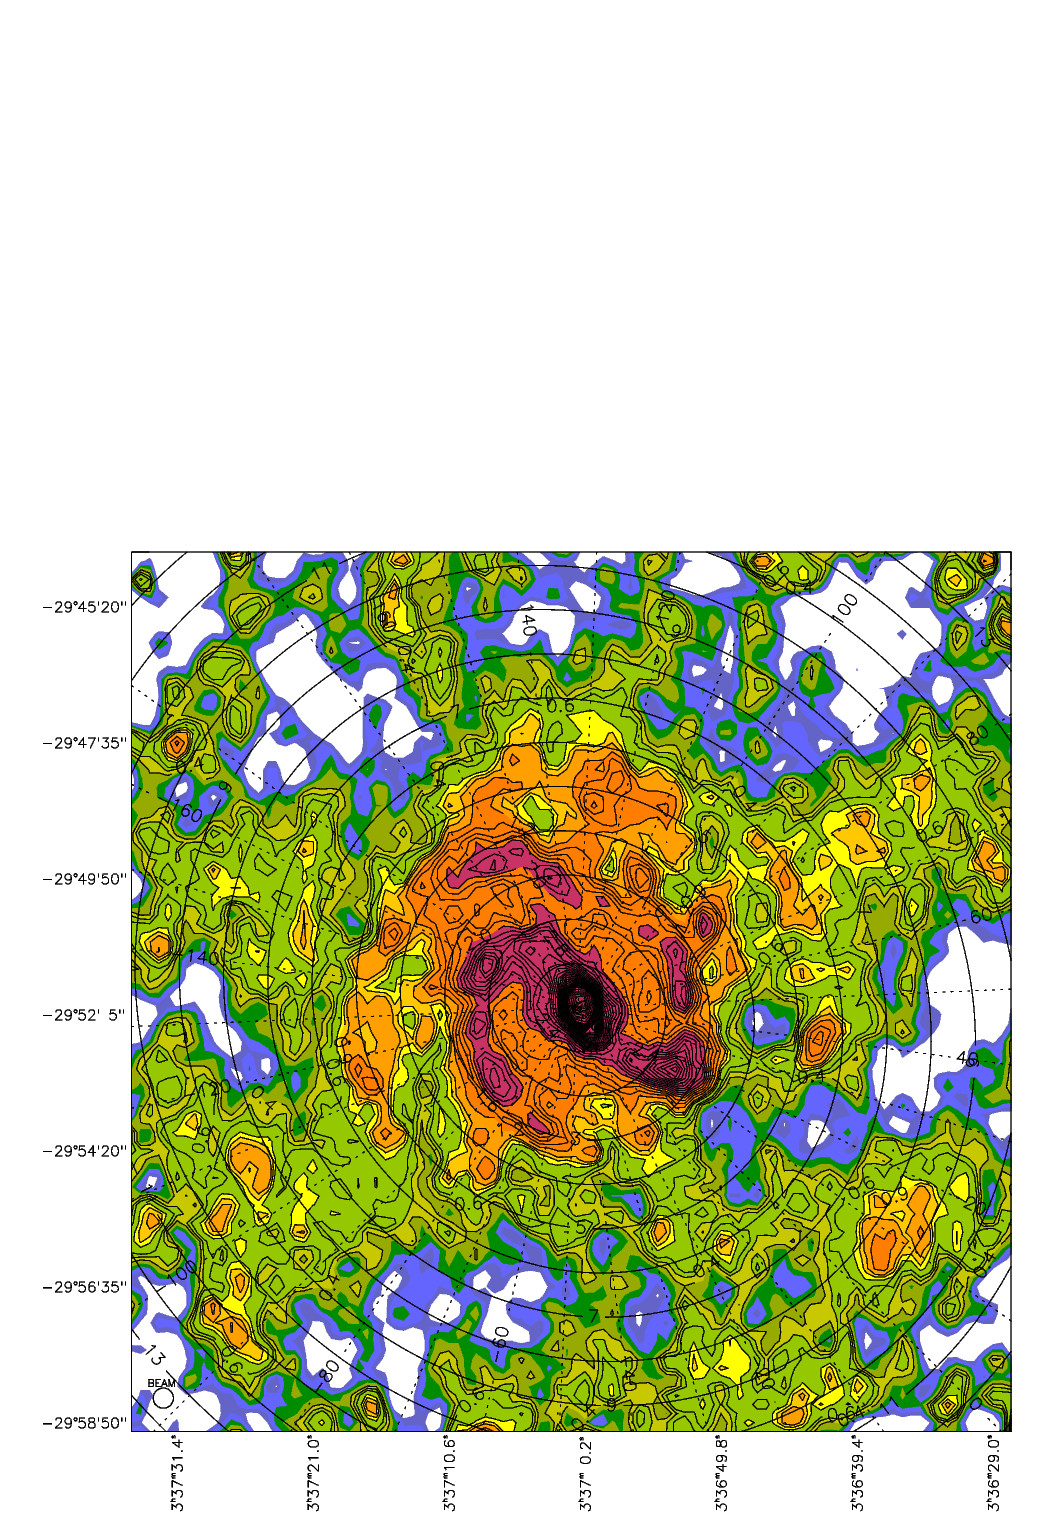
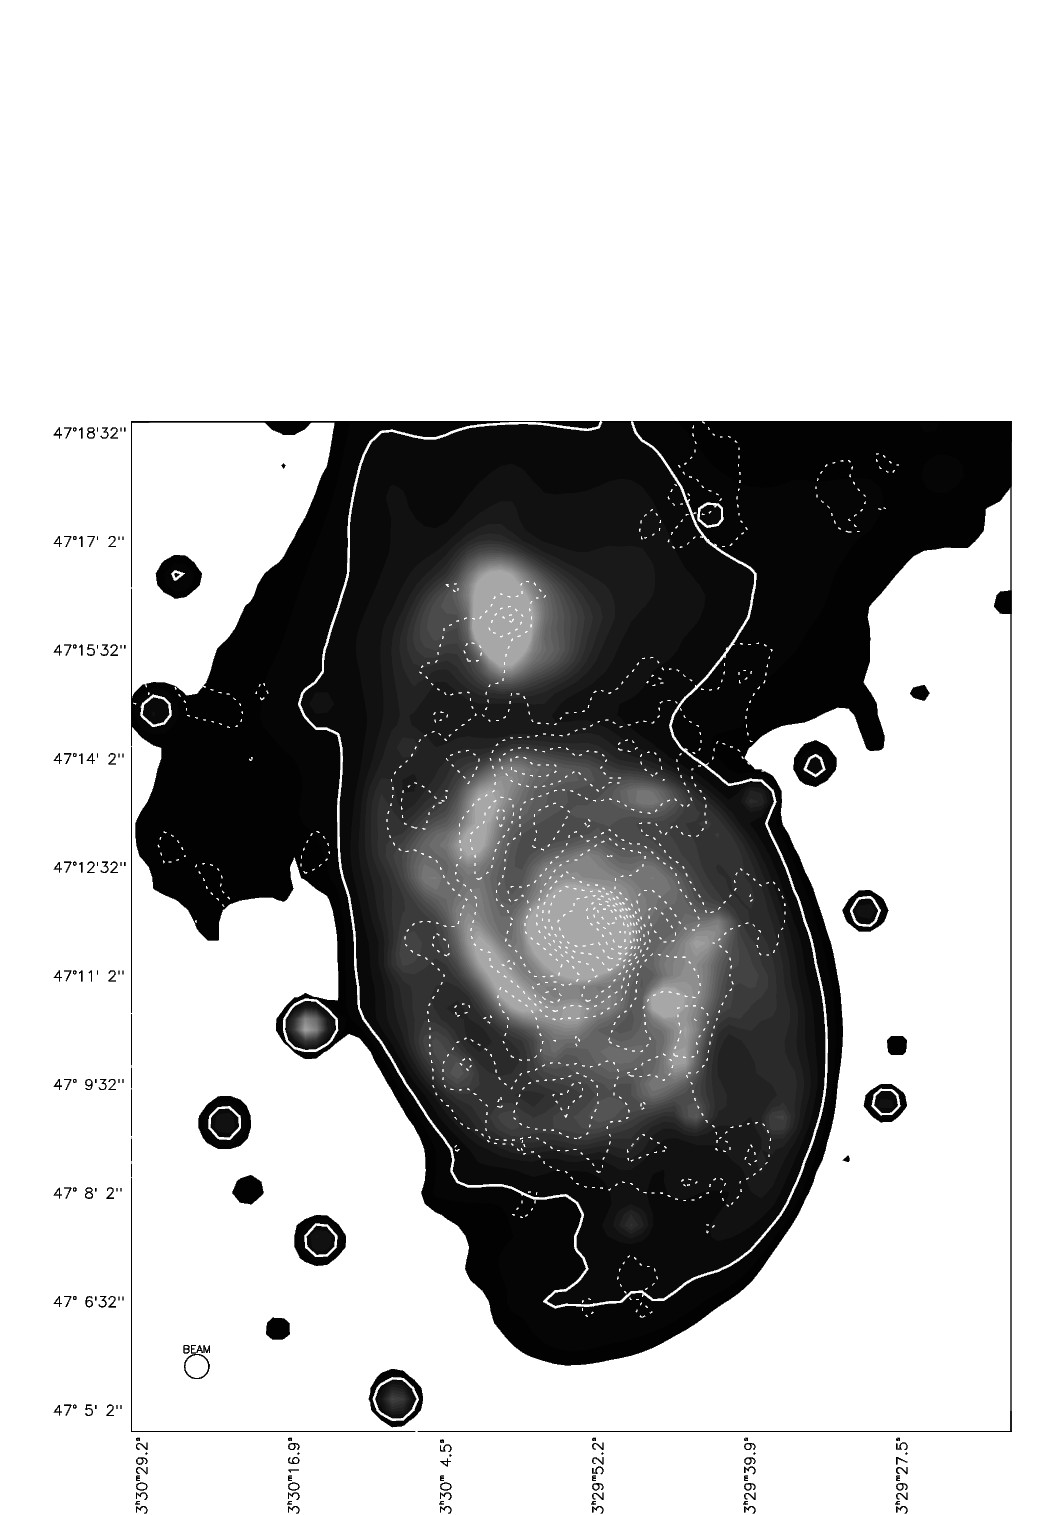
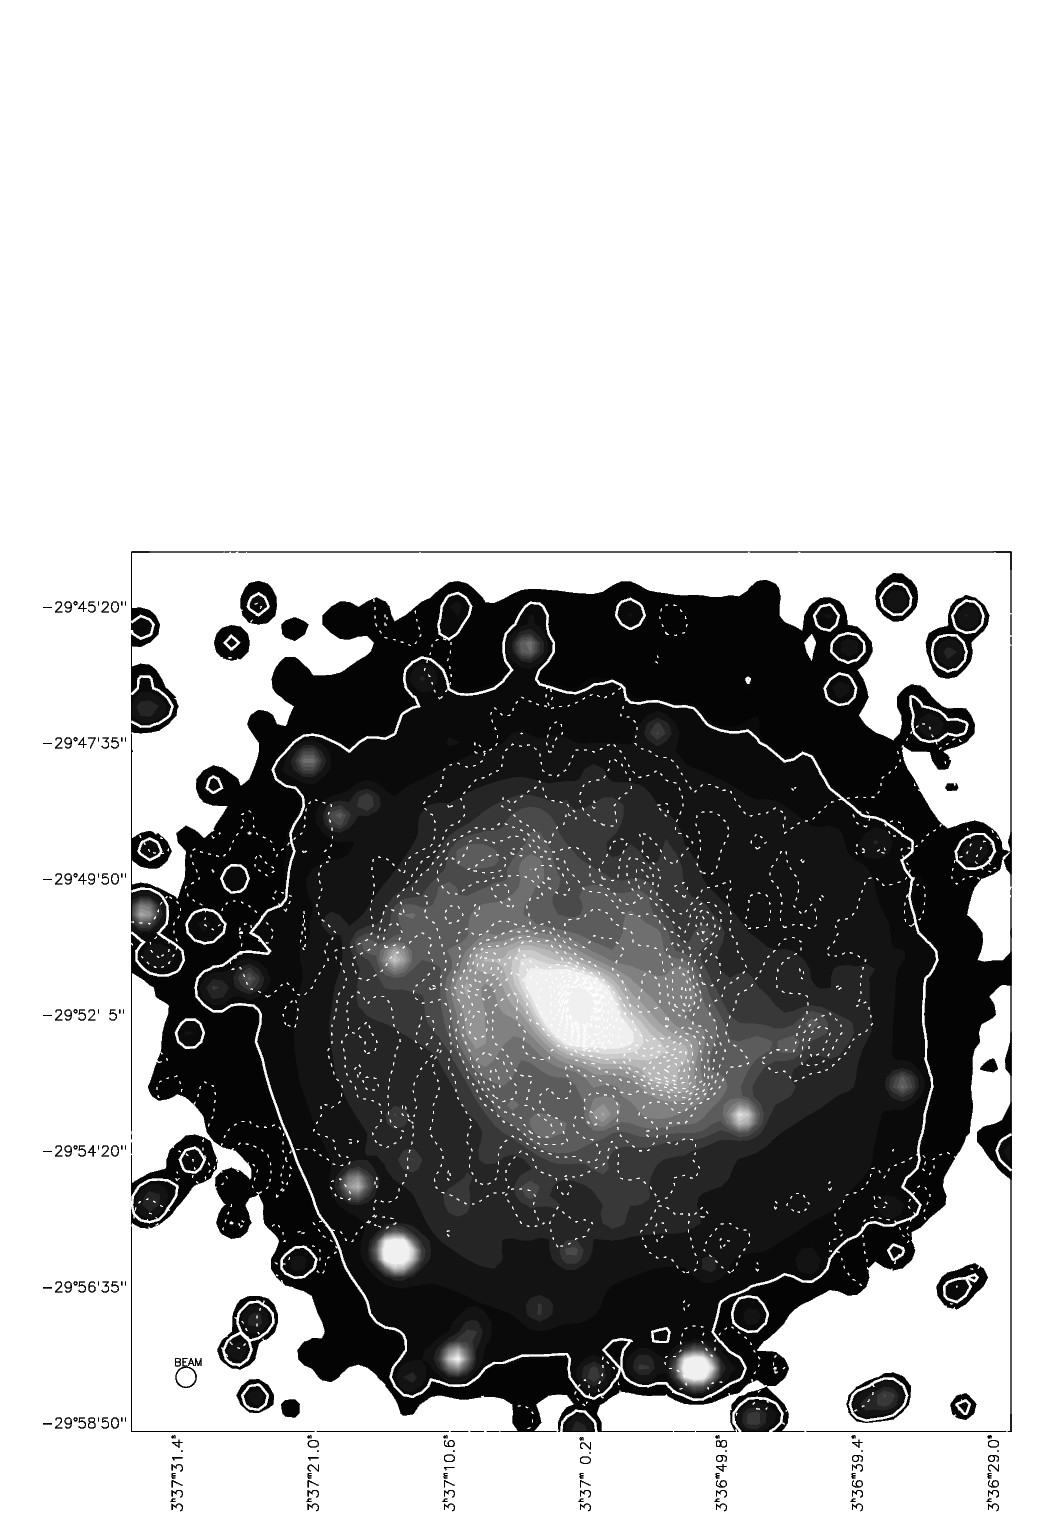
The final maps are shown in Figures 1 and 2. Comparisons with images at visible wavelengths are given in Figures 3 and 4.
4 Results
4.1 Surface Brightness Distribution and Flux
As is clearly seen in both Figures 1 and 2, both galaxies have extended low-level emission in addition to two prominent spiral arms. In the M 83 image, the structure visible within a 1 kpc radius of the centre represents M 83’s bar. The total derived fluxes are for M 51 and for M 83. (See Appendix A for more details.) For the adopted distances, the luminosity at 1.1 mm is or for M 51. For M 83, these are or .
On the large-scale, each galaxy possesses an exponential disk, as is seen in Figures 5 and 6, where the non-trivial deviations from the exponential fit represent the overlying spiral structure. The exponential scale-lengths are given in Table 2 are given for different tracers of galactic structure, including that from the current work. For M 83, the CO , near-IR, and 1.1-mm continuum have scale-lengths that are comparable to within 1- or 2-. For M 51, however, the 1.1 mm exponential disk is more than 5- larger than both the stellar disk (as represented by the near-IR) and the disk of CO emission. Even excluding the correction factor derived from the simulations would reduce this difference by very little. Meijerink et al. (2005) estimated a scale-length for the dust from 850 observations that is consistent with 1.1-mm observations.
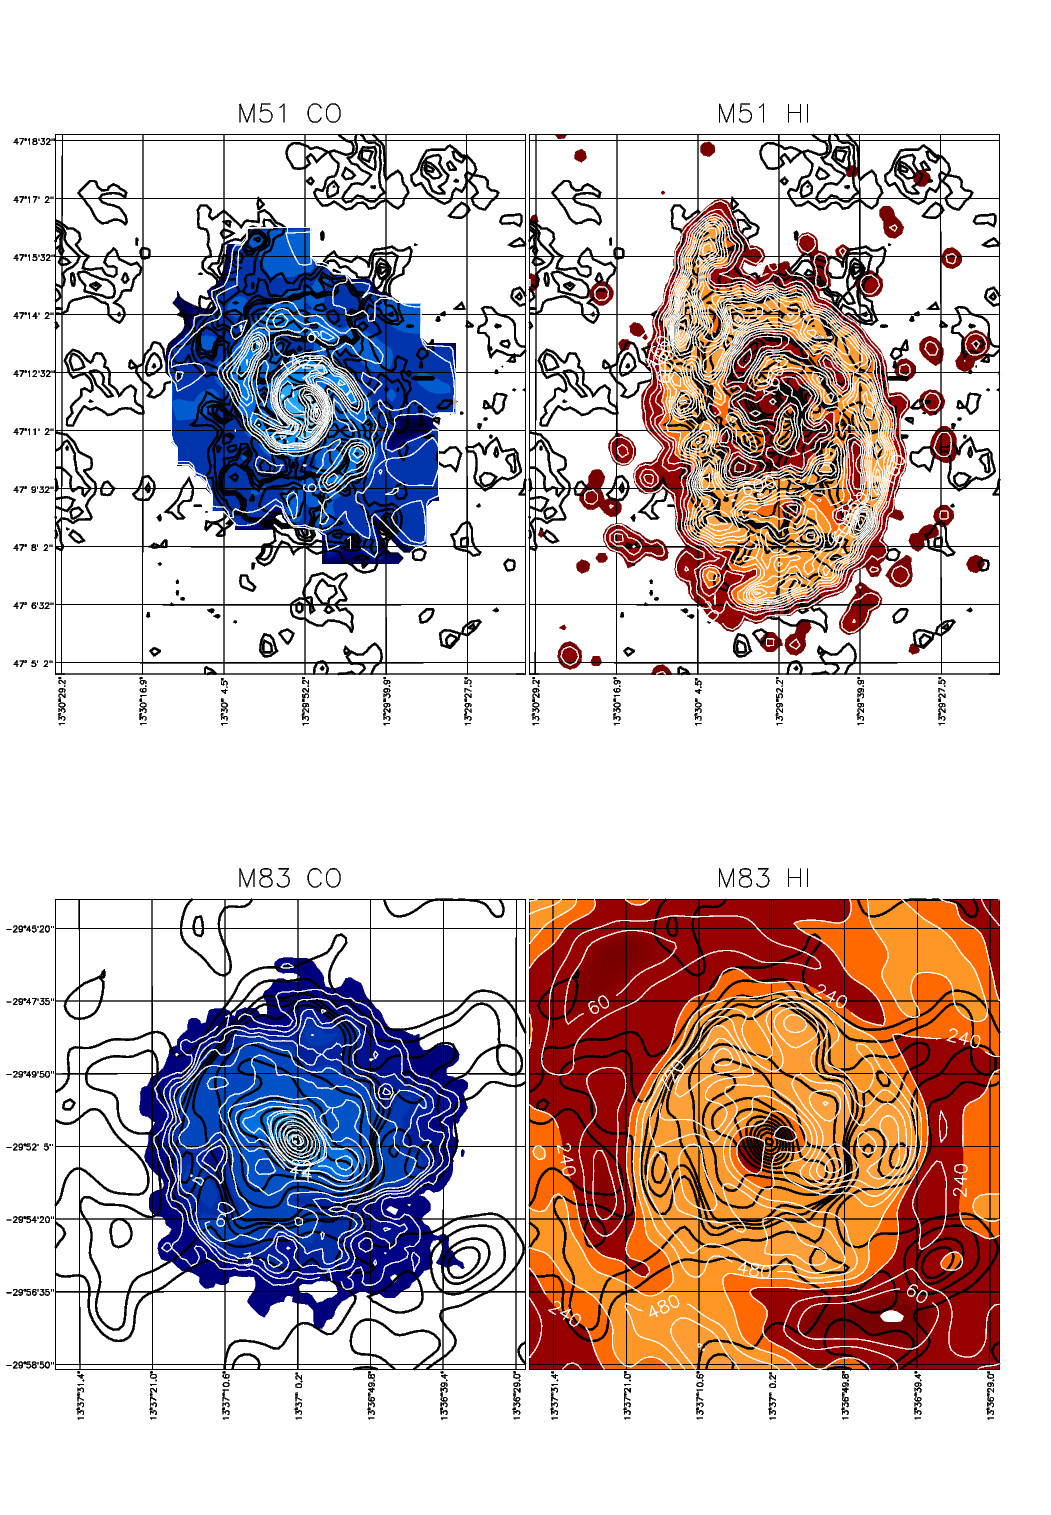
The 1.1 mm maps of M 51 and M 83 are very similar to their corresponding CO and HI 21-cm maps, as we can see in Figure 7. For example, the CO maps of both galaxies are similar to that of the 1.1 mm continuum out to a radius of about 6 kpc. Beyond that radius, the millimetre-continuum emission extends further than the CO emission, especially in the northern arm of M 51. That more extended emission is partly due to dust associated with atomic gas. In M 83, there is a bridge of millimetre-continuum emission extending out to 9′ or about 12 kpc from the nucleus to both the southeast and to the northwest. This bridge is also seen in HI, but is shifted counterclockwise in position-angle by about 15 with respect to the millimetre-continuum bridge, where this shift is likely an artefact of the missing large-scale HI emission in the interferometer map.


4.2 Surface Density Distribution and Mass
The 1.1 mm continuum surface-brightness maps of Figures 1 and 2 can be converted to maps of surface density, or column density, if the dust temperature is known at each position. Hence, the AzTEC 1.1 mm maps were ratioed with the Spitzer/MIPs 160, effectively 155.9, maps to yield these temperatures. The derived column densities were calibrated against the HI gas column densities at those positions where molecular appears to not dominate. This approach was modified by removing upper outliers resulting in the intermediate- case adopted for the current paper. (See Appendix B for details.)
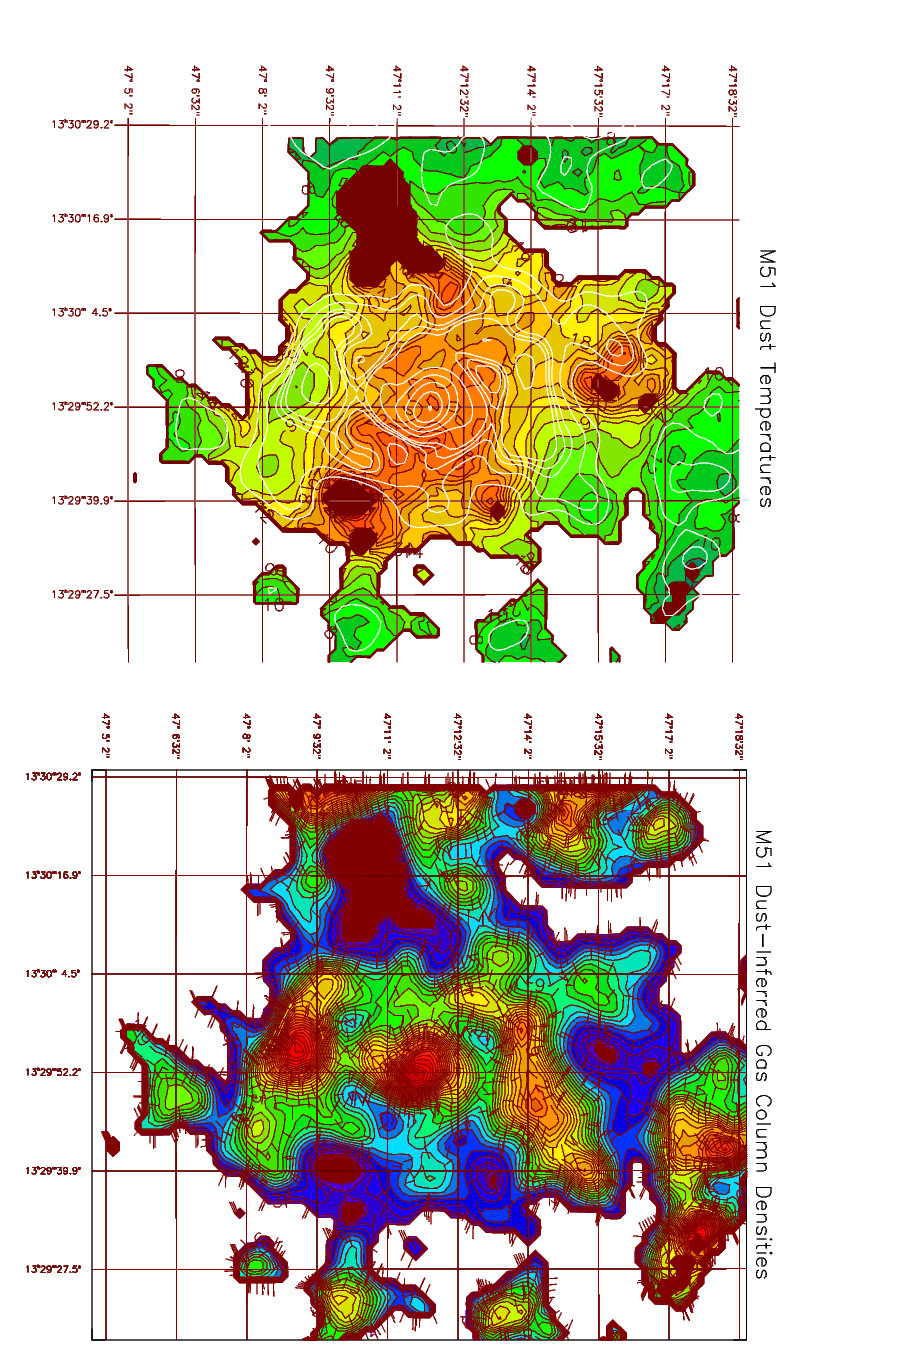
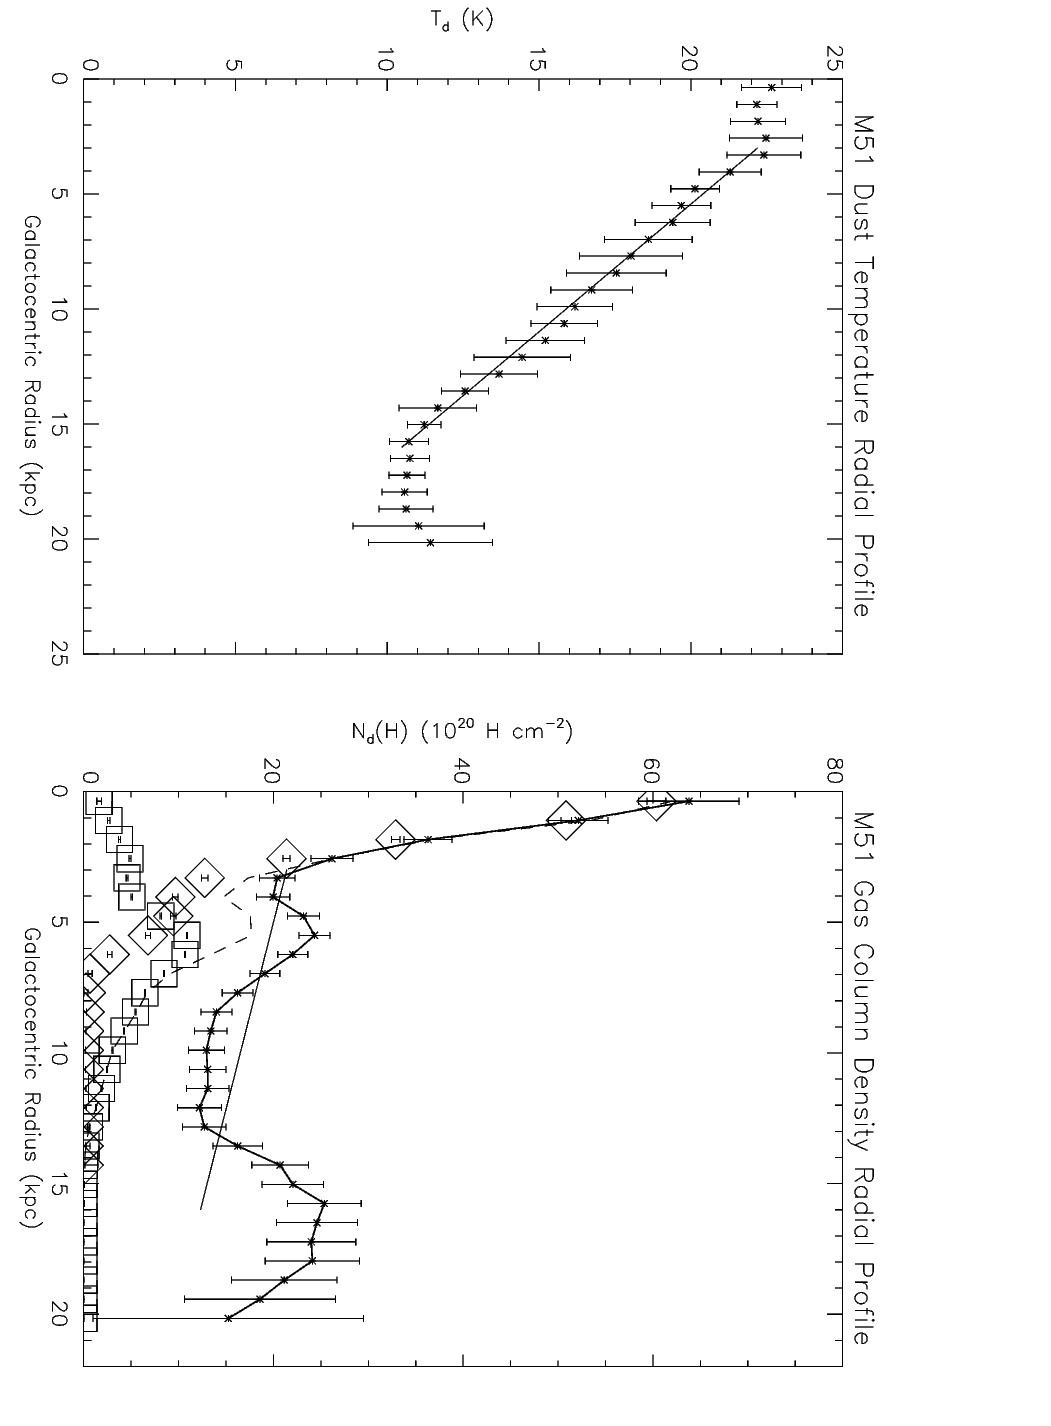
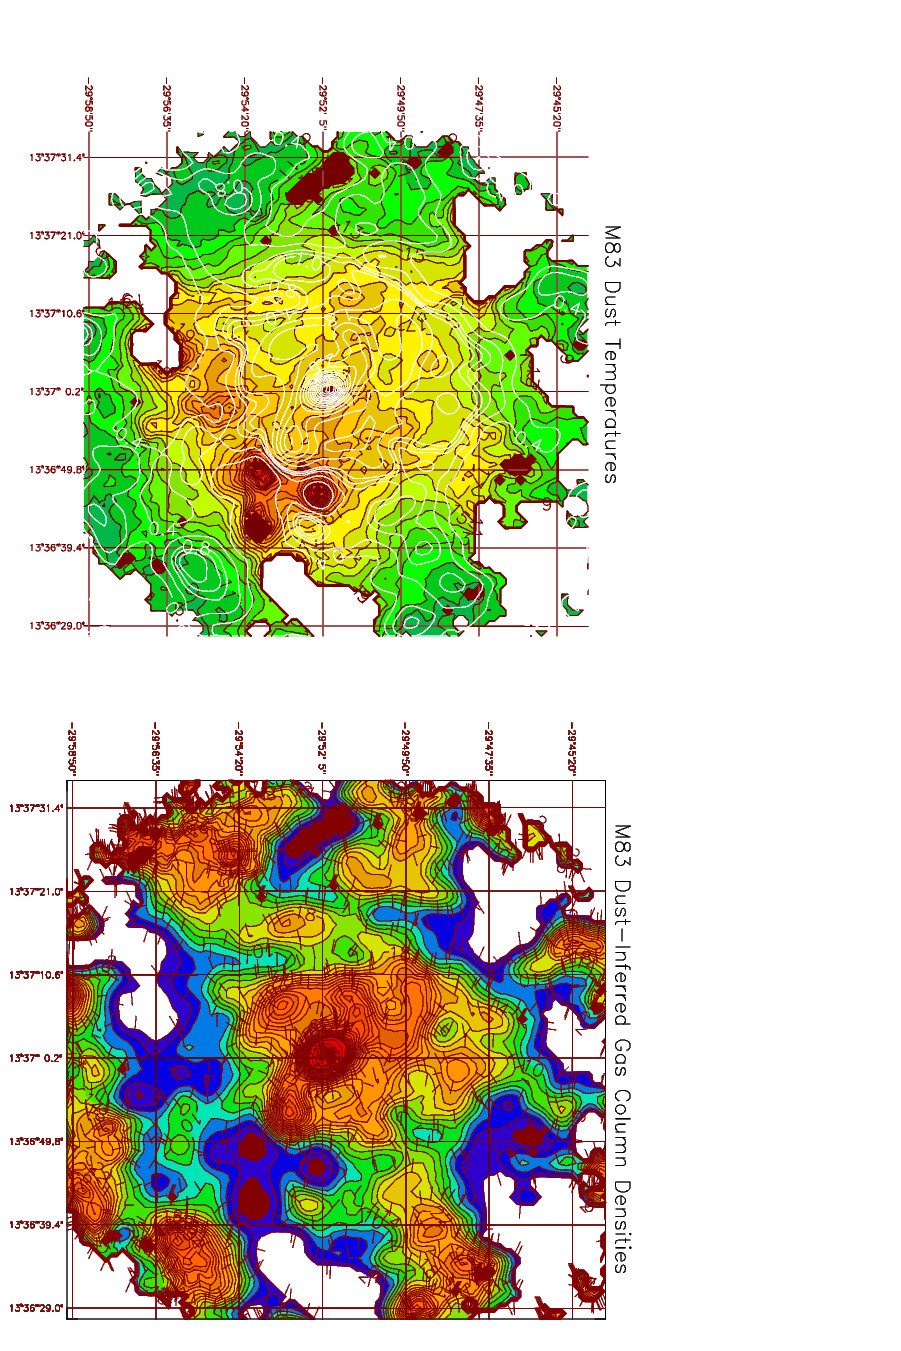
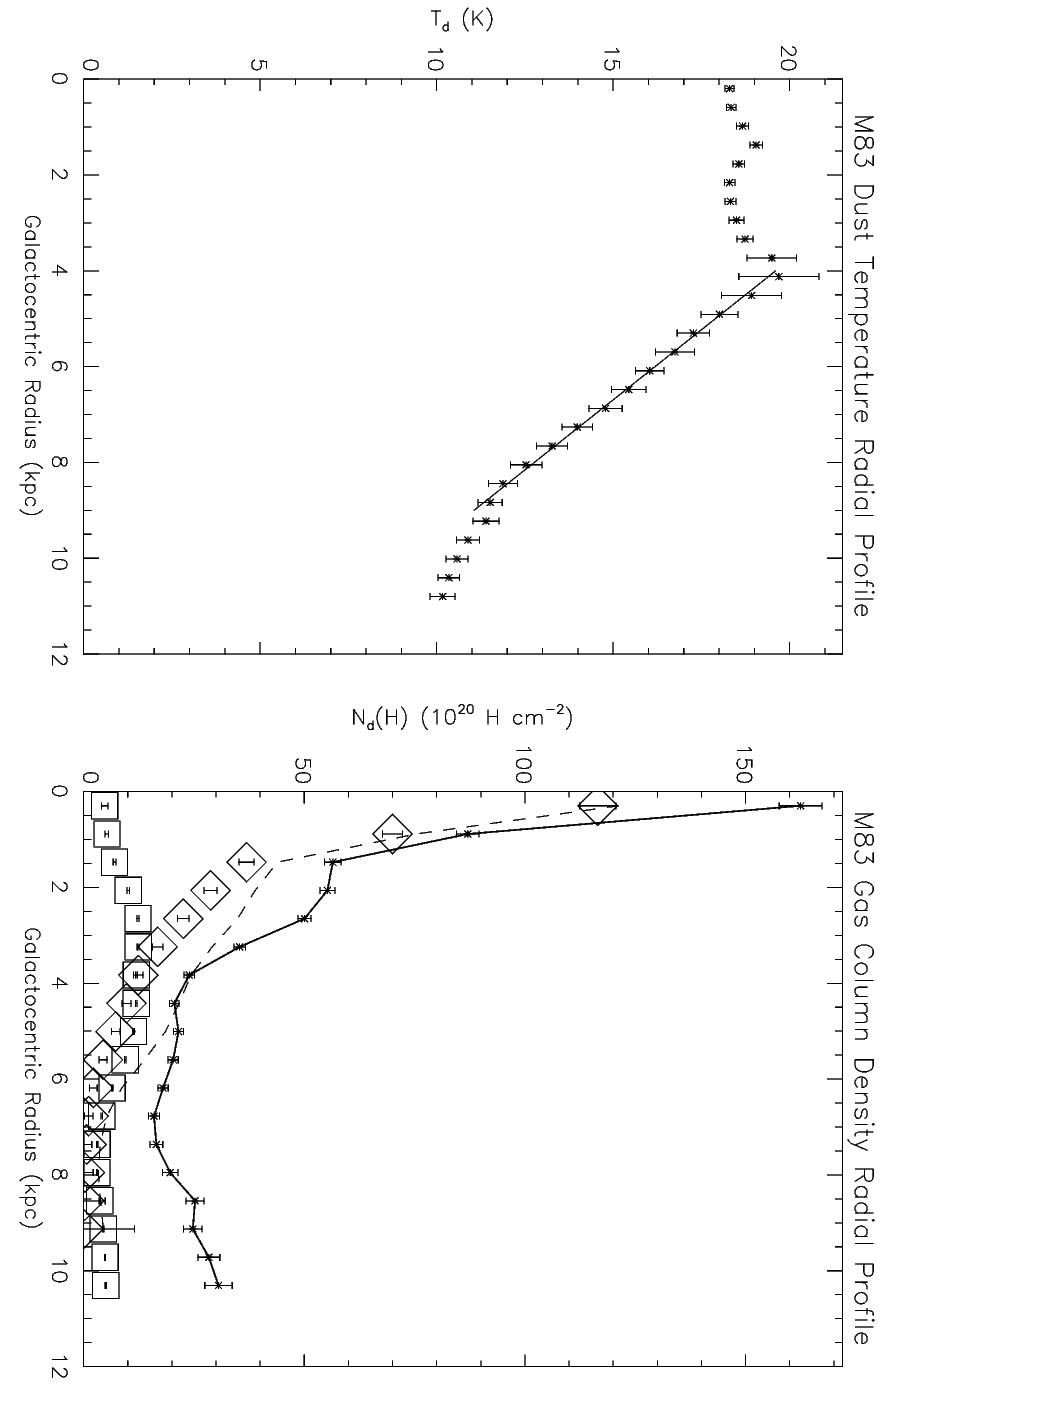
Figures 8 to 11 display the derived dust temperature maps, the column density maps, and their radial profiles for both M 51 and M 83. Both the radial profile of M 51 in Figure 9 and that of M 83 in Figure 11 have relatively constant temperatures of -K out to a radius of 3-4 kpc, a linear decline out to 15 kpc for M 51 and 9 kpc for M 83, and then a more or less constant temperature of in the outer disk.
Foyle et al. (2012) had data at five wavelengths and could produce maps of both dust temperature and . The apparently lower dust temperature in the spiral arms compared to that of the interarm dust is merely an artefact of not accounting for the spatial variation of . In general, the dust temperatures determined from the 1.1 mm data are K lower than those determined from the shorter wavelengths of the HERSCHEL data. This suggests that the millimetre continuum is sampling an additional component of the dust. The dust mass derived in the current work, using their dust-to-gas mass ratio and dust mass absorption coefficient (equivalent to our low- case) is a factor of 2.5 higher than their over the equivalent area. This is roughly consistent with the lower values that we derive. Also, based on the AzTEC/SPITZER data alone, the area covered by the Foyle et al. (2012) map is sampling half the dust and gas mass of M 83.
A similar comparison between the HERSCHEL M 51 observations (Cooper et al., 2012) and those of AzTEC yield nearly identical masses ( difference) for the Cooper et al. (2012) NGC 5194 field, after adjusting to their adopted distance, to the low- case, and to their gas-to-dust mass ratio. Repeating this for their NGC 5195 field, however, yields a disagreement of a factor of 4. This can be at least partly attributed to the differences between their observed dust temperatures and ours. They find , whereas we find . These temperatures roughly correspond to the AzTEC/SPITZER data yielding a dust mass that is a factor of 4 higher. As was the case for M 83, the longer wavelength AzTEC observations appear to be sampling an additional component. Interestingly, this does not seem to be the case for the NGC 5194 field, where agreement is very tight. Also, based on the AzTEC/SPITZER data alone, the area covered by the Cooper et al. (2012) map is sampling one-third the dust and gas mass of M 51. If the constant-offset correction determined from the simulations is not applied, then this one-third is a less extreme one-half.
Despite the differences found for each of the M 83 and for the NGC 5195 fields, it must be emphasized that the NGC 5194 field has the same mass for both data sets (after applying the appropriate corrections mentioned previously); this strongly suggests that the millimetre-wavelength data are not always necessary for a reasonable dust mass estimate and also that having only two continuum wavelengths will give reasonable mass estimates (i.e. dust-inferred gas mass), especially when calibrated against gas column densities.
It should also be mentioned that the companion galaxy, NGC 5195, contributes very little to the total masses or fluxes: 5%. Its presence can be largely ignored.
Figures 9 and 11 demonstrate detailed agreement to within factors of about 2 between the spectral line derived and continuum derived column densities out to a galactocentric radius of about 6 kpc for both galaxies. Beyond a radius of about 8 kpc, the spectral line derived column densities are a factor of 2 or more below those derived from the continuum. This is possible evidence that the X-factor is strongly rising in the outer disks of both galaxies, although other explanations are not entirely ruled out. This will be addressed in more detail in Sections 4.3 and 5.1.
The total mass of gas, , in M 51 out to a radius of 13.6 kpc is , including the correction given by the simulations (or without this correction). For M 83, is out to a radius of 12.2 kpc. For the adopted parameters (i.e., distance, intermediate-, etc.), the observed 1.1 mm flux and the derived mass imply average dust temperatures of 19.4 K and 13.9 K for M 51 and M 83, respectively. For both galaxies,
| (1) |
where the uncertainty represents the range of values for this sample of two. Using the abovementioned dust temperatures and assuming , the is roughly . This is consistent with Groves et al. (2015), who found that ratio to be 20- (as inferred from their Table 8 for massive galaxies).
The continuum derived and spectral line derived masses and a breakdown of gas masses in M 51 and M 83 as well as a comparison between the two are given in Table 3.
4.3 X-Factor
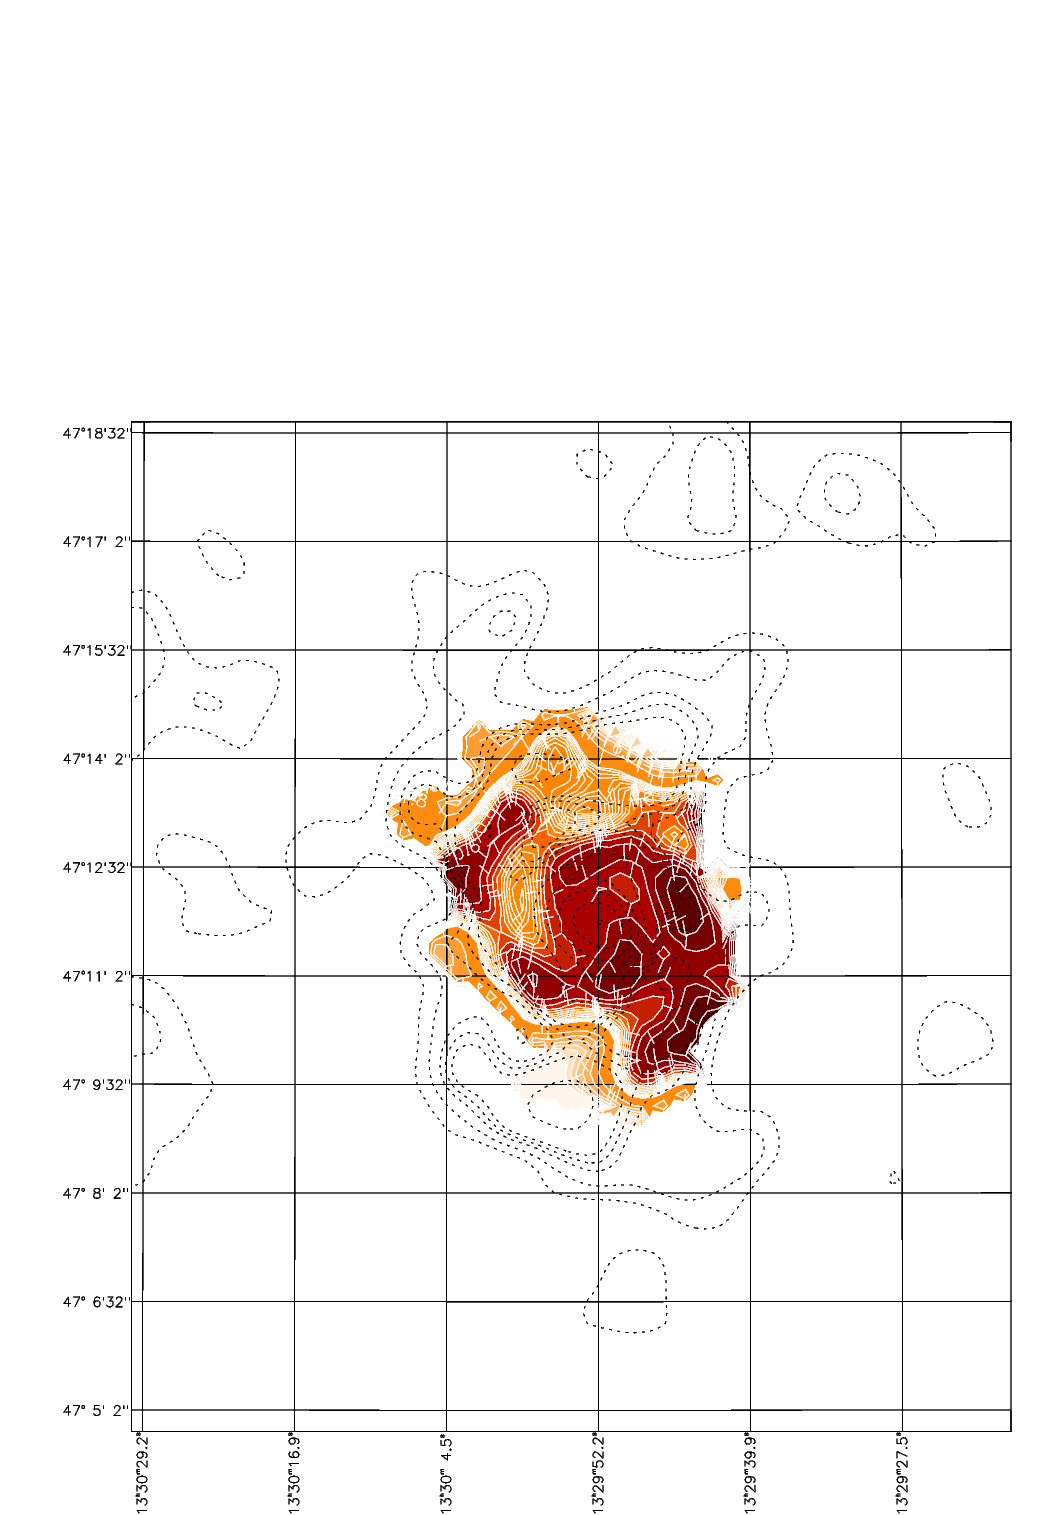
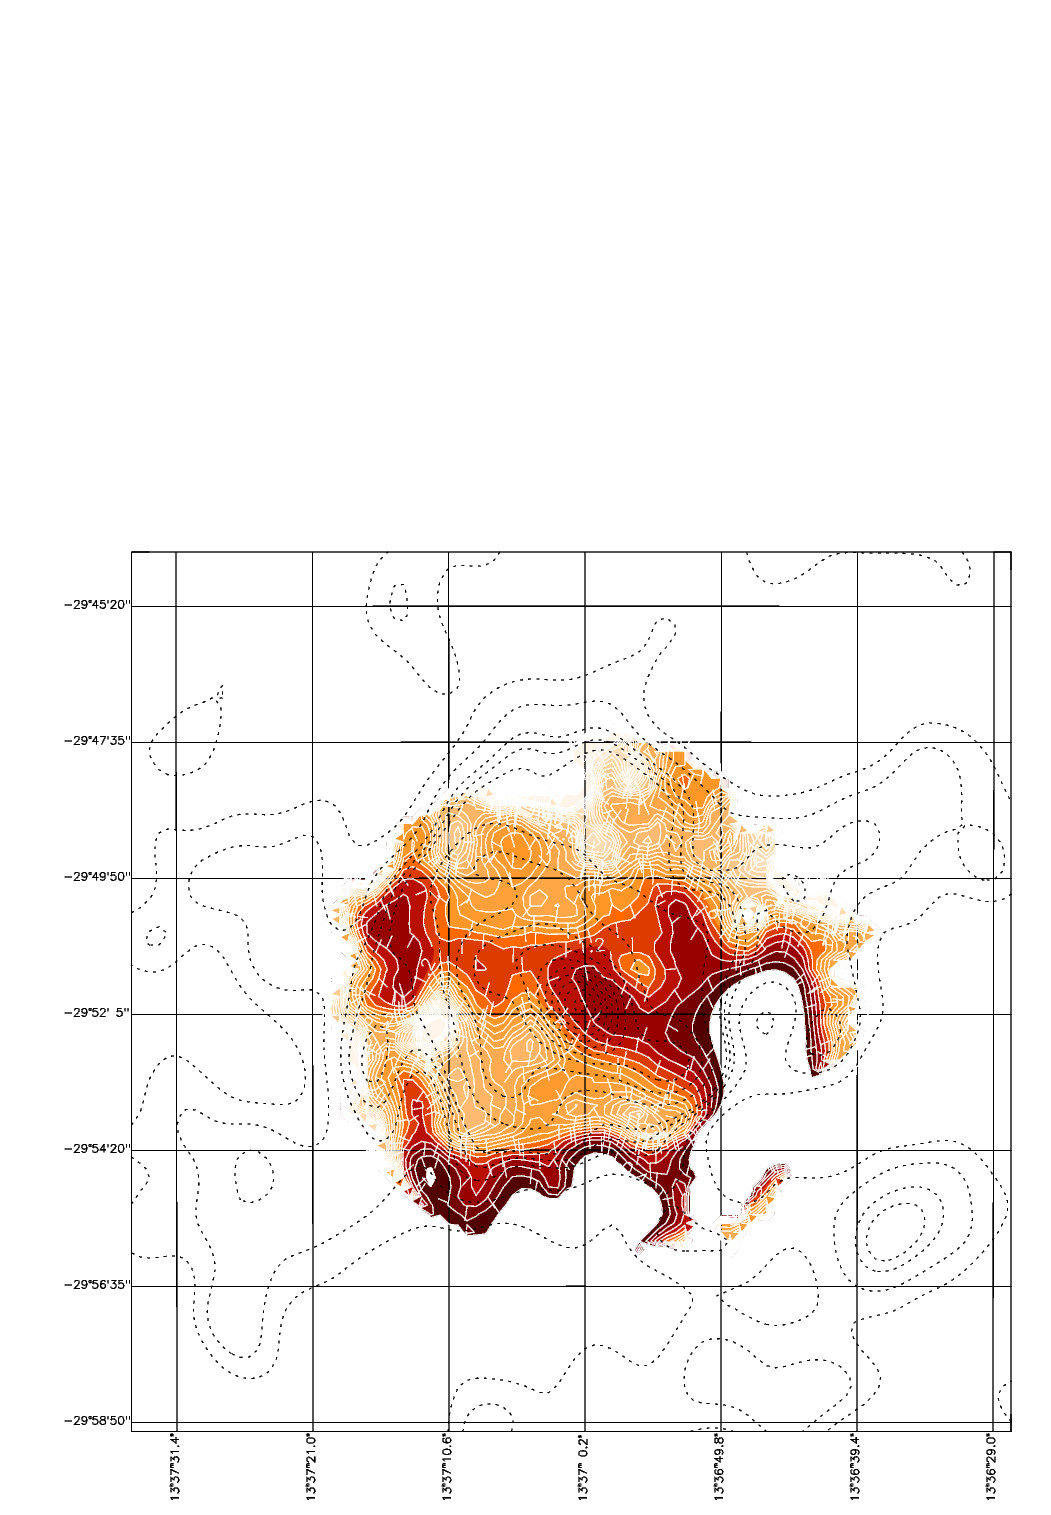
Maps of the X-factor, , are computed from the data, the details of which are given in Appendix C. The X-factor maps of Figures 12 and 14 reveal spatial variations within the inner 7 kpc radius of both galaxies. The X-factor in M 51 is on average larger in the interarm regions than in the arms by factors of roughly 2 or more. This is less obvious in M 83 where the spatial resolution is lower (55′′ due to the CO map), but is also roughly the case.
| M 51 | M 83 | ||
|---|---|---|---|
| 0.8c | 1.0 |
a The -weighted means of the map and only for the inner 7 kpc radius. Uncertainty of about .
b In units of or .
c Includes the correction determined from the simulations.
The radial profiles of as seen in Figures 13 and 15 show that does not vary radially by more than a factor of 2 within the central 7 kpc radius. In M 51, such variations are consistent with a constant value for the inner 7 kpc radius to within the errors. In contrast, varies significantly within the central 3 kpc radius of M 83: the ratio of the at the bar ends to that in the central “plateau” is , significantly different from unity. Even in the extreme low- and high- cases, these results are little changed.
The X-factor maps of both M 51 and M 83 hint at spiral structure. Applying the Fourier spiral analysis mentioned in Section 4.5 to these X-factor maps yields a two-armed spiral structure with a phase shift of roughly 90∘ with respect to the main spiral arms for both galaxies, meaning that the interarm/arm ratios for M 51 and M 83 are greater than unity with values 2.5 and 1.5, respectively. These numbers apply only for the inner 8 kpc and inner 6 kpc radii for M 51 and M 83, respectively. The uncertainties of these ratios is about 35% for M 51 and 10% for M 83. In the extreme low- and high- cases, the inferred interarm/arm ratios are the same to within the uncertainties.
The CO maps are noisy beyond galactocentric radii of about 7 to 8 kpc. Consequently, we are only able to compute rough lower limits for in the outer disks of M 51 and M 83. (See Appendix C for details.) For M 51, even in the high- (low-) case, the lower limits to are roughly to ( to ) depending on the radius in the outer disk. For M 83, even in the high- (low-) case, these rough lower limits to are to ( to ). This is a strong hint that something unusual might be occurring in the gas or dust (or both) of the outer disks of M 51 and M 83 regardless of the assumed value for the dust mass-absorption coeffient. See Section 5.1 for details.


4.4 Star Formation versus Gas Surface Density
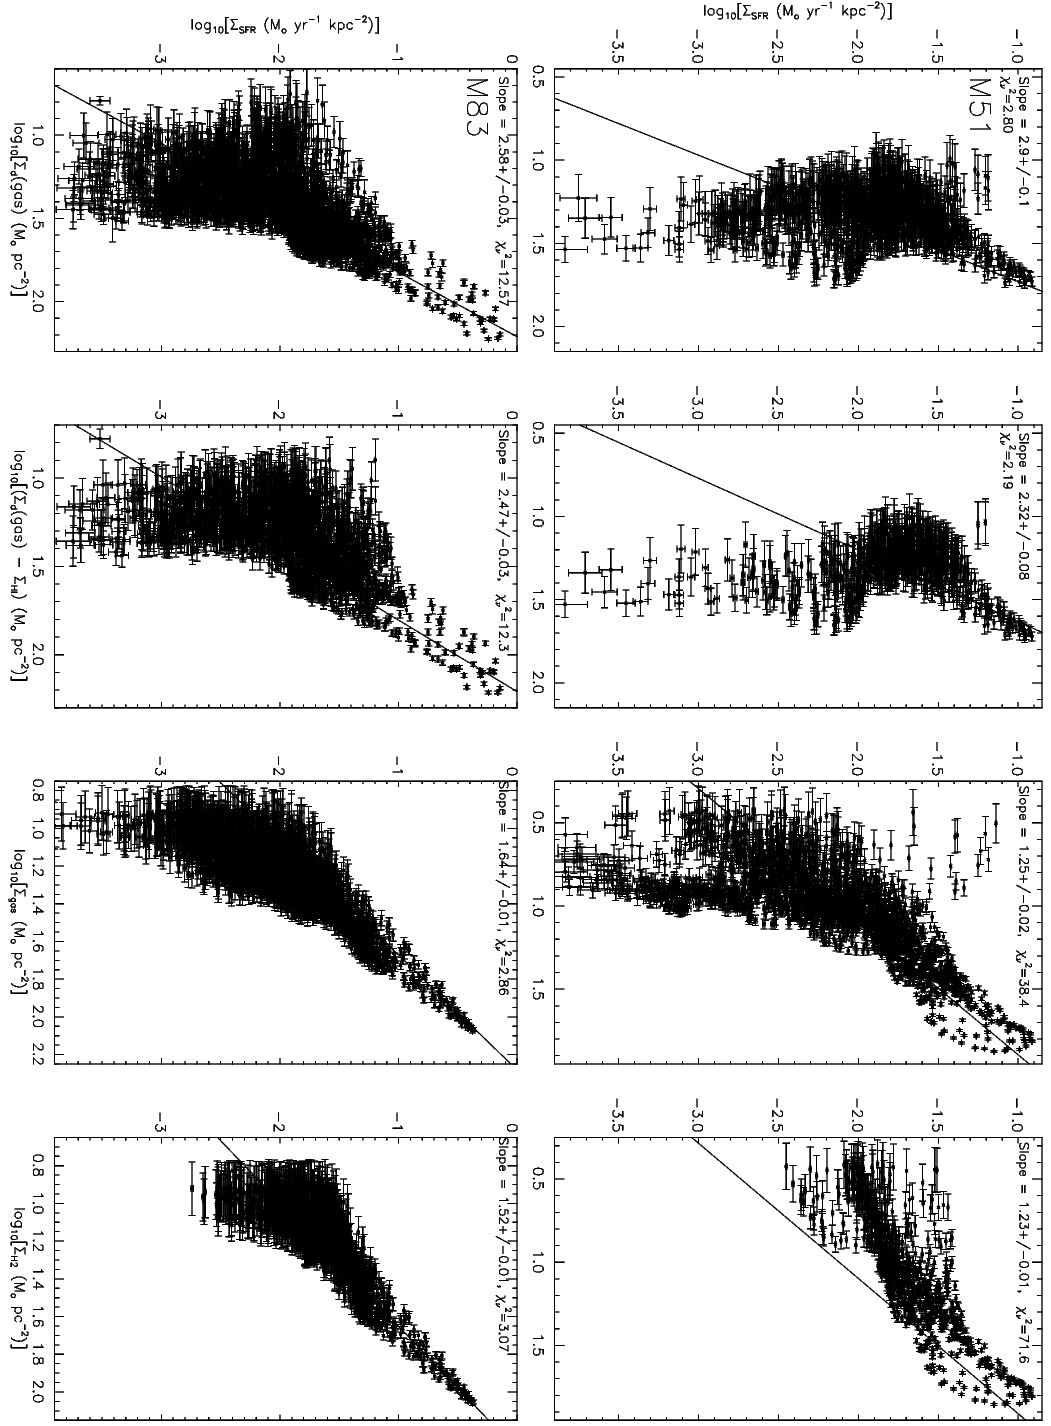
Now we examine the variation of the star formation rate (SFR) surface density with the gas and dust surface density tracers. (See Appendices D and E for details in producing and comparing such surface density maps.) The plots of the surface densities of SFR versus gas are displayed in Figure 16. All that figure’s panels, except the upper right, reveal an apparent gas surface density threshold of about 15 at which the SFR surface density rises nearly two orders of magnitude from to . Above this threshold, the SFR surface density follows a power-law rise with slopes of 2.5 to 2.9 for column densities inferred from continuum and with slopes of 1.2 to 1.6 for column densities inferred from spectral lines.
These superlinear slopes are consistent with the inside-out star-formation scenario inferred for spiral galaxies by other means (e.g., González Delgado et al., 2014). In addition, the surface density threshold of visible in most of the panels is roughly consistent with the threshold of determined from the simulations of Clark & Glover (2014). The simulations of Dobbs (2015) suggest a similar threshold in their Figure 11.
Bigiel et al. (2008) also examined the star-formation law in external galaxies. Their fit using H line and 24 data had a slope of 1.18. This is comparable to the slope of for the corresponding plot of the current work. The current work shows us that the slope changes yet again – to – when using continuum emission and the HI line as a tracer of the molecular gas, i.e, versus []. A similar difference in slopes between that for versus and that for versus is seen for M 83. These varying numerical values of the slope and how they may or may not affect the physical interpretation of the relationship between the star formation and the gas will be discussed further in Section 5.2.
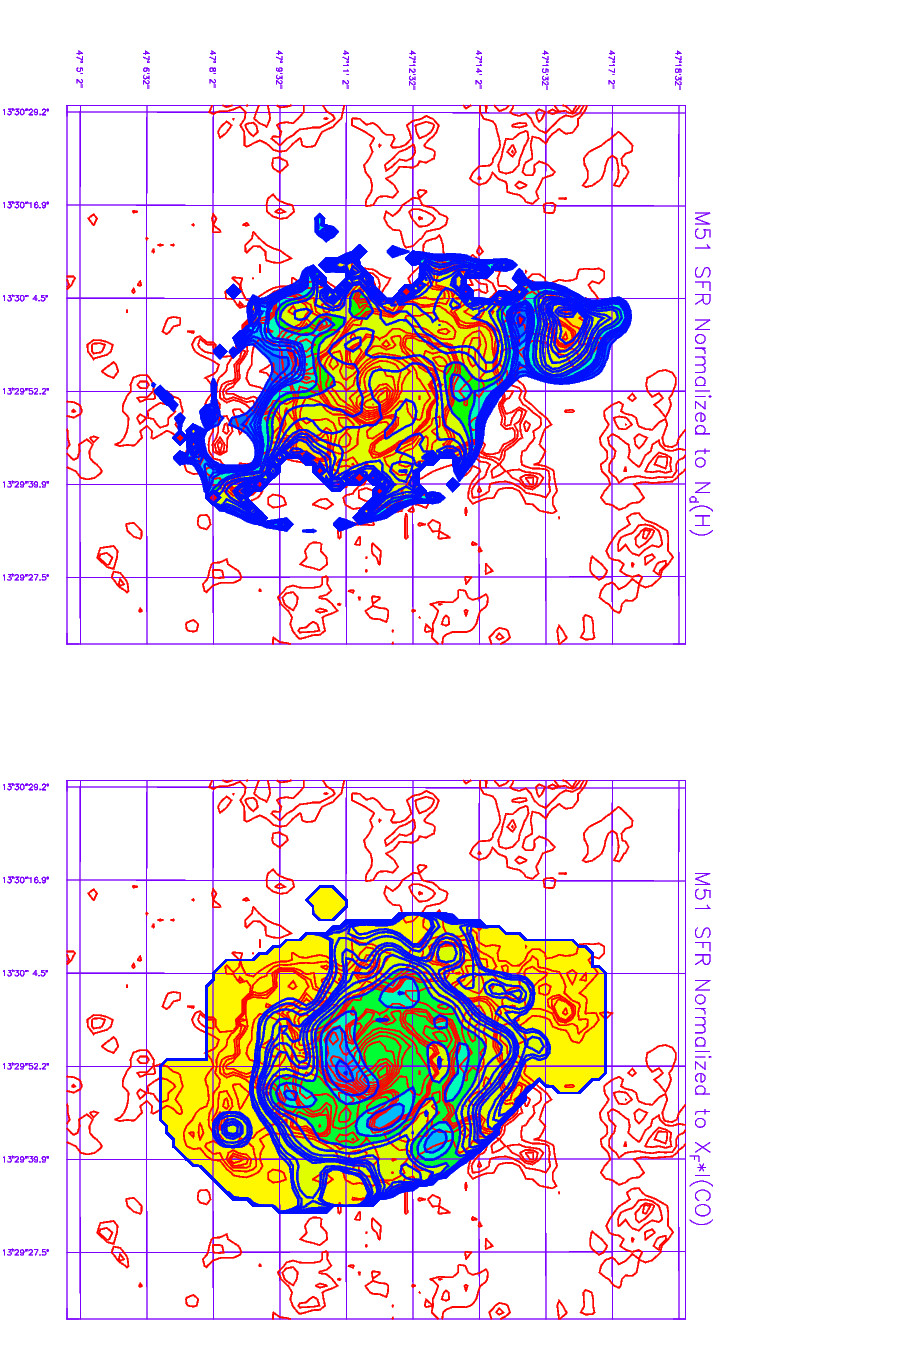
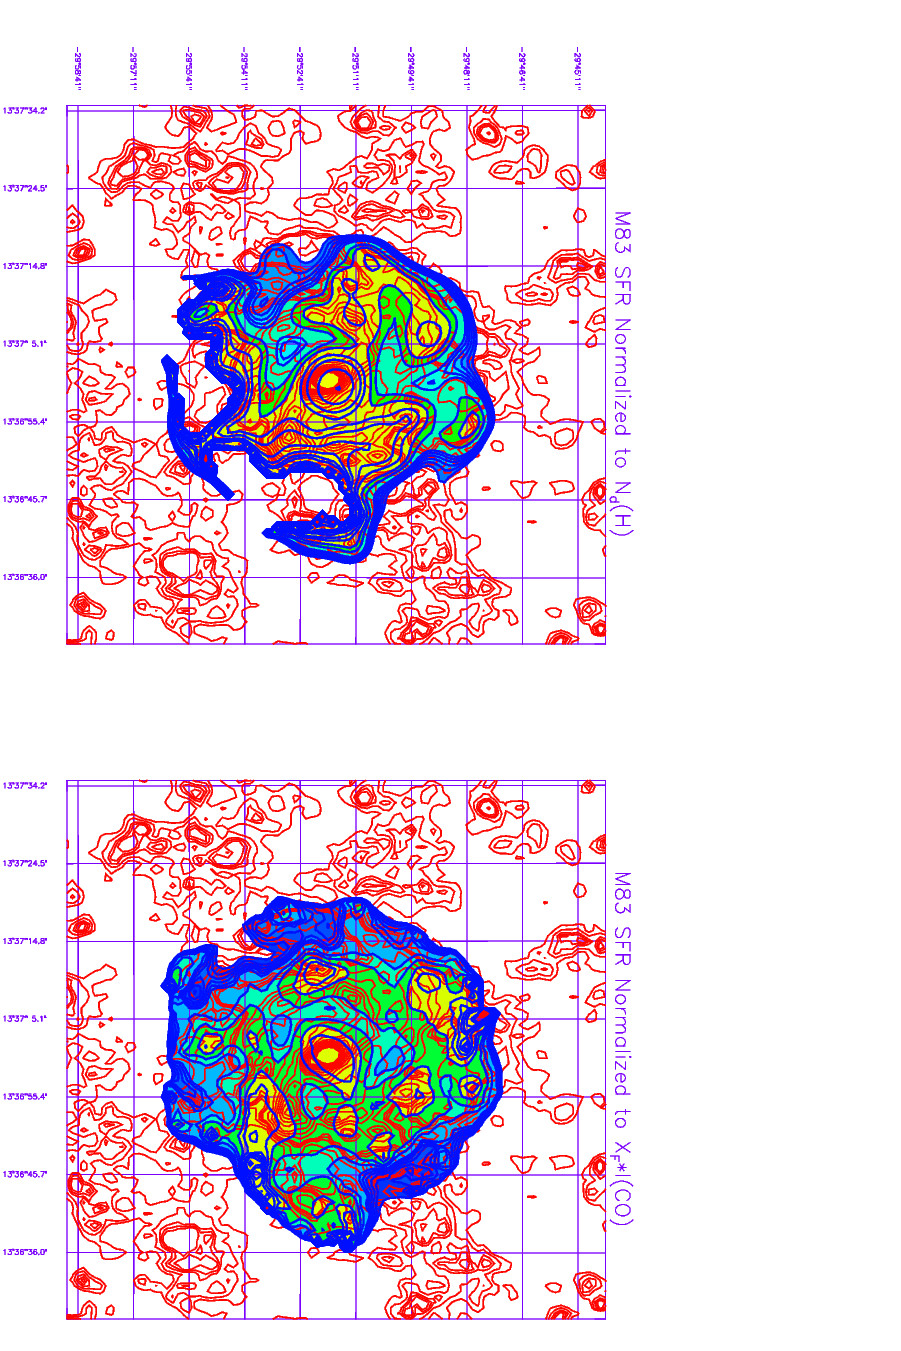
More insights into star formation are provided by normalizing the SFR surface density to that of the molecular gas, producing what is often called the star formation efficiency (SFE). Images of the divided by molecular gas surface density tracers, either or , are given in Figures 17 and 18. The yellow area surrounding much of the image of M 51 in the upper right panel suggests a very high star formation rate per unit gas mass in M 51’s outer disk. But this is nothing more than an artefact due to using a constant and artificially low rather than a higher, and likely more realistic, for this outer area of the disk. The top image in Figure 5 of Foyle et al. (2010) is that of their SFE of M 51 and the same artefact appears in the form of the white patches on the outer edges of the image. (These white patches also appear in the outer edges of the images of the other two galaxies, NGC 628 and NGC 6946, in that figure.)
Whether or not spiral structure is visible in Figures 17 and 18 is important for determining whether the spiral arms enhance the SFR beyond the corresponding enhancement in the gas surface density due to the arms. Applying spiral arm decomposition to the images using the dust-continuum derived surface densities yields arm/interarm ratios of 1.3 and 2.0 for M 51 and M 83, respectively. For the M 51 image using CO as the molecular gas tracer (right panel), the SFR normalized to the gas surface density is higher between the arms with interarm/arm ratio of 2.4. For M 83, this is 1.0. These ratios suggest some mild effect on the SFR due to the spiral arms, but with the SFR normalized to surface densities from the continuum tracer suggesting an opposite effect to that suggested by the SFR normalized to the surface densities from CO. These apparently opposing effects are reconcilable when one considers the spatial variations of and of as discussed in Section 5.2.
4.5 Spiral Structure Fourier Analysis
Given that the large-scale structure of M 51 and M 83 has been reliably recovered according to the simulations, it is worthwhile to examine the spiral structure of both galaxies. Hence, a two-dimensional Fourier analysis on the basis of logarithmic spirals (Kalnajs, A., 1975; Considère & Athanassoula, 1988; Puerari & Dottori, 1992; Block & Puerari, 1999) was conducted on different images of both M 51 and M 83, thereby allowing tests of the spiral structure.
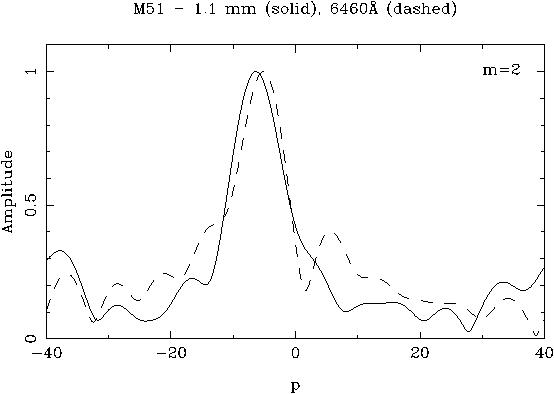
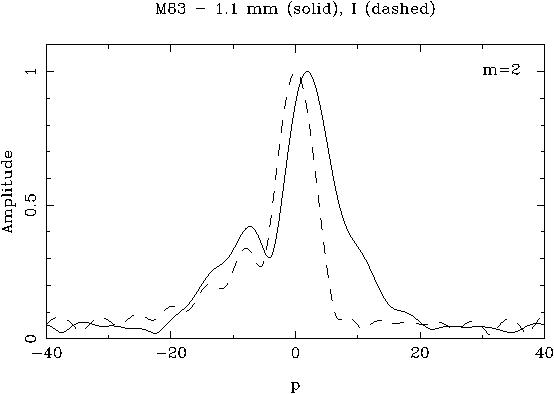
One obvious test is to see whether the spiral structure observed in visible (or nearly visible) light, due to stars, is the same as that observed in the millimetre continuum, due to dust (and its associated gas). Accordingly, the spiral-arm analysis mentioned above is applied to an R-band image of M 51111See - for M 51. and an I-band image of M 83222See - for M 83., as well as the AzTEC 1.1-mm image. Figure 19, for example, shows that the power spectrum in M 51 for the (i.e. two-arm) spiral pattern is identical, to within the uncertainties, between the R-band and the 1.1 mm continuum M 51. However, the power spectrum in Figure 20 for M 83 reveals a noticeable difference between the spiral structure in the 1.1 mm image and that in the -band image; only a hint of a small bar is discernible in the former image, whereas a more prominent bar adorns the latter image. Further analysis finds that the visible (or near visible) light and 1 mm continuum spirals are not offset from each other. Accordingly, this suggests that the stars and gas are also not offset from each other in the spiral arms.
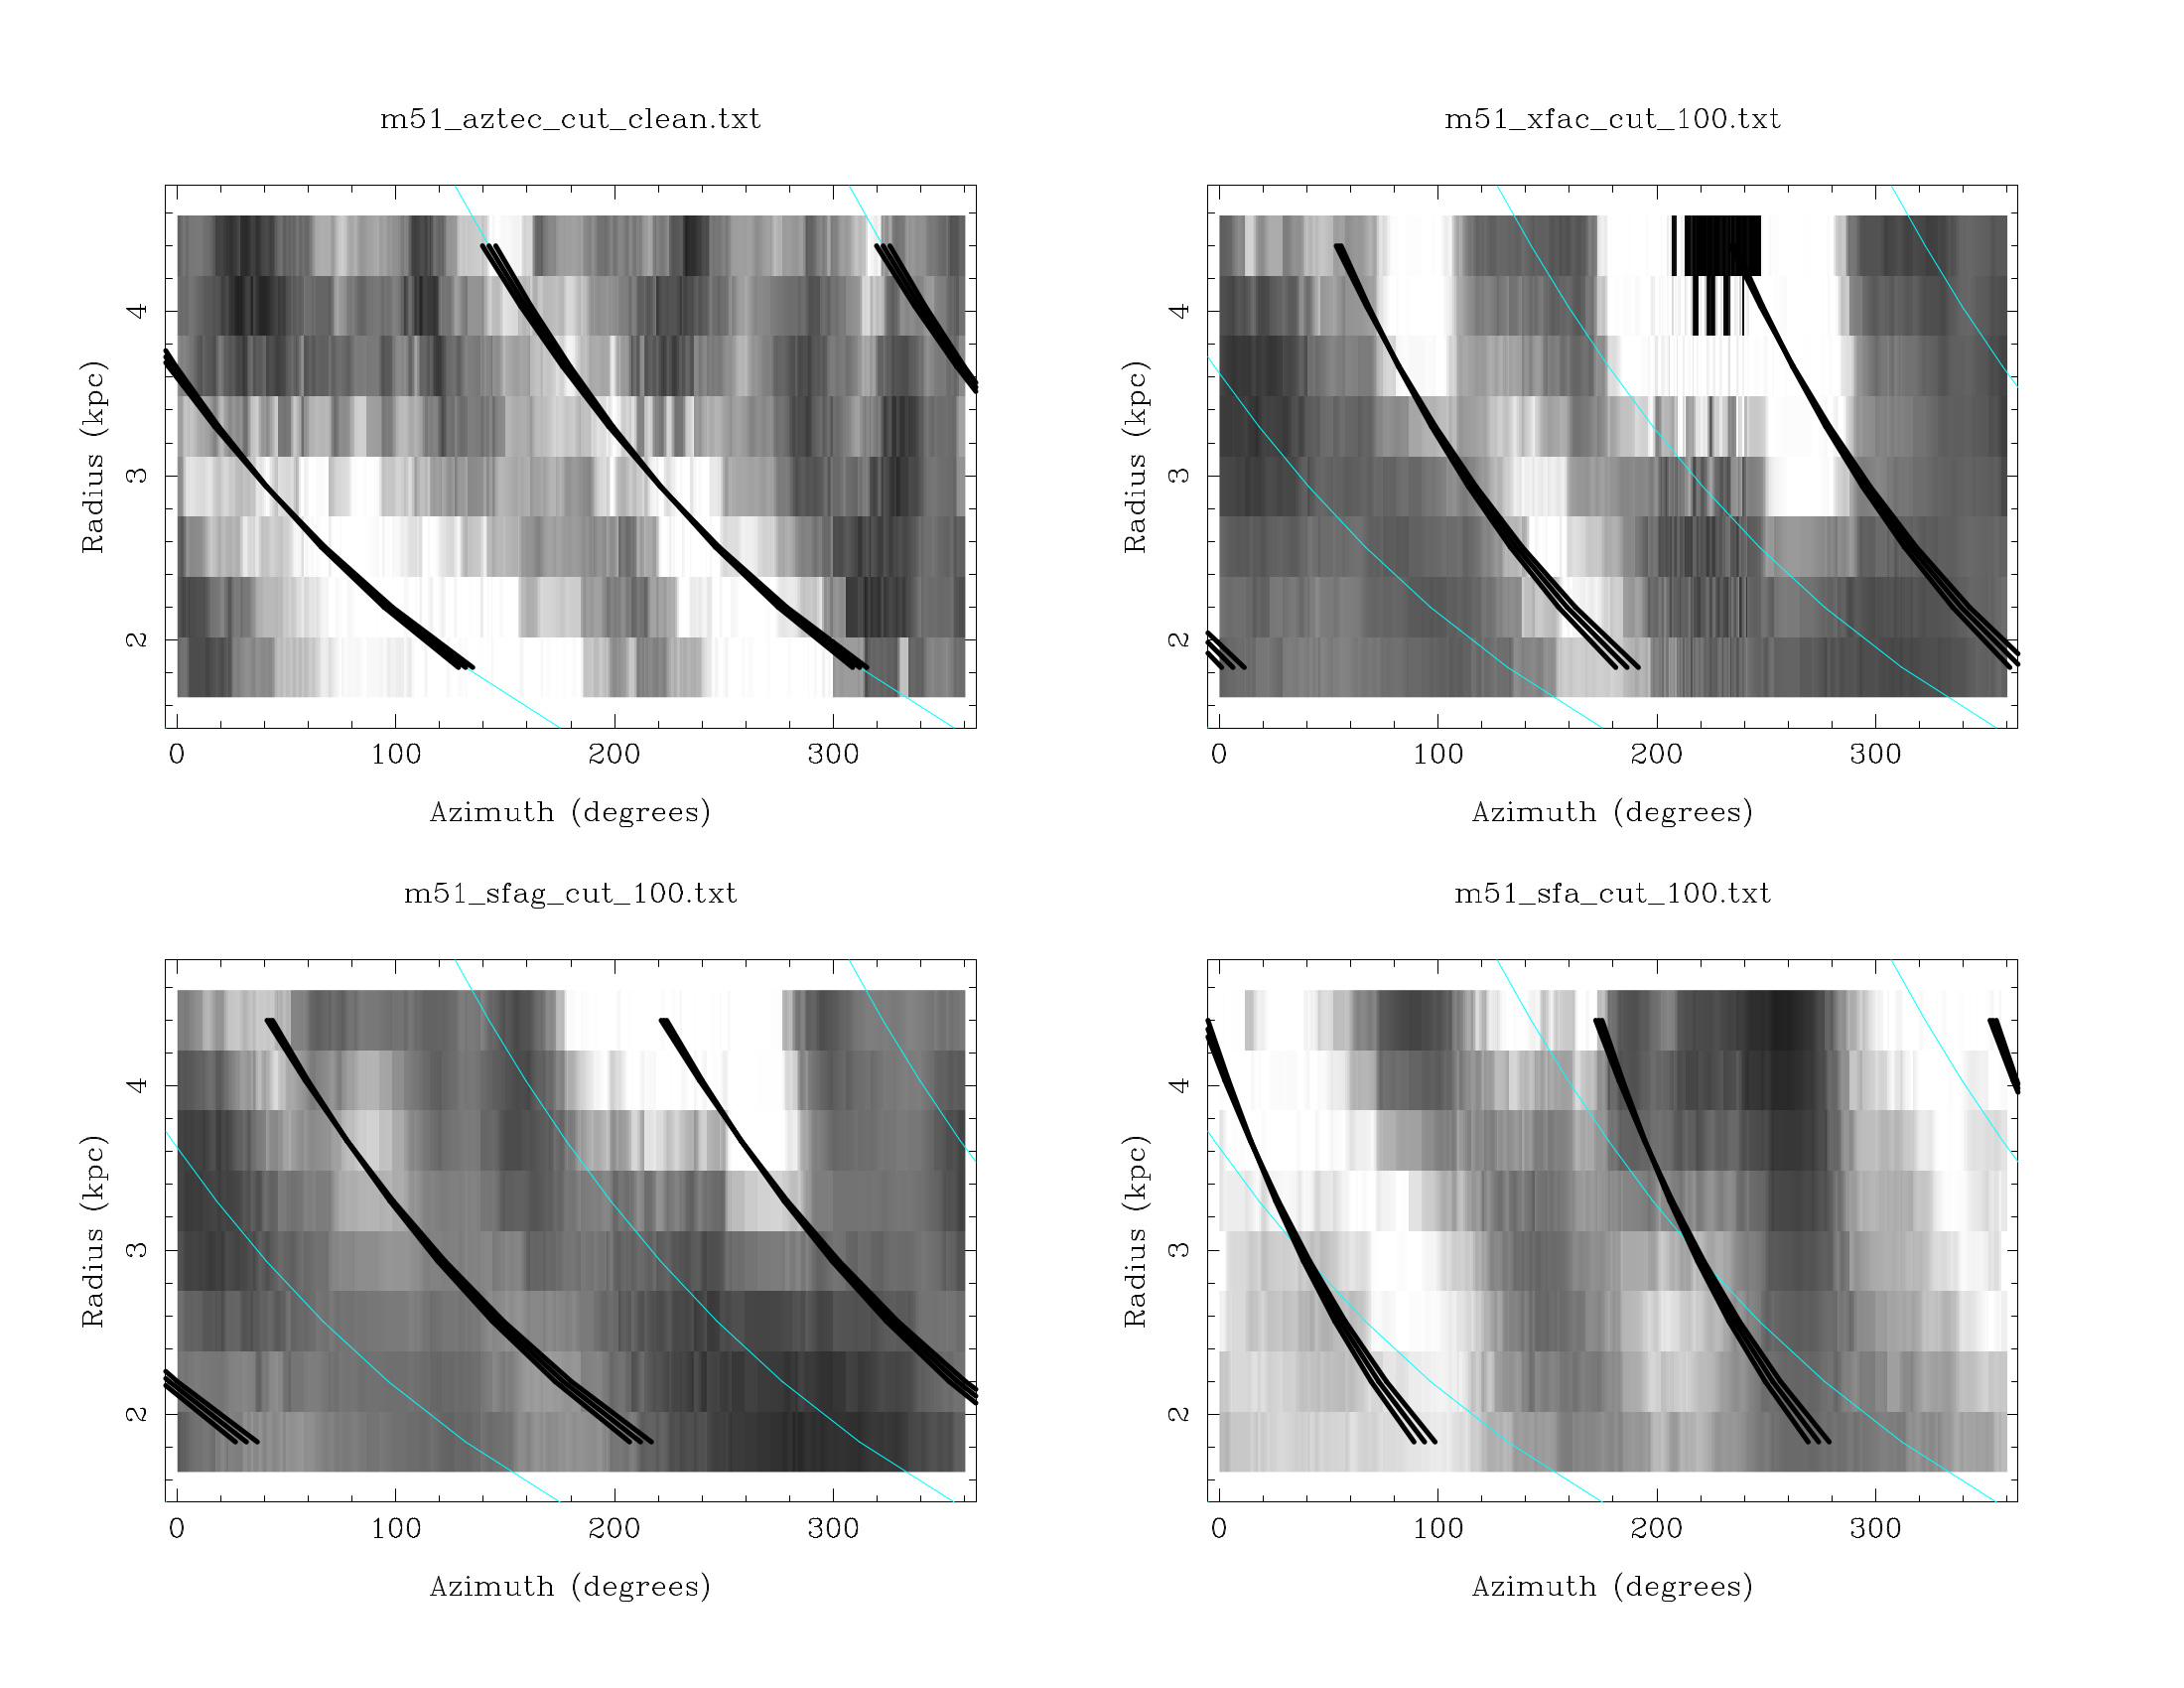
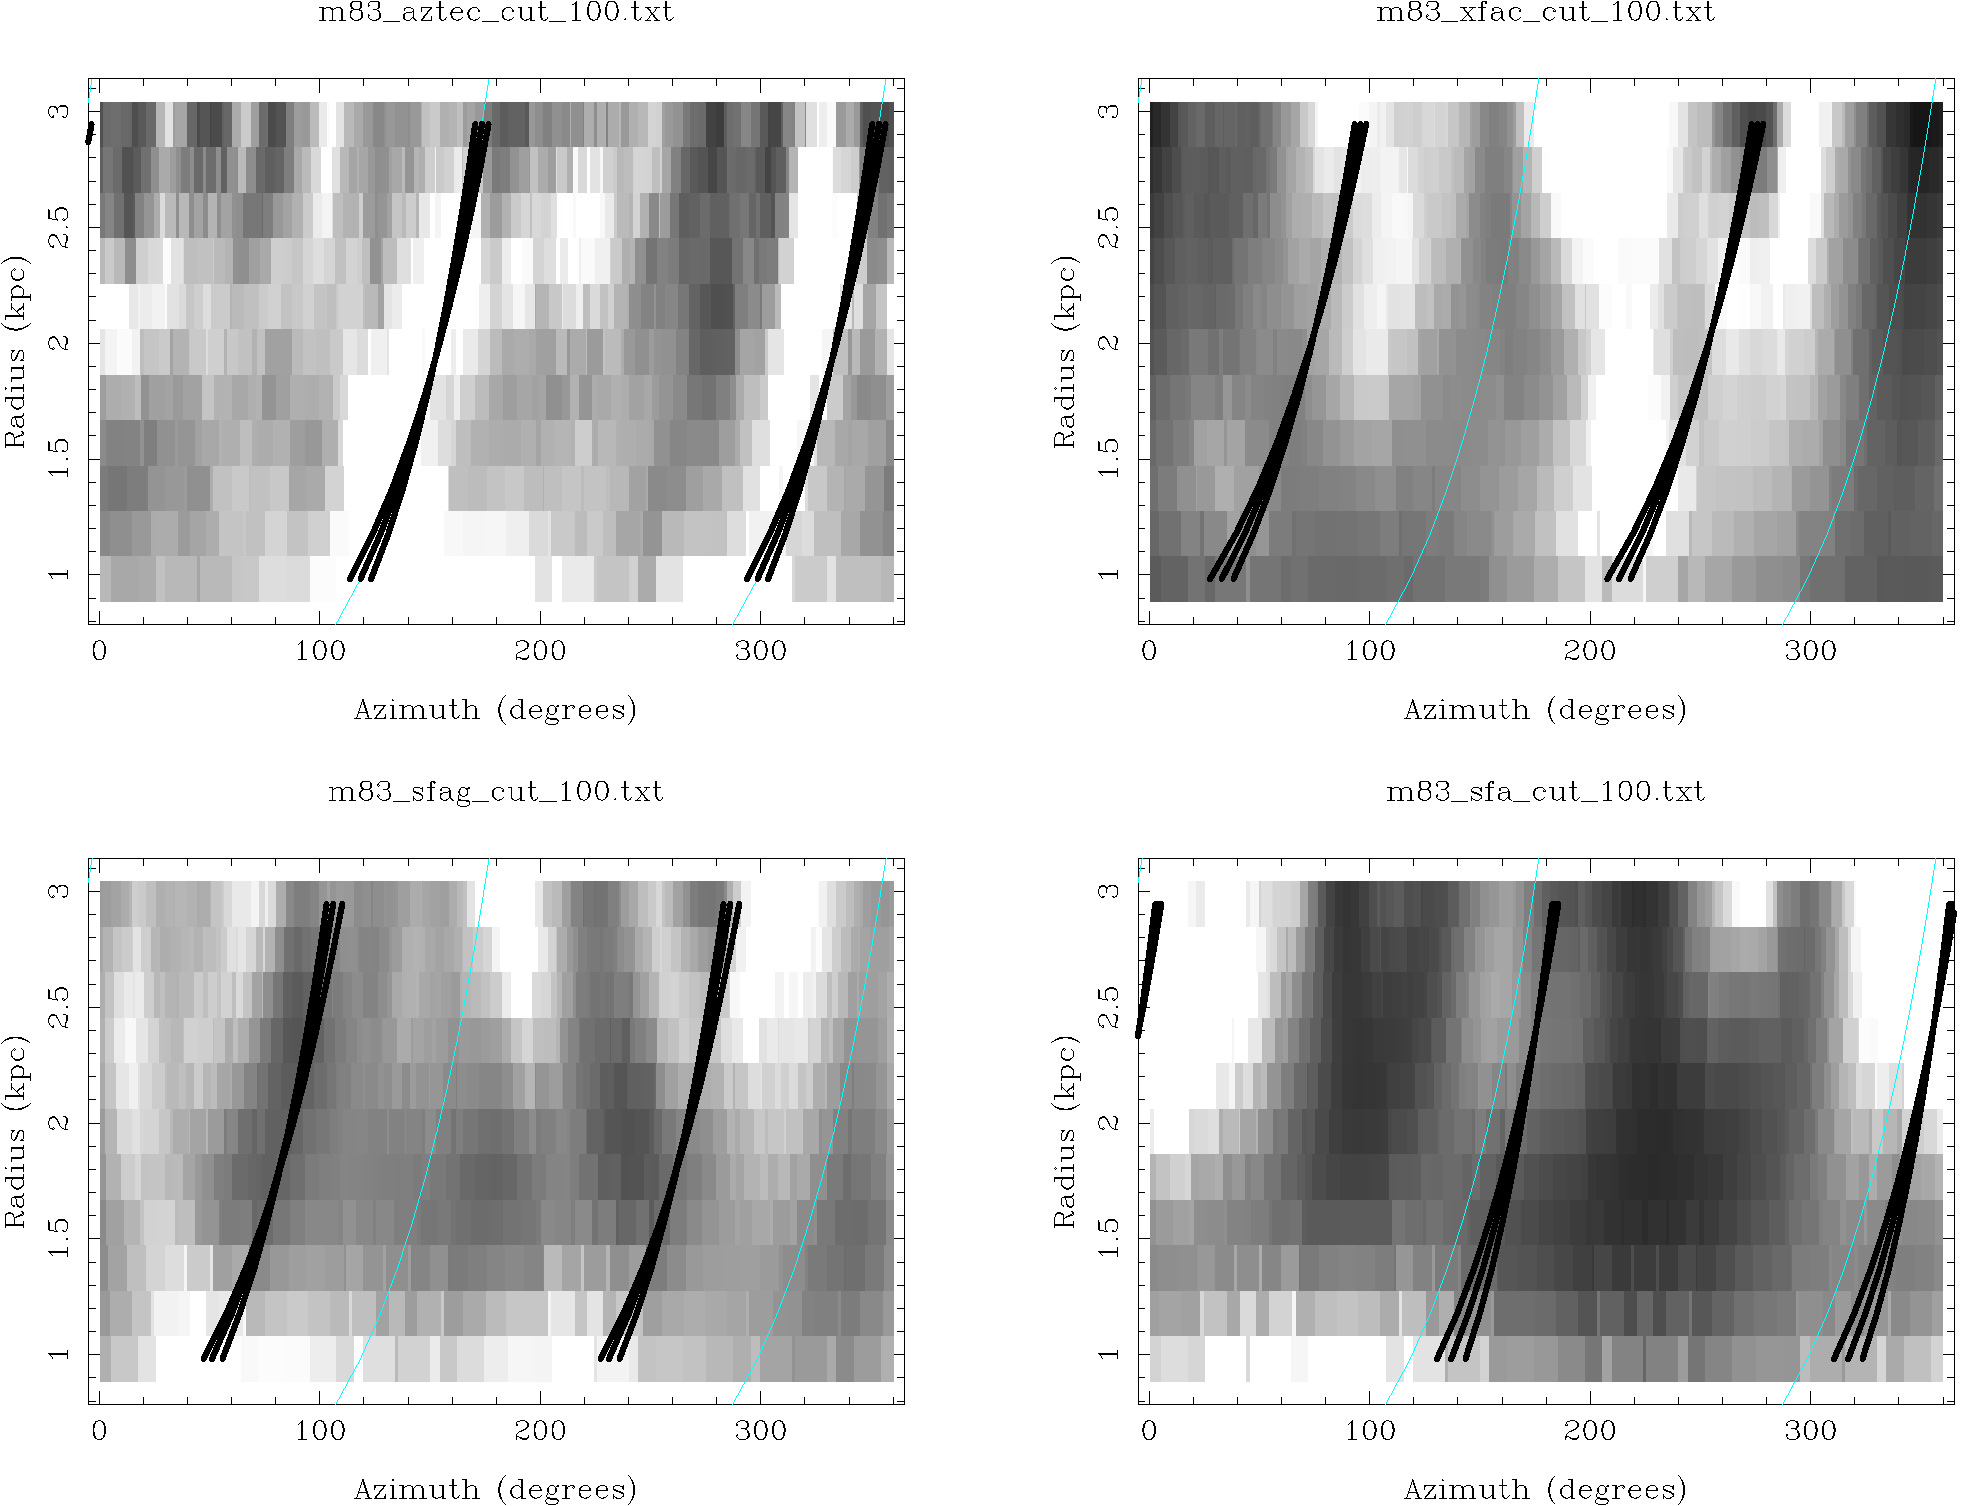
Other tests of spiral structure are applied to the X-factor and to the star formation rate surface density normalized to the gas surface density, or . The results of these tests are presented in Figures 21 and 22 for M 51 and M 83, respectively, which display the results of this Fourier analysis for the 1.1 mm continuum images, the X-factor maps, and the maps of the SFR normalized to the molecular gas surface density, where that surface density is determined from the continuum and HI for the “SFA” panel and determined from CO for the “SFAG” panel. Clearly the higher values for both the X factor, and the SFAG images are found in the interarm region, and the spiral structure have almost the same pitch angle as the main AzTEC arms. For the SFA images, the pitch angle is a bit smaller, but it is in phase with the arms we detect in the AzTEC image. These results are similar between M 51 and M 83.
We have used the detected positions of the arms in the AzTEC images of M 51 and M 83, and calculated the arm-to-interarm ratios of the processed images. These are presented in Table 5. The arm-to-interarm ratios are for the inner disks of both galaxies — galactocentric radii of 1.8-5.5 kpc and 1.0-2.9 kpc for M 51 and M 83, respectively. These radii were chosen for consistency with the X-factor maps. Most of the numerical values listed in Table 5 are within a factor of 2 of unity. The spiral arms seen in the 1.1 mm continuum have ratio values that are comparable to those seen in red light or -band. The arm/interarm values of the X-factor images indicate that the X-factor is higher in the interarm regions, where those interarm regions are defined as those in the millimetre continuum and in the and bands (i.e., between the dust and stellar arms).
Similar to the X-factor, the SFAG map is higher between the arms than in the arms, at least for M 51. Given that the SFAG map was computed from the X-factor, it is not surprising that both X-factor and SFAG maps have this quirk in the arm-to-interarm ratio. Compensating the arm/interarm ratio of SFAG for that of the X-factor suggests that the “true” arm-to-interarm ratio is above unity. Indeed, that is confirmed in the SFA map, which is the SFR surface brightness normalized to the molecular gas surface density determined from the continuum and the HI line and, as a result, the SFA map is independent of the X-factor.
Taken at face value, this suggests that star formation is more “efficient” in the arms than in the interarms, in the sense that the star formation rate in the arms is enhanced beyond that expected from simply having more gas and dust surface density in the arms. However, the values of the arm-to-interarm ratios presented here are subject to systematic effects. See Section 5.2 for more discussion of this. In any event, even if real, this enhancement is less than a factor of 2 or even 1.5.
| Image | M 51 | M 83 |
|---|---|---|
| Visibleb | 1.3 | 1.5 |
| 1.1 mm | 1.7 | 1.4 |
| X-Factor | 0.4 | 0.7 |
| SFAc | 1.3 | 2.0 |
| SFAGd | 0.4 | 1.0 |
a For galactocentric radii of 1.8-5.5 kpc and 1.0-2.9 kpc for M 51 and M 83, respectively.
b In red light for M 51 and -band for M 83.
c The star formation surface density map normalized to the molecular gas surface density determined from the continuum and the HI line.
d The star formation surface density map normalized to the molecular gas surface density determined from the CO line and the X-factor.
5 Discussion
Maps of M 51 and M 83 were made in the 1.1 mm continuum from observations with the instrument AzTEC with the JCMT. Combining with these maps with the corresponding Spitzer 160 (or, more properly, 155.9) maps gave estimates of the gas surface densities in these two galaxies (see Appendix B and B.1 for a detailed discussion). With these gas surface density maps, spatial variations of the X-factor were estimated. In addition, we investigated the relationship between the gas surface density and that of the star formation rate. These are dealt with in more detail below.
5.1 The X-Factor, its Spatial Variations, and CO-Dark Gas
The most important results of this work regarding the X-factor are the following:
-
1.
The average X-factor for each galaxy can be estimated from the current observations, even if crudely. Those average values are and for M 51 and M 83, respectively.
-
2.
The X-factor is higher in the interarm regions than in the arms.
-
3.
There seems to be CO-dark gas that resides mostly in the outer disks of both M 51 and M 83.
The latter two results are robust to a range of adopted values.
The variation of the X-factor spatially and from source to source could be due, in part, to variations in metallicity. Theoretical work using the observational data also support a dependence of on metallicity (e.g., Narayanan et al., 2012; Lagos et al., 2012). In contrast, Sandstrom et al. (2013) do not find a strong correlation of with metallicity. However, their sample only had a metallicity range of 0.5-0.8 dex within factors of 3 of solar. The irregular galaxies observed by Israel and others (e.g., see Israel, 1988; Dettmar & Heithausen, 1989; Israel, 1997, 1997a; Madden et al., 1997; Fukui et al., 1999) typically had metallicities much less than solar, sometimes only a few percent of solar, and found X-factors an order-of-magnitude or more higher than the standard value. So a strong -metallicity relation may exist for galaxies with strongly sub-solar metallicities. For galaxies with roughly solar metallicities, while metallicity alone is apparently insufficient in constraining , it is still relevant. For example, using the data points for NGC4321 from the left panel of Figure 10 in Sandstrom et al. (2013) yields a correlation coeffient of 0.6. This suggests that each galaxy has its own -metallicity relationship.
Given that sub-solar metallicities imply larger X-factors, perhaps the interarm regions of M 51 and M 83 have sub-solar metallicities, while being at solar-level in their arms 333Parkin et al. (2013), however, find that the FUV flux and molecular gas density are the same for arm and interarm regions in M 51. Whether this implies the same metallicity in both regions is unclear.. The models of Narayanan et al. (2012), as well as their Figure 1, suggest that the metallicity in the interarm regions would be systematically lower by a factor of 2-3 in order to increase by a factor of 2 with respect to that in the spiral arms (see their equation #8). While observations of metallicity in the ISM of M 51 and M 83 apparently do not support such a systemically lower metallicity between their spiral arms (see Bresolin et al., 2004, 2009), they also do not rule it out: such observations are toward HII regions and are heavily biased toward the spiral arms.
This could, in turn, affect the results of studies of the effects of the spiral arms on star formation. Foyle et al. (2010), for example, looked at whether the SFR normalized to the molecular gas surface density is higher in the spiral arms of three galaxies. They adopted a spatially constant X-factor, which, to within a factor of 2, is likely correct. This will be discussed further in Section 5.2.
The modelling by Narayanan et al. (2012) mentioned above suggests that the X-factor depends mainly on the metallicity of the gas in a galaxy and, to a lesser extent, on the average CO surface brightness. Using the roughly solar metallicities of M 51 and M 83 (see Bresolin et al., 2004, 2009), the observed CO brightnesses from the data used here, and applying expression (8) of Narayanan et al. (2012) yields for M 51 and to 6 for M 83; this is much higher than the observed values found in the current work. Admittedly, our estimates are uncertain by factors of about 2. Nevertheless, our estimate of for M 51 agrees with the result of Nakai & Kuno (1995) who find from using the observed extinction in HII regions. Accordingly, the theoretical models need further adjustments.
As mentioned previously, there is evidence that adopting a spatially constant X-factor does not account for CO-dark gas. For example, Table 3 suggests that about half the total gas mass is unaccounted for when using the CO and HI 21-cm spectral lines (see Section 4.3 and Appendix B.1). If we adopt a threshold for CO-dark gas that corresponds to an that is a factor of 4 higher than the average for each galaxy, then some of the edges of the shaded regions of Figures 12 and 14 indicate such gas. It is worth noting that these edges are well within the boundaries of the CO maps.
Of course, possible alternative interpretations for the high X-factor or its high lower limits are not entirely ruled out. These include the following:
-
•
An extended low surface brightness artifact in the 1.1 mm continuum maps of M 51 and M 83.
-
•
Insufficient mapping of CO in the outer disks of these galaxies.
-
•
Dust with unusual properties such as unusually high dust-mass absorption coefficient (i.e., ) and/or a high dust-to-gas mass ratio.
-
•
Optically thick HI 21-cm emission.
Each of the above could mimic the presence of CO-dark gas. The first alternative is unlikely given that the simulations of the AzTEC 1.1 mm observations have accurately accounted for any constant offsets in the M 51 and M 83 maps. The second alternative is unlikely because there is evidence for such CO-dark gas seen at radii well within the boundaries of the existing CO maps, as mentioned previously. The third alternative is unlikely because having a combination of high and high would not be sufficient for positions with two orders of magnitude larger.
The fourth alternative is a partly valid explanation for CO-dark gas in our Galaxy according to the Planck Collaboration (2011a). They estimated that up to half of the dark gas could be due to optically thick HI 21-cm emission. Even if that were the case for M 51 and M 83, it would not account for lower limits to that are one or two orders of magnitude higher than the average inner disk value.
In short, none of the alternatives mentioned above are likely to entirely rule out CO-dark gas. Nevertheless, these alternatives themselves are not entirely ruled out either and could partly account for some of the high X-factor values inferred. In any event, more and deeper mapping of CO and other gas tracers of the outer disks of these galaxies is essential for understanding the nature of the dust and gas at these large galactocentric radii.
The existence of CO-dark gas in our Galaxy has been known for a while (see Reach et al., 1998, and references therein) and has been confirmed recently by the Planck Collaboration (2011a). They find for our Galaxy. Also, as mentioned previously there is much additional evidence for such gas in the Galaxy and external galaxies (see, e.g., Israel, 1997, 1997a; Baes et al., 2014; Clark et al., 2012; Langer et al., 2014; Pineda et al., 2014; Roman-Duval et al., 2010; Saintonge et al., 2012; Smith et al., 2014). So it is quite likely that there is CO-dark gas in both M 51 and M 83. Indeed, the current observations suggest that such gas is present in the outer disks of both M 51 and M 83. The CO-dark gas could account for as much as half of the total gas mass, although the alternative interpretations given above could reduce that fraction by roughly 50%.
5.2 The Relationship between the Star Formation Rate and the Gas Surface Density
In Section 4.4, we examined how the SFR varied with the gas surface density in a number of ways. Comparing between the continuum and spectral line tracers given in Figure 16, all show higher slopes for the continuum tracers than for the spectral-line tracers. Figures 9 and 11 illustrate that the continuum-derived radial profile of the gas surface density is flatter than that for the spectral-line derived gas surface for large galactocentric radii. Having a smaller range of gas surface densities will naturally increase the slope in the SFR versus gas surface density plots.
Even though Bigiel et al. (2008) used far-UV and 24 data to estimate the SFR, whereas we used H and 24, that is unlikely to account for the difference between their fitted slopes and ours; their Figure 9 makes such a comparison and the difference in fitted slopes between the two SFR tracers is 10% or less. So if differences in SFR tracers cannot explain the difference between the slope obtained by Bigiel et al. (2008) and those obtained in the current work, then it must be the difference in gas surface density tracer. The continuum tracer used here gives slopes of , which is consistent with the eyeball inspection of the far upper right panel of Figure 8 of Foyle et al. (2012) for the inner radius of M 83.
Estimation of gas surface or column densities is problematic because, as exemplified in the current work, different tracers can yield different results. There are systematics that affect the column density estimates using CO and different systematics when using infrared and millimetre continuum. These systematics yield the differing slopes and also the observed scatter, which is sometimes quite large with reduced chi-square as high as to 70. This scatter is partly intrinsic, because the SFR depends on more physical conditions than on just column density. But systematic errors in estimating surface densities also play a role. Corrections applied systematically to those errors would represent a smooth gradient with galactocentric radius and not simply corrections to a few individual points. For example, observations have inferred X-factor values that are factors of about 5 or more lower than the standard value (e.g., Rickard & Blitz, 1985; Israel, 1988; Wall et al., 1993; Regan, 2000; Paglione et al., 2001) in the centres of external galaxies as well as in the central region of our own Galaxy (Sodroski et al., 1995; Dahmen et al., 1997, 1998). But these centres only represent the central few hundred parsec radii and would thus represent very few points in the plots of Figure 16. Only a large, smooth gradient in parameters like the X-factor or would change the slope uniformly in those plots, and there is no evidence for such.
Nevertheless, there is evidence of a weak dependence of the X-factor on the SFR. Clark & Glover (2015) explored this possibility with their physical models of molecular clouds, finding that with . The systematically different power-law indices for the dust tracers from those for the gas tracers are reconcilable by adopting that relationship between and . The computation of Appendix F yields and for M 51 and M 83, respectively. These have uncertainties of 3-4% and are thus significantly different from that of the models of Clark & Glover (2015). These are more consistent with the models of Narayanan et al. (2012)(see Clark & Glover, 2015). That the M 51 and M 83 values are significantly different from each other argues that there is no universal relationship between and . This is not surprising given that both of those quantities have complex dependences on the physical structure within the molecular gas.
The value of the slope of the surface densities of SFR versus those of the molecular gas is an indication of the large-scale evolution of a galaxy. As briefly alluded to previously, following the “stream” of points in each of the panels of Figure 16 from low to high surface densities is equivalent to travelling from large to small galactocentric radii. The (or alternatively ) ratio is really the inverse depletion time of the molecular gas. For slope , and the gas is depleted uniformly throughout a galaxy, as pointed out by Bigiel et al. (2008) and found by them and Leroy et al. (2013) . However, all the panels of Figure 16 have slopes , strongly supporting an inside-out depletion of molecular gas in both M 51 and M 83.
The panels of Figures 17 and 18 yield molecular gas depletion times from their centres out to radii of about 8 kpc for M 51 and 6 kpc for M 83. For M 51, the continuum tracers give molecular gas depletion times of about 1.2 Gyr in the centre to 20 Gyr in the outer disk and, with the CO line tracer, these times are 0.8 to 2.5 Gyr. For M 83, the continuum tracers suggest depletion times of about 0.7 Gyr in the centre to 10 Gyr in the outer disk and, again for CO, these times are about 0.4 to 5 Gyr. This inside-out evolution of the star formation in the disks of galaxies is supported by the visible-light observations of González Delgado et al. (2014).
At radii from about 8 kpc to 11 kpc for M 51, the molecular gas depletion times at these radii extend by nearly two orders of magnitude higher than the 20 Gyr estimate for galactocentric radius of 8 kpc. For M 83, this extension of the gas depletion time occurs for radii slightly beyond 6 kpc and is by about 1.5 orders of magnitude.
Figures 17 and 18 are equivalent to Figure 5 of Foyle et al. (2010), displaying the inverse depletion times of the molecular gas in the form of images of entire galaxies. Those images in the current paper (and, to some extent, those of Foyle et al., 2010) are suggestive of spiral structure. Such spiral structure implies an enhancement of the SFR due to the spiral arms beyond that of arms simply collecting and compressing gas and dust. Accordingly, we subjected these images to spiral arm Fourier analysis and found only a weak spiral structure with arm/interarm ratios usually within factors of 2 of unity. The right panels were found to have a spiral structure with high interarm values of and lower arm values, which is corrected when accounting for the higher interarm (see Section 4.3). In contrast, the left panels were found to have a spiral structure with high on the arms and lower values between the arms; the arm/interarm ratios are 1.3 for M 51 and 2.0 for M 83. These arm/interarm ratios are at least partly explained by the higher between the arms than in the arms (see Appendix B.1)— 18% higher for M 51 and 8% higher for M 83.
So, conservatively speaking, even the continuum tracer in our work confirms the work of Foyle et al. (2010) that spiral arms only enhance the star formation rate because of increasing the surface density of gas and dust with no additional enhancement. The uncertainties in the current work do not permit completely ruling out such an enhancement, but suggest that any such enhancement would be small (i.e., a factor of ). That enhancement, should it be real, could be accounted for by orbit-crowding in the spiral arms raising the inverse depletion time of the gas in those arms (e.g. Moore et al., 2012).
One key question is whether the conclusions are still valid if the diffuse emission is removed (Foyle et al., 2013). But the lower spatial resolution of the gas tracer observations impede determination of the surface densities associated only with the star-forming regions. So a surface-density versus surface-density plot is difficult to create (see Foyle et al., 2013), making comparison in the context of much previous work difficult. Removing the diffuse emission might still result in the slope of the versus still being higher when a dust-continuum tracer is used in place of a gas-line tracer (see Figure 16), due to the CO-dark gas not traced by spectral lines or maybe due to varying with the SFR. Also, the inside-out galactic-scale evolution of star formation, as indicated by the superlinear slopes, is likely still valid due to the support of independent work (González Delgado et al., 2014).
Shetty et al. (2013) use hierarchical Bayesian linear regression on the observational data, finding that no one S-K relation holds for all galaxies. This is consistent with the current work where no one power-law applies to either M 51 or M 83. Indeed, any simple power-law fit is inapplicable given the poor quality of fits in Figure 16. Not only are there different slopes in different galaxies, but there are also different offsets, particularly in post-starburst galaxies (see French et al., 2015). And, if no one such relation holds for all galaxies, then the S-K relation does not represent a universal physical law of star formation (see Lada et al., 2013). Perhaps the S-K relation for a disk galaxy is a measure of how the inverse depletion time of the molecular gas varies radially in that disk galaxy (e.g., inside-out or outside-in star formation), which, in turn, is affected by the many properties of, and processes in, the disk of that particular galaxy (see, for example Meidt et al., 2013; Hughes et al., 2013; Schinnerer et al., 2013; Colombo et al., 2014).
6 Summary and Conclusions
The spiral galaxies M 51 and M 83 were observed with the bolometer array AzTEC on the JCMT in the 1.1 mm continuum at 20′′ spatial resolution. The extended emission, including the interarm emission and exponential disks, was faithfully recovered in the final maps out to galactocentric radii of more than 12 kpc for both galaxies. This was verified by simulations that show that only small corrections are necessary for the M 51 image and negligible corrections for that of M 83. The 1.1 mm-continuum fluxes are and for M 51 and M 83, respectively. The uncertainties are largely due to that of the calibration.
These images were combined with the 160 image of Spitzer to obtain dust temperatures and column densities. This approach was adopted, rather than using dust models, for two reasons. One reason was to have an independent test of the models (see Groves et al., 2015). The other reason is that multi-wavelength far-IR data at the long wavelengths (i.e. ) at which the bulk of the dust mass radiates is not available for the outer disks of M 51 and M 83, other than the 160 data of Spitzer.
Another model-independent approach was to constrain, at least roughly, the at 1.1 mm by the observations, rather than simply adopting a dust mass absorption coefficient, . Gas column densities were estimated by calibrating against HI-dominant positions to estimate the dust optical depth to gas column density ratio . The method of calibrating against the HI-dominant positions was improved by crudely estimating the effects of the CO-dark gas (see below). Neither galaxy has a strong radial variation in the gas surface density beyond galactocentric radii of about 3 kpc. Out to a galactocentric radius of 14 kpc, the best estimate of the mass of gas in M 51 is . Out to 12 kpc in M 83, this best estimate is . (See adopted distances in Table 1.)
Pre-existing maps of CO permitted the creation of maps of the or X-factor for both M 51 and M 83 out to galactocentric radii of 6-8 kpc. Both galaxies have X-factor values that are higher in the interarm than in the arms by a factor of -2. In the central few kiloparsecs of M 51, this interarm/arm ratio rises to . In M 51, there is no significant radial variation of . In M 83, however, there is evidence at the many- level of radial variation of the X-factor by factors of 2 to 3, where the central 2 kpc radius has a roughly flat X-factor which declines to a minimum at about 4 kpc. Within galactocentric radii -8 kpc, the spatially averaged X-factor is about 1.
Beyond the outer radius of the X-factor map for each galaxy, comparison of the radial profile of the gas surface density derived from the continuum with those of the surface brightnesses of CO and HI permits estimates of lower limits of the X-factor that reach one to two orders of magnitude higher than the inner disk values. This suggests the existence of CO-dark molecular gas in the outer disks of M 51 and M 83, although alternative explanations are only partly ruled out. Nevertheless, these alternatives do not entirely account for the high X-factor values in the outer disk.
A two-dimensional Fourier analysis of the spiral structure at 1.1 mm and at visible (or near visible) wavelengths revealed that the spiral structure in red light and that in the 1.1 mm continuum and were the same in M 51. For M 83, the spiral structure in -band compared with that in the 1.1 mm continuum showed that the bar’s effect in M 83 is conspicuous in -band and not at 1.1 mm. These results suggest that the spiral density wave in M 51 is influencing the interstellar medium and stars similarly, while the bar potential in M 83 has a different influence on the interstellar medium from that on the stars.
Log-log plots of the star formation rate surface densities against those of the gas traced by spectral lines (i.e., of HI and CO) had slopes of whether total gas or just molecular gas surface density. For the plots with gas surface densities traced by the continuum emission, the slopes were whether total gas (using continuum only) or just molecular (using continuum with HI subtracted) gas surface densities. These plots, especially with the continuum tracers, show a threshold gas surface density at which the SFR rises by two or more orders of magnitude. The existence of this threshold gas surface density is insensitive to within a factor of 3 for the adopted . The value of this threshold density is . This threshold is somewhat less conspicuous in the spectral line tracers than for the continuum tracers.
The fitted slopes suggest that the depletion of the molecular gas occurs first at small galactocentric radii and then at increasing radii in an inside-out galactic evolution. This is seen more clearly in maps of the ratio of the surface densities of the SFR to that of the molecular gas. For both these galaxies and the continuum tracer, the molecular gas depletion time in the centres is about 1 Gyr, rising at radii of 6-8 kpc to around 10-20 Gyr. Further out, the depletion times rise by one or two orders of magnitude. The spectral line tracer, i.e. CO , suggests molecular gas depletion times in the outer disks that are appreciably less than 10-20 Gyr.
The images of the inverse depletion time show signs of spiral structure. Superficially, this suggests that spiral arms effect the SFR beyond just heightening the gas surface density. However, correcting for the X-factor spatial variation and for the spatial variation of the removes or nearly removes such spiral structure. This apparently confirms the result of (Foyle et al., 2010) that the arms merely heighten the SFR in the same proportion as they heighten the gas surface density. Greater spatial resolution is required for confirming this result.
In the future, we need deeper mapping of molecular tracers in the outer disks of these spiral galaxies. As well, a better method of calibrating the at millimetre wavelengths is needed. So far, the method employed in the current work is functional, but only crudely. Either a new method or refinement of the method described here is necessary.
Consultations with Rich Rand, Divakara Mayya, Daniel Rosa are greatly appreciated. We also thank the anonymous referee, whose comments noticeably improved the manuscript.
References
- Aniano et al. (2012) Aniano, G. et al. 2012, ApJ, 756, 138
- Baes et al. (2014) Baes, M, Allaert, F., Sarzi, M., de Looze, I., Fritz, J., Gentile, G., Hughes, T. M., Puerari, I., Smith, M. W. L., and Viaene, S. 2014, MNRAS, 444, L90
- Baillard et al. (2011) Baillard, A., Bertin, E., de Lapparent, V., Fouqué, P., Arnouts, S., Mellie, Y., Pelló, R., Leborgne, J.-F., Prugniel, P., Makarov, D., Makarova, L., McCracken, H. J., Bijaoui, A., and Tasca, L. 2011, A&A, 532, 74
- Bendo et al. (2012) Bendo, G. J., Boselli, A., Dariush, A., Pohlen, M., Roussel, H., Sauvage, M., Smith, M. W. L., Wilson, C. D., Baes, M., Cooray, A., Clements, D. L., Cortese, L., Foyle, K., Galametz, M., Gomez, H. L., Lebouteiller, V., Lu, N., Madden, S. C., Mentuch, E., O’ Halloran, B., Page, M. J., Remy, A., Schulz, B., and Spinoglio, L., 2012, MNRAS, 419, 1833
- Bigiel et al. (2008) Bigiel, F., Leroy, A., Walter, F., Brinks, E., de Blok, W. J. G., Madore, B., and Thornley, M. D. 2008, AJ, 136, 2846
- Blasco-Herrera et al. (2010) Blasco-Herrera, J., Fathi, K., Beckman, J., Gutiérrez, L., Lundgren, A., Epinat, B., Östlin, G., Font, J., Hernandez, O., de Denus-Baillargeon, M.-M., and C. Carignan, C. 2010, MNRAS, 407, 2519
- Block & Puerari (1999) Block, D.L., Puerari, I., 1999, A&A 342, 627
- Bourne et al. (2012) Bourne, N. et al. 2012, MNRAS, 421, 3027
- Boselli et al. (2010) Boselli, N. et al. 2010, A&A, 518, L61
- Boselli et al. (2012) Boselli, N., Ciesla, L., Cortese, L., Buat, V., Boquien, M., Bendo, G. J., Boissier, S., Eales, S., Gavazzi, G., Hughes, T. M., Pohlen, M., Smith, M. W. L., Baes, M., Bianchi, S., Clements, D. L., Cooray, A., Davies, J., Gear, W. K., Madden, S. C., Magrini, L., Panuzzo, P., Remy, A., Spinoglio, L., and Zibetti, S. 2012, A&A 540, 54
- Bresolin et al. (2004) Bresolin, F., Garnett, D. R., and Kennicutt, R. C. 2004, ApJ, 615, 228
- Bresolin et al. (2009) Bresolin, F., Ryan-Weber, E., Kennicutt, R. C., and Goddard, Q. 2009, ApJ, 695, 580
- Calzetti et al. (2007) Calzetti, D., Kennicutt, R. C., Engelbracht, C. W., Leitherer, C., Draine, B. T., Kewley, L., Moustakas, J., Sosey, M., Dale, D. A., Gordon, K. D., Helou, G. X., Hollenbach, D. J., Armus, L., Bendo, G., Bot, C., Buckalew, B., Jarrett, T., Li, A., Meyer, M., Murphy, E. J., Prescott, M., Regan, M. W., Rieke, G. H., Roussel, H., Sheth, K., Smith, J. D. T., Thornley, M. D., Walter, F. 2007, ApJ, 666, 870
- Calzetti et al. (2012) Calzetti, D., Liu, G., and Koda, J. 2012, ApJ, 752, 98
- Clark & Glover (2014) Clark, P. C., and Glover, S. C. O. 2014, MNRAS, 444, 2396
- Clark & Glover (2015) Clark, P. C., and Glover, S. C. O. 2015, MNRAS, 452, 2057
- Clark et al. (2012) Clark, P. C., Glover, S. C. O., Klessen, R. S., and Bonnell, I. A. 2012, MNRAS, 424, 2599
- Colombo et al. (2014) Colombo, D., et al. 2014, ApJ, 784, 4
- Considère & Athanassoula (1988) Considère, S. and Athanassoula, E., 1988, A&AS 76, 365
- Cooper et al. (2012) Cooper, E. M., Wilson, C. D., Foyle, K., Bendo, G., Koda, J., Baes, M., Boquien, M., Boselli, A., Ciesla, L., Cooray, A., Eales, S., Galametz, M., Lebouteiller, V., Parkin, T., Roussel, H., Sauvage, M., Spinoglio, M., and Smith, M. W. L. 2012, ApJ, 755, 165
- Cortese et al. (2012) Cortese, L., Ciesla, L., Boselli, A., Bianchi, S., Gomez, H., Smith, M. W. L., Bendo, G. J., Eales, S., Pohlen, M., Baes, M., Corbeli, E., Davies, J. I., Hughes, T. M., Hunt, L. K., Madden, S. C., Pierini, D., di Serego Alighieri, S., Zibetti, S., Boquien, M., Clements, D. L., Cooray, A., Galametz, M., Magrini, L., Pappalardo, C., Spinoglio, L., and Vlahakis, C. 2012, A&A 540, 52
- Cortese et al. (2014) Cortese, L., et al. 2014, MNRAS, 440, 942
- Crosthwaite et al. (2002) Crosthwaite, L. P., Turner, J. L., Buchholz, L., Ho, P. T. P., and Martin, R. N. 2002, AJ, 123, 1892
- Dahmen et al. (1997) Dahmen, G., Hüttemeister, S., Wilson, T. L., Mauersberger, R., Linhart, A., Bronfman, L., Tieftrunk, A. R., Meyer, K., Wiedenhöver, W., Dame, T. M., Palmer, E. S., May, J., Aparici, J., and Mac-Auliffe, F. 1997, A&AS, 126, 197
- Dahmen et al. (1998) Dahmen, G., Hüttemeister, S., Wilson, T. L., and Mauersberger, R. 1998, A&A 331, 959.
- Dale et al. (2009) Dale, D. A., Cohen, S. A., Johnson, L. C., Schuster, M. D., Calzetti, D., Engelbracht, C. W., Gil de Paz, A., Kennicutt, R. C., Lee, J. C., Begum, A., Block, M., Dalcanton, J. J., Funes, J. G., Gordon, K. D., Johnson, B. D., Marble, A. R., Sakai, S., Skillman, E. D., van Zee, L., and Walter, F., Weisz, D. R., Williams, B., Wu, S.-Y., Wu, Y., 2009, ApJ, 703, 517
- Dettmar & Heithausen (1989) Dettmar, R.-J. and Heithausen, A. 1989, ApJL, 344, L61
- Dobbs (2015) Dobbs, C. L 2015, MNRAS, 447, 3390
- Dobbs et al. (2010) Dobbs, C. L., Theis, C., Pringle, J. E., and Bate, M. R. 2010, MNRAS, 403, 625
- Draine (2003) Draine, B. T. 2003, ARA&A, 41, 241
- Dunne et al. (2011) Dunne, L. et al. 2011, MNRAS, 417, 1510
- Eales et al. (2010) Eales, S. et al. 2010, A&A, 518, L62
- Evans (1980) Evans, N. J. 1980, IAU Symp. 87, Interstellar Molecules, (Dordrect: D. Reidel), p 1.
- Evans (1999) Evans, N. J. 1999, ARAA, 37, 311
- French et al. (2015) French, K. D., Yang, Y., Zabludoff, A., Narayanan, D., Shirley, Y., Walter, F., Smith, J.-D., and Tremonti, C. A. 2015, ApJ, 801, 1
- Foyle et al. (2010) Foyle, K., Rix, H.-W., Walter, F., and Leroy, A. K. 2010, ApJ, 725, 534
- Foyle et al. (2013) Foyle, K., Natale, G., Wilson, C. D., Popescu, C. C., Baes, M., Bendo, G. D., Boquien, M., Boselli, A., Cooray, A., Cormier, D., De Looze, I., Fischera, J., Karczewski, O. L., Leboutilleur, V., Madden, S., Pereira-Santaella, M., Smith, M. W. L., Spinoglio, L., and Tuffs, R. J. 2012, MNRAS, 432, 2182
- Foyle et al. (2012) Foyle, K., Wilson, C. D., Mentuch, E., Bendo, G., Dariush, A., Parkin, T., Pohlen, M., Sauvage, M., Smith, M. W. L., Roussel, H., Baes, M., Boquien, M., Boseli, A., Clements, D. L., Cooray, A., Davies, J. I., Eales, S. A., Madden, S., Page, M. J., Spinoglio, L. 2012, MNRAS, 421, 2917
- Fritz et al. (2012) Fritz, J., et al. 2012, A&A, 546, 34
- Fukui et al. (1999) Fukui, Y., Mizuno, N., Yamaguchi, R., Mizuno, A., Onishi, T., Ogawa, H., Yonekura, Y., Kawamura, A., Tachihara, K., Xiao, K., Yamaguchi, N., Hara, A., Hayakawa, T., Kato, S., Abe, R., Saito, H., Mano, S., Matsunaga, K., Mine, Y., Moriguchi, Y., Aoyama, H., Asayama, S., Yoshikawa, N., and Rubio, M. 1999, PASJ, 51, 745
- Gordon et al. (2010) Gordon, K. D., Galliano, F., Hony, S., Bernard, J.-P., Bolatto, A., Bot, C., Engelbracht, C., Hughes, A., Israel, F. P., Kemper, F., Kim, S., Li, A., Madden, S. C., Matsuura, M., Meixner, M., Misselt, K., Okumura, K., Panuzzo, P., Rubio, M., Reach, W. T., Roman-Duval, J., Sauvage, M., Skibba, R., and Tielens, A. G. G. M. 2010 A&A 518, L89
- González Delgado et al. (2014) González Delgado, R. M., et al. 2014, A&A, 562, 47
- Groves et al. (2015) Groves, B. A., et al. 2015, ApJ, 799, 96
- Hagiwara et al. (2001) Hagiwara, Y., Henkel, C., Menten, K. M.; Nakai, N. 2001, ApJ, 560, 37
- Helfer et al. (2003) Helfer, T. T., Thornley, M. D., Regan, M. W., Wong, T., Sheth, K., Vogel, S. N., Blitz, L., Bock, D., C.-J. 2003, ApJS, 145, 259
- Heiderman et al. (2010) Heiderman, A., Evans, N. J., Allen, L. E., Huard, T., and Heyer M. 2010, ApJ, 723, 1019
- Heyer et al. (2004) Heyer, M. H., Corbelli, E., Schneider, S. E., and Young, J. S. 2004, ApJ, 602, 723
- Hughes et al. (2013) Hughes, A. 2013, ApJ, 779, 46
- Israel (1988) Israel, F. P. 1988, Millimetre and Submillimetre Astronomy, Summer School, Stirling, Scotland, (Dordrecht: Kluwer), p. 281
- Israel (1997) Israel, F. P. 1997, A&A, 317, 65
- Israel (1997a) Israel, F. P. 1997, A&A, 328, 471
- James et al. (2002) James, A., Dunne, L., Eales, S., and Edmunds, M. 2002, MNRAS, 335, 753
- Kalnajs, A. (1975) Kalnajs, A., 1975, in La Dynamique des galaxies spirales. Colloques Internationaux du CNRS 241, Ed. L. Weliachew, 103
- Karachentsev et al. (2002) Karachentsev, I. D., Sharina, M. E., Dolphin, A. E., Grebel, E. K., Geisler, D., Guhathakurta, P., Hodge, P. W., Karachentseva, V. E., Sarajedini, A., and Seitzer, P. 2002, A&A, 385, 21
- Kennicutt (1989) Kennicutt, R. C. 1989, ApJ, 344, 685
- Kennicutt (1998) Kennicutt, R. C. 1998, ApJ, 498, 541
- Kennicutt et al. (2003) Kennicutt, R. C. et al. 2003, PASP, 115, 928
- Kirkpatrick et al. (2014) Kirkpatrick, A., Calzetti, D., Kennicutt, R., Galametz, M., Gordon, K., Groves, B., Hunt, L., Dale, D., Hinz, J., and Tabatabaei, F. 2014, ApJ, 789, 130
- Komugi et al. (2011) Komugi, S., Tosaki, T., Kohno, K., Tsukagoshi, T., Nakanishi, K., Sawada, T., Kawabe, R., Ezawa, H., Kuno, N., Onodera, S., Tamura, Y., Wilson, G. W., Yun, M. S., Scott, K. S., Perera, T. A., Austermann, J. E., Hughes, D. H., Aretxaga, I., Tanaka, K., Muraoka, K., Miura, R., and Egusa, F. 2011, PASJ, 63, 1139
- Kutner (1984) Kutner, M. L. 1984, Fundamentals of Cosmic Physics, 9, 233
- Lada et al. (2013) Lada, C. J., Lombardi, M., Roman-Zuniga, C., Forbrich, J., and Alves, J. F. 2013, ApJ, 778, 133
- Lagos et al. (2012) Lagos, C. d. P., Bayet, E., Baugh, C. M., Lacey, C. G., Bell, T. A., Fanidakis, N. and Geach, C. G. 2012, MNRAS, 426, 2142
- Langer et al. (2014) Langer, W. D., Velusamy, T., Pineda, J. L., Willacy, K., and Goldsmith, P. F. 2014, A&A, 561, 122
- Leroy et al. (2013) Leroy, A. K., Walter, F., Sandstrom, K., Schruba, A., Muñoz-Mateos, J.-C., Bigiel, F., Bolatto, A., Brinks, E., de Blok, W. J. G., Meidt, S., Rix, H.-W., Rosolowsky, E., Schinnerer, E., Schuster, K.-F., and Usero, A. 2013, ApJ, 146, 19
- Li & Draine (2001) Li, A. and Draine, B. T. 2001, ApJ, 554, 778
- Lombardi et al. (2014) Lombardi, M., Bouy, H., Alves, J., Lada, C. J., 2014, A&A, 566, 45
- Lundgren et al. (2004) Lundgren, A. A., Wiklind, T., Olofsson, H., and Rydbeck, G. 2004, A&A, 413, 505
- Madden et al. (1997) Madden, S. C., Poglitsch, A., Geis, N., Stacey, G. J., and Townes, C. H. 1997, ApJ, 483, 200
- Magnelli et al. (2012) Magnelli, B., Santonge, A., Lutz, D., Tacconi, L. J., Berta, S., Bournaud, F., Charmandaris, V., Dannerbauer, H., Elbaz, D., Förster-Schreiber, N. M., Graciá-Carpio, J., Ivison, R., Maiolino, R., Nordon, R., Popesso, P., Rodighiero, G., Santini, P., and Wuyts, S. 2012, A&A, 548, 22
- Maloney & Black (1988) Maloney, P. R. and Black, J. H. 1988, ApJ, 325, 389
- Meijerink et al. (2005) Meijerink, R., Tilanus, R. P. J., Dullemond, C. P., Israel, F. P., and van der Werf, P. P. 2005, A&A, 430, 427
- Meidt et al. (2013) Meidt, S. E., et al. 2013, ApJ, 779, 45
- Meurer et al. (2006) Meurer, G. R. et al. 2006, ApJS, 165, 307
- Miller et al. (2009) Miller, E. D., Bregman, J. N., Wakker, B. P. 2009, ApJ, 692, 470
- Moore et al. (2012) Moore, T. J. T., Urquhart, J. S., Morgan, L. K., and Thompson, M. A. 2012, MNRAS, 426, 701
- Nakai & Kuno (1995) Nakai, N. and Kuno, N. 1995, PASJ, 47, 761
- Narayanan et al. (2011) Narayanan, D., Krumholz, M., Ostriker, E. C., Hernquist, L. 2011, MNRAS, 418, 664
- Narayanan et al. (2012) Narayanan, D., Krumholz, M., Ostriker, E. C., Hernquist, L. 2012, MNRAS, 421, 3127
- Neininger et al. (1993) Neininger, N., Beck, R., Sukumar, S., and Allen, R. J. 1993 A&A, 274, 687
- Nishiyama et al. (2001) Nishiyama, K., Nakai, N., and Kuno, N. 2001, PASJ, 53, 757
- Ossenkopf & Henning (1994) Ossenkopf, V. and Henning, T. 1994, A&A, 291, 943
- Paglione et al. (2001) Paglione, T. A. D., Wall, W. F., Young, J. S. Heyer, M. H., Richard, M., Goldstein, M., Kaufman, Z., Nantais, J., and Perry, G. 2001, ApJs, 135, 183
- Pan et al. (2014) Pan, H.-A., Kuno, N., and Hirota, A. 2014, PASJ, 66, 27
- Papadopolis et al. (2012) Papadopolis, P. P., van der Werf, P., Xilouris, E., Isaak, K. G., Gao, Y. 2012, ApJ, 751, 10
- Parkin et al. (2013) Parkin, T. J., Wilson, C. D., Schirm, M. R. P. Baes, M., Boquien, M., Boselli, A., Cooray, A., Cormier, D., Foyle, K., Karczewski, O. L., Lebouteiller, V., de Looze, I., Madden, S. C., Roussel, H., Sauvage, M., and Spinoglio, L. 2013, ApJ, 776, 65
- Pineda et al. (2014) Pineda, J. L., Langer, W. D., and Goldsmith, P. F. 2014, A&A, 570, 121
- Planck Collaboration (2011) Planck Collaboration 2011, A&A, 536, 16
- Planck Collaboration (2011a) Planck Collaboration 2011, A&A, 536, 19
- Planck Collaboration (2011b) Planck Collaboration 2011, A&A, 536, 25
- Press et al. (1992) Press, W. H., Teukolsky, S. A., Vetterling, W. T., and Flannery, B. P. 1992, Numerical Recipes in Fortran – The Art of Scientific Computing, Second Edition, Cambridge University Press, Cambridge.
- Puerari & Dottori (1992) Puerari, I., Dottori, H.A. 1992, A&AS 93, 469
- Rand (1993) Rand, R. J. 1993, ApJ, 410, 68
- Rand & Kulkarni (1990) Rand, R. J., and Kulkarni, S. R. 1990, ApJL, 349, L43
- Reach et al. (1998) Reach, W. T., Wall, W. F., Odegard, N. 1998, ApJ, 507, 507
- Regan (2000) Regan, M. W. 2000, ApJ, 541, 142
- Regan et al. (2001) Regan, M. W., Thornley, M. D., Helfer, T. T., Sheth, K., Wong, T., Vogel, S. N., Blitz, L., Bock, D. C.-J. 2001, ApJ, 561, 218
- Regan (2006) Regan, M. W., Thornley, M. D., Vogel, S. N., Sheth, K., Draine, B. T., Hollenbach, D. J., Meyer, M., 1 Dale, D. A., Engelbracht, C. W., Kennicutt, R. C., Armus, L., Buckalew, B., Calzetti, D., Gordon, K. D., Helou, G., Leitherer, C., Malhotra, S., Murphy, E., Rieke, G. H., Rieke, M. J., and Smith, J. D., 2006, ApJ, 652, 1112
- Rickard & Blitz (1985) Rickard, L. J. and Blitz, L. 1985, ApJ, 292, L57
- Roman-Duval et al. (2010) Roman-Duval, J., Israel, F. P., Bolatto, A., Hughes, A., Leroy, A., Meixner, M., Gordon, K., Madden, S. C., Paradis, D., Kawamura, A., Li, A., Sauvage, M., Wong, T., Bernard, J.-P., Engelbracht, C., Hony, S., Kim, S., Misselt, K., Okumura, K., Ott, J., Panuzzo, P., Pineda, J. L., Reach, W. T., and Rubio, M. 2010, A&A, 518 L74.
- Rowlands et al. (2012) Rowlands, K. et al. 2012, MNRAS, 419, 2545
- Rots et al. (1990) Rots, A. H., Bosma, A., van der Hulst, J. M., Athanassoula, E., Crane, P. C. 1990, AJ, 100, 387
- Sandstrom et al. (2013) Sandstrom, et al. 2013, ApJ, 777, 5
- Santini et al. (2014) Santini, P., et al. 2014, A&A, 562, 30.
- Saintonge et al. (2012) Saintonge, et al. 2012, ApJ, 758, 73
- Schinnerer et al. (2013) Schinnerer, E., et al. 2013, ApJ, 779, 42
- Schmidt (1959) Schmidt, M. 1959, ApJ, 129, 243
- Shetty et al. (2007) Shetty, R., Vogel, S. N., Ostriker, E. C., and Teuben, P. J. 2007, ApJ, 665, 1138
- Shetty (2011) Shetty, R., Glover, S. C., Dullemond, C. P., And Klessen, R. S. 2011, MNRAS, 412, 1686
- Shetty (2011a) Shetty, R., Glover, S. C., Dullemond, C. P., Ostriker, E. C.; Harris, A. I., Klessen, R. S., 2011, MNRAS, 415, 3253
- Shetty et al. (2013) Shetty, R., Kelly, B. C., Bigiel, F. 2013, MNRAS, 430, 288
- Smith et al. (2012) Smith, M. W. L., Gomez, H. L., Eales, S. A., Ciesla, L., Boselli, A., Cortese, L., Bendo, G. J., Baes, M., Bianchi, S., Clemens, M., Clements, D. L., Cooray, A. R., Davies, J. I., de Looze, I., di Serego Alighieri, S., Fritz, J., Gavazzi, G., Gear, W. K., Madden, S., Mentuch, E., Panuzzo, P., Pohlen, M., Spinoglio, L., Verstappen, J., Vlahakis, C., Wilson, C. D., and Xilouris, E. M. 2012, ApJ, 748, 123
- Smith et al. (2014) Smith, R. J., Glover, S. O. C., Clark, P. C., Klessen, R. S., and Springel, V. 2014, MNRAS, 441, 1628
- Sodroski et al. (1995) Sodroski, T. J., Odegard, N., Dwek, E., Hauser, M. G., Franz, B. A., Freedman, I., Kelsall, T., Wall, W. F., Berriman, G. B., Odenwald, S. F., Bennett, C., Reach, W. T., and Weiland, J. L. 1995, ApJ, 452, 262
- Strong et al. (2004) Strong, A. W., Moskalenko, I. V., Reimer, O., Digel, S., and Diehl, R. 2004, A&A, 422, L47
- Talbot et al. (1979) Talbot, R. J. Jr., Jensen, E. B., and Dufour, R. J. 1979, ApJ, 229, 91
- Tilanus & Allen (1993) Tilanus, R. P. J., and Allen, R. J. A&A, 1993, 274, 707
- Toomre (1964) Toomre, A. 1964, ApJ, 139, 1217
- Tully, R.B. (1974) Tully, R. B. 1974, ApJS, 27, 449
- Verley et al. (2010) Verley, S., Corbelli, E., Giovanardi, C., and Hunt, L. K. 2010, A&A, 510, A64
- Vogel et al. (1988) Vogel, S., Kulkarni, S. R., & Scoville, N. Z. 1988, Nature 334, 442
- Wall et al. (1993) Wall, W. F., Jaffe, D. T., Bash, F. N., Israel, F. P., Maloney, P. R., and Baas, F. 1993, ApJ, 414, 98
- Wall (2007) Wall, W. F. 2007, MNRAS, 379, 674.
- Walter et al. (2008) Walter, F., Brinks, E., de Blok, W. J. G., Bigiel, F., Kennicutt, R. C., Thornley, M. D., and Leroy, A. 2008, AJ, 2563, 136
- Wilson et al. (2008) Wilson, G, Austermann, J. E., Perera, T. A., Scott, K. S., Ade, P. A. R., Block, J. J., Glenn, J., Golwala, S. R., Kim, S., Kang, Y., Lydon, D., Mauskopf, P. D., Predmore, C. R., Roberts, C. M., Souccar, K., and Yun, M. 2008, MNRAS 386, 807
Appendix A Flux Determination
The outer edge to the 1.1 mm continuum emission of M 51 lies at a galactocentric radius of about 14 kpc and for M 83 it is about 12 kpc. The derived fluxes are for M 51 and for M 83 to those outer edges. The uncertainties include the calibration uncertainty of 13% and the uncertainties due to the somewhat arbitrary choices for outer boundaries. The simulations were used to check for systematics in the flux determination, thereby providing correction factors for the derived fluxes. For M 51, this correction factor was 1.5 for M 51 and 0.9 for M 83. These corrections were included in the previously quoted flux values.
Appendix B Determination of Surface Densities and Masses
The 1.1 mm continuum surface-brightness maps of Figures 1 and 2 were ratioed with the Spitzer/MIPs 160, effectively 155.9, maps of M 51 and M 83 (Dale et al., 2009) to produce temperature maps under the assumption that the dust emissivity index, , was 2.0. As stated in the Introduction, this was the most appropriate value for as found from the observations of by Foyle et al. (2012). In practice, the adopted value for will have only a small effect on the derived gas column densities, provided that those derived column densities are calibrated against observed gas column densities. By using those positions where atomic gas dominated the column densities to calibrate the for the continuum-derived column densities, it was found that the column densities derived from the continuum data for to 2.5 did not deviate by more than 30% from those for . Consequently, observations at only two wavelengths are necessary for a reasonable approximation of the gas surface density map.
The derived from the HI comparisons are 2.2- for M 51 and M 83, respectively. These values lead to gas mass estimates that appear to be too low (see Sections 4.3, 5.1, and below in this appendix for details). Foyle et al. (2012) simply adopted the dust mass-absorption coefficient of Li & Draine (2001) and Draine (2003), which is a factor of smaller than the values determined here. Foyle et al. (2012) also determined a higher dust-to-gas mass ratio than that adopted here. This is equivalent to adopting a that is factors of 5.0-5.3 smaller than that derived from the HI comparisons. Because we adopt a constant dust-to-gas ratio, the two cases are referred to as the high- (from HI comparisons) and low- (Li & Draine, 2001; Draine, 2003) cases. Given the low masses that result from the high- case, the HI comparisons must be appropriately modified. The HI comparisons were repeated after removing upper outliers that are apparently unreliable due to possible undetected gas. This results in an intermediate case, where a that is a factor of two lower than that from the simple atomic gas calibration method is found. Unless otherwise stated, all masses and surface densities quoted are for this intermediate- (most realistic) case. This approach yields a roughly 50% uncertainty in column density and mass estimates, using .
The surface brightness at frequency , , is related to the dust-derived gas column density, , by
| (2) |
where is the mean atomic weight per hydrogen atom, is the mass of a hydrogen atom, is the dust-to-gas mass ratio, and is the dust mass absorption coefficient. The mass-absorption coefficient varies with frequency as follows:
| (3) |
in which is dust mass-absorption coefficient at a reference frequency . The dust temperature, , is of course estimated by evaluating expression (2) at frequency , corresponding to the wavelength of 1.1 mm for the JCMT/AzTEC observations, and again at frequency , corresponding to the wavelength of 155.9 for the Spitzer/MIPS observations, and taking the ratio of the two.
As well as using the maps at the two wavelengths (i.e. the JCMT/AzTEC at 1.1 mm and the Spitzer/MIPS map at 155.9), there are many additional details involved in estimating the column densities, . These include estimating the value of (or the product of and ), convolving the AzTEC 1.1 mm map to the resolution of the Spitzer/MIPS 155.9 map, estimating the noise levels in the maps, characterizing any systematic effects introduced into the and maps due to the observations and processing of the AzTEC data, and any relevant colour corrections to the continuum data. In particular, a constant offset correction of - must be added to the column densities for M 51 as dictated by the simulations to correct for inadequately recovering the large-scale emission (but was not applied to the figures).
B.1 The Reliability of Gas Surface Densities and Masses
There are a couple issues that should be addressed in discussing the reliability of gas surface densities and masses as inferred from dust emission in the current work. One issue is to what level calibration differences between that of SPITZER/MIPS and that of HERSCHEL/PACS for their 160 data would affect the results and conclusions of the current work (see Aniano et al., 2012). Another issue is the validity of the simple approach used here instead of using a more detailed dust model (e.g., Li & Draine, 2001). As for the former issue, Aniano et al. (2012) compared the 160 data for both instruments and characterized their systematic differences. Depending on the calibration scheme used, the HERSCHEL/PACS 160 intensities were either 1.6% or 25% systematically higher than those for SPITZER/MIPS. Scaling up the 160 intensities used in the current work by 25% would increase the computed dust temperatures, but by differing amounts depending on initial computed temperature. Most of the those temperatures were determined to be between 10 K and 23 K. After the hypothetical correction, those would be 10.3 K and 25 K. If there were no calibration of the column densities against other data, those corrected temperatures would require the column densities to be corrected downwards by 5% and 11%, respectively. The warmer positions in both galaxies tend to have higher column densities. So the higher column densities would be corrected downwards by more than the lower column densities, on average. This reduces the dynamic range of the determined column densities by roughly 6%. The overall scaling of those column densities would remain unchanged because of the calibration against HI column densities. So, such a correction, were it necessary, would not appreciably change the current results.
As for the second issue, the models of Li & Draine (2001) combined with data at mid-IR and far-IR wavelengths can provide estimates of a number of parameters. For the current work, however, there are two reasons why such an approach was not used. One reason is that, as mentioned in the introduction, the AzTEC 1.1 mm map has more spatial coverage than the HERSCHEL data for both M 51 and M 83. SPITZER does have sufficient spatial coverage for comparison with the AzTEC data, but does not have the long-wavelength data that probes the bulk of the dust mass, other than at 160. So, to consistently treat each entire galaxy, the AzTEC 1.1 mm data were combined with the SPITZER 160 data for both M 51 and M 83. Another reason that the more model-dependent approach was not used is that we need to have model-independent tests that can confirm or refute the validity of the models, as stated recently by Groves et al. (2015). The current work, for example, finds a dust opacity to gas column density ratio at 1.1 mm that is about double that inferred from Li & Draine (2001). But temporarily adopting the of Li & Draine (2001) and adopting the appropriate distance yields nearly identical masses for both the more sophistocated approach (i.e., in Cooper et al., 2012) and the simpler approach (i.e., the current work) for the NGC 5194 field. This strongly suggests that the simpler approach of the current work is reasonable at recovering some basic dust properties.
The dust optical depth to gas column density ratio, , and especially the dust mass absorption coeffient, , can be quite uncertain, ranging from to . (see the following for examples of disparate values: Eales et al., 2010; Li & Draine, 2001; Draine, 2003; James et al., 2002; Dunne et al., 2011; Ossenkopf & Henning, 1994). Accordingly, attempting to measure observationally could narrow the uncertainty. This is most easily observed in gas dominated by atomic hydrogen because the gas column densities are easy to determine. Another approach was followed by Eales et al. (2010) for observations of the galaxies M 99 and M 100 in which they plotted the star formation rate surface density, , against gas surface density and against that for dust, adjusting the until both surface densities agree at large . This resulted in a value corresponding to the unusually low mentioned above.
The large initially derived in the current work was from comparing the observed optical depths at 1.1 mm with the observed gas column densities in regions dominated by atomic gas. The Planck Collaboration (2011a, b) observed at 857 GHz and at 250 in the dust associated with the HI gas within the Galaxy. The Planck Collaboration (2011b) also observed at 250 for the dust associated with molecular gas, which is about double that observed for dust associated with atomic gas, remembering that the is the column density of hydrogen nuclei. At a wavelength of 1.1 mm, these numbers correspond to and for dust associated with HI and for that associated with H2 (using a spectral emissivity index of for the Galaxy, e.g., Planck Collaboration, 2011a, b). The current work initially finds for M 51 and for M 83 for dust along lines of sight with gas column densities dominated by . This is more than double the values observed in our Galaxy and are even 40% larger than the dust associated with in our Galaxy. This large is suspect and requires a re-evaluation of the calibration of at 1.1 mm.
One explanation for the observed large would be CO-dark gas. The presence of such gas can be crudely tested. This is done by starting with dust-derived gas column densities, , that are only roughly calibrated – i.e., to within a factor of a few. The difference then provides a rough measure of molecular gas column density. The ratio (where the is the average used for each galaxy) is a crude measure of the amount of dark gas — a dark ratio. Then can be recomputed using only those positions with dark ratios less than some upper limit. Choosing a dark ratio upper limit as high as 100 reduces the derived by a few percent, while choosing unity yields a that is a factor of about 4 lower. The latter is risky given that this could unnecessarily exclude too many positions with very little dark gas. Accordingly, a more conservative correction factor would be around 2.
Reducing the value by this factor scales up the column densities by the same factor and the X-factor scales in proportion to , or up by a factor of 3 for both M 51 and M 83. The best estimates of these values are hence , corresponding to for for both M 51 and M 83. These are well within a factor of 2 of the values found by the Planck Collaboration (2011a, b) for our Galaxy. The best estimates for the X-factors for M 51 and M 83 are around 1. Table 3 displays the best estimated values for the gas masses and the X-factors. That table shows that roughly half of the total mass of the gas is unaccounted for using spectral lines. This is discussed further in Section 5.1.
Possible spatial variations in should also be considered. Both M 51 and M 83 show decreases in by about 15-20% in going from galactocentric radii of 1 or 2 kpc to about 6 or 7 kpc. Correcting for the CO-dark gas changes this result. The problem is that the numbers of points used in the comparisons becomes very small (i.e. ) when the upper limit to the dark ratio is reduced. Such small numbers do not give reliable estimates of . So the radial spatial variation of is uncertain, although there is no clear evidence that it has a strong radial variation. In going from interarm positions to spiral arm positions, the in M 51 decreases by 18%. In M 83, this decrease is 8%. Again, correcting for the CO-dark gas changes these results to 25% for M 51 and an 11% increase for M 83, although the number of points available for the estimation is not really sufficient.
Appendix C Determination of the X-Factor Maps
The X-factor, , can be straightforwardly computed from
| (4) |
Given that , , and are all maps, is also a map, but not a very extended map because of the mounting uncertainties that result from the numerous computations with pre-existing data required to reach . Both the M 51 and M 83 maps do not extend beyond about 7 kpc from the centre of each map, mostly because the CO maps do not extend further than that. Figures 12, 13, 14, and 15 show the X-factor maps and radial profiles for M 51 and M 83. The mean values of the X-factor listed in Table 4, which we call , are the -weighted means of each map and only really applies to the central 7 kpc radius in each galaxy.
Given that the CO emission falls to the noise level at a radius of about 7 to 8 kpc, we are unable to compute beyond that in the outer disks. Nevertheless, we can use the radial curves of Figures 9 and 11 to infer rough lower limits on in the outer disks. The radial variation of with respect to the mean value in the inner disk, , is a simple variation on expression (4):
| (5) |
where is the molecular gas column density estimated from a spatially constant X-factor: . This measure of the column density is very noisy in these observations of the outer disks and a useful proxy is necessary for inferring some crude lower limit on for radii beyond 8 kpc. The proxy adopted for was a pessimistic estimate of the 3-sigma uncertainties of the gas column density, i.e., . This gives the most conservative (i.e. least extreme) estimates for beyond a radius of 8 kpc. For M 51, even in the high- (low-) case, the above proxy yields lower limits to of roughly to ( to ) depending on the radius in the outer disk. For M 83, even in the high- (low-) case, these rough lower limits to are to ( to ).
Appendix D Considerations of the Comparison between SFR and Gas Surface Densities
The logarithm of the SFR surface density is plotted against that of the gas surface density for different tracers of that gas surface density. The plots of the surface densities of SFR versus gas are displayed in Figure 16. The uncertainty of each fitted slope is the formal error of the fit and was scaled by the square-root of the reduced chi-square in order to give a more conservative and more realistic estimate of this formal error. One important consideration in these fits is that the spatial resolution of the M 51 data is limited to 38′′, because of the Spitzer 160 resolution. For M 83 this resolution is 55′′ resolution due to the CO observations. Given that each point in these plots represents a single pixel, the effective number of independent points in each plot is the number of pixels divided by 20 for M 51 and by 55 for M 83. Nevertheless, the linear resolution on each galaxy is about the same, with 1.5 kpc for M 51 and 1.2 kpc for M 83.
Appendix E Considerations for Creating Star Formation Rate Surface Density Maps
The SFR surface density maps were created from images in the H line and in the 24 continuum. According to Calzetti et al. (2007), the SFR, , within a source is given by
| (6) |
is the integrated luminosity of the H line in ; is the frequency corresponding to the wavelength of 24; is the luminosity of the 24 continuum per unit frequency bandwidth in ; ; ; is in units of . If is the SFR surface density, then , where is the source solid angle and D is the source distance. Using , where is the source flux, and also using , with as the source surface brightness, results in
| (7) |
For in units of , in units of , and in units of , we have and . The numerical value of remains unchanged.
Specifically for M 51 and M 83, the SFR surface density maps were created by applying expression (7) to the H (i.e., the line-integrated images of Kennicutt et al., 2003; Blasco-Herrera et al., 2010) and the Spitzer 24 images (Dale et al., 2009) of both galaxies. The images were convolved to the appropriate resolution and rebinned to 9′′ pixels. The image was converted to units of . The final spatial resolution of the SFR surface density map for M 51 is 38′′, which is that of the Spitzer 160 image. For M 83 this is 55′′, which is that of the CO map. The negative tails of the histograms of pixel values provided estimates of the noise levels.
Appendix F Relationship between the X-Factor and the Star Formation Rate Surface Density
The physical models of Clark & Glover (2015) explore the possible dependence of the X-factor on the the star formation rate. In their Section 5.1, their results can be parameterized in the form
| (8) |
where they find . With the results of the fits illustrated in Figure 16, we can test this result as well as specify the parameter .
We repeat the derivation in Section 5.1 of Clark & Glover (2015) in more detail and adopt their nomenclature where applicable. If CO (1-0) is used to estimate the H2 surface density, , then we let represent this surface density as estimated by CO. Then
| (9) |
where is the power-law index that is observed when using CO-derived molecular gas surface densities and is the mean X-factor value chosen for the galaxy observed.444Notice that the value chosen for is unimportant because it is the combination that matters. Using a tracer that supposedly gives the “true” , would have a similar relation:
| (10) |
where is the actual correct power-law index and is the correct point-by-point value of the X-factor. Combining expressions (9) and (10) so as to eliminate and comparing with (8) yields
| (11) |
and also,
| (12) |
In the context of the current work, we assume that the dust tracers of the molecular gas give (i.e., ). So the fits in the second panels of Figure 16 yield the parameters and for M 51 and M 83. The fits in the fourth panels provide and . The uncertainties of these quantities are likely dominated by systematics. This means that has a roughly 50% uncertainty. The effects of systematics on are difficult to estimate. The formal uncertainties of using the current data are 3-4%.