FastCap: An Efficient and Fair Algorithm for Power Capping in Many-Core Systems
Abstract
Future servers will incorporate many active low-power modes for different system components, such as cores and memory. Though these modes provide flexibility for power management via Dynamic Voltage and Frequency Scaling (DVFS), they must be operated in a coordinated manner. Such coordinated control creates a combinatorial space of possible power mode configurations. Given the rapid growth of the number of cores, it is becoming increasingly challenging to quickly select the configuration that maximizes the performance under a given power budget. Prior power capping techniques do not scale well to large numbers of cores, and none of those works has considered memory DVFS.
In this paper, we present FastCap, our optimization approach for system-wide power capping, using both CPU and memory DVFS. Based on a queuing model, FastCap formulates power capping as a non-linear optimization problem where we seek to maximize the system performance under a power budget, while promoting fairness across applications. Our FastCap algorithm solves the optimization online and efficiently (low complexity on the number of cores), using a small set of performance counters as input. To evaluate FastCap, we simulate it for a many-core server running different types of workloads. Our results show that FastCap caps power draw accurately, while producing better application performance and fairness than many existing CPU power capping methods (even after they are extended to use of memory DVFS as well).
I Introduction
As power and energy become increasingly significant concerns for server systems, servers have started to incorporate an increasing number of idle low-power states (such as CPU sleep states) and active low-power modes of execution (such as CPU DVFS states). Researchers have also proposed active low-power modes for the main memory subsystem [1, 2, 3], for disk drives [4, 5], and for interconnects [6]. Liu et al. [7, 8] and Vega et al. [9] showed that CPU active low-power modes and idle low-power states can jointly achieve high energy efficiency. In contrast, Meisner et al. suggested that active low-power modes are the only acceptable alternative for conserving energy in the face of interactive workloads [10]. Deng et al. showed that the management of CPU and memory active low-power modes must be coordinated for stability and increased energy savings [11]. Since the CPU power modes affect the traffic seen by the memory subsystem and the memory power mode affects how fast cache misses are serviced, a lack of coordination may leave the system unable to properly manage energy consumption and performance.
Like [11], we consider both CPU and memory active low-power modes. However, instead of maximizing energy savings within a performance bound, we consider maximizing application performance under a full-system power consumption cap/budget. Such power capping is important because provisioning for peak power usage can be expensive, so designers often want to oversubscribe the power supply at multiple levels [12, 13].
A lack of coordination hampers a system’s ability to maximize performance under a full-system power cap. To see an example, suppose that the applications are mostly memory-bound, and just changed behavior, causing the system power consumption to decrease substantially below the power budget. In this situation, the CPU power manager (which does not understand memory power and assumes that it will stay the same regardless of the cores’ frequencies) might decide that it could improve performance by increasing the core voltage/frequency and bringing the system power very close to the budget. The near-budget power consumption would prevent the (independent) memory power manager from increasing the memory frequency. Adhering to the power budget in this way would produce more performance degradation than necessary, since the applications would have benefited more from a memory frequency increase than core frequency increase(s). The situation would have been better, if the memory power manager had run before the CPU power manager. However, in this case, a similar problem would have occurred for CPU-bound applications.
Coordination is especially important when maximizing performance under a server power cap for three reasons: (1) exceeding the server power budget for too long may cause temperatures to rise or circuit breakers to trip; (2) it may be necessary to purchase more expensive cooling or power supply infrastructures to achieve the desired application performance; and (3) even when the power capping decisions are made at a coarser grain (e.g., rack-wise), individual servers must respect their assigned power budgets.
The abundance of active low-power modes provides great flexibility in performance-aware power management via DVFS. However, the need for coordinated management creates a combinatorial space of possible power mode configurations. This problem is especially acute for future many-core servers, especially when they run many applications (each with a potentially different behavior), since it is unlikely that the power mode selected for a core running one application can be used for a core running another one. Quickly traversing the large space of mode combinations to select a good configuration as applications change behavior is difficult. For small core counts and in the absence of memory DVFS, Isci et al. [14] proposed exhaustive search for the challenging scenario in which the server runs as many applications as cores. The time complexity of the search increases exponentially in the number of cores and, thus, their approach does not scale to large core counts. More recent works (e.g., [15, 16]) have improved on Isci’s exhaustive search, but never addressed the combination of CPU and memory DVFS. Moreover, most prior works attempt to maximize instruction throughput, which causes an unfair power allocation across applications (CPU-bound applications tend to get a larger share of the power).
With these observations in mind, in this paper we propose FastCap, a methodology and search algorithm for performance-aware full-system power capping via both CPU and memory DVFS. FastCap efficiently selects voltage/frequency configurations that maximize a many-core system’s performance, while respecting a user-provided power budget. Importantly, FastCap also enforces fairness across applications, so its performance maximization is intended to benefit all applications equally instead of seeking only the highest possible instruction throughput. FastCap has very low time complexity (linear in the number of cores), despite the combinatorial number of possible power mode configurations.
To devise FastCap, we first develop a queuing model that effectively captures the workload dynamics in a many-core system (Section III-A). Based on the queuing model, we formulate a non-linear optimization framework for maximizing the performance under a given power budget (Section III-B). To solve the optimization problem, we make a key observation that core frequencies can be determined optimally in linear time for a given memory frequency. We develop the FastCap algorithm (Algorithm 1) and implement it to operate online. The operating system runs the algorithm periodically (once per time quantum, by default), and feeds a few performance counters as inputs to it (Section III-C).
We highlight two aspects of FastCap: (1) it does OS-based full-system power capping, as the performance- and fairness-aware joint selection of CPU and memory DVFS modes is too complex for hardware to do; and (2) it enforces caps at a relatively fine per-quantum (e.g., several milliseconds) grain, as rapid control may be required depending on the part of the power supply infrastructure (e.g., server power supply, blade chassis power supplies, power delivery unit, circuit breaker) that has been oversubscribed and its time constants. Moreover, capping power efficiently at a fine granularity is more challenging than doing so at a coarse one. Nevertheless, FastCap assumes that the server hardware is responsible for countering power spikes at even shorter granularities, if this is necessary.
To evaluate FastCap, we simulate it for a server running different types of workloads (Section IV). (A real implementation is not possible mainly as FastCap applies memory DVFS, which has recently been proposed in [1, 3] and is not yet readily available in commercial servers.) Our results show that FastCap maintains the overall system power under the budget while maximizing the performance of each application. Our results also show that FastCap produces better application performance and fairness than many state-of-the-art policies (even after they are extended to use memory DVFS as well), because of its ability to fairly allocate the power budget and avoid performance outliers. Finally, our results demonstrate that FastCap behaves well in many scenarios, including different processor architectures (in-order vs. out-of-order execution), memory architectures (single vs. multiple memory controllers), numbers of cores, and power budgets.
II Related Work and Contributions
Though they have not considered memory DVFS, many prior works have proposed using a global controller to coordinate cores’ DVFS subject to a CPU-wide power budget, e.g. [14, 15, 16]. Next, we overview some of the works in this area.
Optimization approaches. Sharkey et al. [16] studied different designs and suggested that global power management is better than a distributed method in which each core manages its own power. They also argued that all cores receiving equal share of the total power budget is preferred over a dynamic power redistribution, due to the complexity of the latter approach. Isci et al. [14] used exhaustive search over pre-computed power and performance information about all possible power mode combinations. Their algorithm’s time and storage space complexities grow exponentially with the number of cores. Teodorescu et al. [17] developed a linear programming method to find the best DVFS settings under power constraints. However, they assumed power is linearly dependent on the core frequency, which is often a poor approximation. Meng et al. [18] developed a greedy algorithm that starts with maximum speeds for all cores and repeatedly selects the neighboring lower global power mode with the best ratio. The algorithm may traverse the entire space of power mode combinations. Winter et al. [19] improved this algorithm using a max-heap data structure and reduced the complexity to , where is the number of core frequencies and is the number of cores. They also developed a heuristic that runs in only time. Bergamaschi et al. [20] formulated a non-linear optimization and solved it via the interior-point method. The method usually takes many steps to converge and its average complexity is a high polynomial in the number of cores.
Table I lists some representative works and their time complexity. We also contrast them with FastCap as a preview.
| Method | Complexity | Mem. DVFS |
|---|---|---|
| Exhaustive [14] | No | |
| Numeric Opt.[20, 17] | for LP | No |
| Heuristics [18, 19] | No | |
| FastCap | Yes |
Control-theoretic approaches. Mishra et al. [21] studied power management in multi-core CPUs with voltage islands. They assumed that the power-frequency model (power consumption as a function of the cores’ frequencies) is fixed for all islands, which may be inaccurate under changing workload dynamics. Ma et al. [22] used a method that stabilizes the power consumption by adjusting a frequency quota for all cores. In a similar vein, Chen et al. [23] used a control-theoretic method along with (idle) memory power management via rank activation/deactivation. Unfortunately, rank activation/deactivation is too slow for many applications [10]. Moreover, [22, 23] require a linear power-frequency model, which may cause under- and over-correction in the feedback control due to poor accuracy. This may lead to large power fluctuations, though the long-term average power is guaranteed to be under the budget.
Other related works. Shen et al. [24] recently considered power capping in servers running interactive applications. They used model-based, per-request power accounting and CPU throttling (not DVFS) for requests that exceed their fair-share power allocation (each request is given the same power budget). Thus, their notion of fairness relates to the power consumption, not the performance, of different requests. Ge et al. [25] developed a runtime system on CPU for power aware HPC computing. However they do not consider the impact on memory. Sarood et al. [26] proposed a software-based online resource management system for building power-efficient datacenter clusters. Sasaki et al. [27] considered power capping at the thread level. They designed a run-time algorithm to distribute power budget to each application in terms of the number of cores and operating frequency. Ma et al. [28] studied the power budgeting for multi-core CMPs together with the L2 cache. Also recently, Jha et al. [29] used local Pareto front generation, followed by global utility-based power allocation to traverse the large search space of system-wide power settings. There are also works that utilize auction theory [30] and machine learning approaches [31].
FastCap contributions. There has not been any prior work that jointly considers CPU and memory DVFS in power capping.
Though effective in the scenarios they targeted, the prior works in power capping are computationally expensive (e.g., [14, 17, 20]), assume potentially inaccurate linear power models (e.g., [21, 22, 23]), require expensive offline profiling and model construction (e.g., [31, 32]), or may be expensive in practice (e.g., [33]).
FastCap differs from these works in many ways. First, it selects active (DVFS) power modes for the cores and memory in tandem. Second, it enforces a fair allocation of the power across the applications running on the system based on their performance, i.e. an application may receive a larger share of the overall power budget simply because it needs more power to match the performance loss imposed on other applications. Third, it leverages a queuing-based performance model and a dynamically adjusting power model to make frequency selection decisions with low time complexity. Finally, our evaluation shows that FastCap produces better application performance and fairness than many prior approaches, even when they are extended to use both CPU and memory DVFS.
III FastCap
III-A System model
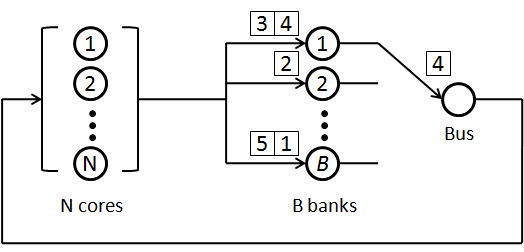
FastCap models a system with (in-order) cores, memory banks, and a common memory bus for data transfers. (We also study out-of-order cores in Section IV-B.) Denote by the set of cores. We assume each core runs one application and we name the collection of applications as a workload. We use a closed-network queuing model, as depicted in Figure 1.
Many-core performance. Every core periodically issues memory access requests (resulting from last-level cache misses and writebacks) independently of the other cores. Though the following description focuses on cache misses for simplicity, FastCap also models writebacks as occupying their target memory banks and the memory bus. In addition, FastCap assumes that writebacks happen in the background, off the critical performance path of the cores.
After issuing a request, the core waits for the memory subsystem to fetch and return the requested cache line before executing future instructions. We denote by the average time core takes to generate a new request after the previous request completes (i.e., data for the previous request is sent back to core , see Figure 2). The term is often called the think time in the literature on closed queuing networks [34]. Further, to model core DVFS, we assume each core can be voltage and frequency scaled independently of the other cores, as in [35, 36]. This translates to a scaled think time: denote by the minimum think time achievable at the maximum core frequency. Thus, the ratio is the frequency scaling factor: setting frequency to the maximum yields . The minimum think time depends on the application running on the corresponding core and may change over time. FastCap takes the minimum think time as an input. Determining the frequency for core is equivalent to determining the think time . We assume there are frequency levels for each core.
We assume the shared last-level cache (L2) sits in a separate voltage domain that does not scale with core frequencies. According to our detailed simulations, changing core frequencies does not significantly change the per-core cache miss rate. Thus, for simplicity, we model the average L2 cache time for each core as independent of the core frequency.
Memory performance. Each of the memory banks serves requests that arrive within its address range. After serving one request, the retrieved data is sent back to the corresponding core through the common bus that is shared by all memory banks. The bus is used in a first-come-first-serve manner: any request that is ready to leave a bank must queue behind all other requests in other banks that finish earlier before it can acquire the bus. Furthermore, each memory bank cannot process the next enqueued request until its current request is transferred to the appropriate core (cf. Figure 1). In queuing-theoretic terminology, this memory subsystem exhibits a “transfer blocking” property [37, 38]. In Figure 1, we illustrate the transfer blocking property via an example.
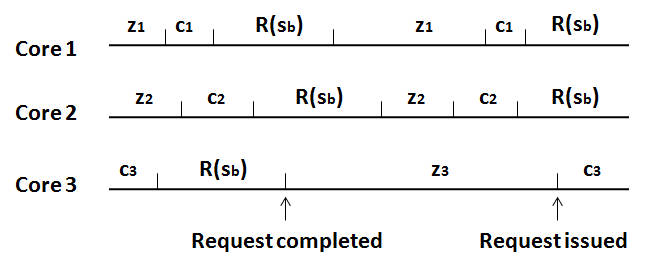
An important performance metric for the memory subsystem is the mean response time, which is the average amount of time a request spends in the memory (cf. Figure. 2). To the best of our knowledge, no closed-form expression exists for the mean response time in a queuing system with the transfer blocking property. Instead of deriving an explicit form for the mean response time, FastCap uses the following approximation.
When a request arrives at a bank, let be the expected number of requests enqueued at the bank (including the newly arrived request). When the request has been processed and is ready to be sent back to the requesting core, let be the expected number of enqueued requests waiting for the bus, including the departing request itself. Denote by the average memory access time at each bank. Denote by the bus transfer time. FastCap approximates the mean response time of the memory subsystem as:
| (1) |
A previous study [11] has found this equation to be a good approximation to the response time of the memory subsystem.
The memory DVFS method is based on MemScale [3], which dynamically adjusts memory controller, bus, and dual in-line memory module (DIMM) frequencies. Although these memory subsystem frequencies are adjusted together, we simplify the discussion by focusing on adjusting only the bus frequency. This translates to a scaled bus transfer time. Denote by the minimum bus transfer time at the maximum bus frequency – the ratio is the bus frequency scaling factor. We assume the bus frequency can take values. In the FastCap algorithm, the minimum bus transfer time is used as an input, and determining a frequency for the memory is equivalent to determining the transfer time .
Power models. Using our detailed simulator (Section IV), we study the power consumption of cores and the main memory serving different workloads. We model the power drawn by core as
| (2) |
where is the maximum voltage/frequency-dependent power consumed by the core, is some exponent typically between 2 and 3, and is the static (voltage/frequency-independent) power the core consumes at all times. At runtime, FastCap periodically recomputes and by using power estimates for core running at different frequencies, and solving the instances of Equation 2 for these parameters. We note that many prior papers e.g. [22, 17] used simple models (e.g., assuming the power is always linearly dependent on the frequency) that do not account well for different workload characteristics.
We model the memory power as
| (3) |
where is the maximum memory power. In practice, we observe that the exponent is close to . This is because we only scale the frequency and not the voltage of the memory bus and DIMMs. The memory also consumes some static power that does not vary with the memory frequency. At runtime, FastCap periodically recomputes and by using power estimates for the memory running at different frequencies, and solving the instances of Equation 3 for the parameters.
We include all the sources of power consumption that do not vary with either core or memory frequencies into a single term . This term includes the static power of all cores , the memory’s static power , the memory controller’s static power, the L2 cache power, and the power consumed by other system components, such as disks and network interfaces.
To study the accuracy of our power model under dynamically changing workloads, we simulate both CPU- and memory-bound jobs and find that the modeling error is less than .
Model discussion. By making represent the time between two consecutive blocking memory accesses, FastCap’s model can easily adapt to out-of-order cores with multiple outstanding misses per core; assuming non-blocking accesses are off the critical path, just as cache writebacks. We discuss our out-of-order implementation in Section IV-B. FastCap can also easily adapt to multiple controllers by considering different response times for different controllers. In this scenario, the probability of each core using each controller (i.e., the access pattern) has to be considered. We defer the discussion of multiple controllers to Section IV-B.
III-B Optimization and algorithm
FastCap’s goal is to maximize the applications’ performance under a full-system power budget. Importantly, FastCap seeks to fairly allocate the budget across the cores (applications) and memory, so that all applications degrade by the same fraction of their maximum performance as a result of the less-than-peak power. Thus, FastCap seeks to prevent “performance outliers”, i.e. applications that get degraded much more than others.
Due to the convenience of the queuing model (cf. Figure 2), we use the time interval between two memory accesses (we call it turn-around time, i.e., ) as the performance metric. Since a certain number of instructions is executed during a given think time , the shorter the turn-around time is, the higher the instruction throughput and thus the better the performance. Based on this metric, we propose the following optimization for FastCap.
| Maximize | (4) | |||
| subject to | (5) | |||
| (6) | ||||
| (7) |
The optimization is over and . The objective is to maximize the performance (or to minimize the performance degradation as much as possible). Constraint 5 specifies that each core’s average turn-around time can only be at most of the minimum average turn-around time for that core. (Recall that a higher turn-around time means lower performance.) To guarantee fairness, we apply the same upper-bound for all cores with respect to their best possible performance (highest core and memory frequencies). Constraint 6 specifies that the total power consumption (core power plus memory power plus system background power) should be no higher than the power budget. The budget is expressed as the peak full-system power multiplied by a given budget fraction . The constraints 7 specify the range of each variable. Since the objective function and each constraint are convex, the optimization problem is convex.
Note that the optimization problem is constrained by the overall system budget. However, it can be extended to capture per-processor power budgets by adding a constraint similar to constraint 6 for each processor.
FastCap solves the optimization problem for and , and then sets each core (memory) frequency to the value that, after normalized to the maximum frequency, is the closest to (). For the cores and memory controller, a change in frequency may entail a change in voltage as well. Thus, the power consumed by each core and memory is always dynamically adjusted based on the applications’ performance needs. The coupling of the objective in line 4 and constraint 5 seeks to minimize the performance degradation of the application that is furthest away from its best possible performance. Since each core has its own minimum turn-around time and the same upper-bound proportion is applied to all cores, we ensure fairness among them and mitigate the performance outlier problem.
The optimization problem can be solved quickly using numerical solvers, such as CPLEX. However, the problem can be solved substantially faster using the following observations.
Theorem 1.
Proof. We first show that constraint 6 must be an equality. Suppose otherwise, then we can always reduce the optimal bus speed such that the performance of each core is improved (because of the decrease in ). As a result, we can achieve a better objective, larger than . This leads to a contradiction. Thus, the power budget constraint must be an equality.
Now, we show that constraint 5 must also be an equality. Suppose otherwise, i.e. there exists a such that constraint 5 is strictly smaller than . Then, we can increase . The power budget saved from this core can be redistributed to other cores that have equalities in constraint 5. As a result, we can achieve an objective that is larger than . This leads to a contradiction as well.
Theorem 1 suggests that the optimal solution must consume the entire power budget and each core must operate at times of its corresponding target. With constraints 5 and 6 as equalities, the optimal think time can be solved in linear time for a given bus time . This is because can be written as
| (8) |
We then substitute Equation 8 into constraint 6, and solve for using the equality condition for constraint 6. Then, all optimal can be computed in linear time using Equation 8.
We can then exhaustively search through possible values for to find the globally optimal solution. However, since the optimization problem is convex, we only need to find a local optimal. Since we can find an optimal solution for each bus transfer time , we can simply perform a binary search across all possible values for to find the local optimal. This results in the algorithm shown in Algorithm 1.
We cannot quantitatively compare FastCap to CoScale [11], as they solve different problems; CoScale would have to be redesigned for power capping. However, we can qualitatively compare how efficiently they explore the possible power mode configurations via their time complexities. CoScale’s complexity is , where is the number of core frequencies, i.e. it scales poorly with the number of cores.
III-C Implementation
Operation. FastCap splits time into fixed-size epochs of several milliseconds each. It collects performance counters from each core into each epoch, and uses them as inputs to the frequency selection algorithm. We call this the profiling phase and find its length enough to capture the latest application behaviors. During the profiling phase, the applications execute normally.
Given the inputs, the OS runs the FastCap algorithm and may transition to new core and/or memory voltage/frequencies for the remainder of the epoch. During a core’s frequency transition, the core does not execute instructions, but other cores can operate normally. To adjust the memory frequency, all memory accesses are temporarily halted, and PLLs and DLLs are re-synchronized. The core and memory transition overheads are small (tens of microseconds), thus negligible compared to the epoch length.
Collecting input parameters. Several key FastCap parameters, such as , , , , the minimum think time , and queue sizes and come directly or indirectly from performance counters. Now, we detail how we obtain the inputs to the algorithm from the counters. To compute , we use
| (9) |
and scale Equation 9 by the ratio between the maximum frequency and the frequency used during profiling. is the Time Per Instruction for core during profiling, is the Total Instructions Executed during profiling, and is the Total Last-level Cache Misses (or number of memory accesses) during profiling. The ratio between and is the average number of instructions executed between two memory accesses.
We obtain , , , and as described when they were first introduced above. FastCap keeps data about the last three frequencies it has seen, and periodically recomputes these parameters.
To obtain and , we use the performance counters proposed by [3]. The counters log the average queue sizes at each memory bank and bus. We obtain by taking the average queue size across all banks. We obtain directly from the corresponding counter.
To obtain , we take the average memory access time at each bank during the profiling phase. The minimum bus transfer time is a constant and, since each request takes a fixed number of cycles to be transferred on the bus (the exact number depends on the bus frequency), we simply divide the number of cycles by the maximum memory frequency to obtain .
All background power draws (independent of core/memory frequencies or workload) can be measured and/or estimated statically.
| Feature | Value | |
| CPU cores | in-order, single thread, 4GHz | |
| Single IALU IMul FpALU | ||
| FpMulDiv | ||
| L1 I/D cache (per core) | 32KB, 4-way, 1 CPU cycle hit | |
| L2 cache (shared) | 16MB, -way, 30 CPU cycle hit | |
| Cache block size | 64 bytes | |
| Memory configuration | 4 DDR3 channels for 16/32 cores | |
| 8 DDR3 channels for cores | ||
| 8 2GB ECC DIMMs | ||
| Time | tRCD, tRP, tCL | 15ns, 15ns, 15ns |
| tFAW | 20 cycles | |
| tRTP | 5 cycles | |
| tRAS | 28 cycles | |
| tRRD | 4 cycles | |
| Refresh period | 64ms | |
| Current | Row buffer | 250 (read), 250 (write) mA |
| Pre-chrg | 120 mA | |
| Active standby | 67 mA | |
| Active pwrdown | 45 mA | |
| Pre-chrg standby | 70 mA | |
| Pre-chrg pwrdown | 45 mA | |
| Refresh | 240 mA | |
| Name | MPKI | WPKI | Applications ( each) | |||
|---|---|---|---|---|---|---|
| ILP1 | 0.37 | 0.06 | vortex | gcc | sixtrack | mesa |
| ILP2 | 0.16 | 0.03 | perlbmk | crafty | gzip | eon |
| ILP3 | 0.27 | 0.07 | sixtrack | mesa | perlbmk | crafty |
| ILP4 | 0.25 | 0.04 | vortex | gcc | gzip | eon |
| MID1 | 1.76 | 0.74 | ammp | gap | wupwise | vpr |
| MID2 | 2.61 | 0.89 | astar | parser | twolf | facerec |
| MID3 | 1.00 | 0.60 | apsi | bzip2 | ammp | gap |
| MID4 | 2.13 | 0.90 | wupwise | vpr | astar | parser |
| MEM1 | 18.22 | 7.92 | swim | applu | galgel | equake |
| MEM2 | 7.75 | 2.53 | art | milc | mgrid | fma3d |
| MEM3 | 7.93 | 2.55 | fma3d | mgrid | galgel | equake |
| MEM4 | 15.07 | 7.31 | swim | applu | sphinx3 | lucas |
| MIX1 | 2.93 | 2.56 | applu | hmmer | gap | gzip |
| MIX2 | 2.55 | 0.80 | milc | gobmk | facerec | perlbmk |
| MIX3 | 2.34 | 0.39 | equake | ammp | sjeng | crafty |
| MIX4 | 3.62 | 1.20 | swim | ammp | twolf | sixtrack |
III-D Hardware and software costs
FastCap requires no architectural or software support beyond that in [11]. Specifically, core DVFS is widely available in commodity hardware. Existing DIMMs support multiple frequencies and can switch among them by transitioning to powerdown or self-refresh states [39], although this capability is typically not used by current servers. Integrated CMOS memory controllers can leverage existing DVFS technology. One needed change is for the memory controller to have separate voltage and frequency control from other processor components. In recent Intel architectures, this would require separating shared cache and memory controller voltage control. In terms of software, the OS must periodically invoke FastCap and collect several performance counters.
IV Evaluation
IV-A Methodology
Simulation infrastructure. We adopt the infrastructure used in [11]. We assume per-core DVFS, with 10 equally-spaced frequencies in the range 2.2-4.0 GHz. We assume a voltage range matching Intel’s Sandybridge, from 0.65 V to 1.2 V, with voltage and frequency scaling proportionally, which matches the behavior we measured on an i7 CPU. We scale memory controller frequency and voltage, but only frequency for the memory bus and DRAM chips. The on-chip 4-channel memory controller has the same voltage range as the cores, and its frequency is always double that of the memory bus. We assume that the bus and DRAM chips may be frequency-scaled from 800 MHz to 200 MHz, with steps of 66 MHz. The infrastructure simulates in detail the aspects of cores, caches, memory controller, and memory devices that are relevant to our study, including memory device power and timing, and row buffer management. Table II lists our default simulation settings.
We model the power for the non-CPU, non-memory components as a fixed 10 W. Under our baseline assumptions, at maximum frequencies, the CPU accounts for roughly 60%, the memory subsystem 30%, and other components 10% of system power.
Workloads. We construct the workloads by combining applications from the SPEC 2000 and SPEC 2006 suites. We group them into the same mixes as [3, 40]. The workload classes are: memory-intensive (MEM), compute-intensive (ILP), compute-memory balanced (MID), and mixed (MIX, one or two applications from each other class). We run the best 100M-instruction simulation point for each application (selected using Simpoints 3.0). A workload terminates when its slowest application has run 100M instructions. Table III describes the workloads and the L2 misses per kilo-instruction (MPKI) and writebacks per kilo-instruction (WPKI) for . We execute copies of each application to occupy all cores.
IV-B Results
We first run all workloads under the maximum frequencies to observe the peak power the system ever consumed. We observe the peak power to be 60 Watts for 4 cores, 120 Watts for 16 cores, 210 Watts for 32 cores, and 375 Watts for 64 cores. By default, we present results for a 16-core system in which FastCap is called every . (The epoch length matches a common OS time quantum.) We study different epoch lengths in later sections.
Power consumption. We first evaluate FastCap under a 60% power budget fraction, i.e. in Equation 6 equals 60%. Figure 3 shows the average power spent by FastCap running each workload on the 16-core system. FastCap successfully maintains overall system power just under 60% of the peak power.
These are overall execution averages and do not illustrate the dynamic behavior of FastCap. To see an example of this behavior, in Figure 4, we show the breakdown of a 60% full-system power budget between the power consumed by the cores and by the memory subsystem for workload MIX3, as a function of epoch number. The figure shows that FastCap reacts to workload changes by quickly repartitioning the full-system power budget.
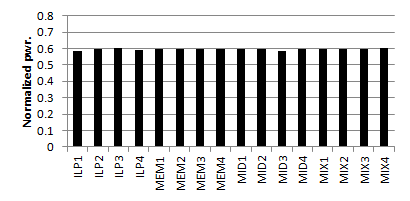
Although occasionally the average power may exceed the budget due to workload changes, FastCap always maintains the power near the budget. As previous papers (e.g., [14, 41]) have discussed, exceeding the budget for short periods is not a problem because the power supply infrastructure can easily handle these violations.
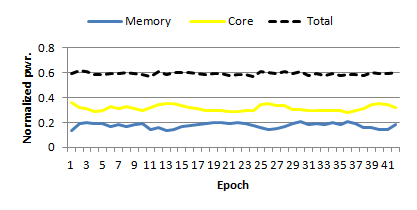
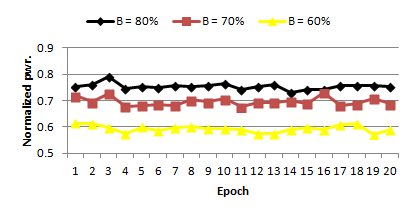
Figure 5 shows the FastCap behavior for 3 budgets (as a fraction of the full-system peak power) for the MEM3 workload, as a function of epoch number. The figure shows that FastCap corrects budget violations very quickly (within 10ms), regardless of the budget. Note that MEM3 exhibits per-epoch average powers somewhat lower than the cap for . This is because memory-bound workloads do not consume 80% of the peak power, even when running at the maximum core and memory frequencies.
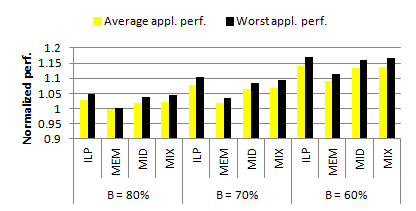
Application performance. Recall that, under tight power budgets, FastCap seeks to achieve similar (percent) performance losses compared to using maximum frequencies for all applications. So, where we discuss a performance loss below, we are referring to the performance degradation (compared to the run with maximum frequencies) due to power capping, and not to the absolute performance.
Figure 6 shows the average and worst application performance (in cycles per instruction or CPI) normalized to the baseline system (maximum core and memory frequencies) for all ILP, MEM, MID and MIX workloads. The higher the bar, the worse the performance is compared to the baseline. For each workload class, we compute the average and worst application performance across all applications in workloads of the class. For example, the ILP average performance is the average CPI of all applications in ILP1, ILP2, ILP3 and ILP4, whereas the worst performance is the highest CPI among all applications in these workloads. In the figure, values above 1 represent the percentage application performance loss.
This figure shows that the worst application performance differs only slightly from the average performance. This result shows that FastCap is fair in its (performance-aware) allocation of the power budget to applications. The figure also shows that the performance of memory-bound workloads (MEM) tends to degrade less than that of CPU-bound workloads (ILP) under the same power budget. This is because the MEM workloads usually consume less full-system power than their ILP counterparts. Thus, for the same power budget, the MEM workloads require smaller frequency reductions, and thus exhibit smaller percentage performance losses.
Core/memory frequencies. Figure 7 plots the frequencies (in GHz) selected by FastCap for the core running application vortex in workload ILP1, swim in MEM1, and swim in MIX4. Figure 8 plots the memory frequencies (in MHz) selected by FastCap when the 16-core system is running workloads ILP1, MEM1, and MIX4.
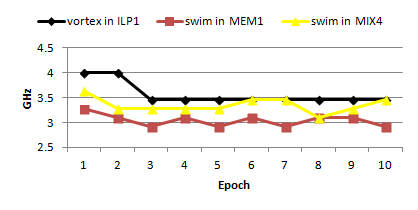
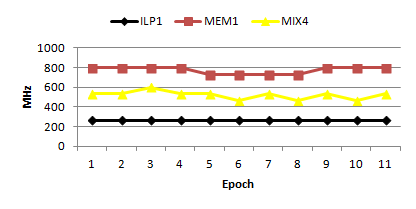
In the CPU-bound workload ILP1, the cores run at high frequency while the memory runs at low frequency as expected. In the memory-bound workload MEM1, the cores run at low frequency while the memory runs at high frequency again as expected. In workload MIX4, which consists of both CPU- and memory-bound applications, memory frequencies are in the middle of the range. Interestingly, FastCap selects higher core frequencies for the core running the swim application in MIX4 than in MEM1. This is because in MIX4, the memory is not as busy as in MEM1, and thus can slow down to enable higher power draws for the CPU-bound cores. As a result, the core running swim in MIX4 has to run faster to compensate for the performance loss due to the slower memory subsystem. Since the memory power is larger than the individual core power, sometimes it is desirable to slow down the memory and compensate by running one or more cores faster.
FastCap compared with others policies. We now compare FastCap against other power capping policies. All policies are capable of controlling the power consumption around the budget, so we focus mostly on their performance implications. We first compare against policies that do not use memory DVFS:
-
•
CPU-only. This policy sets the core frequencies using the FastCap algorithm for every epoch, but keeps the memory frequency fixed at the maximum value. The comparison to CPU-only isolates the impact of being able to manage memory subsystem power using DVFS. All prior power capping policies suffer from the lack of this capability.
-
•
Freq-Par. This is a control-theoretic policy from [22]. In Freq-Par, the core power is adjusted in every epoch based on a linear feedback control loop; each core receives a frequency allocation that is based on its power efficiency. Freq-Par uses a linear power-frequency model to correct the average core power from epoch to epoch. We again keep the memory frequency fixed at the maximum value.

Figure 9 shows the performance comparison between FastCap and these policies on a 16-core system. FastCap performs at least as well as CPU-only in both average and worst application performance, showing that the ability to manage memory power is highly beneficial. Setting memory frequency at the maximum causes the cores to run slower for CPU-bound applications, in order to respect the power budget. This leads to severe performance degradation in some cases. For the MEM workloads, FastCap and CPU-only perform almost the same, as the memory subsystem can often be at its maximum frequency in FastCap to minimize performance loss within the power budget. Still, it is often beneficial to change the power balance between cores and memory, as workloads change phases. FastCap is the only policy that has the ability to do so.
The comparison against Freq-Par is more striking. FastCap (and CPU-only) performs substantially better than Freq-Par in both average and worst application performance. In fact, Freq-Par shows significant gaps between these types of performance, showing that it does not allocate power fairly across applications (inefficient cores receive less of the overall power budget). Moreover, Freq-Par’s linear power-frequency model can be inaccurate and causes the feedback control to over-correct and under-correct often. This leads to severe power oscillation, although the long-term average is guaranteed by the control stability. For example, the power oscillates between 53% and 65% under Freq-Par for MIX3.
Next, we study policies that use DVFS for both cores and the memory subsystem. These policies are inspired by prior works, but we add FastCap’s ability to manage memory power to them:
-
•
Eql-Pwr. This policy assigns an equal share of the overall power budget to all cores, as proposed in [16]. We implement it as a variant of FastCap: for each memory frequency, we compute the power share for each core by subtracting the memory power (and the background power) from the full-system power budget and dividing the result by . Then, we set each core’s frequency as high as possible without violating the per-core budget. For each epoch, we search through all memory frequencies, and use the solution that yields the best in Equation 4.
- •
-
•
MaxBIPS. This policy was proposed in [14]. Its goal is to maximize the total number of executed instructions in each epoch, i.e. to maximize the throughput. To solve the optimization, [14] exhaustively searches through all core frequency settings. We implement this search to evaluate all possible combinations of core and memory frequencies within the power budget.
Eql-Pwr ignores the heterogeneity in the applications’ power profiles. By splitting the core power budget equally, some applications receive too much budget and even running at the maximum frequency cannot fully consume it. Meanwhile, some power-hungry applications do not receive enough budget thus result in performance loss. This is most obvious in workloads with a mixture of CPU-bound and memory-bound applications (e.g., MIX4). As a result, we observe in Figure 9 that Eql-Pwr’s worst application performance loss is often much higher than FastCap’s.
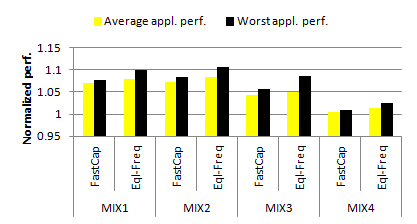
Eql-Freq also ignores application heterogeneity. In Eql-Freq, having all core frequencies locked together means that some applications may be forced to run slowly, because raising all frequencies to the next level may violate the power budget. This is a more serious problem when the workload consists of a mixture of CPU- and memory-bound applications on a large number of cores. To see this, Figure 10 plots the normalized average and worst application performance for FastCap and Eql-Freq, when running the MIX workloads on a 64-core system. The figure shows that Eql-Freq is more conservative than FastCap and often cannot fully harvest the power budget to improve performance.
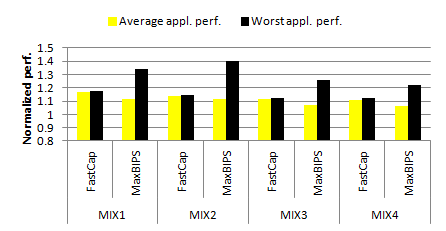
Finally, besides its use of exhaustive search, the main problem of MaxBIPS is that it completely disregards fairness across applications. Figure 11 compares the normalized average and worst application performance for the MIX workloads under a 60% budget. Because of the high overhead of MaxBIPS, the figure shows results for only 4-core systems. The figure shows that FastCap is slightly inferior in average application performance, as MaxBIPS always seeks the highest possible instruction throughput. However, FastCap achieves significantly better worst application performance and fairness. To maximize the overall throughput, MaxBIPS may favor applications that are more power-efficient, i.e. have higher throughput at a low power cost. This reduces the power allocated to other applications and the outlier problem occurs. This is particularly true for workloads that consists of a mixture of CPU and memory-bound applications.
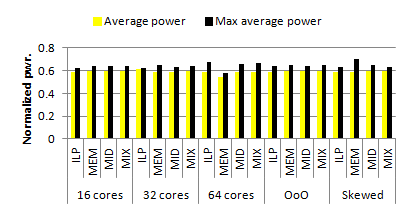
Impact of number of cores. Figure 12 depicts pairs of bars for each workload class on systems with 16, 32, and 64 cores, under a 60% power budget. The bar on the right of each pair is the maximum average power of any epoch of any application of the same class normalized to the peak power, whereas the bar on the left is the normalized average power for the workload with the maximum average power. Comparing these bars determines whether FastCap is capable of respecting the budget even when there are a few epochs with slightly higher average power. The figure clearly shows that FastCap is able to do so (all average power bars are at or slightly below 60%), even though increasing the number of cores does increase the maximum average power slightly. This effect is noticeable for workloads that have CPU-bound applications on 64 cores. In addition, note that the MEM workloads do not reach the maximum budget on 64 cores, as these workloads do not consume the power budget on this large system even when they run at maximum frequencies.
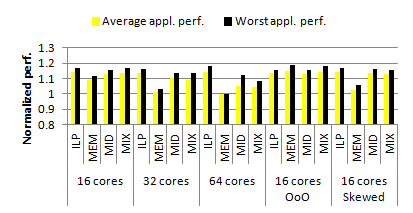
Figure 13 also shows pairs of bars for each workload class under the same assumptions. This time, the bar on the right of each pair is the normalized worst performance among all applications in a class, and the bar on the left is the normalized average performance of all applications in the class. The figure shows that FastCap is very successful at allocating power fairly across applications, regardless of the number of cores; the worst application performance is always only slightly worse than the average performance.
Epoch length and algorithm overhead. By default, FastCap runs at the end of every OS time quantum ( in our experiments so far). The overhead of FastCap scales linearly with the number of cores. Specifically, we run the FastCap algorithm for times and collect the average time of each execution. The average time is for cores, for cores and for cores. For a epoch length, these overheads are 0.7%, 1.3%, and of the epoch lengths, respectively. If these levels of overhead are unacceptable, FastCap can execute at a coarser granularity. Using our simulator, we studied epoch lengths of and . We find that these epoch lengths do not affect FastCap’s ability to control average power and performance for the applications and workloads we consider.
Out-of-order (OoO) execution. Our results so far have assumed in-order cores and FastCap can be easily extended to handle the OoO executions. In FastCap’s terminology, the think time thus becomes the interval between two core stalls (not between two main memory accesses). The workload becomes more CPU-bound.
We simulate idealized OoO executions by assuming a large instruction window (128 entries) and disregarding instruction dependencies within the window. This models an upper-bound on the memory-level parallelism (and has no impact on instruction-level parallelism, since we still simulate a single-issue pipeline).
Figure 12 shows four pairs of bars for the OoO executions of the workload classes on 16 cores and under a 60% power budget. The results can be compared to the bars for 16 cores on the left side of the figure. This comparison shows that FastCap is equally successful at limiting the power draw to the budget, regardless of the processor execution mode.
Similarly, Figure 13 shows four pairs of bars for OoO executions on 16 cores, under a 60% budget. These performance loss results can also be compared to those for 16 cores on the left of this figure. The comparison shows that workloads with memory-bound applications tend to exhibit higher performance losses in OoO execution mode. The reason is that the performance of these applications improves significantly at maximum frequencies, as a result of OoO; both cores and memory become more highly utilized. When FastCap imposes a lower-than-peak budget, frequencies must be reduced and performance suffers more significantly. Directly comparing frequencies across the execution modes, we find that memory-bound workloads tend to exhibit higher core frequencies and lower memory frequency under OoO than under in-order execution. This result is not surprising since the memory can become slower in OoO without affecting performance because of the large instruction window. Most importantly, FastCap is still able to provide fairness in power allocation in OoO, as the performance losses are roughly evenly distributed across all applications.
Multiple memory controllers. For FastCap to support multiple memory controllers (operating at the same frequency), we use the existing performance counters to keep track of the average queue sizes and of each memory controller. Thus, different memory controllers can have different response times (cf. Equation 1). We also keep track of the probability of each core’s requests going through each memory controller. In this approach, the response time in Equation 5 becomes a weighted average across all memory controllers and different cores experience different response times.
To study the impact of multiple memory controllers, we simulate four controllers in our 16-core system. In addition, we simulate two memory interleaving schemes: one in which the memory accesses are uniformly distributed across memory controllers, and one in which the distribution is highly skewed.
Figure 12 shows four pairs of bars for the skewed distribution on 16 cores, under a 60% budget. Compare these results to the 16-core data on the left side of the figure. The skewed distribution causes higher maximum power in the MEM workloads. Still, FastCap is able to keep the average performance for the workload with this maximum power slightly below the 60% budget.
Again, Figure 13 shows four pairs of the skewed distribution on 16 cores, under a 60% budget. We can compare these performance losses to the 16-core data on the left of the figure. The comparison shows that FastCap provides fair application performance even under multiple controllers with highly skewed access distributions.
V Conclusion
In this paper we presented FastCap, an optimization framework and algorithm for system-wide power capping, using both CPU and memory DVFS, while promoting fairness across applications. The FastCap algorithm solves the optimization online and its complexity is the lowest among some of the state-of-the-arts. Our evaluation showed that FastCap caps power draw effectively, while producing better application performance and fairness than many sophisticated CPU power capping methods, even after they are extended to use of memory DVFS as well.
Acknowledgements
We would like to thank the anonymous reviewers for suggestions that helped improve the paper. This work was funded in part by NSF grant CCF-1319755. The work of Yanpei Liu was partially supported by a visitor grant from DIMACS, funded by the National Science Foundation under grant numbers CCF-1144502 and CNS-0721113.
References
- [1] H. David, C. Fallin, E. Gorbatov, U. Hanebutte, and O. Mutlu, “Memory Power Management via Dynamic Voltage/Frequency Scaling,” in ICAC, 2011.
- [2] Q. Deng, D. Meisner, A. Bhattacharjee, T. F. Wenisch, and R. Bianchini, “MultiScale: Memory System DVFS with Multiple Memory Controllers,” in ISLPED, 2012.
- [3] Q. Deng, D. Meisner, L. Ramos, T. F. Wenisch, and R. Bianchini, “MemScale: Active Low-Power Modes for Main Memory,” in ACM ASPLOS, 2011.
- [4] E. V. Carrera, E. Pinheiro, and R. Bianchini, “Conserving Disk Energy in Network Servers,” in ACM ICS, 2003.
- [5] S. Gurumurthi, A. Sivasubramaniam, M. Kandemir, and H. Franke, “DRPM: Dynamic Speed Control for Power Management in Server Class Disks,” in IEEE/ACM, 2003.
- [6] D. Abts, M. R. Marty, P. M. Wells, P. Klausler, and H. Liu, “Energy Proportional Datacenter Networks,” in IEEE/ACM ISCA, 2010.
- [7] Y. Liu, S. C. Draper, and N. S. Kim, “SleepScale: runtime joint speed scaling and sleep states management for power efficient data centers,” in IEEE/ACM ISCA, 2014.
- [8] Y. Liu, S. C. Draper, and N. S. Kim, “Queuing theoretic analysis of power-performance tradeoff in power-efficient computing,” in IEEE CISS, 2013.
- [9] A. Vega, A. Buyuktosunoglu, H. Hanson, P. Bose, and S. Ramani, “Crank it up or dial it down: coordinated multiprocessor frequency and folding control,” in IEEE/ACM MICRO, 2013.
- [10] D. Meisner, C. M. Sadler, L. A. Barroso, W.-D. Weber, and T. F. Wenisch, “Power Management of Online Data-Intensive Services,” in IEEE/ACM ISCA, 2011.
- [11] Q. Deng, D. Meisner, A. Bhattacharjee, T. F. Wenisch, and R. Bianchini, “CoScale: Coordinating CPU and Memory DVFS in Server Systems,” in IEEE/ACM MICRO, 2012.
- [12] L. A. Barroso, J. Clidaras, and U. Holzle, The Datacenter as a Computer: An Introduction to the Design of Warehouse-Scale Machines. second ed., 2013.
- [13] D. Wang, C. Ren, and A. Sivasubramaniam, “Virtualizing Power Distribution in Datacenters,” in IEEE/ACM ISCA, 2013.
- [14] C. Isci, A. Buyuktosunoglu, C.-Y. Cher, P. Bose, and M. Martonosi, “An Analysis of Efficient Multi-Core Global Power Management Policies: Maximizing Performance for a Given Power Budget,” in IEEE/ACM MICRO, 2006.
- [15] P. Bose, A. Buyuktosunoglu, J. A. Darringer, M. S. Gupta, M. B. Healy, H. Jacobson, I. Nair, J. A. Rivers, J. Shin, A. Vega, and A. J. Weger, “Power Management of Multi-Core Chips: Challenges and Pitfalls,” in IEEE DATE, 2012.
- [16] J. Sharkey, A. Buyuktosunoglu, and P. Bose, “Evaluating Design Tradeoffs in On-Chip Power Management for CMPs,” in ISLPED, 2007.
- [17] R. Teodorescu and J. Torrellas, “Variation-Aware Application Scheduling and Power Management for Chip Multiprocessors,” in IEEE/ACM ISCA, 2008.
- [18] K. Meng, R. Joseph, R. P. Dick, and L. Shang, “Multi-Optimization Power Management for Chip Multiprocessors,” in ACM PACT, 2008.
- [19] J. A. Winter, D. H. Albonesi, and C. A. Shoemaker, “Scalable Thread Scheduling and Global Power Management for Heterogeneous Many-Core Architectures,” in ACM PACT, 2010.
- [20] R. Bergamaschi, G. Han, A. Buyuktosunoglu, H. Patel, and I. Nair, “Exploring Power Management in Multi-Core Systems,” in IEEE DAC, 2008.
- [21] A. K. Mishra, S. Srikantaiah, M. Kandemir, and C. R. Das, “CPM in CMPs: Coordinated Power Management in Chip Multiprocessors,” in IEEE SC, 2010.
- [22] K. Ma, X. Li, M. Chen, and X. Wang, “Scalable Power Control for Many-Core Architectures Running Multi-Threaded Applications,” in IEEE/ACM ISCA, 2011.
- [23] M. Chen, X. Wang, and X. Li, “Coordinating Processor and Main Memory for Efficient Server Power Control,” in ACM ICS, 2011.
- [24] K. Shen, A. Shriraman, S. Dwarkadas, X. Zhang, and Z. Chen, “Power Containers: An OS Facility for Fine-Grained Power and Energy Management on Multicore Servers,” in ACM ASPLOS, 2013.
- [25] R. Ge, X. Feng, W. chun Feng, and K. Cameron, “Cpu miser: A performance-directed, run-time system for power-aware clusters,” in Parallel Processing, 2007. ICPP 2007. International Conference on, pp. 18–18, Sept 2007.
- [26] O. Sarood, A. Langer, A. Gupta, and L. Kale, “Maximizing throughput of overprovisioned hpc data centers under a strict power budget,” in Proceedings of the International Conference for High Performance Computing, Networking, Storage and Analysis, pp. 807–818, 2014.
- [27] H. Sasaki, S. Imamura, and K. Inoue, “L1-bandwidth aware thread allocation in multicore smt processors,” in Parallel Architectures and Compilation Techniques (PACT), 2013 22nd International Conference on, pp. 123–132, Sept 2013.
- [28] K. Ma, X. Wang, and Y. Wang, “Dppc: Dynamic power partitioning and capping in chip multiprocessors,” in Computer Design (ICCD), 2011 IEEE 29th International Conference on, pp. 39–44, Oct 2011.
- [29] S. S. Jha, W. Heirman, A. Falcón, T. E. Carlson, K. Van Craeynest, J. Tubella, A. González, and L. Eeckhout, “Chrysso: An integrated power manager for constrained many-core processors,” in Proceedings of the 12th ACM International Conference on Computing Frontiers, pp. 19:1–19:8, 2015.
- [30] X. Wang, B. Zhao, T. Mak, M. Yang, Y. Jiang, M. Daneshtalab, and M. Palesi, “Adaptive power allocation for many-core systems inspired from multiagent auction model,” in Design, Automation and Test in Europe Conference and Exhibition (DATE), 2014, pp. 1–4, March 2014.
- [31] R. Cochran, C. Hankendi, A. K. Coskun, and S. Reda, “Pack & Cap: Adaptive DVFS and Thread Packing Under Power Caps,” in IEEE/ACM MICRO, 2011.
- [32] P. Petrica, A. M. Izraelevitz, and C. A. Shoemaker, “Flicker: A Dynamically Adaptive Architecture for Power Limited Multicore Systems,” in IEEE/ACM ISCA, 2013.
- [33] T. S. Muthukaruppan, A. Pathania, and T. Mitra, “Price Theory Based Power Management for Heterogeneous Multi-Cores,” in ACM ASPLOS, 2014.
- [34] M. Harchol-Balter, Performance Modeling and Design of Computer Systems: Queueing Theory in Action. Cambridge University Press, 2013.
- [35] W. Kim, M. S. Gupta, G.-Y. Wei, and D. Brooks, “System Level Analysis of Fast, Per-Core DVFS Using On-Chip Switching Regulators,” in HPCA, 2008.
- [36] G. Yan, Y. Li, Y. Han, X. Li, M. Guo, and X. Liang, “AgileRegulator: A Hybrid Voltage Regulator Scheme Redeeming Dark Silicon for Power Efficiency in a Multicore Architecture,” in IEEE HPCA, 2012.
- [37] I. Akyildiz, “On the Exact and Approximate Throughput Analysis of Closed Queuing Networks with Blocking,” IEEE Transactions on Software Engineering, vol. 14, no. 1, 1988.
- [38] S. Balsamo, V. D. N. Persone, and R. Onvural, Analysis of Queuing Networks with Blocking. 2001.
- [39] JEDEC, “DDR3 SDRAM Standard,” 2009.
- [40] H. Zheng, J. Lin, Z. Zhang, and Z. Zhu, “Decoupled DIMM: Building High-Bandwidth Memory System Using Low-Speed DRAM Devices,” in IEEE/ACM ISCA, 2009.
- [41] C. Lefurgy, X. Wang, and M. Ware, “Power Capping: A Prelude to Power Shifting,” Cluster Computing, vol. 11, no. 2, 2008.
- [42] S. Herbert and D. Marculescu, “Analysis of Dynamic Voltage/Frequency Scaling in Chip-Multiprocessors,” in ISLPED, 2007.